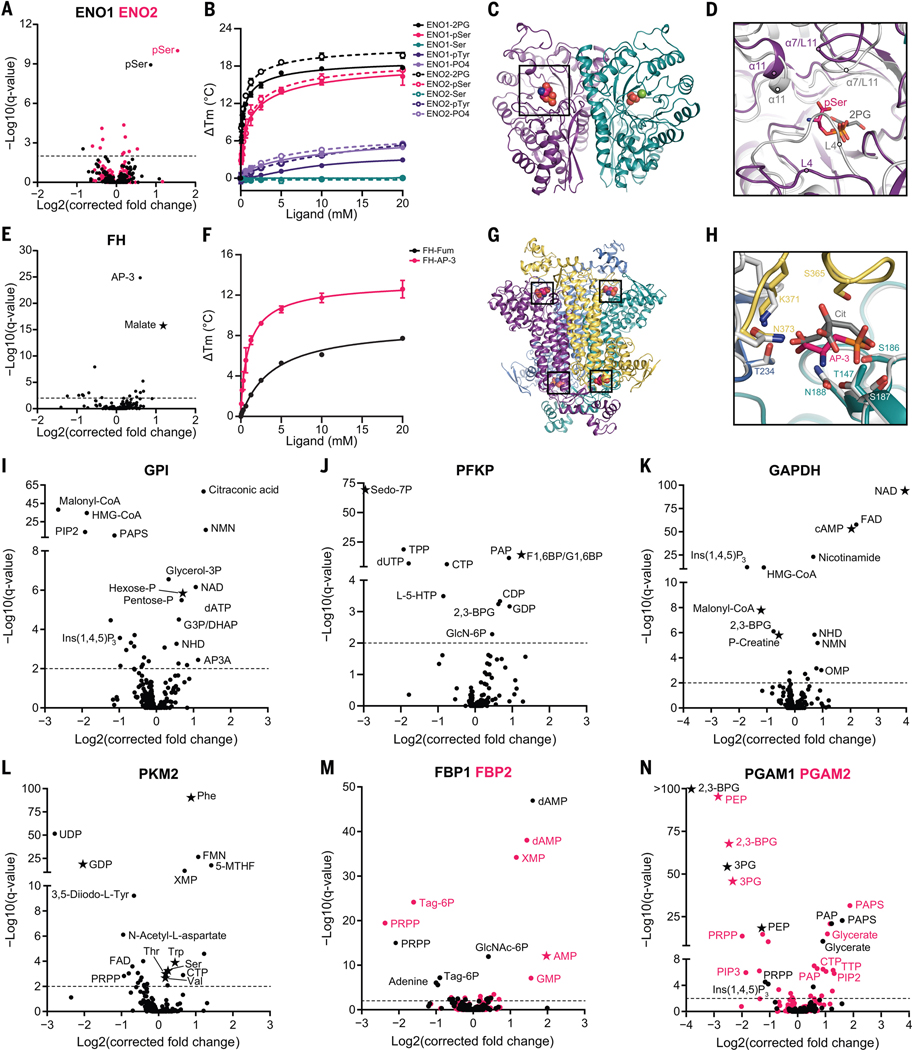
Fig. 3. MIDAS identifies known and previously undescribed metabolite interactions with enzymes from human carbohydrate metabolism.
(A) Volcano plot of MIDAS metabolite interactions with ENO1 (black) and ENO2 (pink). (B) Ligand-induced DSF melting point analysis of ENO1 (solid lines, solid circles) and ENO2 (dotted lines, open circles) with 2PG (black), pSer (pink), serine (Ser; teal), phosphotyrosine (pTyr; purple), and phosphate (PO4; light purple). (C) X-ray crystal structure of the pSer-ENO2 complex [Protein Data Bank (PDB) ID: 7MBH]. pSer (black box), phosphate ions (orange and red spheres), magnesium ion (green sphere), and monomers within the ENO2 dimer (purple and teal) are displayed. (D) Magnified view of the ENO2 active site with pSer (pink) or 2PG (gray) bound (2PG-ENO2; PDB: 3UCC) (53). Secondary structure is labeled in the pSer-ENO2 (purple) and 2PG-ENO2 (light gray) costructures. (E) Volcano plot of MIDAS metabolite interactions with fumarase (FH). (F) Ligand-induced DSF melting point analysis of FH with fumarate (Fum; black) and AP-3 (pink). [(B) and (F)] Line of best fit was determined from triplicate experiments, each with sextuplicate technical replicates using the specific binding and Hill slope equation from GraphPad Prism 9. Means ± SDs are plotted from triplicate experiments. (G) X-ray crystal structure of the AP-3–FH complex (PDB: 7LUB). AP-3 (black boxes) and monomers within the FH tetramer (purple, yellow, teal, and light blue) are shown. (H) Magnified view of the FH active site with AP-3 (pink) or citrate (Cit; gray) bound (Escherichia coli Cit-FH structure, light gray; PDB: 1FUO) (18). Side chains that coordinate the AP-3 interaction with FH are labeled and colored according to FH monomers from (G). (I to N) Volcano plots of MIDAS metabolite interactions with GPI; 6-phosphofructokinase, platelet type (PFKP); GAPDH; PKM2; FBP1 (black) and FBP2 (pink); and PGAM1 (black) and PGAM2 (pink). [(A), (E), and (I) to (N)] Stars indicate a previously known human PMI primarily sourced from BRENDA (https://www.brenda-enzymes.org/index.php). MIDAS analysis of all proteins was performed by triplicate equilibrium dialysis and technical triplicate FIA-MS injections. Specific, significant PMIs identified by MIDAS are labeled (see table S1 for metabolite abbreviations). Significant PMIs have a Q < 0.01 (dotted line). Single-letter abbreviations for the amino acid residues are as follows: A, Ala; C, Cys; D, Asp; E, Glu; F, Phe; G, Gly; H, His; I, Ile; K, Lys; L, Leu; M, Met; N, Asn; P, Pro; Q, Gln; R, Arg; S, Ser; T, Thr; V, Val; W, Trp; and Y, Tyr.

