

Abstract
Many disordered proteins conserve essential functions in the face of extensive sequence variation, making it challenging to identify the mechanisms responsible for functional selection. Here, we identify the molecular mechanism of functional selection for the disordered adenovirus early gene 1A (E1A) protein. E1A competes with host factors to bind the retinoblastoma (Rb) protein, subverting cell cycle regulation. We show that two binding motifs tethered by a hypervariable disordered linker drive picomolar affinity Rb binding and host factor displacement. Compensatory changes in amino acid sequence composition and sequence length lead to conservation of optimal tethering across a large family of E1A linkers. We refer to this compensatory mechanism as conformational buffering. We also detect co-evolution of the motifs and linker, which can preserve or eliminate the tethering mechanism. Conformational buffering and motif-linker coevolution explain robust functional encoding within hypervariable disordered linkers and could underlie functional selection of many disordered protein regions.
INTRODUCTION
Intrinsically disordered proteins and protein regions (IDRs) [1,2] use short linear motifs (SLiMs) to bind cellular partners. These conserved interaction modules play essential roles in cell biology [3]. In contrast, the regions connecting SLiMs often have lower sequence conservation and a high frequency of insertions and deletions [4]. Under the classical structure-function paradigm, these features indicate weak evolutionary restraints, leading to the view that these IDRs might play the roles of passive “spacers”, stringing together ordered domains and disordered SLiMs. However, recent progress in the quantitative description of sequence-ensemble relationships (SERs) in IDR conformations [5] indicates that specific features in these less conserved regions are required for function [6,7,8,9]. The fact that IDRs with different sequence characteristics have conserved SERs that are responsible for function [10], suggests that SERs are under natural selection. There is growing evidence that IDRs which function as flexible tethers that physically join ordered domains and/or disordered SLiMs fall into this category [11,12,13].
Tethering is essential for kinase signaling [8,14,15], gene silencing [7], enzyme catalysis [16], transcriptional regulation [13,17,18] and the formation of biomolecular condensates [9,19]. Tethering allows intra- or intermolecular coupling between ordered domains and/or SLiMs [20]. This coupling can increase the effective concentrations of interacting partners [21], and relatively simple polymer models such as the Worm Like Chain (WLC) [22,23,24] can estimate the affinity enhancement from tethering [22,25,26,12]. An emerging hypothesis is that SERs that encode IDR dimensions -as determined by sequence length, composition and patterning- [27,28,29,30,5] play an important role in tethered interactions by determining the effective concentrations of binding modules around binding partners either in cis or in trans [12,13,31,32,16,33]. This leads to the expectation that evolutionary pressure will preserve these dimensions in spite of large-scale sequence variation. However, the lack of a well-defined model system in which molecular function is unambiguously conserved in the face of a hypervariable tether has hampered the ability to test this hypothesis.
In order to establish a model system for quantitatively understanding tethering mechanisms and their evolution, we chose the intrinsically disordered adenovirus early region 1A (E1A) protein. Viruses are under constant selection pressure from a changing environment, and many viral proteins utilize protein disorder to acquire novel traits [34,35,36,37,38]. This makes them robust as model systems to investigate functional selection of IDRs. E1A is a multifunctional signaling hub that employs multiple SLiMs [36,37,38] tethered by disordered linkers to hijack cell signaling [39]. Here we test the central hypothesis that conserved SERs drive functional selection of the disordered E1A protein. Our results demonstrate that IDRs with dramatic changes in the linear sequence have a conserved tethering function. We also found evidence for compensatory co-evolution between disordered tethers and SLiMs. Taken together, our findings have broad implications for understanding IDR function and evolution.
MAIN TEXT
Tethering enhances Rb binding and promotes E2F displacement
The subversion of cell cycle regulation by E1A involves essential interactions with the retinoblastoma (Rb) tumor suppressor, which displaces E2F transcription factors, triggering S-phase entry and viral genome replication (Fig. 1a, b). To identify the molecular mechanisms responsible for E2F displacement, we performed detailed structural and biophysical binding studies using the central RbAB domain of Rb (hereafter referred to as Rb) and the minimal Rb binding region from the adenovirus E1A protein (hereafter referred to as E1AWT). Rb contains the binding sites for the E2F and LxCxE SLiMs [40,41] and E1AWT harbors the E1AE2F and E1ALxCxE SLiMs [42] connected by a 71-residue disordered linker [43]. This linker contains additional SLiMs for the CREB binding protein (CBP) TAZ2 domain [43] and the BS69 transcriptional repressor MYND domain [39], which mediate the formation of ternary complexes [44] (Fig.1b).
FIGURE 1. Tethering is required for high affinity Rb binding and E2F displacement by E1A.

a) Model for disruption of the repressive Rb-E2F complex by E1A. b) Schematic representation of E1A and E2F2 constructs used in this study. Color coding for the E2F, LxCxE, TAZ2 and MYND SLiMs, the acidic stretch and S132 phosphorylation are maintained throughout figures. c) Representative interactions tested using fluorescence spectroscopy (Extended Data Fig. 3 and Supplementary Data Tables 1 and 3). d) E2F competition titrations. Color code is as in panel c. e) Comparison of the fold-change in binding affinity from direct titrations versus competition assays. The height of the bar is obtained by dividing the of E2F2 by each (n=1), and values higher than unity indicate an increase in binding affinity with respect to E2F2. For direct titrations, each value was obtained by averaging (global fitting) over several independent binding isotherms (E2F2: n=5, E1AE2F: n=3, E1AΔL: n=3, E1AWT: n=3) containing 16–22 points each (see Source Data). For competition experiments, each was obtained by fitting of a single binding isotherm (n=1). Error bars correspond to the propagated standard deviation of the averaged values. f) Three models that account for affinity enhancement in the Motif-Linker-Motif E1A arrangement (See main text for details).
To assess the affinity of E1AWT and the relative contributions of the two motifs, we also tested E1A constructs comprising the individual SLiMs or fragments where the E2F (E1AΔE) or LxCxE (E1AΔL) motifs were mutated to poly-alanine (Extended Data Fig. 1 and Fig. 1b) and the E2F SLiM (E2F2) taken from the host transcription factor E2F2 (Fig. 1b). Isothermal titration calorimetry (ITC) (Extended Data Fig. 2 and Supplementary Data Table 1) and size exclusion chromatography coupled to static light scattering (SEC-SLS) experiments (Supplementary Data Table 2) confirmed that all E1A constructs bound to Rb with 1:1 stoichiometry. To quantify binding affinities, we performed fluorescence polarization measurements using fluoresceine 5-isothiocyanate (FITC)-labelled constructs (Extended Data Fig. 3 and Supplementary Data Tables 1 and 3). While the host-derived E2F2 SLiM bound to Rb with high affinity , the E1AE2F SLiM had a , suggesting it would be a weak competitor of E2F2 (Fig. 1c). Based on a previous study showing the E2F and LxCxE motifs bind simultaneously to Rb [45] we suspected that a protein containing both SLIMs and the linker (E1AWT) would increase the binding affinity of the individual SLiMs by enhancing local concentrations. In support of this, we found that E1AWT had picomolar binding affinity , conferring a 4000-fold enhancement compared to the individual E1A SLiMs and a 40-fold enhancement compared to E2F2, consistent with a role of tethering in affinity enhancement (Fig. 1c).
To further test the role of tethering in E2F displacement, we carried out competition assays. Synthetic peptides corresponding to the E1ALxCxE and E1AE2F motifs as well as the E1AΔL mutant were unable to effectively displace E2F from Rb (Fig. 1d). However, E1AWT was a strong competitor, disrupting the [E2F2:Rb] complex at low nanomolar concentration (Fig. 1d). The agreement among ITC, direct titration and competition experiments confirmed that tethering was required for high affinity Rb binding and E2F displacement (Fig. 1e, Supplementary Data Table 1).
We anticipated that tethering the two SLiMs would play a prominent role in the affinity enhancement between the independent and linked SLiMs of E1A by increasing the effective concentration () of the second motif once a primary interaction is established (Fig. 1f, Model A). However, alternative mechanisms that are not mutually exclusive with tethering could also contribute to the stability of the complex. The E1A linker could enhance affinity by establishing additional stabilizing interactions with Rb (Fig. 1f, Model B). Alternatively, a primary interaction by the E1AE2F or E1ALxCxE SLiMs could induce an allosteric change in Rb that enables the complementary motif to bind with higher affinity (Fig. 1f, Model C). We tested each of these mechanisms using a combination of structural biophysics and thermodynamic analysis.
Linker-mediated interactions do not stabilize binding to Rb
We first sought to confirm the disordered nature of E1AWT using nuclear magnetic resonance (NMR) spectroscopy. The transverse optimized relaxation (TROSY) spectrum of 15N-labeled E1AWT revealed narrow chemical shift dispersion in the 1H-dimension. This is a characteristic signature of disordered regions and is consistent with previous work on E1A fragments (Fig. 2a) [43,46,47]. Further, the 13Cα secondary chemical shifts (ΔδCα) showed minimal deviation from random coil values obtained from disordered proteins (Fig. 2b I) and negative 1H-15N nuclear overhauser effect (NHNOE) values observed for E1AWT indicated fast backbone dynamics (Fig. 2b II). Finally, sequence analysis also predicted that E1AWT is globally disordered (Fig. 2b IV). These results confirmed that the conformational ensemble of E1AWT is characterized by high heterogeneity (disorder) and with fast interconversion between distinct conformations on the nanosecond to picosecond timescale (flexibility).
FIGURE 2. NMR and ITC analysis of the [E1AWT:Rb] complex.

a) 1H-15N TROSY spectra of free 15N-E1AWT (black) and 15N-E1AWT bound to unlabeled Rb (red). 15N-E1AWT peak assignments for the inset are shown in Extended Data Fig. 4. b) Ι. 13Cα secondary chemical shift (ΔδCα) of 15N-E1AWT. II. NHNOE/NONOE ratio for 15N-E1AWT. Dashed line: reference value for rigid backbone. IIΙ. Intensity ratio plots of bound state (I) with respect to the free state (I0) for E1AWT, E1AΔL and E1AΔE. Dark gray: E2F/LxCxE SLiMs and flanking regions; Light gray: N-terminal linker region. ΙV-V. Disorder propensity and residue conservation (information content: IC) were predicted from an alignment of E1A sequences (n=110) (Supplementary Data File 1). For disorder prediction, data points represent the mean IUPred value at each position and error bars represent the standard deviation of the mean. The number of residues averaged at each position is variable depending on the number of gaps in the alignment. For the conservation plot, the height of each bar represents the IC value at each position. c) Far-UV CD spectra for E1AWT (green line), Rb (violet line), the [E1AWT:Rb] complex (black line) and the arithmetic sum of the Rb and E1AWT spectra (red dashed line). The latter CD spectra largely overlap. While it is possible the low salt concentration of the CD experiments might mask hydrophobic interactions occurring at the higher salt concentration used for NMR and other binding experiments, such effects are unlikely to prevail for the types of monovalent salts used in our binding experiments. d) Left: Plot of the change in free energy of binding (ΔΔG) for E1A fragments containing or lacking the linker region, measured by ITC. The bar height results from the subtraction between mean ΔG values obtained by averaging several independent binding experiments: ΔG E1AΔL (n=3), ΔG E1AE2F (n=1), ΔG E1AΔE (n=3) and ΔG E1ALxCxE-AC (n=3) (Supplementary Data Table 1). Right: Plot of the change in ΔASA for E1A fragments containing or lacking the linker region. The height of the bar represents the ΔASA value from PDB structure 2R7G (n=1, black bar) or that derived from ITC experiments using parameters from Murphy & Freire for [E1AE2F:Rb] (n=1, blue bar) and [E1AΔL:Rb] (n=1, empty blue bar) (Supplementary Data Table 6). ΔASA was calculated by ITC measurements at several temperatures (n=4 [E1AE2F:Rb], n=3 [E1AΔL:Rb]). Error bars correspond to the propagated mean standard errors of the ΔASA value.
Next, we used NMR spectroscopy to determine the structural basis for E1AWT binding to Rb. For this, we dissected the relative contributions of the SLiMs, their flanking regions, and the linker. Previous NMR work mapped binding of E1A fragments containing individual Rb binding motifs [43] but did not examine the structural details of E1A bivalently tethered to Rb. The TROSY spectrum of labeled E1AWT in complex with unlabeled Rb (MW=54.6 kDa, Supplementary Data Table 2) reveals a complete loss of peaks for residues corresponding to the E2F and LxCxE SLiMs (L43 to Y47 and L122 to E126) (Fig. 2a, 2b III and Extended Data Fig. 4) consistent with slow exchange expected from the high affinities of the untethered motifs and the tethered complex [48]. The E1AΔL and E1AΔE constructs retain binding of the wild type motif (Fig. 2b III), consistent with independent binding of each motif to Rb. Based on previous reports [49], we anticipated that the regions flanking the canonical E1AE2F or E1ALxCxE motifs contribute stabilizing interactions to the complex. In agreement with this expectation, the peaks corresponding to the flanking residues (E39 to T52 and V119 to E135) disappeared upon binding, yielding near-zero I/I0 ratios (Fig. 2b III).
Binding experiments using fluorescence polarization and ITC confirmed the stabilizing role of the flanking regions: the affinity of the E1ALxCxE motif increased incrementally upon adding the acidic stretch following the motif (E1ALxCxE-AC), and with Ser132 phosphorylation (E1ALxCxE-ACP) (Fig. 1b and Supplementary Data Table 1) leading to an overall 5-fold increase in binding affinity. ITC revealed different origins for thermodynamic stability in each core motif and the flanking regions (Supplementary Data Table 1). While binding of E1AE2F is entropically driven, suggesting complex stabilization is dominated by the desolvation of apolar surfaces, binding of E1ALxCxE is enthalpically driven, likely due to the contribution from hydrogen bonds between the LxCxE motif and Rb.
The N-terminal linker region (residues 50–85) encompassing the TAZ2 binding motif is highly conserved and has a lower disorder propensity due to its hydrophobic nature (Fig. 2b IV–V). This region showed a decrease in peak intensities (Fig. 2b III) that a previous report suggested was due to weak interactions with Rb [43]. Consistent with this observation, the N-terminal linker region does not show increased chemical shift dispersion or large chemical shift changes upon binding Rb (Fig. 2a and Extended Data Fig. 4a–d). The C-terminal linker region (residues 86–120) shows no changes in chemical shifts or resonance intensities, indicating this region remains globally disordered and flexible when bound to Rb. These interpretations are supported by the lack of change in secondary structure upon binding Rb, as measured by circular dichroism (CD) (Fig. 2c).
Additional ITC studies using an isolated fragment from the N-terminal linker region that showed the largest decrease in peak intensities (E1A60–83) did not show any detectable association to Rb (Extended Data Fig. 2i). Further, E1A constructs that include the linker did not show higher binding affinities when compared to isolated E1A motifs (Fig. 2d, Supplementary Data Table 1). Taken together, these data rule out the presence of a high affinity binding site. To test for weak interactions that depend on bivalent tethering, we also designed a construct where the TAZ2 binding region (71MLAVQEGID79), which showed the largest reduction in I/Io, was replaced by a GS stretch (E1AWTΔHyd). The binding affinity of this mutant actually increased by 1.5-fold compared to E1AWT in fluorescence competition experiments (Supplementary Data Table 4), revealing a weak destabilizing effect of the TAZ2 binding site.
In order to identify thermodynamic contributions of the linker binding to Rb, temperature dependent ΔH measurements were used to infer changes in accessible surface area (ΔASAT) and the number of residues (Xres) that fold upon binding to Rb (Extended Data Fig. 5 and Supplementary Data Tables 5 and 6) (See Methods). ΔASAT values calculated using conventional and IDP-specific models [50,51] failed to reveal an increase in ΔASAT of the motif-linker construct (E1AΔL) compared to the individual motif (E1AE2F) (Fig. 2d and Supplementary Data Table 6), demonstrating that the linker did not contribute to additional surface desolvation. The IDP-specific method yielded Xres = 33 residues for the 16-mer E1AE2F binding to Rb, indicating a similar number of Rb residues fold at the E1A-binding interface. However, Xres did not increase for E1AΔL compared to E1AE2F, suggesting that no additional linker residues were involved in coupled folding and binding.
Collectively, these results demonstrate that the linker does not contribute to the thermodynamics of complex formation through coupled folding and binding or through persistent molecular interactions with Rb. While the hydrophobic TAZ2-binding region may establish transient, weak interactions with Rb that have a minor destabilizing effect and result in the resonance intensity reductions we observe, our results do not support a model that invokes linker-mediated interactions (Fig. 1f, Model B) as a source for affinity enhancement.
Allosteric coupling in Rb does not increase E1A-Rb affinity
To assess whether allosteric coupling between the E2F and LxCxE binding sites in Rb play a role in affinity enhancement (Fig. 1f, Model C), we saturated Rb with the E1AE2F or E1ALxCxE motifs and performed ITC titrations with the complementary motif (Extended Data Fig. 5). If a positive allosteric effect is at play, E1ALxCxE should bind more tightly to Rb when E1AE2F is already bound, and vice versa. This was measured as the change in Gibbs free energy ΔΔG = ΔGSATURATED – ΔGUNSATURATED, where a negative value for ΔΔG indicates positive cooperativity. For both motifs, the values of ΔΔG were in the range +/− 0.25 kcal/mol (Supplementary Data Table 7). In E1ALxCxE binding assays, saturation with E1AΔL instead of E1AE2F did not change the outcome, indicating that neither the motif nor the motif + linker arrangement behaved as an allosteric effector on the complementary site. Therefore, our results suggest that allosteric coupling in Rb (Fig. 1f, Model C) does not make a major contribution to affinity enhancement.
Entropic tethering optimizes affinity of E1A for Rb
Our results indicate the positive cooperativity of the tethered E1AE2F and E1ALXCXE motifs binding to Rb results from an increase in the effective concentration () of one motif once the other motif is bound [45] (Fig. 1f, Model A). It is well established that this form of cooperativity can be described using a simple Worm Like Chain (WLC) model [23,24,22, 33] that treats the linker as an entropic tether (Fig. 3a,b) wherein the dimensions of the linker will determine the degree of the affinity enhancement. A short linker would be unable to straddle the distance between the two binding sites and lead to low affinity enhancement (Fig. 3a,b l), an optimal linker would maximize , leading to maximal positive cooperativity (Fig. 3a,b II), and a longer than optimal linker would decrease (Fig. 3a,b III). Application of the WLC model to the E1A linker predicts a value of 0.92 mM, which is close to the optimal value (Fig. 3b) and within a factor of two of the (0.52 ± 0.09 mM) obtained from the affinities of E1AWT and the isolated motifs (Supplementary Data Table 1). For E1AW0054ΔHyd, where the destabilizing effect of the linker region is removed, the agreement with the WLC model improves (), indicating that this mutated linker behaves more like an entropic tether optimized to bind Rb with near-maximal affinity.
FIGURE 3: The E1A linker behaves as an entropic tether.

a) Schematic representation of how depends on linker length. b) curve from the WLC model. The scenarios depicted in a) are shown as regions (I, II, III). c) SAXS intensity profile of: Rb (gray squares) with best fit to the theoretical profile derived from the Rb crystal structure (RbAB domain, black line); and the [E1AWT:Rb] complex (black circles) with best fit from the EOM method (red line). Inset: Guinier plots for Rb and [E1AWT:Rb]. d) SAXS-selected [E1AWT:Rb] EOM ensemble (both motifs bound) and simulated ensembles for [E1AΔE:Rb] and [E1AΔL:Rb] (one motif bound). e) distribution of the ensemble pool for [E1AWT:Rb] (black) and the EOM ensemble (red). The linker samples conformations more extended than the random-coil model of the pool. f) SEC-SLS of [E1AWT:Rb] (solid line), [E1AΔE:Rb] (dotted line) and [E1AΔL:Rb] (dashed line). Black bars: BSA 66 kDa (1), MBP 45 kDa (2) and Lysozyme 14.3 kDa (3). Black line: SEC profile, Red line: MW value (g/mol). g) Comparison between the hydrodynamic radius () of modeled (MP = pool, ME= EOM) and experimental (E) ensembles for [E1AWT:Rb] (black bars), [E1AΔE:Rb] (red bars) and [E1AΔL:Rb] (blue bars). The height of each bar represents the value. Modeled values (n=1) have no associated error. For Experimental values (n=1) error bars represent the propagated error obtained from estimation of the parameter (see Methods).
To further test the tethering model, we performed Small Angle X-ray Scattering (SAXS) on Rb, E1AWT, and the [E1AWT:Rb] complex (Fig. 3c, Extended Data Fig. 6). The experimental SAXS profile of the Rb domain could be fit to the theoretical SAXS profile derived from its crystal structure (χi2 = 1.3) and further refined (RMSD = 1.7 Å) using a SAXS-driven modelling approach (χi2 = 0.82) (Fig. 3c, Extended Data Fig. 6a), indicating that Rb in solution retained its folded structure. Alternatively, the Kratky plots of E1AWT were characteristic of an IDP. Fitting of the SAXS profiles using the Ensemble Optimization Method (EOM) [52] indicated that E1AWT adopts highly expanded conformations (Extended Data Fig. 6b). To analyze the conformation of the linker in the [E1AWT:Rb] complex, we applied a sampling method [53] to generate a pool of 10250 realistic conformations [54] and computed theoretical SAXS profiles that were selected using EOM analysis. The SAXS profile of the complex was best described by sub-ensembles where the linker sampled expanded conformations (Fig. 3c–e, Extended Data Fig. 6c) with hydrodynamic radius () values (Rh EOM = 3.36 nm) in good agreement with those obtained from SEC-SLS experiments (Rh SEC = 3.20 ± 0.12 nm) (Fig. 3f–g, Extended Data Fig. 6d and Supplementary Data Table 2) and ratios consistent with bivalent tethering (Supplementary Data Table 2).
Our structural and thermodynamic dissection establishes E1A as a quantitative model system for entropic tethering, demonstrating that other mechanisms have a negligible contribution to affinity enhancement (with linker interactions having ΔG ~ + 200 cal.mol−1 over a total ΔGBINDING = −14240 cal.mol−1). Our ability to isolate tethering as the key determinant of binding affinity is unparalleled and provides us with a unique opportunity to test how tethering operates in biological systems. A longstanding question is whether the sequences of regions that encode tethering have any unique relationships with the conformational ensembles they form. If they do not it is difficult to imagine that a family of linkers with extensive variation in sequence and length could function in the same way. The model we present below is a comprehensive assessment of how this is possible.
Hypervariable E1A linkers have a conserved functional length
Inspection of selected linker sequences representative of mastadenoviruses that infect a wide range of mammalian hosts (Fig. 4a) revealed that while the N- and C-terminal acidic extensions and the aromatic/hydrophobic TAZ2 binding region were highly conserved, the linker lengths and compositions vary considerably within the central region enriched predominantly with polar, hydrophobic and proline residues (Fig. 4a and 2b V). To understand how function is conserved in the face of these extensive differences in linker length and sequences, we performed all atom simulations [9] and generated conformational ensembles of 27 E1A linker sequences with linker lengths from 27 to 75 residues (Fig. 4a). While the shortest linkers from Bovine/Ovine E1A proteins had smaller end-to-end distances, the average end-to-end distance of linkers 41 to 75 residues long remained roughly constant despite almost doubling the length (Fig. 4b). This suggested that the linkers have a conserved functional length [55] that is determined by a joint contribution of sequence length, amino acid composition, and sequence patterning as determinants of end-to-end distances. To test the feasibility of this hypothesis, we performed simulations for 140 random synthetic sequences of variable length that matched the amino acid composition of one of the shortest linkers (HF_HAdV40). In sharp contrast to natural sequences, the synthetic sequences showed the expected monotonic increase in end-to-end distance with chain length (Rnatural = 0.37, Rsynt = 0.99, Extended Data Fig. 7a). To examine the sequence-encoded origins of this compensation we analyzed various statistical properties (Extended Data Fig. 7 b,c). Net charge per residue (NCPR) had the strongest positive correlation with normalized end-to-end distance, with more expanded chains having a higher NCPR (Extended Data Fig. 7b). This is in agreement with previous findings that net charge and patterning are major determinants of IDR dimensions in natural [55,13,30,29,11] and synthetic [30,27,32] sequences. Longer chains also tend to have higher proline content with fewer hydrophobic and charged residues (Extended Data Fig. 7c).
FIGURE 4. Conformational buffering leads to conserved functionality of E1A proteins.

a) Global alignment of 27 selected E1A linker sequences. Mastadenovirus types are indicated on the left and the color coding (bottom panel) indicates the host range. The variants used for the design of chimeras are shown to the right, with three letter codes indicating the host range. Amino acids color code: acidic (red), basic (blue), polar (green), hydrophobic (black), aromatic (orange) and proline (pink). b) End-to-end distance calculated from all-atom simulations using the set of E1A linkers from panel a. Violin plots are colored by host range as in panel a. For each sequence, n=15 independent simulations were run (see Methods). The horizontal line within each violin plot represents the median end-to-end distance () value and the ends of the whiskers indicate the maximal and minimal values. Horizontal dotted line: mean value (53.39 Å) obtained by averaging the median values of all sequences excluding Bov-1, Bov-2 and Porcine. c) Motif-Linker-Motif constructs used in the E1A linker grafting experiment. Filled circles: grafting of linkers into the HAdV5 E1AE2F and E1ALxCxE motifs. Diamonds: Mutant where the hydrophobic MLAVQEGID region was replaced by a GS stretch (E1AWTΔHyd) or where the HAdV40 linker sequence was duplicated (Hum2–2x). Empty circles: Variants harboring endogenous linker and motifs (ED). d) Global as a function of linker length for the Motif-Linker-Motif constructs. for each variant was measured using an E2F displacement experiment (symbols as in c) or predicted using the WLC model. The values ± errors for all measurements are reported in Supplementary Data Table 4. The predicted value of the for the grafted linkers was calculated as (see Methods) using the known affinity of the E1AE2F and E1ALxCxE motifs from E1AWT (Supplementary Data Table 1) and values obtained using a sequence independent (Straight line: WLC-Lp=3) or sequence-dependent (Empty triangles: WLC-LpSim) persistence length () parameter (see Extended Data Fig. 10 and Methods). Dotted line: Experimental value of the E1AWT construct (75 ± 17 pM). Under the sequence-independent WLC model the is expected to increase gradually with decreasing linker length, while LpSim predicts the to remain constant in the 41–75 linker length range. Experimental values are in good agreement with both models for longer linker lengths, but are closer to LpSim for shorter linker lengths (41, 48 and 52).
The results of the simulations suggest that the functional length of the linkers is conserved and the linker dimensions are key to providing optimal affinity enhancement by tethering. Based on these results, we hypothesize that the end-to-end distances of disordered linkers are under functional selection through compensatory covariations in sequence length and composition, an adaptive mechanism that we term conformational buffering.
Conformational buffering preserves optimal tethering
The conformational buffering mechanism predicts that linker dimensions and optimal tethering will be conserved across E1A proteins with very different linker sequences. To test this prediction, we constructed a series of E1A chimeras by grafting different linker sequences with the E1AE2F and E1ALxCxE motifs (Fig. 4c) and determined Rb binding affinity using the competition assay of Fig.1d (Supplementary Data Table 4 and Extended Data Figure 8). We selected linkers from E1A types infecting a wide range of mammalian hosts (Fig.4a,c). These sequences cover a wide range of linker lengths (27–75), amino acid composition, and sequence patterning (Fig. 4a and Extended Data Fig. 7c). The E1A variants were expressed as MBP fusion proteins (Extended Data Fig. 1e) and we verified that MBP-E1AWT had the same binding affinity as cleaved E1AWT (Supplementary Data Table 4).
The sequence and structure of the Rb domain that binds to E1A is highly conserved across the host range covered in our experiments (> 95% sequence identity and RMSD < 1.2 Å). The residues that make up the E2F and LxCxE binding clefts and the spacing between the sites are also highly conserved suggesting that functional length is under selection (Extended Data Fig. 9 and Supplementary Fig. 1). This conservation implies that human Rb is an excellent proxy for the mammalian Rb proteins.
We predict that optimal tethering depends mainly on the linker dimensions and variants with conserved end-to-end distances will confer similar affinity to E1AWT. In accordance with this prediction, human and simian E1A linkers ranging from 41 to 75 residues have similar binding affinities, with ratios between 0.4 and 1.2 (Fig. 4c,d). E1A linkers with the highest affinities (Hum-2 and Sim-1) had polar residues interrupting the weakly destabilizing hydrophobic interactions in the TAZ2 SLiM (Fig. 4a). To directly assess linker dimensions we used SEC to measure for selected E1A variants after MBP cleavage (Extended Data Fig. 1f,g and 7d). Both and agreed closely with those predicted from the atomistic simulations (Fig. 4d, Supplementary Data Table 4 and Extended Data Fig. 7d). We also created a tandem repeat where the Hum-2 linker was duplicated (Hum-2–2x, Fig. 4c,d). was 1.1, suggesting its dimensions are still optimized.
E1A linkers appear to be under strong functional selection to preserve optimal tethering using a mechanism that requires compensatory covariations in sequence length and composition (i.e. conformational buffering). These results underscore the functional implications of preserving sequence-ensemble-relationships (SERs), which in the case of E1A is achieved by preserving the dimensions of the disordered linkers, which is necessary for hijacking the eukaryotic cell cycle.
Linker-motif coevolution modulates conformational buffering
The shorter bovine linkers (Fig. 4a) had ratios between 13 and 20 (Fig. 4c,d). This weaker than predicted affinity (Fig. 4d) was not due to the linkers being less expanded since the predicted and experimental values for Bov-1 were similar (Extended Data Fig. 7d). Instead, it suggests that a minimal sequence length, not predicted by WLC, is necessary to overcome entropic effects required for proper orientation of the SLiMs to bind Rb. This highlights a limitation of the WLC model which is not unexpected since this simplified homopolymer model does not include excluded volume or local changes in the chain stiffness.
We expect that the E1A linkers and SLiMs are co-evolving in a way that may not be represented in the chimeras. For instance, the canine and bat chimeras had similar predicted and experimental values (Extended Data Fig. 7d) but showed reduced binding affinity, with ratios between 5 and 6 (Fig. 4c,d) even though FoldX predicted the bat SLiMs to have higher affinity for Rb than E1AWT motifs. This reduction in binding could be due to additional destabilizing interactions of the bat/canine linkers with Rb, implying the possibility of compensatory changes that optimize but do not maximize binding affinity. To test this hypothesis, we measured the affinity of a variant containing the endogenous SLiMs and linker from bat (Bat-ED), which recovered high affinity binding with Rb (). This is a clear signature of coevolution whereby linker mutations that weaken affinity enhancement by tethering are compensated by SLiM mutations that directly increase Rb affinity.
The Bovine linker is predicted to have a smaller than optimal end-to-end distance compared with other E1A linkers (Fig. 4b) and the bovine SLiMs are predicted by FoldX to bind Rb with lower affinity (Fig. 5a), suggesting that the SLiMs and linker for Bovine are suboptimal. To test this prediction, we measured the affinity of a variant with the endogenous Bov-1 SLiMs and linker (Bov-1-ED). Bov-1-ED was unable to displace E2F in our competition experiments () (Fig. 4 c,d and Extended Data Fig. 8). Taken together, these results suggest that Bovine E1A cannot displace E2F to hijack the host cell cycle.
FIGURE 5. Evolutionary conservation of tethering by E1A proteins.

a) Phylogenetic tree of mastadenovirus E1A proteins with species denoted by two letter codes. The affinity of the E2F/LxCxE SLiMs and E1AWT, and linker length are indicated by color scales. E1A (WLC): Global for E1A proteins predicted by the WLC model with standard values (); E1A (LpSim): for E1A proteins predicted by the WLC model with sequence-dependent values; E1A (Graft): Experimental measured for the grafted linkers of Fig. 4d; E1A (ED): Experimental measured for the variants harboring endogenous linker and motifs of Fig. 4d. Gray box: absent motif/linker. Light/blue box: present TAZ2/MYND SLiMs. The E1AWT protein is marked as a red asterisk and as a red terminal branch in the tree and all other sequences used in the experiments are marked as green terminal branches in the tree. b) Upper: E1A sequences evolved a multiplicity of solutions in the sequence length-composition space to achieve conserved SERs through conformational buffering. Lower: The model represents one pose of the conformational [E1AWT:Rb] ensemble with E2F/LxCxE SLiMs bound to Rb. The evolvable E1A interaction platform performs highly conserved functions (E2F activation) while allowing adaptive changes in functionality (TAZ2, MYND and other protein binding).
Evolutionary conservation of E1A tethering
Our results suggest that conformational buffering is a selection mechanism that conserves end-to-end distances and affinity enhancement by tethering for E1A, and that motifs and linkers co-evolve. To test these hypotheses on a larger family of sequences56, we predicted global binding affinities for 110 distinct E1A SLiMs and linkers. We used FoldX to predict SLiM affinities and we predicted using either the WLC model with a single persistence length (E1A WLC), or the sequence-specific persistence length (E1A Lp-Sim) from the simulations of the 27 linkers in Fig. 4a (Extended Data Fig. 10). The results are shown in Figure 5a together with the measured affinities from the grafting experiments (E1A Graft) or from endogenous variants (E1A ED).
The conservation of affinity enhancement by tethering is predicted across E1A proteins from adenoviruses infecting human (HA-G), simian (SA/B/F), canine (CA), bat (BtA/B) and equine (EA) species. These results are in agreement with our binding affinity measurements for human, simian and bat E1A proteins. The structural conservation of the p107/p130 paralogs that harbor the same SLiM binding sites (Extended Data Fig. 9) suggests that E1A uses the same mechanism to displace E2F factors bound to all Rb paralogs.
In contrast, in a divergent branch of E1A proteins infecting rodents (MA/B/C), treeshrew (TSA) and artiodactyls (including bovine, sheep and pig OA/BA/PA), binding to Rb seems impaired or lost completely due to the presence of short linkers coupled to low affinity (PC/OA/BA) or missing SLiMs. For instance, E1A proteins from rodents retain the LxCxE motif but lose the E2F motif. These E1A proteins could interfere with host factors binding to the LxCxE cleft but would be unable to displace E2F. These results suggest that the SLiMs and the linker are under co-evolutionary selection, such that either the SLiMs and linker are jointly optimized, or selection pressure is lost on both elements, leading to a loss of E2F displacement and possibly a loss of E1A’s ability to hijack the eukaryotic cell cycle (Fig. 5a). This branch of divergent adenoviruses is likely to employ alternative mechanisms to induce host cell proliferation.
In summary, we demonstrate that tethering is the main mechanism that allows E1A to bind Rb with picomolar affinity and displace E2F transcription factors. We show that the functional length of the linkers is conserved and fine-tuned through conformational buffering to enable maximal affinity enhancement in the face of extensive changes in sequence composition and length. We also uncover a previously unknown linkage between the evolution of linkers and their tethered motifs. This study shows that strong functional selection can operate both on the motifs and on the physical properties of an IDR linker, providing important insights regarding the evolution of sequence features and tethering functions in IDRs.
DISCUSSION
Here, we demonstrate how E1A hijacks the eukaryotic cell cycle using two SLiMs tethered by a flexible linker with conserved dimensions [12,26]. The proposed docking and displacement mechanism is conserved across divergent E1A proteins by conformational buffering and coevolution of the SLiMs and tether. Conformational buffering promotes robust encoding of a core function (Fig. 5b, upper) while supporting the extensive sequence variation necessary to rewire the E1A interactome (Fig.5b, lower) and adapt to different hosts by gaining or losing additional SLiMs [56–58], as we show for several SLiMs in Fig.5a [39,43,56,59]. Our work challenges the view that IDRs with extensive sequence variation evolve neutrally. We also demonstrate that conserved SERs that encode for IDR dimensions -as determined by sequence length, composition and patterning- can be detected with atomistic simulations even if they are obscured by naïve sequence alignments.
Conformational buffering results in the conservation of tethering for any sequence solution that preserves the functional length. Our experimental validation using a collection of E1A linkers largely supports this hypothesis, demonstrating that linkers with a broad range of sequence compositions and lengths are functionally equivalent (Fig. 4 a,d). However, the molecular evolution of tethered systems will be constrained by competing evolutionary pressures [6,2]. In the case of the E1A linkers, correlated changes in NCPR and proline content (Fig. 4 a,b) maintain linker extension and prevent folding. The linker can contain additional SLiMs that mediate the formation of higher order complexes [43] and impose restrictions on sequence variation that could prevent optimal tethering, analogous to the frustrated energy landscapes in protein folding [60]. By dissecting the contribution of linker versus SLiMs, we found signatures of these competing forces: E1AWT confers optimal tethering and harbors a hydrophobic SLiM (TAZ2 motif) that plays a minor destabilizing role, while the Bat E1A linkers evolved stronger destabilizing interactions with Rb that are compensated by mutations that restore optimal tethering by increasing the affinity of the SLiMs for Rb. Thus it appears that competition between linker tethering and SLiM binding constrains IDR evolution due to different contributions from conformational buffering and coupled folding and binding. This can result in linker sequence conservation patterns ranging from highly variable [this work,11,13] to highly conserved [12]. Other systems such as the intrinsically disordered Notch RAM region show similar mixed contributions from optimal tethering and sequence-specific effects [61]
Our work establishes E1A as an example of optimal tethering. The low picomolar affinity of E1A for Rb and the 4000-fold affinity enhancement enforced by the E1A linker is amongst the highest reported positive cooperativity produced by tethering in a natural system, similar to the POU domain activator Oct-1 binding to DNA and 2100-fold enhancement) [22]. E1A is the first adenoviral gene expressed, and the picomolar affinity is likely required for E1A to bind stably to Rb and efficiently displace E2F and hijack the cell cycle at low expression levels during early infection [62]. As a comparison, intramolecular MdmX inhibition, exhibits optimal tethering with a 400-fold enhancement and [12] and other bivalently tethered systems show variable degrees of enhancement with affinities in the nanomolar range [63,64,65]. At the opposite extreme, multiple low affinity interactions tethered by short and/or non-optimal linkers might promote the dynamic binding required for multivalent binding or liquid-liquid phase separation [66,17]. Our work suggests that conformational buffering can tune the functional length of linkers to produce an optimal functional output. Thus, conformational buffering may be a widespread mechanism driving dimensional compensation among IDRs.
METHODS
Protein purification and peptide synthesis and labeling
Protein expression and purification:
The human Retinoblastoma protein (Uniprot ID: P06400) AB domain with a stabilizing loop deletion (372–787Δ582–642), named Rb, was recombinantly expressed from a pRSET-A vector in E. coli Bl21(DE3). Briefly, Rb cultures were induced with 1 mM IPTG and grown at 28 °C overnight. Rb was purified from the soluble fraction using a Ni2+-nitrilotriacetic acid immobilized metal affinity chromatography resin, followed by a purification with a sulfate cation exchange (SP-Sepharose) resin and size exclusion (Superdex 75) chromatography [67]. The adenovirus serotype 5 (HAdV5) Early 1A protein fragment (36–146) (Uniprot ID: P03255), named E1AWT, was subcloned into BamHI/HindIII sites of a modified pMalC2x vector (NewEnglandBioLabs, Hitchin, UK). E1AΔE (43-LHELY-47Δ43-AAAA-46) and E1AΔL (122-LTCHE-126Δ122-AAAA-125) variants were obtained by site-directed mutagenesis of the wild type vector. E1A proteins were expressed as MBP fusion products in E. coli BL21(DE3). Unlabeled and single (15N) and double (15N/13C) labeled samples were obtained from 2TY medium and M9-minimal medium supplemented with 15NH4Cl and 13C-glucose respectively. Cultures were induced with 0.8 mM IPTG at 0.7 OD600 and grown at 37 °C overnight in 2TY medium or for 5 h after induction in M9-minimal medium. Harvested cells were lysed by sonication and proteins isolated performing amylose affinity chromatography of the soluble fraction, followed by Q-HyperD Ion exchange and size exclusion (Superdex 75) chromatography. The MBP tag was cleaved with Thrombin (Sigma-Aldrich, USA) at 0.4 unit per mg of protein. Synthetic MBP-E1A fusion constructs (construct sequences available in the Source File for Figure 4) subcloned into the pMalC4x vector (GenScript, USA) were expressed in E. coli Bl21(DE3) followed by Amylose purification and Superdex 75 chromatography as described above. All E1A protein stocks were stored at −80 °C in buffer containing 20mM Sodium Phosphate pH 7.0, 200mM NaCl, 20mM DTT and 2mM PMSF. Protein purity (> 90%) and conformation were assessed by SDS-PAGE, SEC-SLS and circular dichroism analysis (Extended Data Fig. 1).
Peptide synthesis:
Peptides corresponding to individual E1A or E2F2 binding motifs were synthesized by FMoc chemistry at >95% purity (GenScript, USA) and quantified by Absorbance at 280 nm or by quantitation of peptide bonds at 220 nm in HCl -when Tryptophan or Tyrosine residues were absent. The peptide sequences are:
E1AE2F 36-SHFEPPTLHELYDLDV-51
E1ALxCxE 116-VPEVIDLTCHEAGFPP-131
E1ALxCxE-AC 116-VPEVIDLTCHEAGFPPSDDEDEEG-139
E1ALxCxE-ACP 116-VPEVIDLTCHEAGFPPpSDDEDEEG-139
Human E2F2 404-SPSLDQDDYLWGLEAGEGISDLFD-427
FITC labeling:
Proteins and peptides were labeled at their N-terminus with Fluorescein 5-Isothiocyanate (FITC, Sigma), purified and quantified following a described protocol [67]. F/P (FITC/Protein) ratio was above 0.8 in all cases.
Circular Dichroism (CD)
Far-UV CD spectra were measured on a Jasco J-810 (Jasco, Japan) spectropolarimeter equipped with a Peltier thermostat using 0.1 or 0.2 cm path-length quartz cuvettes (Hellma, USA). Five CD scans were averaged from 195 to 200 nm at 100nm/min scan speed, and buffer spectra were subtracted from all measurements. All spectra were measured in 10mM Sodium Phosphate buffer pH 7.0 and 2mM DTT at 20 ± 1 °C and 5 μM protein concentration.
Size Exclusion Chromatography, Hydrodynamic radii calculations and Light Scattering Experiments
Analytical size exclusion chromatography (SEC) was performed on a Superdex 75 column (GE Healthcare) calibrated with globular standards: BSA (66 kDa), MBP (45 kDa) and Lysozyme (14.3 kDa). All runs were performed by injecting 100 μl protein sample ( and at 270 μM and at 540 μM) in 20 mM Sodium Phosphate buffer pH 7.0, 200 mM NaCl, 2 mM DTT. For each protein or complex a partition coefficient was calculated and apparent molecular weights were interpolated from the −logMW vs calibration curve. Experimental hydrodynamic radii were calculated following empirical formulations developed by Uversky and col. [68]:
| (1) |
Where is the apparent molecular weight derived from SEC experiments. The predicted for was calculated following the formulation developed by Marsh and Forman-Kay [3].
The exponent was calculated from using the experimental values, with nm for and for Rb, following [28]. For , was calculated from using obtained from SAXS measurements and , following [69]. In both cases, is the number of residues in the chain (Supplementary Data Table 2).
Static Light Scattering (SLS) coupled to SEC was carried out to determine the average molecular weight of individual protein peaks and the stoichiometry of [E1A:Rb] complexes using a PD2010 detector (Precision Detectors Inc, China) coupled in tandem to an HPLC system and an LKB 2142 differential refractometer. The 90° light scattering (LS) and refractive index (RI) signals of the eluting material were analyzed with Discovery32 software (Precision Detectors).
Dynamic Light Scattering (DLS) was used to measure the hydrodynamic size distribution of E1A, using a Wyatt Dynapro Spectrometer (Wyatt Technologies, USA). Data was fitted using Dynamics 6.1 software. All measurements were performed in 20 mM Sodium Phosphate buffer pH 7.0, 200 mM NaCl, 1 mM DTT at 2 mg/ml. Samples were filtered by 0.22 μM filters (Millipore) and placed into a 96 Well glass bottom black plate (In Vitro Scientific P96–1.5H-N) covered by a high performance cover glass (0.17+/−0.005mm) before measurements were taken.
Fluorescence Spectroscopy Experiments
Measurements were performed in a Jasco FP-6200 (Nikota, Japan) spectropolarimeter assembled in L geometry coupled to a Peltier thermostat. Excitation and emission wavelengths were 495 nm and 520 nm respectively, with a 4 nm bandwidth. All measurements were performed in 20 mM Sodium Phosphate buffer pH 7.0, 200 mM NaCl, 2 mM DTT and 0.1% Tween-20 at 20 ± 1 °C.
For direct titrations, a fixed concentration of FITC-labeled protein/peptide was titrated with increasing amounts of Rb until saturation was reached. Maximal dilution was 20% and samples equilibrated for 2 min ensuring steady state. Titrations performed at concentrations 10 times higher than the equilibrium dissociation constant allowed estimation of the stoichiometry of each reaction. Binding titrations performed at sub-stoichiometric concentrations allowed an estimation of , by fitting the titration curves to a bimolecular association model:
| (2) |
Where is the measured anisotropy signal, and are the free and bound labeled peptide signals, is the total labeled peptide concentration, is Rb concentration, and is the equilibrium dissociation constant in Molar units. The linear term accounts for slight bleaching or aggregation. Data was fitted using the Profit 7.0 software (Quantumsoft, Switzerland), yielding a value for each parameter and its corresponding standard deviation. Titrations for each complex were performed in triplicate at least at three different concentrations of FITC-labeled sample, and parameters were obtained from fitting individual titrations or by global fitting of the parameter using normalized titration curves at different concentrations, obtaining an excellent agreement between individual and global fits (Supplementary Data Table 3 and Extended Data Fig. 3).
Competition experiments were carried out by titrating the pre-assembled complex [Rb:FITC-E2F2] (1:1 molar ratio, 5 nM) with increasing amounts of unlabeled competitors and following the decrease in the anisotropy signal until the value corresponding to free FITC-E2F2 was reached. IC50 values were estimated directly from the curves as the concentration where the competitor produced a decrease in 50% of the maximal anisotropy value. values were calculated by fitting the data considering the binding equilibrium of the labeled peptide and the unlabeled competitors according to [70], obtaining values that differed only slightly (2 to 3-fold) from those obtained from direct titrations. and values also displayed similar fold changes in binding affinity relative to E2F2 within each method (Supplementary Data Table 1). The agreement between the values obtained from fluorescence and ITC titrations (Supplementary Data Table 1) confirmed that FITC moiety did not cause significant changes in Rb binding affinity. MBP-E1A fusion protein affinities (Supplementary Data Table 4 and Extended Data Fig. 8) were determined by performing competition experiments assembling a [Rb:FITC-E2F2] complex at 10nM concentration, after verifying that MBP-E1AWT and E1AWT (cleaved and uncleaved HAdV5 proteins) had the same binding affinity (Supplementary Data Table 7). Measurements were performed on a PTI Quantamaster QM40 spectrofluorimeter (Horiba, Japan) equipped with polymer film polarizers and coupled to a Peltier thermostat with excitation parameters as described above.
ITC Experiments
Direct titrations.
ITC experiments were performed on MicroCal VP-ITC and MicroCal PEAQ-ITC equipment (Malvern Panalytical) in 20 mM Sodium Phosphate pH 7.0, 200 mM NaCl, 5mM 2-mercapto ethanol at 20.0 ± 0.1 °C, unless stated otherwise. Prior to titrations, cell and titrating samples were co-dialyzed in the aforementioned buffer for 48 h at 4 ± 1 °C and then de-gassed. Measurements performed in the MicroCal VP-ITC used 28 10-μl injections at a flow rate of 0.5 μl/s and those performed in the MicroCal PEAQ-ITC used 13 3-μl injections. The concentration range of cell and titrating samples are detailed in Extended Data Figs. 2 and 5. Data were analyzed using the Origin software.
Allosteric coupling experiments.
First, a pre-assembled [Rb:E1ALxCxE] complex (1:1 molar ratio, 30 μM) was titrated with E1AE2F or E1AΔL to assess whether binding of the LxCxE motif modified the binding affinity for the E2F site. Conversely, pre-assembled [Rb: E1AE2F] or [Rb: E1AΔL] complexes were titrated with E1ALxCxE to assess whether binding of the E2F motif modified the binding affinity for the LxCxE site (Supplementary Data Table 7).
Calculation of ΔCp and ΔASA parameters from ITC data.
A series of titrations were carried out at different temperatures (10.0, 15.0, 20.0 and 30.0 ± 0.1 °C) and the change in binding heat capacity (ΔCp) was obtained from the slope of the linear regression analysis of the plot of ΔH vs temperature (Extended Data Fig. 5). The changes in accessible surface area (ΔASAT) and the number of residues that fold upon binding (Xres) were estimated by solving semi-empirical equations from protein folding studies applied to protein-ligand binding [50] and from models that use parameters derived for intrinsically disordered proteins (IDP-specific model) [51] (Details on the model-specific parameter values are provided in Supplementary Data Tables 5 and 6). First we calculated from:
| (3) |
where is the change in enthalpy measured at experimental temperatures (K), is the change in heat capacity, is the change in enthalpy at the temperature of enthalpic convergence and is the temperature of enthalpic convergence at which the apolar contribution is assumed to be zero (295.15 K). Then, values were calculated as the sum of the contribution of changes in polar and non-polar accessible surface areas, by solving the following set of equations:
| (4) |
| (5) |
where and are constants that assume different values according to the model used [50,51] (See Supplementary Data Table 6 for specific values). Finally, was calculated from:
| (6) |
Where is the change in configurational entropy per residue and the change in configurational entropy was calculated as the sum of changes in rotation-translation and solvation entropy:
| (7) |
with defined as:
| (8) |
where is the experimental temperature and is the temperature for entropic convergence (385 K). and the constant C1, which depend on the relationship of apolar to polar surface area, assume different values depending on the model used [50,51] (see Supplementary Data Table 6 for model-specific values).
NMR Experiments
NMR experiments were carried out using a Varian VNMRS 800 MHz spectrometer equipped with triple resonance pulse field Z-axis gradient cold probe. A series of two-dimensional sensitivity-enhanced 1H–15N HSQC and three-dimensional HNCACB, HNCO and CBCA(CO)NH experiments [71,72] were performed for backbone resonance assignments on uniformly 13C–15N-labeled samples of E1AWT, E1AΔE and E1AΔL at 700 μM, 975 μM and 850 μM respectively. All measurements were performed in 10 % D2O, 20 mM Sodium Phosphate pH 7.0, 200 mM NaCl, 2 mM DTT at 25 °C. The HSQC used 9689.9 Hz and 1024 increments for the t1 dimension and 2106.4 Hz with 128 increments for the t2. The HNCACB used 9689.9, 14075.1, and 2106.4 Hz, with 1024, 128, and 32 increments for the t1, t2, and t3 dimensions, respectively. The HNCO used 9689.9, 2010.4 Hz, and 2106.4 Hz with 1024, 64, and 32 increments for the t1, t2, and t3 dimensions, respectively. The CBCA(CO)NH used 9689.9, 14072.6, and 2106.4 Hz, with 1024, 128, and 32 increments for the t1, t2, and t3 dimensions, respectively. For E1AWT 88% of non-proline backbone 1H and 15N nuclei, 75% of 13C’ nuclei and 90% of 13Cα and 13Cβ of E1A nuclei were assigned (Supplementary Data File 2). For E1AΔE and E1AΔL 85% of non-proline backbone 1H and 15N nuclei, 72% of 13C’ nuclei and 87% of 13Cα and 13Cβ E1A nuclei were assigned.
NMRPipe and NMRViewJ software packages were used to process and analyze all the NMR spectra [73]. Residue-specific random coil chemical shifts were generated for the three sequences using the neighbor-corrected IDP chemical shift library [74]. Secondary chemical shifts (Δ δ), were calculated by subtracting random coil chemical shifts from the experimentally obtained chemical shifts.
Two-dimensional 1H–15N TROSY experiments were performed on single 15N-labeled samples of free E1AWT, E1AΔE and E1AΔL and on each E1A protein bound stoichiometrically to Rb (1:1 molar ratio) at 525 μM (E1AWT), 300 μM (E1AΔE) and 315 μM (E1AΔL). The ratio between the peak intensity in the bound state (I) and the peak intensity in the free state (I0) was calculated, allowing interacting residues to be determined together with additional data.
Molecular modelling of Rb:E1A conformational ensembles
Conformations of E1AWT bound to Rb were modeled using an extended version of a recently proposed method to generate realistic conformational ensembles of IDPs [53]. Conformational ensemble models of [E1AWT:Rb] were generated using a stochastic sampling algorithm implemented in the MoMA software suite (https://moma.laas.fr). This method exploits local, sequence-dependent structural information encoded in a database of three-residue fragments and builds conformations incrementally sampling dihedral angles values from the database, while avoiding steric clashes. In order to model the double-bound [Rb:E1AWT] complex, the E2F and LxCxE motifs were considered to be static, preserving the conformations extracted from experimentally determined structures (2R7G and 1GUX). The 71-residue fragment between these two motifs was considered as a long protein loop that adapts its conformation in order to maintain the two ends rigidly positioned. Conformational sampling considering such loop-closure constraints was performed using a robotics-inspired method [54] adapted to use dihedral angle values from the aforementioned database. For each feasible conformation of the central fragment, geometrically compatible conformations of the short N- and C-terminal tails were sampled using the basic strategy explained in [53]. For singly bound models [E1AΔL:Rb] and [E1AΔE:Rb], only one of the two motifs were considered to be statically bound to Rb and the other motif behaved as the flexible linker. The loop sampling method used to model the linker between the two binding motifs can be used via a web server (https://moma.laas.fr/applications/LoopSampler/). Binaries can be provided upon request.
SAXS Experiments
SAXS experiments for Rb and [E1AWT:Rb] were carried out at the European Molecular Biology Laboratory beamline P12 of PETRAIII storage ring, using the X-ray wavelengths of 1.24 Å and a sample-to-detector distance of 3.0 m [75]. The scattering profiles measured covered a momentum transfer range of 0.0026 < s < 0.73 Å−1. SAXS data for E1A was collected at the at the SWING beamline at the SOLEIL synchrotron, France, on an Eiger 4M detector with a sample-to-detector distance of 2.0 m. SAXS data were measured for Rb, E1AWT and the [E1AWT:Rb] complex at 10° C. Concentrations used for E1AWT were 7.0, 5.6 and 4.2 mg/ml, for Rb were 4.0, 2.0, 1.0 mg/ml, and for and [E1AWT:Rb] were 2.7, 1.4, and 0.7 mg/ml, in 20 mM Sodium Phosphate pH 7.0, 200 mM NaCl, 1mM DTT. The scattering patterns of the buffer solution were recorded before and after the measurement of each sample. Multiple repetitive measurements were performed to detect and correct for radiation damage. The initial data processing steps including masking and azimuthal averaging were performed using the SASFLOW version 3.0. pipeline for Rb and [E1AWT:Rb] and the program FOXTROT version 3.5.2. [76] for E1A. Final curves at each concentration were derived after the averaged buffer scattering patterns were subtracted from the protein sample patterns. No sign of aggregation was observed in any of the curves. Final SAXS profiles for the systems were obtained by merging curves for the lowest and highest concentrations to correct small attractive interparticle effects observed. The SAXS profiles were analyzed using the ATSAS suite of programs version 2.8.4 [77]. The forward scattering intensity, , and the radius of gyration, , were evaluated using Guinier’s approximation [78], assuming that at very small angles (, the intensity can be well represented as . The distribution functions were calculated by indirect Fourier Transform using GNOM [79] applying a momentum transfer range of 0.01 < s < 0.33 Å−1 and 0.013 < s < 0.27 Å−1 for Rb and [Rb:E1A], respectively. For E1AWT a SEC-SAXS experiment was also performed which was processed using the program CHROMIX [80] which is a part of ATSAS 2.8.4. to obtain the SAXS profile from a highly monodisperse sample. This profile overlaid perfectly with the E1AWT merged curve from the three batch experiments, discarding aggregation problems.
The fitting of the crystallographic structure of Rb (PDB: 3POM [81]) to the experimental SAXS curve was performed with FOXS [82,83]. An optimal fit (χ2=0.86) was obtained after modelling the missing parts (loops, N- and C-termini) and a subsequent refinement with the program AllosMod-FoXS [84]. SAXS data measured for [Rb:E1A] were analyzed with the Ensemble Optimization Method (EOM) [52,85]. Briefly, theoretical SAXS profiles of the 10250 structures of the complex were computed with CRYSOL [86]. 200 different sub-ensembles of 20 or 50 conformations collectively describing the experimental curve were collected with EOM and analyzed in terms of distributions. The experimental SAXS data of [E1AWT:Rb] complex is compatible with three distinct scenarios: a 100% doubly-bound ensemble where the linker is highly expanded, a 100% singly-bound ensemble where the linker is highly compact and thirdly, an ensemble with a combination of 76% doubly bound and :24% singly-bound species, which resulted from the linear combination of a curve representing the ensemble average of all singly- and all doubly-bound conformations. However, thermodynamic ( for E1AWT) data strongly argue against the last two scenarios as it indicates an extremely low expected population of the singly-bound forms at any concentration of the complex used in the SAXS experiments.
Hydrodynamic radii for generated conformations
Hydrodynamic radii were calculated using the program HydroPro (version 10) [87,88]. HydroPro was run on 1000 models selected by EOM for the doubly-bound conformations and 1000 randomly selected conformations of N- and C-terminal bound conformations. The calculations were done at temperatures of 20 and 25 °C with corresponding solvent viscosities of 0.01 and 0.009 poise, respectively. The values of atomic element radius (AER), Molecular Weight, Partial Specific Volume and Solvent Density were set to 2.9 Å, 54590 Da, 0.702 cm3/g and 1.0 g/cm3, respectively. These values have no associated error.
All-atom simulations of E1A Linker sequences
All-atom simulations were run using the CAMPARI simulation engine (V2) Version 2.0 (http://campari.sourceforge.net) and ABSINTH implicit solvent model ABS-OPLS3.2 [89,90]. All simulations were run at 320 K; while this is a slightly elevated temperature compared to the experimental temperature, none of the terms the Hamiltonian lacks temperature dependence such that this slightly high temperature serves to improve sampling quality in a uniform way across all simulations. This approach has been leveraged to great effect in previous studies and is especially convenient in the case of simulating many different sequences that span a range of sequence properties and lengths [8]. A collection of Monte Carlo moves was used to fully sample conformational space as previously described [91,92,13].
For all simulations of natural sequences, 15 independent simulations were run per sequence for a total of 90K conformations per sequence across 27 different sequences (405 independent simulations, 5.25 ×10⁸ Monte Carlo steps per sequence). Simulations were performed in 15 mM NaCl in a simulation droplet size sufficiently large for each sequence, calibrated in a length dependent manner. Simulations were analyzed using the MDTraj package version 1.9.5 [93] and SOURSOP version 0.1.3 (https://soursop.readthedocs.io/). Sequence analysis was performed using the local CIDER software package [94] with all parameters reported in the Source Data for Extended Data Figure 7. Normalized end-to-end distance was calculated as the absolute end-to-end distance divided by the end-to-end distance expected for an equivalently long Gaussian chain. Motif-linker-motif simulations were performed in a manner analogous to the linker-only motifs. Each independent simulation was run for 86 × 106 steps, with 6 ×10⁶ steps discarded as equilibration and conformations saved every 50,000 steps. Over 10 independent replicas, this approach generates ensembles of 16,000 conformations per sequence. To calculate the hydrodynamic radius we used the approach of Nygaard et al. to convert the radius of gyration into the hydrodynamic radius [95]. Code for this conversion is provided in the supporting GitHub repository.
Length titration Simulations
The linker from HF_HAdV40 was used to determine the overall amino acid composition and generate random sequences across a range of lengths that recapitulated this composition. Specifically, for each length (45, 50, 55, 60, 65, 70, 75) twenty random sequences were generated for a total of 140 randomly generated sequences. Each sequence was simulated under equivalent simulation conditions for 35 × 109 simulation steps, with the goal of elucidating the general relationship between sequence length and end-to-end distance for an arbitrary sequence of the composition associated with HF_HAdV40. The mean end-to-end distance for the collection of sequences at a given length was determined, such that the mean value is a double average over both conformational space and sequence space.
WLC modelling
The worm like chain (WLC) model:
A worm like chain (WLC) model [22] was used to describe the end-to-end probability density distribution function of the E1A linker and estimate the effective concentration term used in the tethering model (Fig. 1, Model A and Fig. 3). In this model, the disordered linker behaves as a random polymer chain whose dimensions depend on the persistence length , which represents the chain stiffness, or the length it takes for the chain motions to become uncorrelated and on the contour length , which is the total length of the chain. For long peptides, assumes a standard value of 3Å and is , where is the number of linker residues and is the average unit size of one amino acid (3.8 Å) [23]. Under this model, the probability density function is defined by:
| (3) |
Where is a function of distance and depends on and . The last term in the equation is expanded in [22,23]. The end-to-end probability density function can be related to the effective concentration in the bound state when the linker is restrained to a fixed distance between binding sites, [22]. In this case, the effective concentration is defined by:
| (4) |
Where is Avogadro’s number and is the distance separating the binding sites obtained from the X-ray structure of the complex (49 Å calculated from PDB: 2R7G [40] and 1GUX [41]). Multiplying Eq. (4) by 103 yields in millimolar units.
Calculation of experimental and predicted values for the E1AWT:Rb interaction
Experimental values:
In Model A the global dissociation constant is calculated as: (Fig. 1f) where and are equilibrium association constants . Therefore, this relationship can be expressed equivalently as . Here, and are the equilibrium dissociation constants of the E1AE2F and E1ALxCxE motifs respectively (reported in Supplementary Data Table 1) and is the equilibrium dissociation constant for E1AWT (reported in Supplementary Data Table 1). The condition and (no allosteric coupling between sites) was met (Extended Data Fig. 5 and Supplementary Data Table 7). Therefore, the experimentally derived was calculated from the measured binding constants as: (Fig. 3a).
Predicted values:
The value predicted from the WLC model (Fig. 3a) was obtained by applying Eq. [4] with the designated parameter (standard model and ), using a linker length of 71 residues for HAdV5 E1A. The separation between binding sites, , was 49 Å (from PDB:1GUX and PDB:2R7G).
Calculation of predicted global binding affinity for grafted E1A linkers
We predicted the values expected for each of the grafted linker variants of Figure 4c,d under a sequence-independent WLC model or accounting for sequence-dependent changes in the persistence length. We calculated for E1AWT as , wher and are the values for the E1AE2F and E1ALxCxE motifs of E1AWT (reported in Supplementary Data Table 1) and was calculated using the WLC model as described below. Competition experiments for E1AWT typically yield values ~3-fold higher than those obtained by direct titration (Supplementary Data Tables 1 vs 4). To correct for this effect, the predicted values were corrected by a factor of three. Since the only element changing for each grafted variant in the grafting experiment is the linker (i.e. the value), we calculated as , where . All predicted and values for the grafting experiment are reported in the Source Data Files for Figure 5 and Extended Data Figure 10. The values were calculated as follows:
WLC-Lp=3 model:
For the standard assumption of a sequence-independent model (WLC-Lp=3) we calculated the function as a function of linker length using equations (3) and (4) with a standard value for the persistence length parameter . We calculated the expected as a function of linker length as (Straight line, Fig. 4d).
WLC-LpSim model:
For the sequence-dependent model (WLC-LpSim) we calculated for each linker using equations (3) and (4) applying the specific number of residues of each linker and an individual sequence-dependent value for each linker , which was obtained from the simulations. values were calculated from the average end-to-end distance of each simulated ensemble using the equation , where and takes the value 3.8 Å. This equation is an approximation for the value of for a worm like chain in the case where the contour length of the chain is much larger than its persistence length [23].
Calculation of predicted global binding affinity for a large family of E1A linkers
The WLC model was used to estimate the values and global Rb binding affinities of a collection of 110 natural linker sequences of different length changing the length value for each linker and keeping other parameters constant. All values are reported in the Source Data File for Figure 5 and Extended Data Figure 10.
Dataset:
A previously reported alignment and phylogenetic tree of 116 Mastadenovirus E1A sequences [56,58] was used to identify the E2F and LxCxE motifs as described 58, collecting 110 sequences in which both motifs were present (Supplementary Data File 1). For all sequences, the length of the linker region between both motifs was recorded. Individual motif binding affinities, values and E1A global affinity were calculated as explained below (Source Data File for Figure 5 and Extended Data Figure 10).
Calculation of E1A binding affinity:
The global binding affinity (Extended Data Figure 10) was calculated as , where is the value predicted under a naïve or sequence-dependent assumption (see details below) and and are the predicted binding affinites of each motif calculated using FoldX:
Prediction of Motif binding affinities using FoldX:
To estimate the binding affinity of individual E2F and LxCxE motifs ( and ) present in each sequence, FoldX v5.0 [96] was used to build substitution matrices for all 20 amino acids at each position (Source Data File for Extended Data Figure 10). Briefly, given a structural complex the FoldX algorithm assesses the change in binding free energy produced by mutating each position of the motif for each one of the 20 amino acids. For the E2F matrix, the structure of the HAdV5 E1AE2F motif in complex with Rb (PDB: 2R7G) was used as input. For the LxCxE matrix, the structure used as input was a model of the HAdV5 E1ALxCxE motif in complex with Rb (Supplementary Data File 3), built using FlexPepDock [97] and the structure of the HPV E7 LxCxE motif bound to Rb (PDB: 1GUX). The total change in binding free energy with respect to the wild type sequence was calculated by adding up the free energy terms for each residue at each matrix position (Source Data File for Extended Data Figure 10). The predicted equilibrium dissociation constant of the E2F and LxCxE motifs for each sequence was calculated as:
| (5) |
| (6) |
Where is the total predicted change in binding energy calculated using FoldX, RT is 0.582 kcal mol−1, is the experimentally measured binding affinity of the sequence (HAdV5 E1A) present in the model structure ( and measured in this work, Supplementary Data Table 1).
Prediction of values under the naïve WLC model:
The value was calculated for the collection of 110 natural E1A linkers using Equations (3) and (4) with WLC, Fig. 5a) and the specific length (number of residues) of each linker, which defines .
Prediction of values using a WLC model with sequence-dependent parameters:
For the subset of 27 natural E1A linkers used in all-atom simulations (Fig. 4a) we calculated sequence-specific values from all atom simulations in order to represent sequence-dependent changes in chain expansion. The details of these calculations are explained under the Methods section “Calculation of predicted global binding affinity for grafted E1A linkers”. New values were derived using the same parameters described above, but replacing the standard value by the value. The Lp Sim values are reported in the Source Data File for Extended Data Figure 10.
Statistical analysis.
We used bootstrapping [98] to generate 99% confidence intervals (CI) for and average values, and compared the lower and upper end points against the value of (1 10−9 M). The lower bound of the 99% CI for and is higher than and the upper bound of the 99% CI for all are lower than . We also used permutation tests [98] to assess the null hypothesis that the and average average values did not differ between all pairs of groups. In order to control for the false discovery rate, the p-values were corrected using the Benjamini-Hochberg [99] correction for multiple comparisons.
Calculations of disorder propensity and conservation:
All calculations were performed on the dataset from Supplementary Data File 1, using the methods described in [58]. For disorder propensity we recorded the mean IUPRED value ± SD per position using IUPRED 2a [100] and for residue conservation we recorded the information content (IC) per position.
Sequence conservation and Evolutionary Scores
We collected 77 mammalian orthologous sequences of the Retinoblastoma protein with no unassigned residues within the pocket domain from the Ensembl Database [101]. Sequences were aligned using MUSCLE v3.8.1551 and manually curated according to structural information. The evolutionary conservation scores were calculated with the Consurf 2016 webserver [102] using the E7-Rb complex (PDB: 1GUX) as the structural model. The sequence analyses and alignment graphics were performed using Jalview v2.11 [103]. The alignment was coloured according to residue identity and conservation scores calculated according to [104]. We analyzed the conservation of residues making up the E2F and LxCxE motif binding sites according to previously reported contacts [40,41]. Results are presented in Supplementary Fig. 1.
Structural Modeling
The structures of the human Rb (RbAB pocket domain) bound to E1A (PDB: 2R7G) and E7 (PDB: 1GUX), and the structure from the human paralogue p107 pocket domain (PDB: 4YOZ) were collected from the protein data bank. Structural modeling of the human paralogue p130, and the retinoblastoma pocket domains from Macaque (Macaca mulatta), Chimpanzee (Pan troglodytes), Dog (Canis lupus familiaris), Microbat (Myotis lucifugus), Sheep (Ovis aries), Pig (Sus scrofa), Cow (Bos taurus), Horse (Equus caballus) and Tree shrew (Tupaia belangeri) were obtained by using Alphafold v2.0 [105] implemented in ColabFold v1.0 [106]. The template multiple sequence alignments were generated using MMseqs2 [107] implemented within ColabFold v1.0. Template information and the predicted structure relaxation using amber force fields, were included. The distance between the E2F and LxCxE binding sites were measured between the alpha carbons of the C-terminal anchor site of the E2F cleft and the N-terminal anchor site of the LxCxE cleft. Molecular graphics and analyses were performed with UCSF Chimera v1.5 [108]. Results are presented in Extended Data Fig. 9.
Extended Data
EXTENDED DATA FIGURE 1: Biophysical characterization of recombinant Rb and E1A proteins.
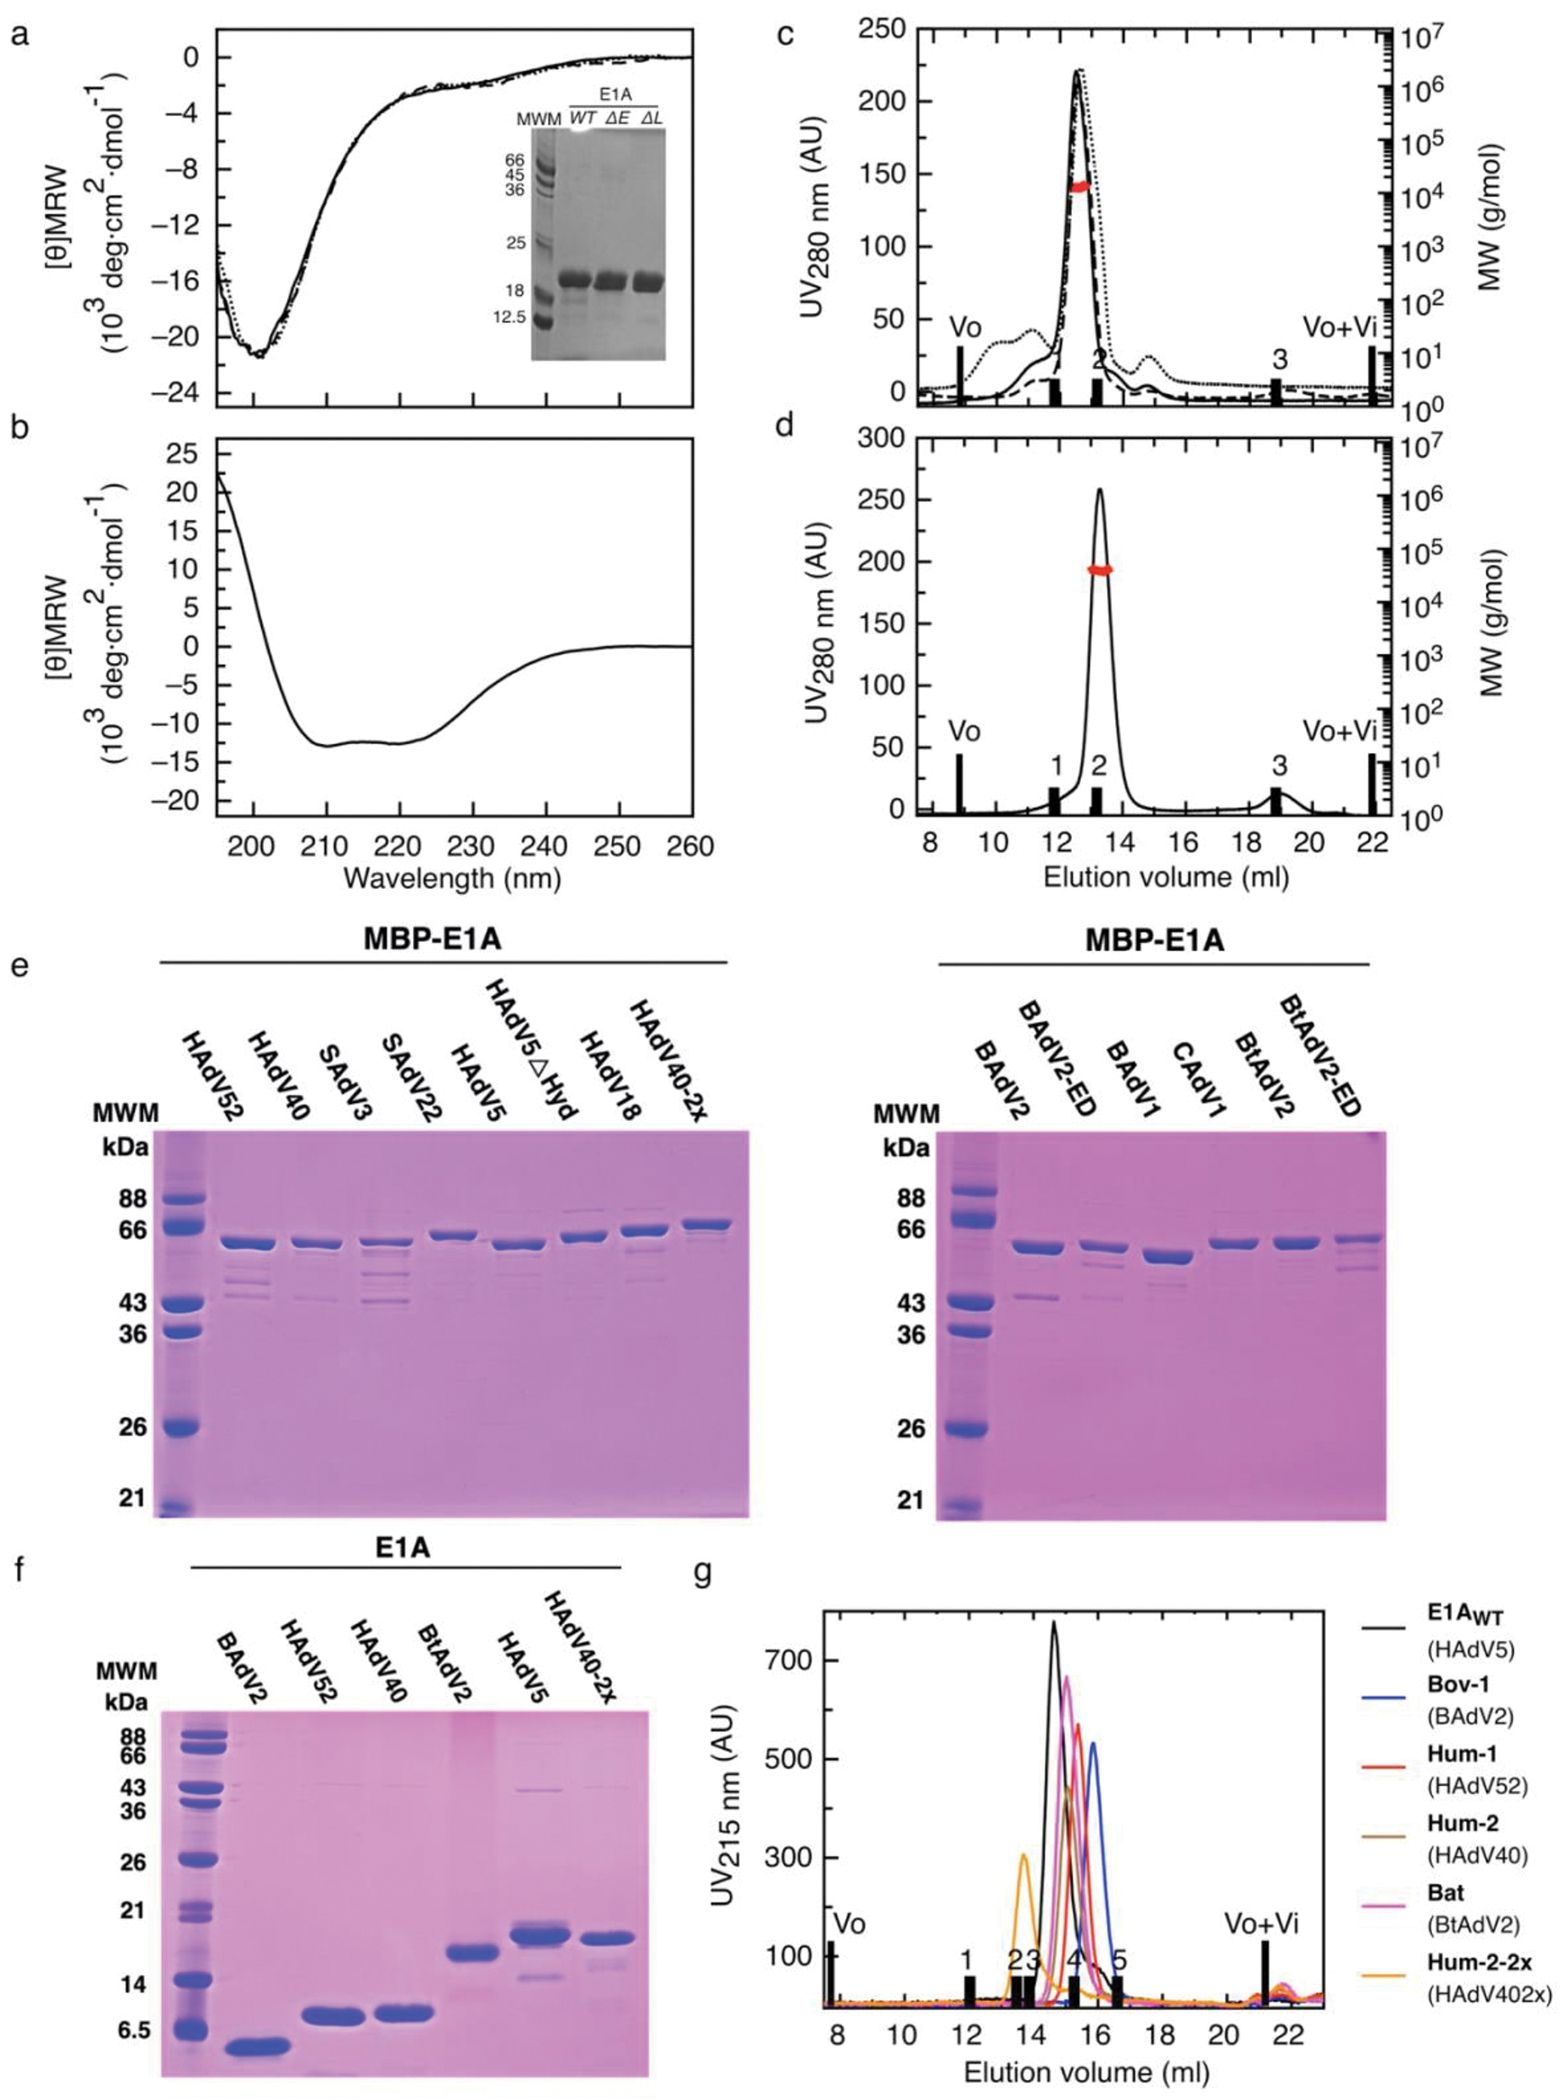
a) Far UV-CD spectra of E1AWT (solid line), E1AΔΕ (dotted line), E1AΔL (dashed line). Inset: 15% SDS-PAGE gel of purified recombinant E1A proteins (purity > 90%). b) Far UV-CD spectrum of the Rb (RbAB domain). c) SEC-SLS experiments of E1AWT (solid line), E1AΔΕ (dotted line) and E1AΔL (dashed line). d) SEC-SLS experiment of Rb. For b) and c), black bars correspond to the elution volume of globular protein markers: BSA 66 kDa (1), MBP 45 kDa (2) and Lysozyme 14.3 kDa (3). Black line: SEC profile, red line: measurement of the molecular weight. e) 12.5% SDS-PAGE of MBP-E1A fusion protein variants. Gel1: Grafting of selected linkers from Human and Simian E1A proteins into the E1AWT construct containing the HAdV5 motifs. Types are: HAdV52, HAdV40, SAdV3, SAdV22, HAdV5, HAdV5!Hyd, HAdV18, HAdV40–2x. Gel 2: Grafting of linkers from Bovine, Canine and Bat E1A proteins into the E1AWT sequence and endogenous variants carrying the cognate motifs for each species: BAdV2, BAdV2-ED, BAdV1, CAdV1, BtAdV2 and BtAdV2-ED. f) 17% SDS-PAGE of cleaved E1A protein variants: BAdV2, HAdV52, HAdV40, BtAdV2, HAdV5 and HAdV40–2x. g) Size exclusion chromatography experiment performed on a Superdex 200 column to determine of cleaved E1A variants. Black bars correspond to Vo and Vo+Vi, and to the elution volume of globular protein markers: Gamma Globulin 150 kDa (1), Transferrin 80 kDa (2), BSA 66 kDa (3) MBP 45 kDa (4) and Trypsin Inhibitor 21 kDa (5). The E1A types are referenced to the names used in Fig. 4d.
EXTENDED DATA FIGURE 2: Representative ITC binding isotherms for Rb:peptide/protein complexes.
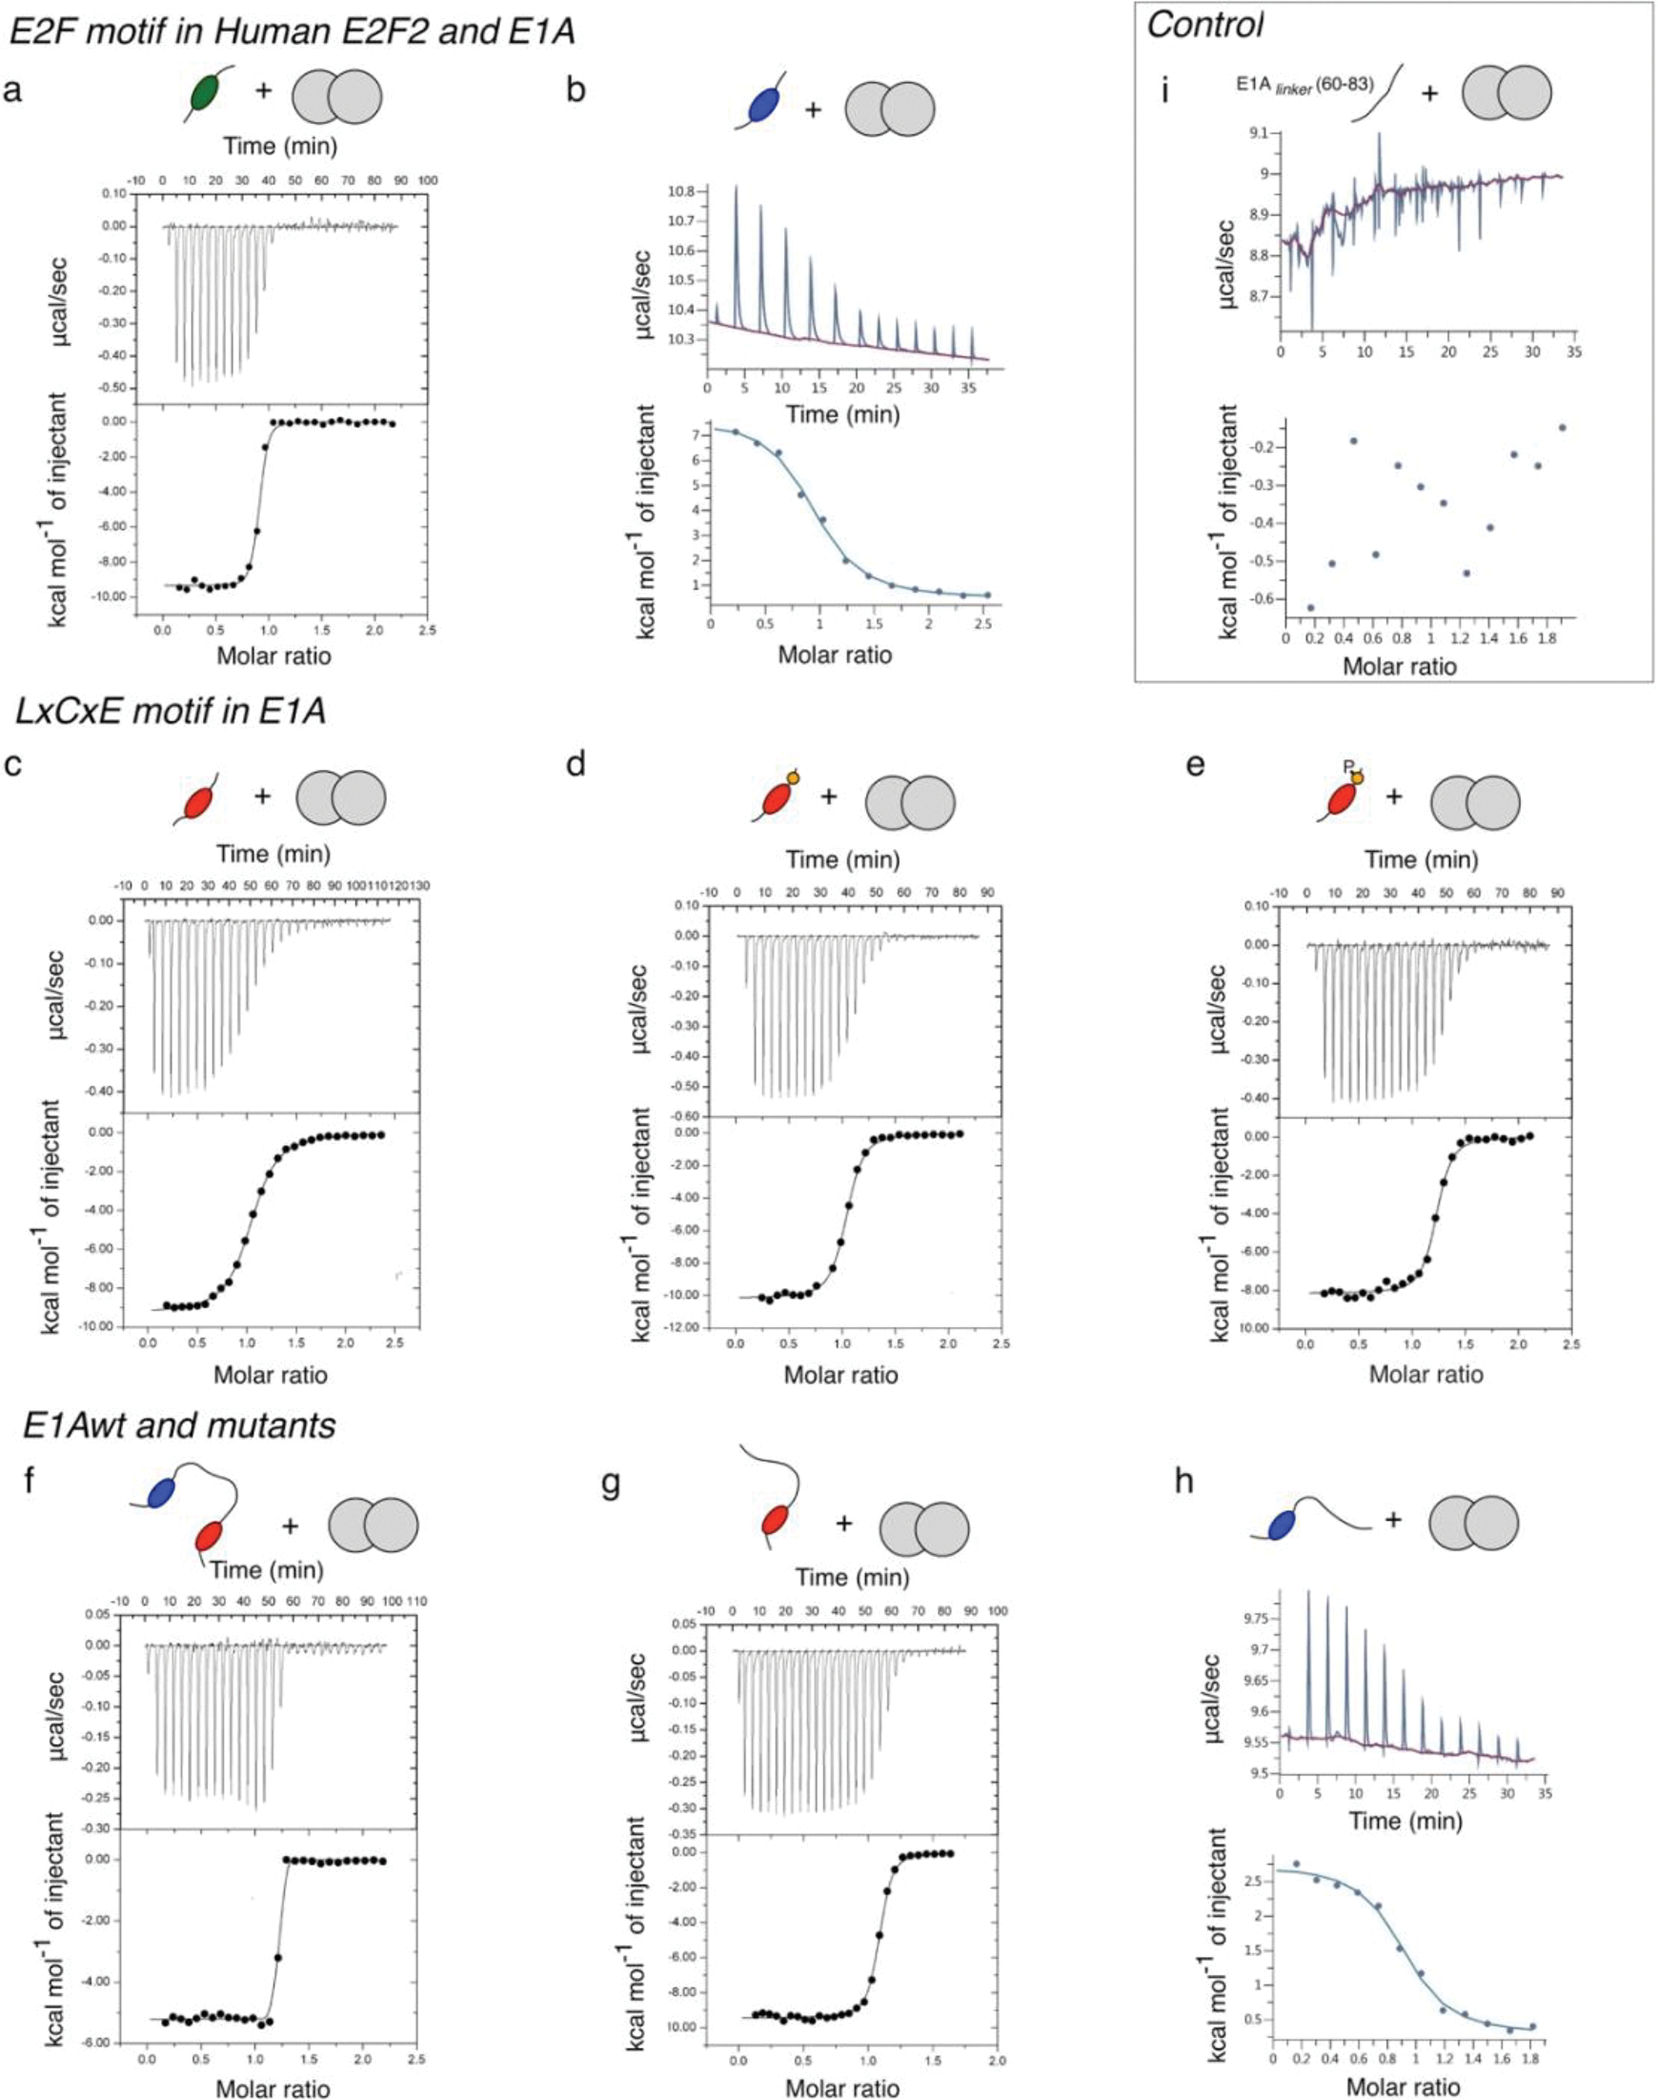
Measurements were performed loading the cell with Rb solution and the syringe with the different peptides or proteins as titrants. Panels show heat exchanged as a function of time (upper panel), and the enthalpy per mole of injectant plotted as a function of [peptide/protein]/[Rb] molar ratio (lower panel, black circles) and the corresponding fit using a single site binding model (lower panel, black lines). Binding traces here represented correspond to: a) Rb (5 μM) and Human E2F2 (50 μM); b) Rb (30 μM) and E1AE2F (300 μM); c) Rb (15 μM) and E1ALxCxE (150 μM); d) Rb (15 μM) and E1ALxCxE-AC (150 μM); e) Rb (15 μM) and E1ALxCxE-ACP (150 μM); f) Rb (15 μM) and E1AWT (150 μM); g) Rb (15 μM) and E1AΔE (150 μM); h) Rb (30 μM) and E1AΔL (300 μM). Thermodynamic parameters derived from the fitting are shown in Supplementary Data Table 1. Exothermic binding to Rb was observed for the Cellular E2F2 peptide and E1A peptides and protein fragments harboring the LxCxE motif, while E1AE2F and E1AΔL harboring only the E1A E2F motif clearly showed an endothermic behavior. i) ITC curve of a peptide corresponding to the TAZ2 region in the E1A linker (63–80) that showed intensity decreases in the NMR experiments (Fig. 2) binding to Rb. The titration was performed at 30 μM Rb and 300 μM E1A linker peptide at 20 °C. A schematic representation of each interacting pair is shown above the ITC traces: Rb (grey double circle) and each peptide/protein, where binding motifs are represented as follows: Human-E2F2 (green oval), E2F motif (blue oval), LxCxE motif (red oval), LxCxE acidic stretch (orange circle), phosphorylation (letter P).
EXTENDED DATA FIGURE 3: Fluorescence Spectroscopy titration experiments of E1A-Rb and E2F-Rb interactions.
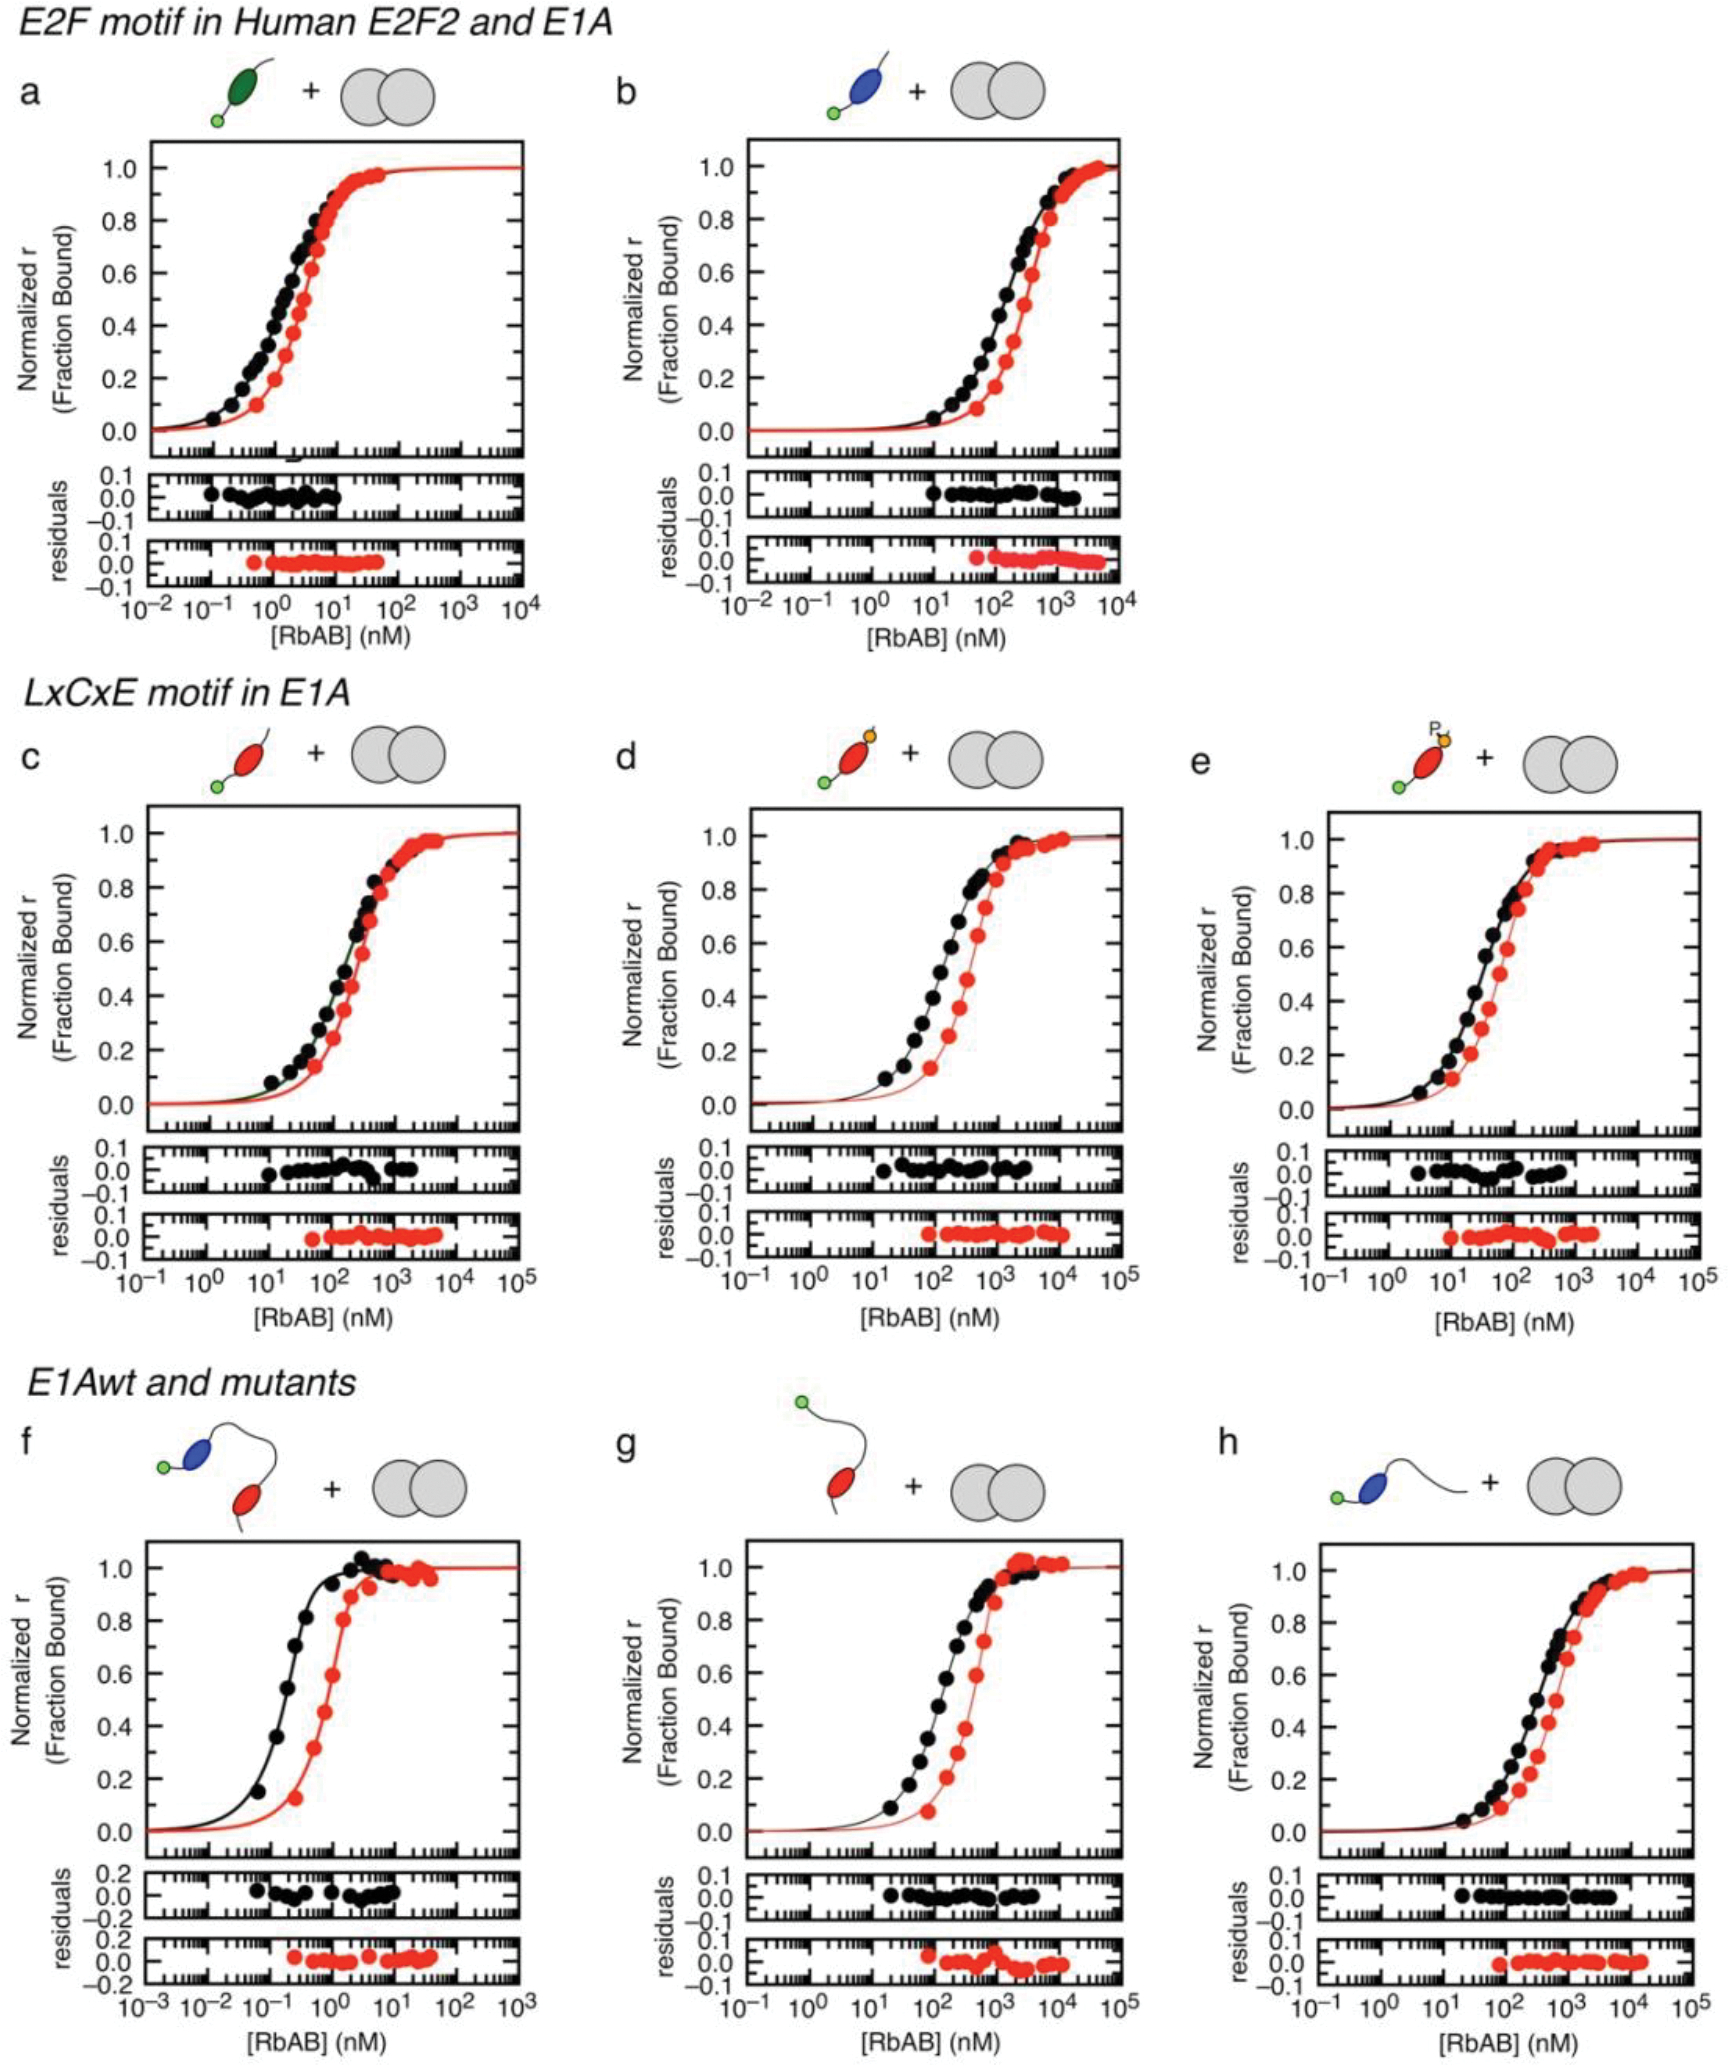
Representative titration binding curves at equilibrium for each FITC-labeled peptide/protein-Rb interaction tested in this work. Normalized anisotropy signals (circles) are shown, along with the global fit to a 1:1 binding model (lines) that yielded the value. The residuals for the fit are shown in the lower panels. Binding traces here represented correspond to two probe (FITC-labeled peptide/protein) concentrations: a) Cellular E2F2: 1 nM (black) and 5 nM (red); b) E1AE2F: 100 nM (black) and 500 nM (red); c) E1ALxCxE: 100 nM (black) and 500 nM (red); d) E1ALxCxE-AC: 130 nM (black) and 700 nM (red); e) E1ALxCxEACP: 30 nM (black) and 100 nM (red); f) E1AWT: 0.5 nM (black) and 2 nM (red); g) E1AΔE: 200 nM (black) and 800 nM (red); h) E1AΔL: 200 nM (black) and 800 nM (red). The values obtained by global fitting to a 1:1 model (Supplementary Data Table 1) were in excellent agreement with those obtained when fitting individual binding curves using non-normalized anisotropy or fluorescence data (Supplementary Data Table 2). A schematic representation of each interacting pair is shown above the binding traces: Rb (grey double circle); FITC-moiety at the N-terminus of the sequence (light green circle). Binding motifs are represented as follows: Human-E2F2 (green oval), E2F motif (blue oval), LxCxE motif (red oval), acidic stretch (orange circle), phosphorylation (letter P). The linker is represented by a black line.
EXTENDED DATA FIGURE 4: NMR experiments of [Rb:E1A] complexes.
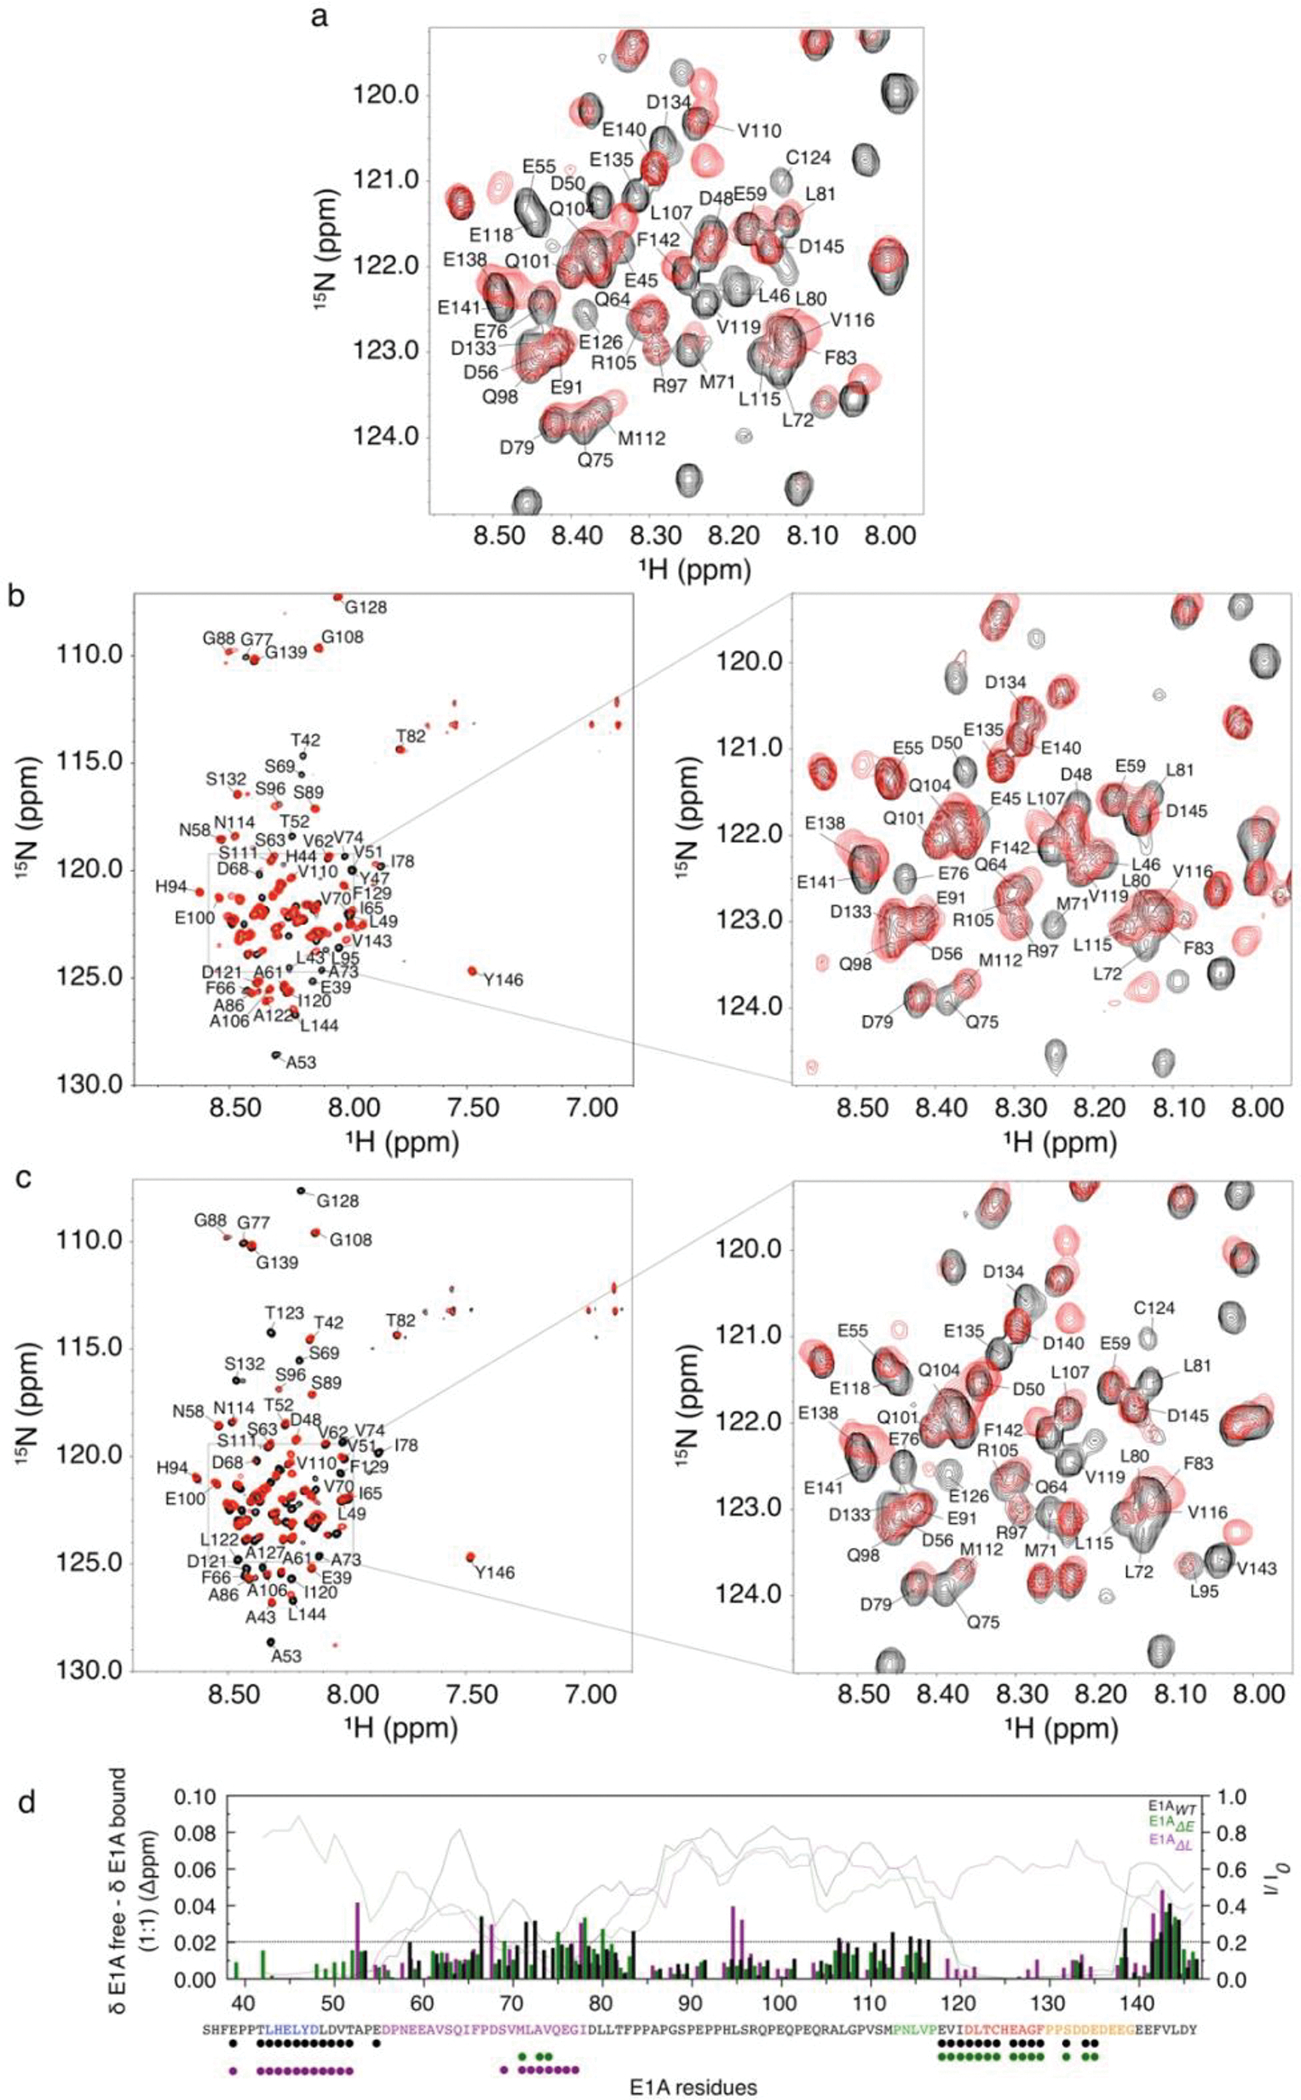
a) Central region of 1H-15N TROSY spectra of free 15N-labeled E1A (black) and a 1:1 molar ratio complex of 15N-labeled E1A and unlabeled Rb (red) at 525 μM, with assigned peaks of the free form indicated. The full spectrum of this complex is shown in Fig. 2 a, b) Left panel: Overlay of the 1H-15N TROSY spectra of free 15N-labeled E1AΔL (black) and a 1:1 molar ratio complex of 15N -labeled E1AΔL and unlabeled Rb (red) at 315 μM. Right panel: central region of the spectra with assigned peaks of the free form indicated c) Left panel: Overlay of the 1H-15N TROSY spectra of free 15N-labeled E1AΔE (black) and a 1:1 molar ratio complex of 15N-labeled E1AΔE and unlabeled Rb (red) at 315 μM. Right panel: central region of the spectra with assigned peaks of the free form indicated. The low chemical shift dispersions in the 1H dimension for E1AΔL and E1AΔE denote their disordered nature, like that seen in E1A. There is no change in peak dispersion upon binding with Rb, indicating that linker regions of the E1AΔL and E1AΔE mutants remain largely disordered in the [E1AΔL :Rb] and [E1AΔE:Rb] complexes. d) Plot of chemical shift changes upon binding as a function of residue number for E1AWT, E1AΔL and E1AΔE. Dashed line at 0.2 ppm corresponds to the digital resolution of the experiment. The small chemical shift changes for almost all of the linker residues suggest very little if no interaction with Rb. I/I0 ratio is overlaid for comparison (colored lines). Dots on the bottom correspond to the residues of each variant whose 1H-15N intensities in the bound state is = 0, so the chemical shift changes could not be measured.
EXTENDED DATA FIGURE 5: Analysis of allosteric effects in the formation of the Rb-E1A complex.
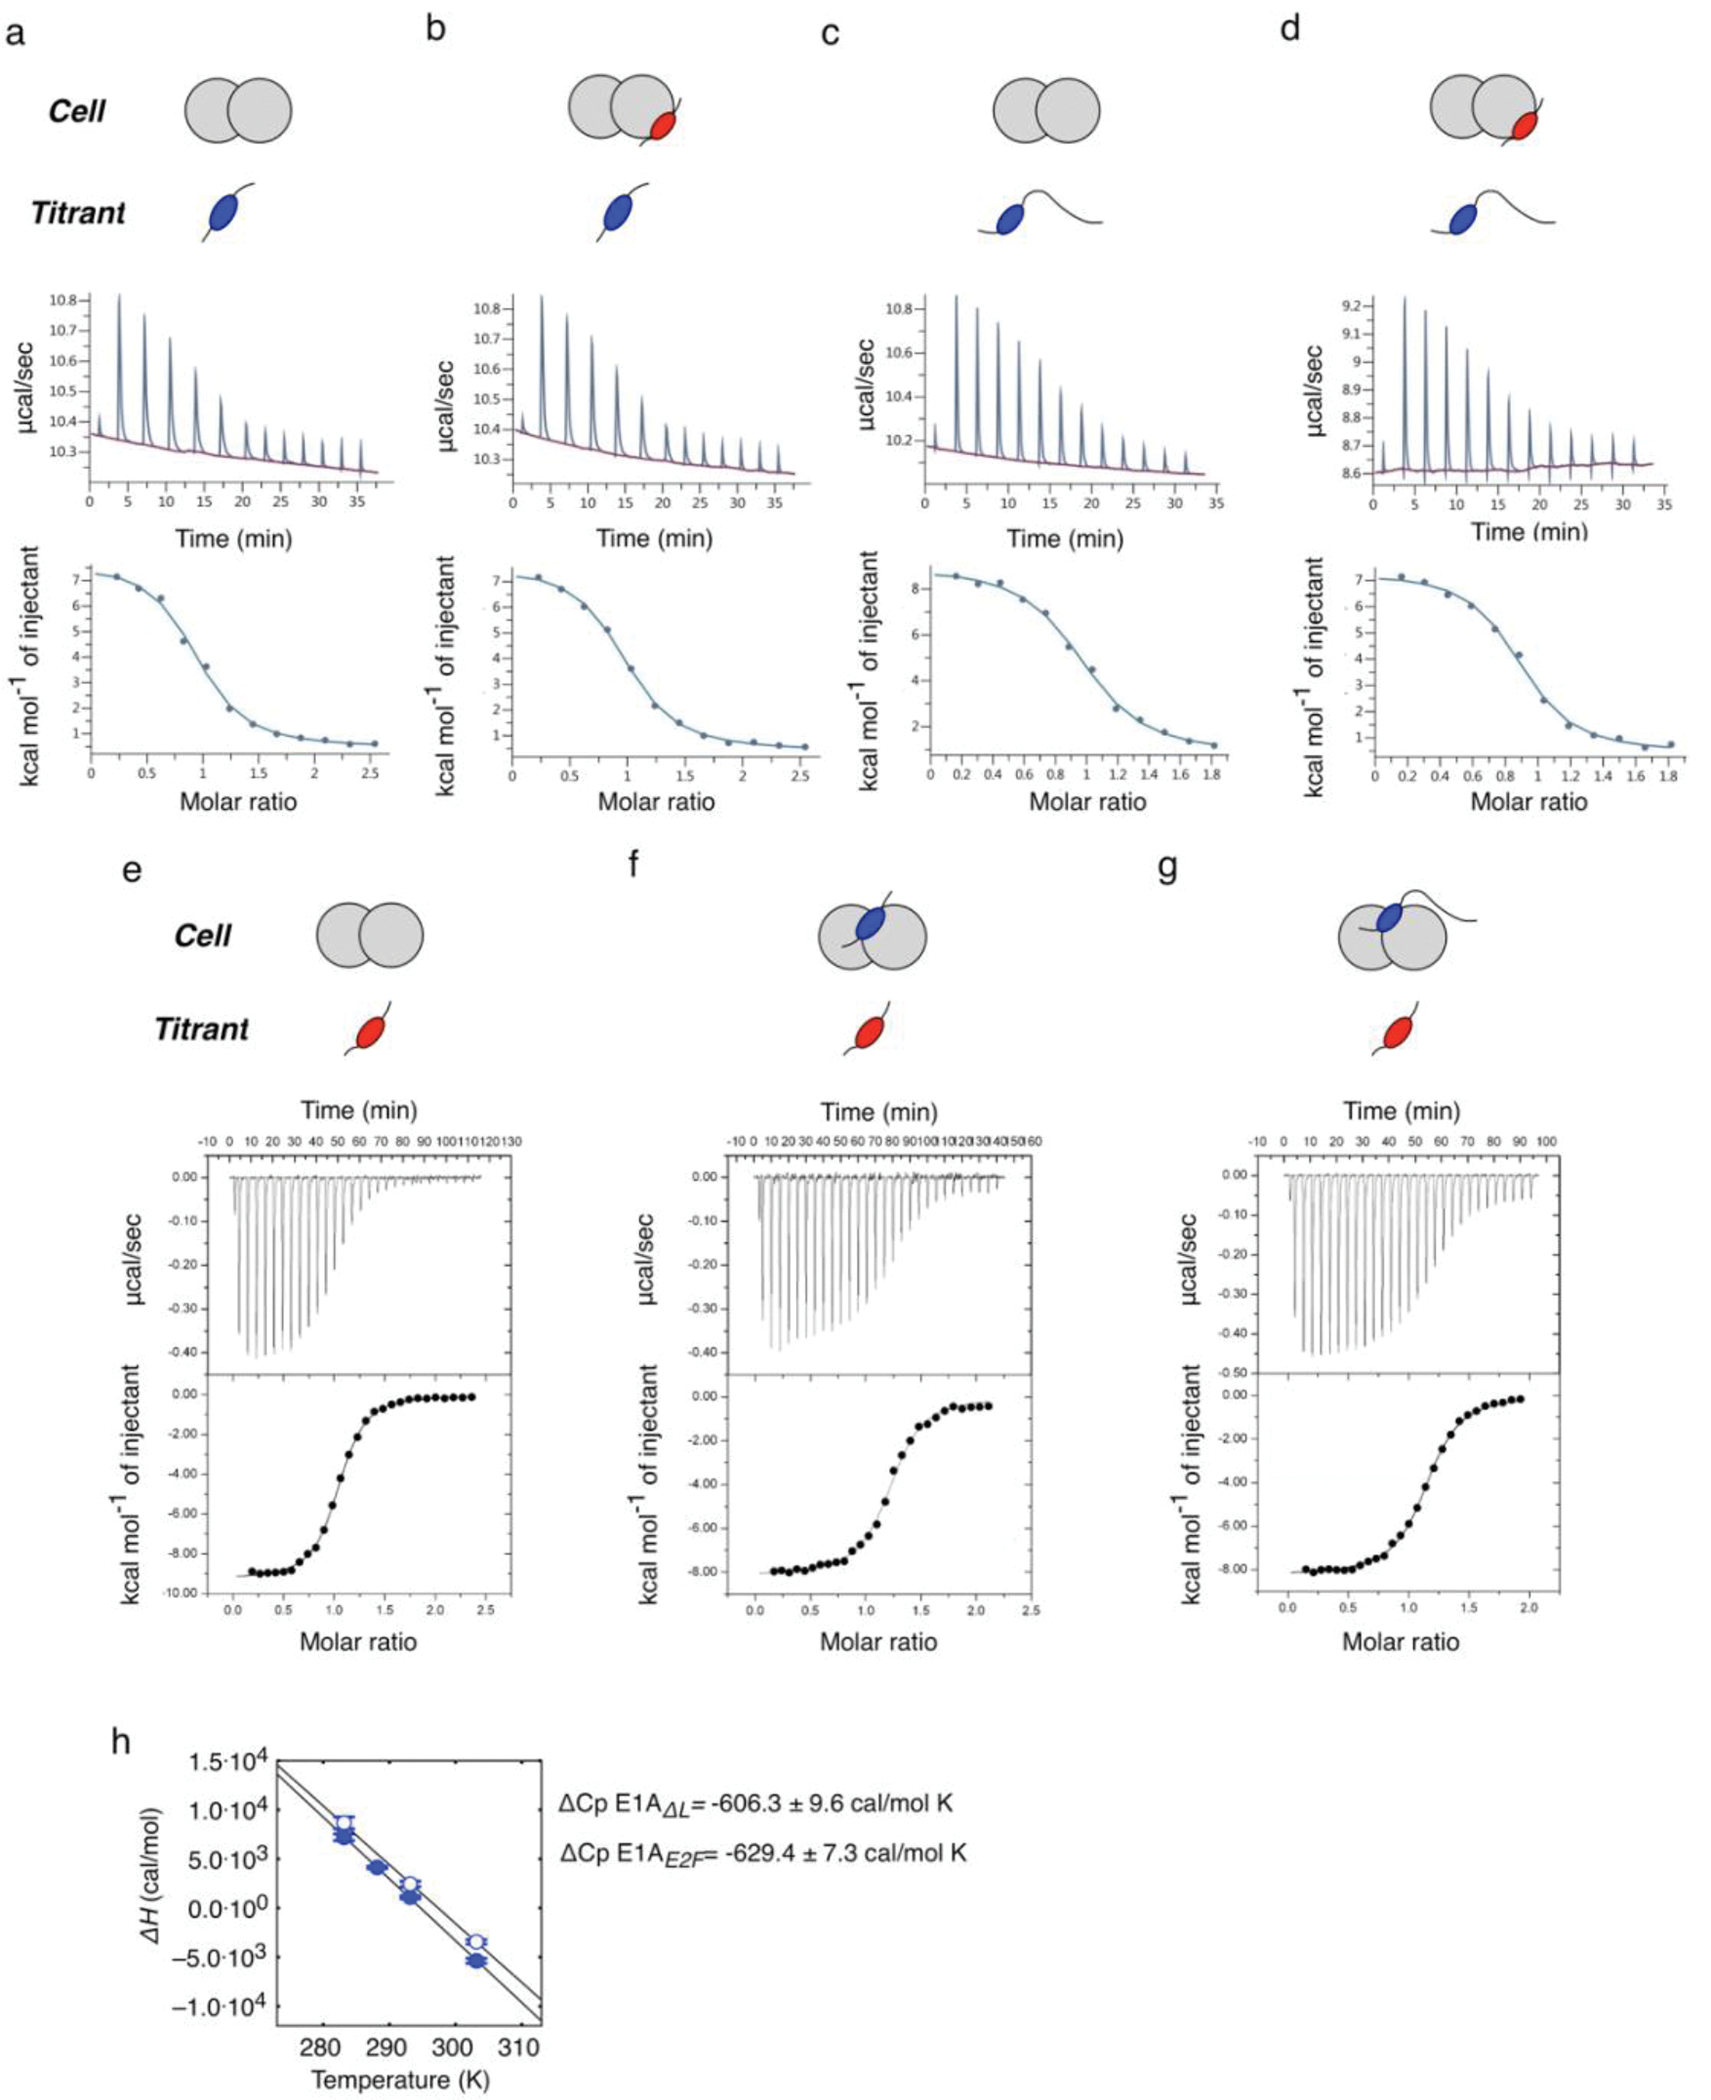
Measurements were performed by loading the cell with Rb or with a pre-assembled complex of Rb with peptide/proteins containing one of the interacting motifs and titrating with peptide/proteins containing the complementary motif loaded into the syringe. Panels show heat exchanged as a function of time, (upper panel) and the enthalpy per mole of injectant plotted as a function of [peptide or protein]/[Rb] molar ratio (Lower panel, black circles) along with the corresponding fit using a single site binding model (Lower panel, black lines). Binding traces correspond to: a) Rb (30 μM, cell) titrated with E1AE2F (300 μM, syringe) at 10 °C; b) [E1ALxCxE:Rb] (30 μM, cell) titrated with E1AE2F (300 μM, syringe) at 10 °C; c) Rb (30 μM, cell) titrated with E1AΔL(300 μM, syringe) at 10 °C; d) [E1ALxCxE:Rb] (30 μM, cell) titrated with E1AΔL (300 μM, syringe) at 10 °C; e) Rb (15 μM, cell) titrated with E1ALxCxE (150 μM, syringe) at 20 °C; f) [E1AE2F:Rb] (15μM, cell) titrated with E1ALxCxE (150 μM, syringe) at 20 °C; g) [E1AΔL:Rb] (15 μM, cell) titrated with E1ALxCxE (150 μM, syringe) at 20 °C. Thermodynamic parameters derived from the fitting are shown in Supplementary Data Table 1. A schematic representation of each titration design is shown above the ITC traces: Rb: grey double circle, E2F motif: blue oval, LxCxE motif: red oval. The E1A linker is depicted as a black line. h) ITC measurements of E1AE2F and E1AΔL at different temperatures. The heat capacity change (ΔCp) was calculated from the slope of the plot of ΔH vs temperature. E1AE2F: filled blue bars; E1AΔL: open blue bars. Thermodynamic parameters are reported in Supplementary Data Table 5.
EXTENDED DATA FIGURE 6: SAXS analysis of Rb, E1A and the [E1AWT:Rb] complex.
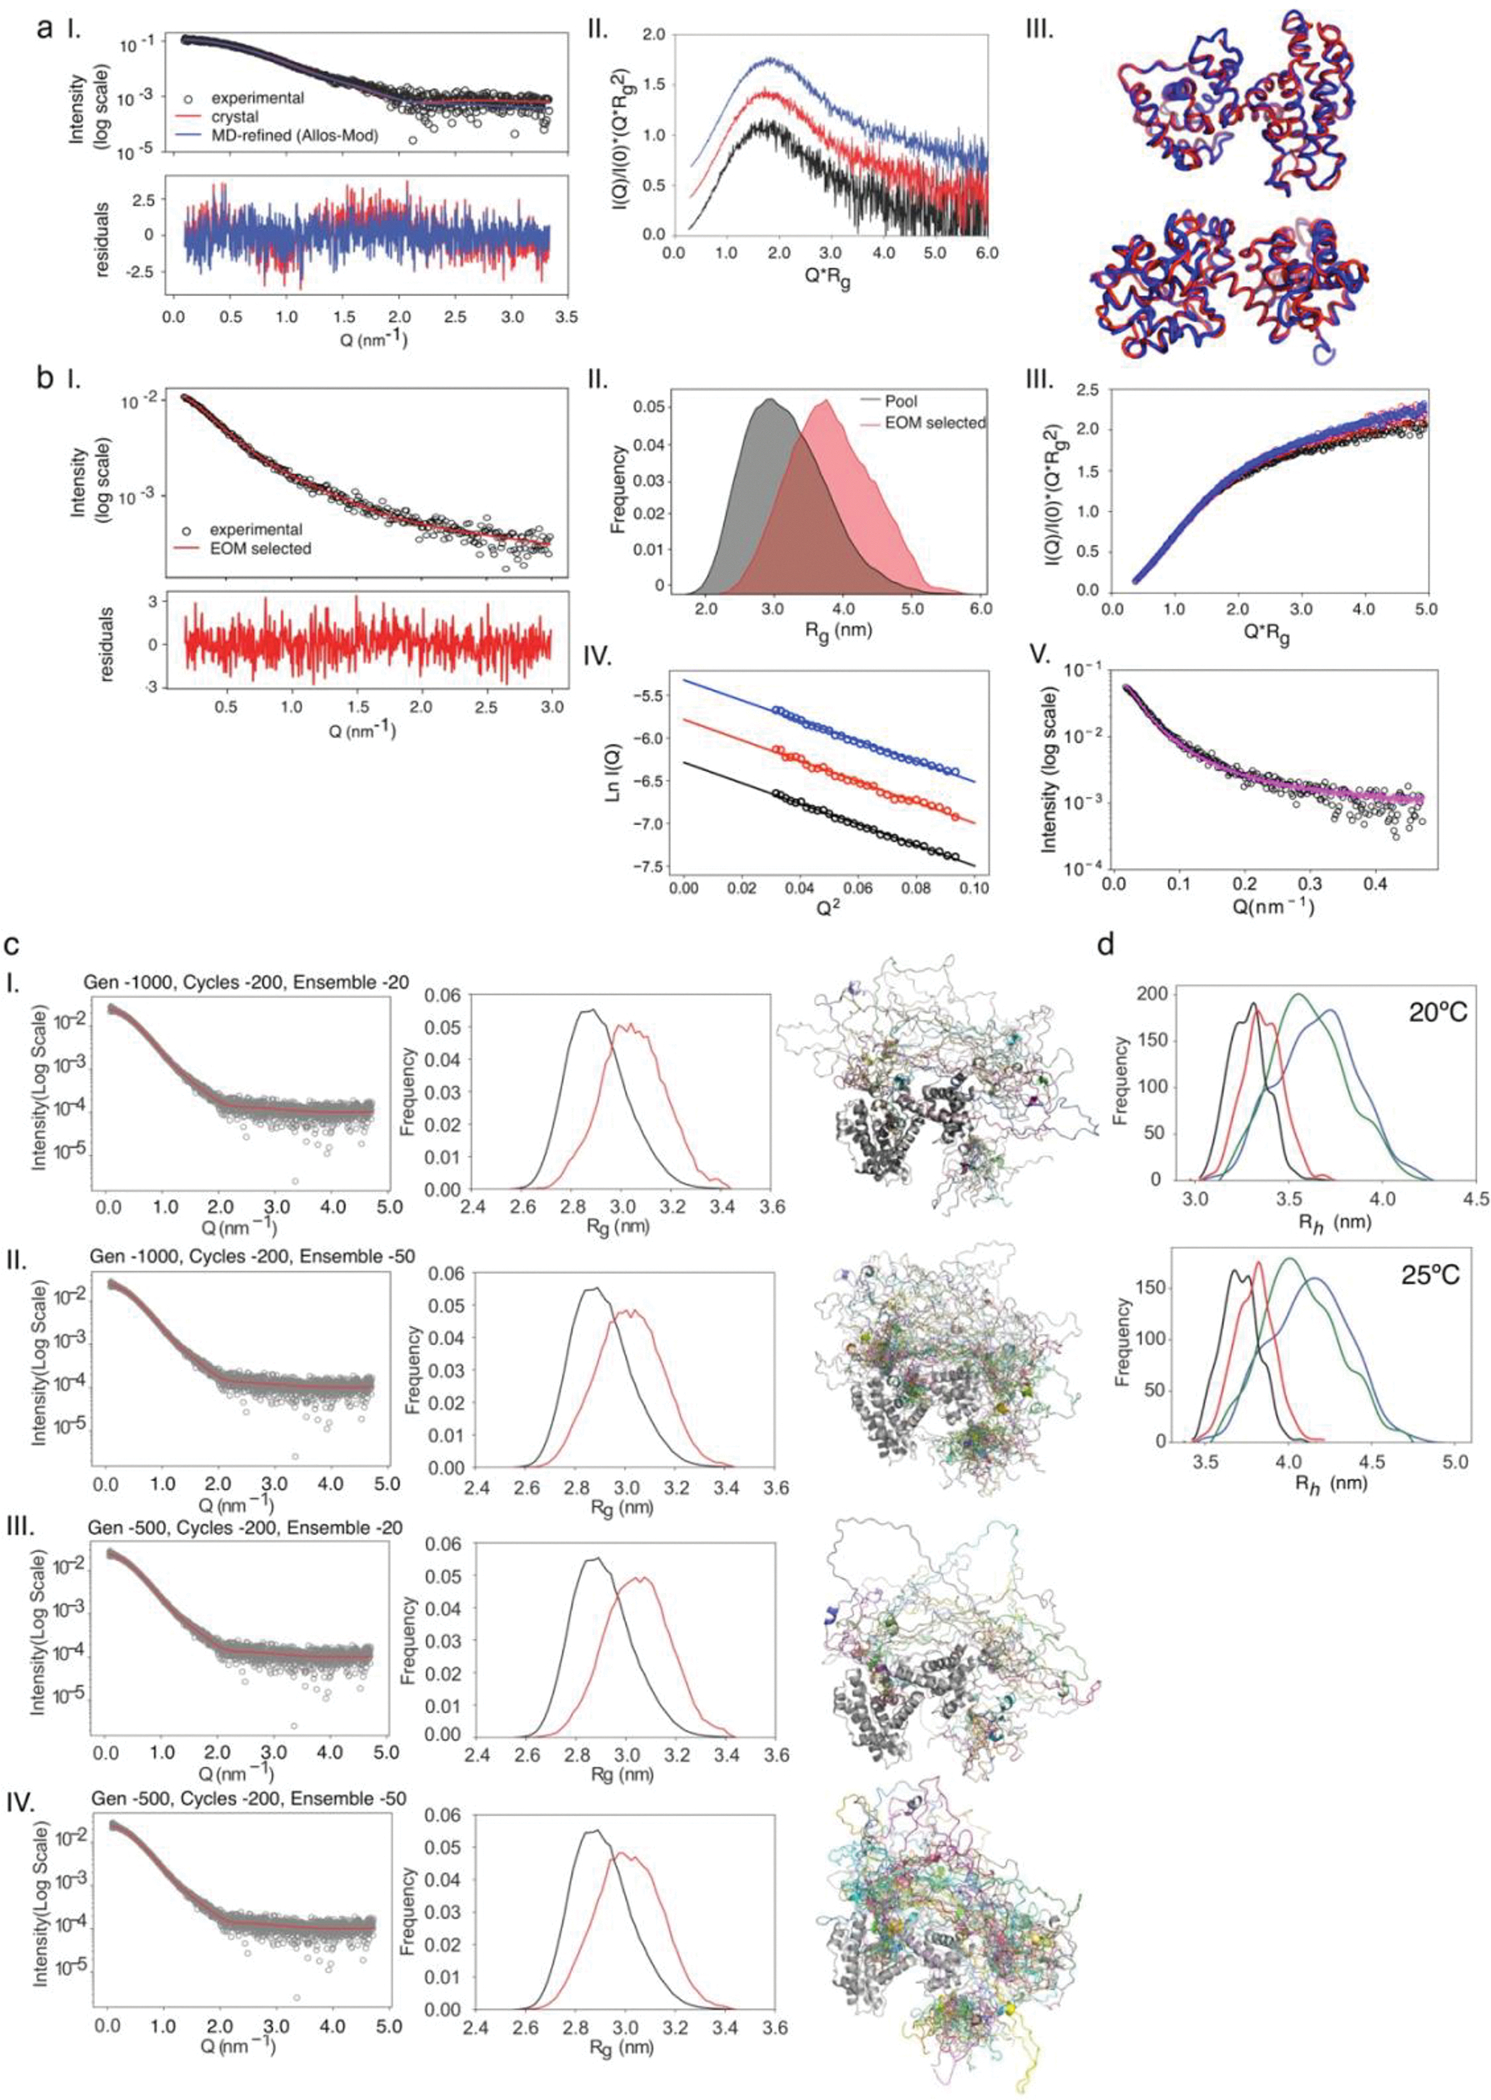
a) I. Experimental SAXS intensity profile (black empty circles) versus theoretical profiles obtained from the crystal structure of the unliganded RbAB domain (PDB ID: 3POM) (red line) or a refined model where flexible loops were added (Allos-Mod-FoXS, blue line). Residuals are shown below the fits. II. Kratky plots of Rb at 4.0 mg/ml (blue line), 2.0 mg/ml (red line) and 1.0 mg/ml (black line). III. Orthogonal views of the RbAB crystal structure (red) and optimized model (blue) (RMSD = 1.7 Å). b) I. SAXS intensity profile of E1AWT (black circles) and the best fit from the EOM method (red line). Below, residual of the fit. II. Rg distribution of the E1AWT ensemble pool (black area) and EOM-selected ensemble (red area). III-IV. Kratky plots (III) or Guinier plots (IV) of E1AWT at 7.0 mg/ml (blue empty circles), 5.6 mg/ml (red empty circles) and 4.2 mg/ml (black empty circles). V. Overlay of SEC-SAXS profile of E1AWT (blue empty circles) and the merged curve from SAXS experiments at three concentrations (pink line). c) Theoretical SAXS profiles computed for a pool of 10250 [E1AWT:Rb] structures compared to experimental SAXS profiles and EOM fitting. Four fitting conditions are shown: I. 1000 generations with ensemble size N = 20, II. 1000 generations with N = 50, III. 500 generations with N = 20 and IV. 500 generations with N = 50. Left: experimental SAXS intensity profiles (grey circles) and EOM fitting (red lines). Middle: distributions of pool ensembles (black line) and EOM-selected sub-ensembles (red line). Right: EOM-selected sub-ensembles. Fitting condition II is presented in Fig. 3. d) Calculated for [E1AWT:Rb] (black) [E1AΔE:Rb] (green) and [E1AΔL:Rb] (blue) pool ensembles and the EOM-selected [E1AWT:Rb] sub-ensemble (red).
EXTENDED DATA FIGURE 7: Correlation of E1A linker dimensions with sequence-encoded features.
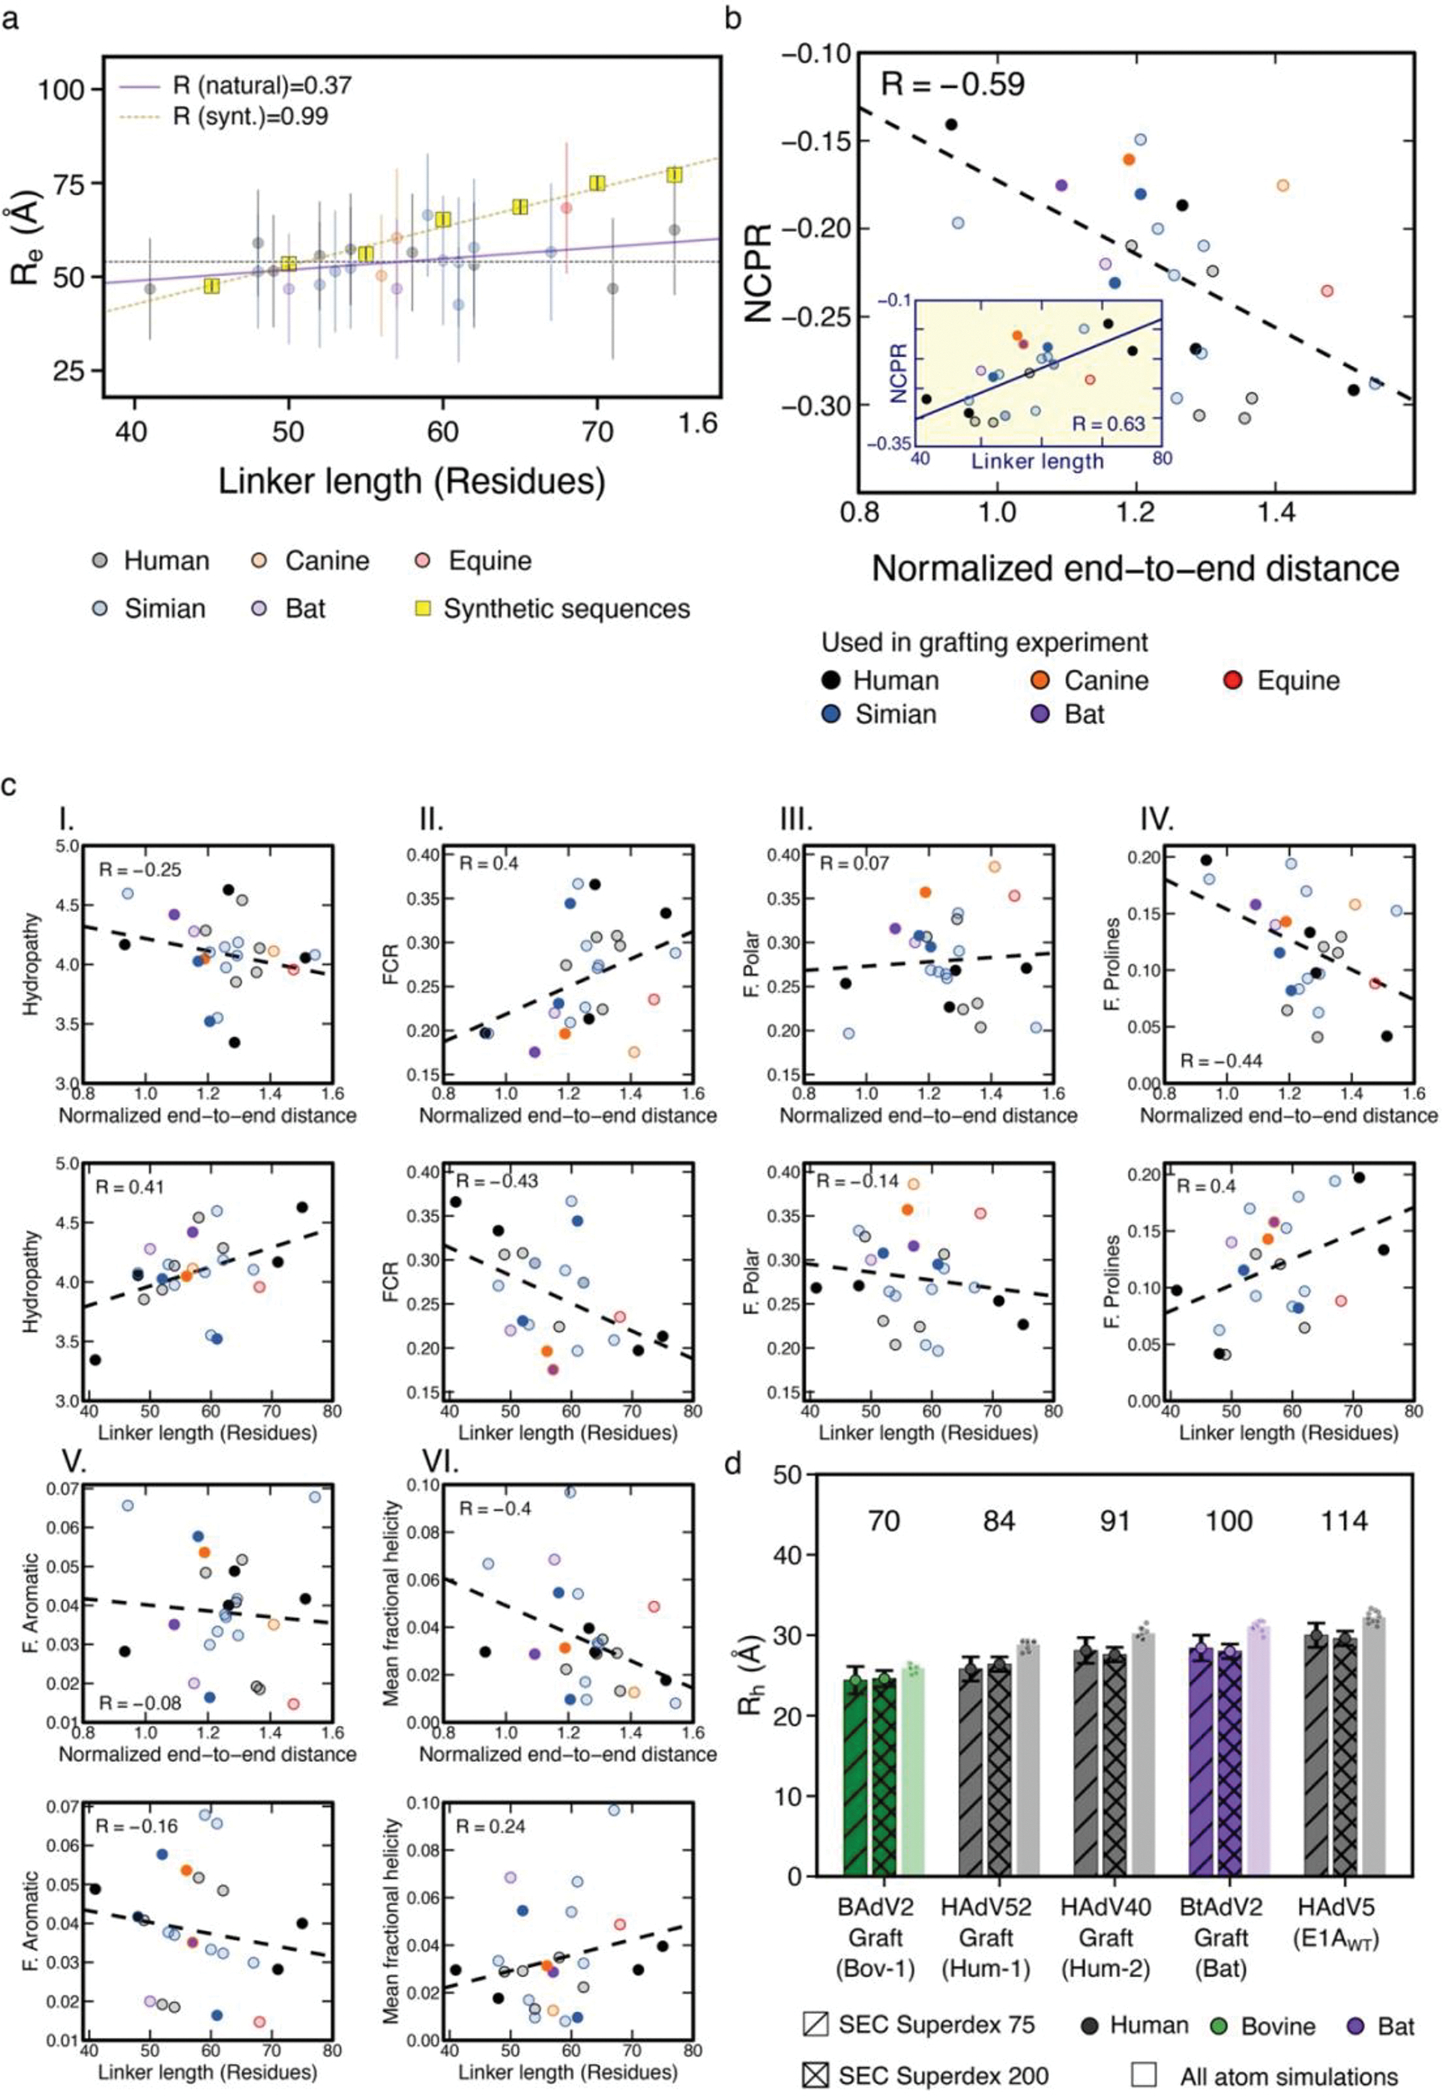
a) Linker length control titration experiment. End-to-end distance () of natural sequences (colored circles) compared to synthetic sequences of varying length and constant sequence composition matching the HF_HAdV40 linker (yellow squares). Natural sequences: n=15 independent simulations were run for each sequence, points represent the mean value and error bars represent the standard deviation over the population obtained from the total ensemble from 15 simulations. Synthetic sequences: n=20 random permutations were generated for each length and simulated under equivalent conditions. The mean value (yellow square) is a double average over both conformational space and sequence space. Lines within the yellow squares represent the standard error of the mean across all simulations of a given length, shown to confirm that all random permutations have very similar values. b) Net-charge per residue (NCPR) as a function of normalized end-to-end distance for the 27 linkers of Fig. 4a. Inset: NCPR as a function of linker length. Sequences used in the grafting experiment are shown as solid circles and the rest as transparent circles. R = Pearson’s correlation coefficient. c) Correlation between distinct sequence parameters and normalized end-to-end distance (upper panels) or linker length (lower panels) (Supplementary Text 1). R = Pearson’s correlation coefficient. Most R values are < 0.3 with several exceptions. d) Hydrodynamic radius () for motif-linker-motif constructs of five cleaved E1A variants (shown in Extended Data Fig. 1 f, g). The length of each construct is indicated above each bar. was determined from size exclusion chromatography run on Superdex 75 (n=1, striped colored bars) or Superdex 200 (n=1, cross-hatched colored bars). The height of each bar indicates the estimated value and the error bars represent the standard deviation obtained from interpolation in the −logMW vs Kav calibration curve (see Methods). was also predicted from all-atom simulations (colored bars). The height of each bar represents the mean value from ten independent simulations of each construct (n=10), while each individual marker is the mean of each independent simulation.
EXTENDED DATA FIGURE 8: E2F displacement ability and Rb-binding affinity of E1A variants.
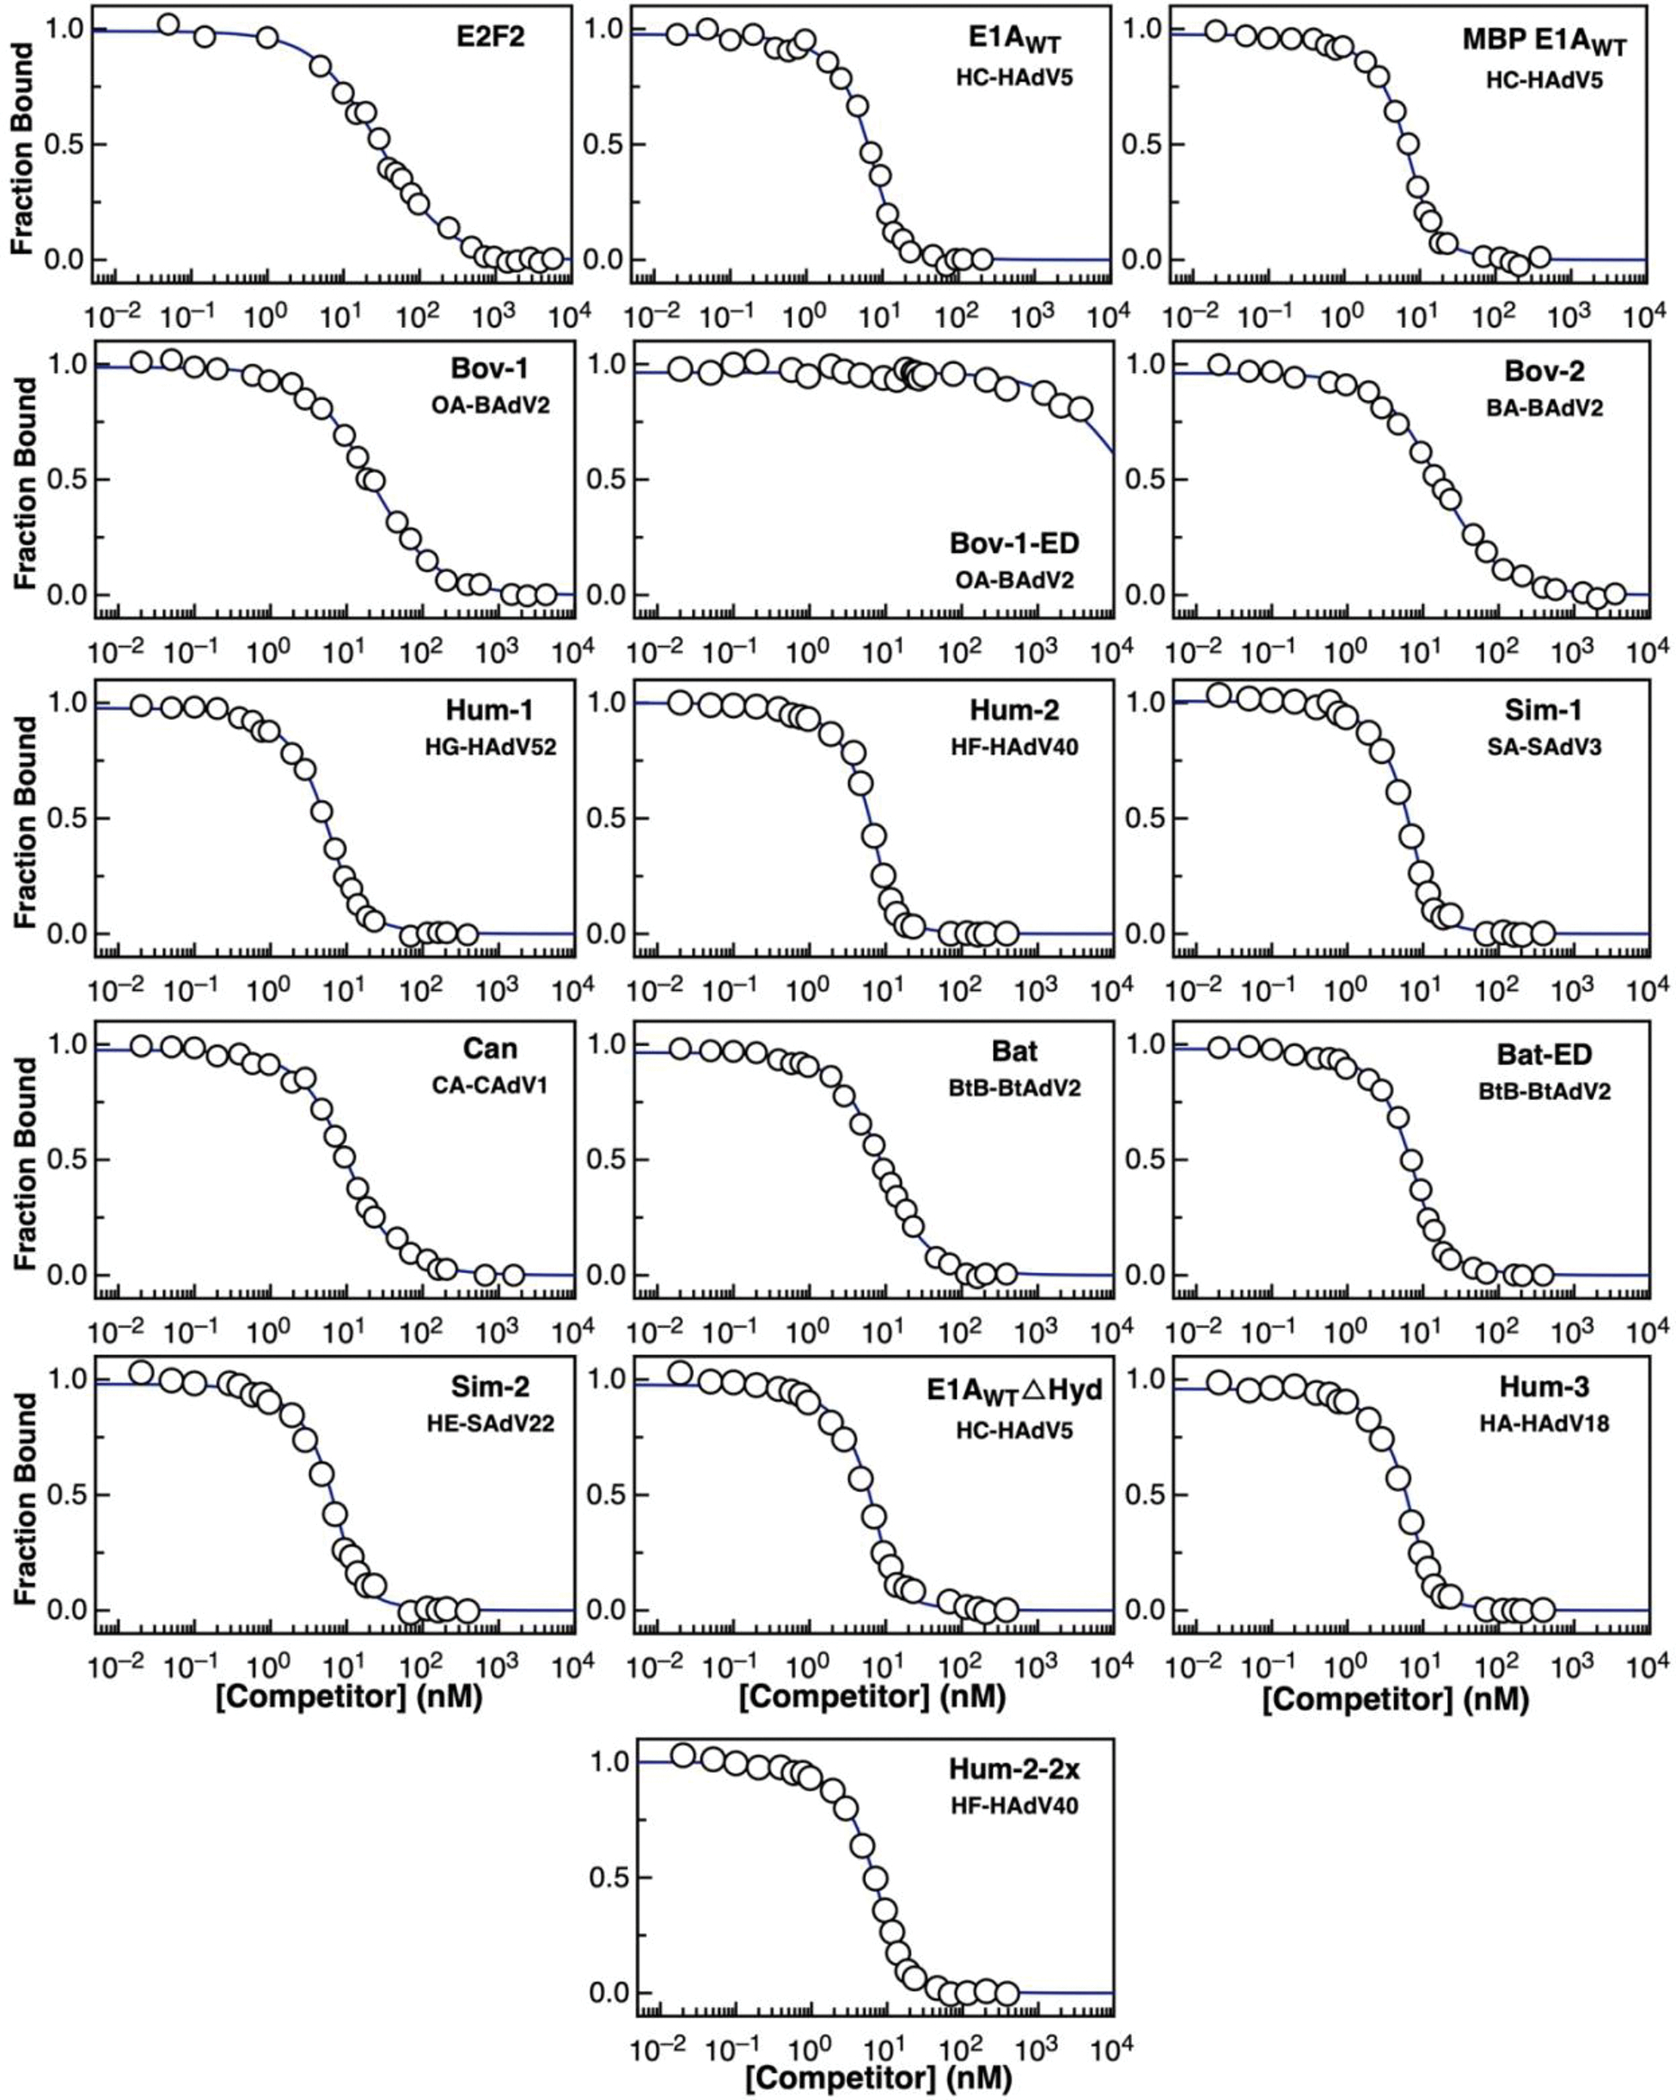
Competition displacement curves were performed by competing a preassembled equimolar [FITC-E2F2:Rb] complex at 10nM concentration with increasing concentrations of each variant. One representative example is shown for each variant reported on Supplementary Data Table 7. The displacement reaction was followed by recording the fluorescence anisotropy of the FITC moiety, with excitation at 490nm and emission at 520nm. In every case except for Bov-1-ED, the E1A variants were able to displace FITC-E2F2 from binding to Rb. The anisotropy value of free FITC-E2F2 was 0.042 ± 0.002 and the anisotropy value of the [FITC-E2F2:Rb] complex was 0.14 ± 0.01. In every case, the anisotropy value obtained at the end of the titration was equal to the anisotropy value of the free FITC-E2F2 peptide, confirming the complete displacement of FITC-E2F2. The anisotropy values were normalized to calculate the fraction of Rb-bound FITC-E2F2 and fitted to estimate the value for the [Variant:Rb] complex.
EXTENDED DATA FIGURE 9. Conservation of pocket domain structure and linear motif binding sites across mammalian pocket proteins.
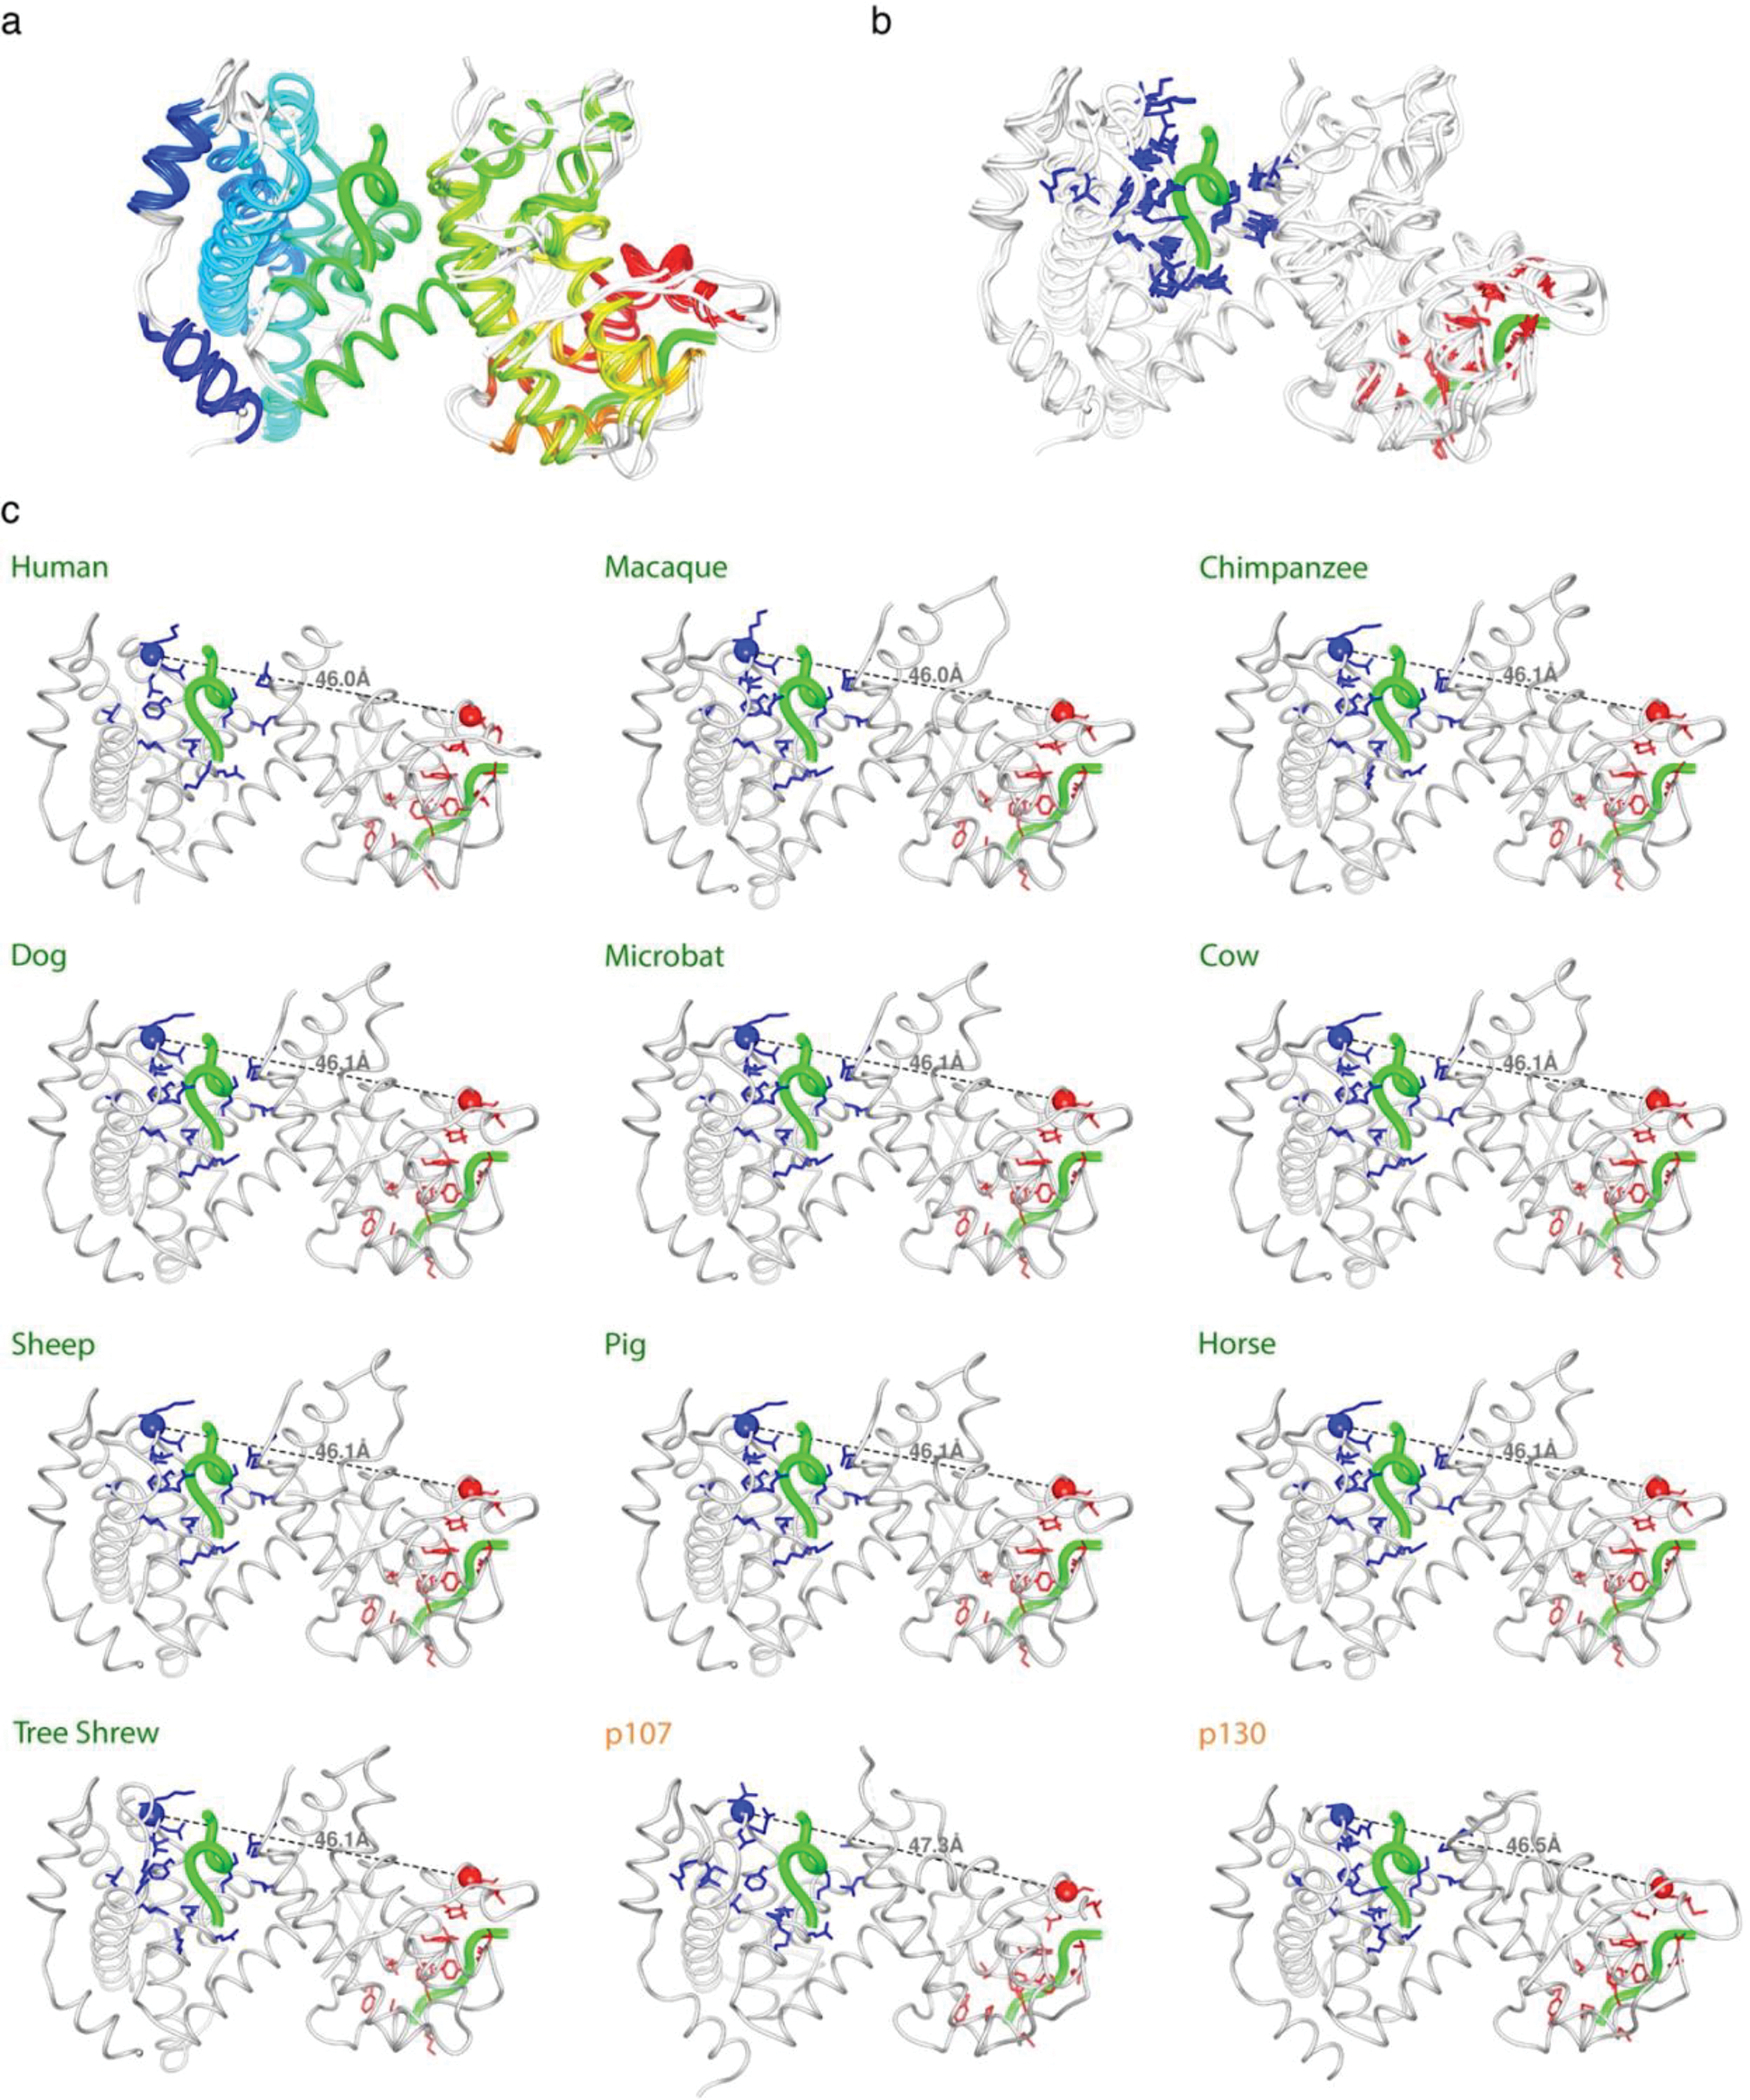
a) Structural conservation of the pocket domain across mammalian pocket proteins. The human Rb pocket domain (PDB:1GUX) is shown aligned with 9 structural models of Rb pocket domains from representative mammalian species plus the human paralogs p107 (PDB:4YOZ) and p130. The models of the Rb pocket domains and p130 were obtained by using Alphafold2 implemented in ColabFold (See Methods). Secondary structure is depicted in rainbow colors. The E2F (left) and LxCxE (right) motifs are depicted as green ribbons (PDB 2R7G and 1GUX respectively). b) Structural conservation of the E2F and LxCxE clefts in pocket proteins. Structural alignment shown in panel A with the residues that mediate binding to the E2F and LxCxE motifs (marked as asterisks in Supplementary Fig. 1) depicted as blue and red sticks respectively. c) The distance between the E2F and LxCxE binding sites is highly conserved across mammalian pocket proteins. The spacing was measured between the C-terminal anchor site of the E2F cleft (blue sphere) and the N-terminal anchor site of the LxCxE cleft (red sphere). Distances are: 46.0 Å (human, macaque and chicken), 46.1 Å (chimpanzee, dog, microbat, cow, sheep, pig, horse and tree shrew), 47.3 Å (p107) and 46.5 Å (p130). These distances are slightly shorter than the distance between binding sites used in the Ceff calculations (r0 = 49Å), which was measured between the C-terminal residue of the E2F motif and the N-terminal residue of the LxCxE motif using the structures of the motifs bound to Rb (PDB: 2R7G and 1GUX).
EXTENDED DATA FIGURE 10: Global prediction of E1A-Rb binding affinity.
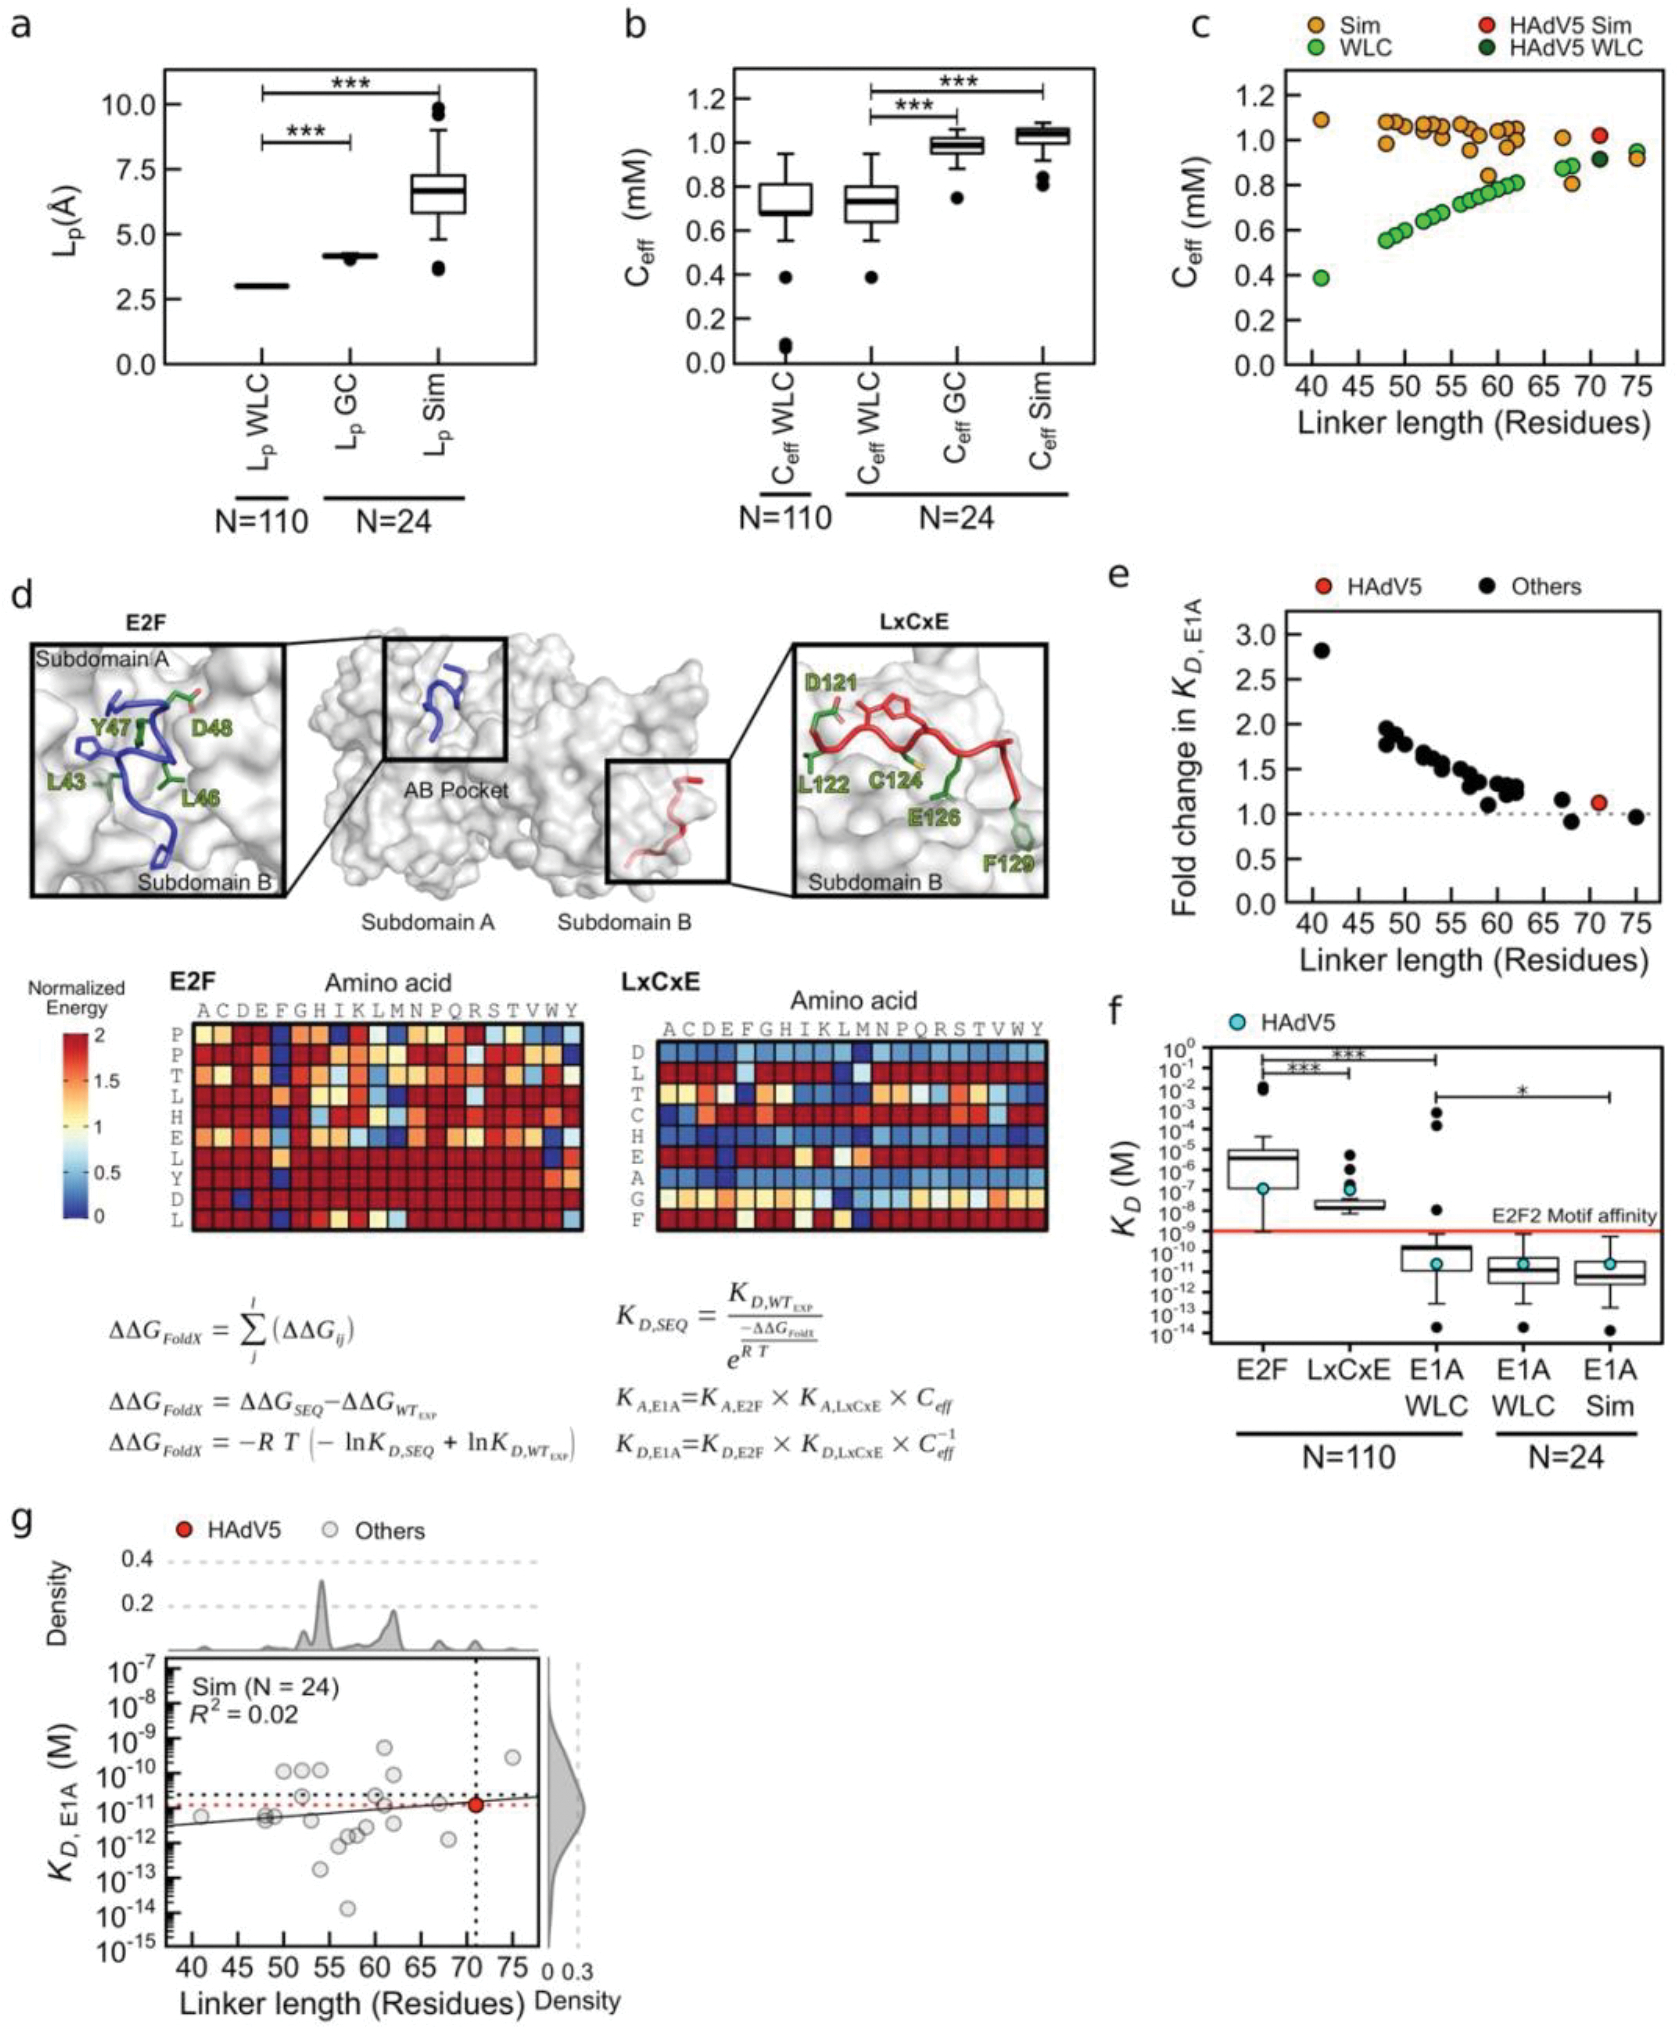
a-b) and values for E1A linkers. Boxplots: center line represents the median, lower and upper bounds represent the first and third quartiles and upper and lower whiskers extend from the top and bottom of the box by 1.4 the interquartile range. Black dots: outliers. P-values were calculated using a two-sided permutation test (10000 permutations) and the Benjamini-Hochberg correction for multiple comparisons to control the false discovery rate. ***p-value < 0.001 (detection limit of the test). N=110: All E1A linkers, N=24: Simulated linkers. c) Ceff as a function of linker length for 24 linkers calculated using the WLC model () (green dots), or values from all atom simulations ( Sim, orange dots). Dark green/red dots: E1AWT. d) Upper panel: E2F (blue) and LxCxE (red) motifs From E1A bound to Rb. Green sticks: core residues, blue/red sticks: variable residues. Lower panel: FoldX energy matrices with energy normalized in the range 0–2 kcal/mol. e) Fold-change in affinity using naïve versus simulated . Red dot: E1AWT. f) Predicted for the E1AE2F and E1ALXCXE SLiMs and for the motiflinker-motif construct for 110 sequences (E1A WLC) and for 24 simulated sequences using ( WLC) or sequence-specific from the simulations (E1A Sim). Boxplot elements and p-values are defined as in panel a. Cyan dots: experimental value for E1AWT. Red line: E2F2 motif affinity. g) Global Rb binding affinity (KD,E1A) as a function of linker length for 24 sequences using the Sim values. KD,E1A = KD,E2F KD,LxCxE Ceff−1. The low R2 value indicates that KD,E1A is uncorrelated to linker length. Upper panel: density plot of linker length for 107 E1A linkers (three short linkers were excluded). Right panel: density plot of KD,E1A. Red dot/line: Predicted KD,E1A for HAdV5 (E1AWT). Grey cross line: experimental KD,E1A for E1AWT.
Supplementary Material
Acknowledgements
This work was supported by: Agencia Nacional de Promoción Científica y Tecnológica (ANPCyT) Grants PICT #2013–1895 and #2017–1924 (LBC), #2012–2550 and #2015–1213 (IES) and #2016–4605 (GPG). US National Institutes of Health #GM115556 and #CA141244 (GWD) and #5R01NS056114 (RVP), FLDOH #20B17 (GWD), US National Science Foundation #MCB-1614766 (RVP). Travel award from the USF Nexus Initiative and a Creative Scholarship Grant from the USF College of Arts and Sciences (GWD and LBC). Labex EpiGenMed «Investissements d’avenir» program #ANR-10-LABX-12–01 (PB), French National Research Agency #ANR-10-INBS-04–01 and #ANR-10-INBS-05 (PB). Spanish Ministerio de Ciencia y Universidades MICYU-FEDER #RTI2018–097189-C2–1 (GFB). Consejo Nacional de Investigaciones Científicas y Técnicas (CONICET, Argentina) doctoral fellowship (NGF, MS and NAG), postdoctoral fellowship (JG), and permanent researcher (LBC, GdPG, IES). Fulbright Visiting Scholar Program (NSGF). Ministerio de Ciencia e Innovación, España #BES-2013–063991 and #EEBB-I-16–11670 (SBV). Longer Life Foundation: A RGA/Washington University Collaboration (ASH). HPC resources of the CALMIP supercomputing center #2016-P16032 (GFB) and Cluster of Scientific Computing (http://ccc.umh.es/) of the Miguel Hernández University (UMH) (GFB). The synchrotron SAXS data was collected at beamline P12 operated by EMBL Hamburg at the PETRA III storage ring (DESY, Hamburg, Germany). We thank Kathryn Perez at the Protein Expression and Purification Core Facility at EMBL (Heidelberg) for critical help with ITC experiments and Pedro Aramendia for providing critical access to fluorescence spectrometry equipment at Centro de Investigaciones en Bionanociencias (CIBION, Argentina).
Footnotes
Competing Interests Statement
A.S.H. is a scientific consultant with Dewpoint Therapeutics Inc. and R.V.P. is a member of the scientific advisory board of Dewpoint Therapeutics Inc. This work has not been influenced by the affiliation with Dewpoint. The rest of the authors have no competing interests.
Code Availability
The loop sampling method used to model the linker between the two binding motifs can be used via a web server (https://moma.laas.fr/applications/LoopSampler/), and binaries can be provided upon request. All code used to analyze the E1A linker trajectories are provided at https://github.com/holehouse-lab/supportingdata/tree/master/2021/Gonzalez_Foutel_2021.
Data availability
SAXS raw data for Rb, E1AWT and the [E1AWT:Rb] complex has been deposited in SASDB (https://www.sasbdb.org) with codes SASDNK6 (Rb 1mg/ml), SASDNL6 (Rb 2mg/ml), SASDNM6 (Rb 4mg/ml), SASDNN6 (E1AWT 4.2mg/ml), SASDNP6 (E1AWT 5.6mg/ml), SASDNQ6 (E1AWT 7.0mg/ml), SASDNR6 ([E1AWT:Rb] 0.7mg/ml), SASDNS6 ([E1AWT:Rb] 1.4mg/ml), SASDNT6 ([E1AWT:Rb] 2.7mg/ml), SASDNU6 ([E1AWT:Rb] merged data), SASDNV6 (E1AWT, SEC-SAXS). Refined conformational ensemble models for E1AWT and [E1AWT:Rb] have been deposited in the Protein Ensemble Database (https://proteinensemble.org/P03255) with codes PED00175 (E1AWT) and PED00174 ([E1AWT:Rb]). Unfiltered conformational ensembles for the [E1AWT:Rb], [E1AΔL:Rb] and [E1AΔE:Rb] complexes are available at (https://moma.laas.fr/data/) under the description “Conformational ensemble models of the IDP E1A bound to Rb protein”. NMR assignments of backbone resonances for E1AWT, E1AΔE and E1AΔL are provided in Supplementary Data File 2. Trajectories for all E1A linker ensembles are provided at: Zenodo (https://zenodo.org/record/6332925), and trajectory analysis results are provided at: https://github.com/holehouse-lab/supportingdata/tree/master/2021/Gonzalez_Foutel_2021. PDB codes used in data analysis and prediction are: PDB:1GUX, PDB:3POM, PDB:2R7G, PDB:4YOZ. Raw data underlying Main Figures 1–5 and Extended Data Figures 1, 4, 7 and 10 are available as Source Data Files.
REFERENCES:
- 1.Wright PE & Dyson HJ Intrinsically unstructured proteins: re-assessing the protein structure-function paradigm. J Mol Biol 293, 321–331 (1999). [DOI] [PubMed] [Google Scholar]
- 2.van der Lee R et al. Classification of intrinsically disordered regions and proteins. Chem Rev 114, 6589–6631 (2014). [DOI] [PMC free article] [PubMed] [Google Scholar]
- 3.Tompa P, Davey NE, Gibson TJ & Babu MM A million peptide motifs for the molecular biologist. Mol Cell 55, 161–169 (2014). [DOI] [PubMed] [Google Scholar]
- 4.Brown CJ, Johnson AK, Dunker AK & Daughdrill GW Evolution and disorder. Curr Opin Struct Biol 21, 441–446 (2011). [DOI] [PMC free article] [PubMed] [Google Scholar]
- 5.Das RK, Ruff KM & Pappu RV Relating sequence encoded information to form and function of intrinsically disordered proteins. Curr Opin Struct Biol 32, 102–112 (2015). [DOI] [PMC free article] [PubMed] [Google Scholar]
- 6.Daughdrill GW, Narayanaswami P, Gilmore SH, Belczyk A & Brown CJ Dynamic behavior of an intrinsically unstructured linker domain is conserved in the face of negligible amino acid sequence conservation. J Mol Evol 65, 277–288 (2007). [DOI] [PubMed] [Google Scholar]
- 7.Beh LY, Colwell LJ & Francis NJ A core subunit of Polycomb repressive complex 1 is broadly conserved in function but not primary sequence. Proc Natl Acad Sci U S A 109, E1063–71 (2012). [DOI] [PMC free article] [PubMed] [Google Scholar]
- 8.Das RK, Huang Y, Phillips AH, Kriwacki RW & Pappu RV Cryptic sequence features within the disordered protein p27Kip1 regulate cell cycle signaling. Proc Natl Acad Sci U S A 113, 5616–5621 (2016). [DOI] [PMC free article] [PubMed] [Google Scholar]
- 9.Martin EW et al. Valence and patterning of aromatic residues determine the phase behavior of prion-like domains. Science 367, 694–699 (2020). [DOI] [PMC free article] [PubMed] [Google Scholar]
- 10.Zarin T et al. Proteome-wide signatures of function in highly diverged intrinsically disordered regions. Elife 8, (2019). [DOI] [PMC free article] [PubMed] [Google Scholar]
- 11.Buske PJ, Mittal A, Pappu RV & Levin PA An intrinsically disordered linker plays a critical role in bacterial cell division. Semin Cell Dev Biol 37, 3–10 (2015). [DOI] [PMC free article] [PubMed] [Google Scholar]
- 12.Borcherds W et al. Optimal Affinity Enhancement by a Conserved Flexible Linker Controls p53 Mimicry in MdmX. Biophys J 112, 2038–2042 (2017). [DOI] [PMC free article] [PubMed] [Google Scholar]
- 13.Sherry KP, Das RK, Pappu RV & Barrick D Control of transcriptional activity by design of charge patterning in the intrinsically disordered RAM region of the Notch receptor. Proc Natl Acad Sci U S A 114, E9243–E9252 (2017). [DOI] [PMC free article] [PubMed] [Google Scholar]
- 14.Hantschel O et al. A myristoyl/phosphotyrosine switch regulates c-Abl. Cell 112, 845–857 (2003). [DOI] [PubMed] [Google Scholar]
- 15.Ayrapetov MK et al. Conformational basis for SH2-Tyr(P)527 binding in Src inactivation. J Biol Chem 281, 23776–23784 (2006). [DOI] [PubMed] [Google Scholar]
- 16.Dyla M & Kjaergaard M Intrinsically disordered linkers control tethered kinases via effective concentration. Proc Natl Acad Sci U S A 117, 21413–21419 (2020). [DOI] [PMC free article] [PubMed] [Google Scholar]
- 17.Cordeiro TN et al. Interplay of Protein Disorder in Retinoic Acid Receptor Heterodimer and Its Corepressor Regulates Gene Expression. Structure 27, 1270–1285.e6 (2019). [DOI] [PubMed] [Google Scholar]
- 18.Brodsky S et al. Intrinsically Disordered Regions Direct Transcription Factor In Vivo Binding Specificity. Mol Cell 79, 459–471.e4 (2020). [DOI] [PubMed] [Google Scholar]
- 19.Harmon TS, Holehouse AS, Rosen MK & Pappu RV Intrinsically disordered linkers determine the interplay between phase separation and gelation in multivalent proteins. Elife 6, (2017). [DOI] [PMC free article] [PubMed] [Google Scholar]
- 20.Huang Q, Li M, Lai L & Liu Z Allostery of multidomain proteins with disordered linkers. Curr Opin Struct Biol 62, 175–182 (2020). [DOI] [PubMed] [Google Scholar]
- 21.Jencks WP On the attribution and additivity of binding energies. Proc Natl Acad Sci U S A 78, 4046–4050 (1981). [DOI] [PMC free article] [PubMed] [Google Scholar]
- 22.Zhou HX The affinity-enhancing roles of flexible linkers in two-domain DNA-binding proteins. Biochemistry 40, 15069–15073 (2001). [DOI] [PubMed] [Google Scholar]
- 23.Zhou HX Polymer models of protein stability, folding, and interactions. Biochemistry 43, 2141–2154 (2004). [DOI] [PubMed] [Google Scholar]
- 24.Morrison G & Thirumalai D Semiflexible chains in confined spaces. Phys Rev E Stat Nonlin Soft Matter Phys 79, 11924 (2009). [DOI] [PubMed] [Google Scholar]
- 25.van Dongen EMWM et al. Variation of linker length in ratiometric fluorescent sensor proteins allows rational tuning of Zn(II) affinity in the picomolar to femtomolar range. J Am Chem Soc 129, 3494–3495 (2007). [DOI] [PubMed] [Google Scholar]
- 26.Bertagna A, Toptygin D, Brand L & Barrick D The effects of conformational heterogeneity on the binding of the Notch intracellular domain to effector proteins: a case of biologically tuned disorder. Biochem Soc Trans 36, 157–166 (2008). [DOI] [PubMed] [Google Scholar]
- 27.Mao AH, Crick SL, Vitalis A, Chicoine CL & Pappu RV Net charge per residue modulates conformational ensembles of intrinsically disordered proteins. Proc Natl Acad Sci U S A 107, 8183–8188 (2010). [DOI] [PMC free article] [PubMed] [Google Scholar]
- 28.Marsh JA & Forman-Kay JD Sequence determinants of compaction in intrinsically disordered proteins. Biophys J 98, 2383–2390 (2010). [DOI] [PMC free article] [PubMed] [Google Scholar]
- 29.Müller-Späth S et al. From the Cover: Charge interactions can dominate the dimensions of intrinsically disordered proteins. Proc Natl Acad Sci U S A 107, 14609–14614 (2010). [DOI] [PMC free article] [PubMed] [Google Scholar]
- 30.Das RK & Pappu RV Conformations of intrinsically disordered proteins are influenced by linear sequence distributions of oppositely charged residues. Proc Natl Acad Sci U S A 110, 13392–13397 (2013). [DOI] [PMC free article] [PubMed] [Google Scholar]
- 31.Van Rosmalen M, Krom M & Merkx M Tuning the Flexibility of Glycine-Serine Linkers to Allow Rational Design of Multidomain Proteins. Biochemistry 56, 6565–6574 (2017). [DOI] [PMC free article] [PubMed] [Google Scholar]
- 32.Sorensen CS & Kjaergaard M Effective concentrations enforced by intrinsically disordered linkers are governed by polymer physics. Proc Natl Acad Sci U S A 116, 23124–23131 (2019). [DOI] [PMC free article] [PubMed] [Google Scholar]
- 33.Kjaergaard M, Glavina J & Chemes LB Predicting the effect of disordered linkers on effective concentrations and avidity with the “C(eff) calculator” app. Methods Enzymol 647, 145–171 (2021). [DOI] [PubMed] [Google Scholar]
- 34.Tokuriki N, Oldfield CJ, Uversky VN, Berezovsky IN & Tawfik DS Do viral proteins possess unique biophysical features? Trends Biochem Sci 34, 53–59 (2009). [DOI] [PubMed] [Google Scholar]
- 35.Gitlin L, Hagai T, LaBarbera A, Solovey M & Andino R Rapid evolution of virus sequences in intrinsically disordered protein regions. PLoS Pathog 10, e1004529 (2014). [DOI] [PMC free article] [PubMed] [Google Scholar]
- 36.Hagai T, Azia A, Babu MM & Andino R Use of host-like peptide motifs in viral proteins is a prevalent strategy in host-virus interactions. Cell Rep 7, 1729–1739 (2014). [DOI] [PMC free article] [PubMed] [Google Scholar]
- 37.Davey NE, Trave G & Gibson TJ How viruses hijack cell regulation. Trends Biochem Sci 36, 159–169 (2011). [DOI] [PubMed] [Google Scholar]
- 38.Chemes LB, de Prat-Gay G & Sanchez IE Convergent evolution and mimicry of protein linear motifs in host-pathogen interactions. Curr Opin Struct Biol 32, 91–101 (2015). [DOI] [PubMed] [Google Scholar]
- 39.King CR, Zhang A, Tessier TM, Gameiro SF & Mymryk JS Hacking the Cell: Network Intrusion and Exploitation by Adenovirus E1A. MBio 9, (2018). [DOI] [PMC free article] [PubMed] [Google Scholar]
- 40.Liu X & Marmorstein R Structure of the retinoblastoma protein bound to adenovirus E1A reveals the molecular basis for viral oncoprotein inactivation of a tumor suppressor. Genes Dev 21, 2711–2716 (2007). [DOI] [PMC free article] [PubMed] [Google Scholar]
- 41.Lee JO, Russo AA & Pavletich NP Structure of the retinoblastoma tumour-suppressor pocket domain bound to a peptide from HPV E7. Nature 391, 859–865 (1998). [DOI] [PubMed] [Google Scholar]
- 42.Dyson N, Guida P, McCall C & Harlow E Adenovirus E1A makes two distinct contacts with the retinoblastoma protein. J Virol 66, 4606–4611 (1992). [DOI] [PMC free article] [PubMed] [Google Scholar]
- 43.Ferreon JC, Martinez-Yamout MA, Dyson HJ & Wright PE Structural basis for subversion of cellular control mechanisms by the adenoviral E1A oncoprotein. Proc Natl Acad Sci U S A 106, 13260–13265 (2009). [DOI] [PMC free article] [PubMed] [Google Scholar]
- 44.Ferreon AC, Ferreon JC, Wright PE & Deniz AA Modulation of allostery by protein intrinsic disorder. Nature 498, 390–394 (2013). [DOI] [PMC free article] [PubMed] [Google Scholar]
- 45.Fattaey AR, Harlow E & Helin K Independent regions of adenovirus E1A are required for binding to and dissociation of E2F-protein complexes. Mol Cell Biol 13, 7267–7277 (1993). [DOI] [PMC free article] [PubMed] [Google Scholar]
- 46.Hosek T et al. Structural and Dynamic Characterization of the Molecular Hub Early Region 1A (E1A) from Human Adenovirus. Chemistry (Easton) 22, 13010–13013 (2016). [DOI] [PubMed] [Google Scholar]
- 47.Haberz P, Arai M, Martinez-Yamout MA, Dyson HJ & Wright PE Mapping the interactions of adenoviral E1A proteins with the p160 nuclear receptor coactivator binding domain of CBP. Protein Sci 25, 2256–2267 (2016). [DOI] [PMC free article] [PubMed] [Google Scholar]
- 48.Zuiderweg ERP Mapping protein-protein interactions in solution by NMR spectroscopy. Biochemistry 41, 1–7 (2002). [DOI] [PubMed] [Google Scholar]
- 49.Palopoli N, Gonzalez Foutel NS, Gibson TJ & Chemes LB Short linear motif core and flanking regions modulate retinoblastoma protein binding affinity and specificity. Protein Eng Des Sel 31, 69–77 (2018). [DOI] [PubMed] [Google Scholar]
- 50.Perozzo R, Folkers G & Scapozza L Thermodynamics of protein-ligand interactions: history, presence, and future aspects. J Recept Signal Transduct Res 24, 1–52 (2004). [DOI] [PubMed] [Google Scholar]
- 51.Theisen FF et al. Quantification of Conformational Entropy Unravels Effect of Disordered Flanking Region in Coupled Folding and Binding. J Am Chem Soc 143, 14540–14550 (2021). [DOI] [PubMed] [Google Scholar]
- 52.Bernado P, Mylonas E, Petoukhov MV, Blackledge M & Svergun DI Structural characterization of flexible proteins using small-angle X-ray scattering. J Am Chem Soc 129, 5656–5664 (2007). [DOI] [PubMed] [Google Scholar]
- 53.Estaña A et al. Realistic Ensemble Models of Intrinsically Disordered Proteins Using a Structure-Encoding Coil Database. Structure 27, 381–391.e2 (2019). [DOI] [PubMed] [Google Scholar]
- 54.Cortes J, Simeon T, Remaud-Simeon M & Tran V Geometric algorithms for the conformational analysis of long protein loops. J Comput Chem 25, 956–967 (2004). [DOI] [PubMed] [Google Scholar]
- 55.Cohan MC, Eddelbuettel AMP, Levin PA & Pappu RV Dissecting the Functional Contributions of the Intrinsically Disordered C-terminal Tail of Bacillus subtilis FtsZ. J Mol Biol 432, 3205–3221 (2020). [DOI] [PMC free article] [PubMed] [Google Scholar]
- 56.Glavina J, Rodriguez de la Vega R, Risso VA, Leonetti CO, Chemes LB, Sánchez IE Host diversification is concurrent with linear motif evolution in a mastadenovirus hub protein. Journal of Molecular Biology (2022). [DOI] [PubMed] [Google Scholar]
- 57.Hoppe E et al. Multiple Cross-Species Transmission Events of Human Adenoviruses (HAdV) during Hominine Evolution. Mol Biol Evol 32, 2072–2084 (2015). [DOI] [PMC free article] [PubMed] [Google Scholar]
- 58.Glavina J et al. Interplay between sequence, structure and linear motifs in the adenovirus E1A hub protein. Virology 525, 117–131 (2018). [DOI] [PubMed] [Google Scholar]
- 59.Lau L, Gray EE, Brunette RL & Stetson DB DNA tumor virus oncogenes antagonize the cGAS-STING DNA-sensing pathway. Science 350, 568–571 (2015). [DOI] [PubMed] [Google Scholar]
- 60.Ferreiro DU, Komives EA & Wolynes PG Frustration in biomolecules. Q Rev Biophys 47, 285–363 (2014). [DOI] [PMC free article] [PubMed] [Google Scholar]
- 61.Sherry KP, Johnson SE, Hatem CL, Majumdar A & Barrick D Effects of Linker Length and Transient Secondary Structure Elements in the Intrinsically Disordered Notch RAM Region on Notch Signaling. J Mol Biol 427, 3587–3597 (2015). [DOI] [PMC free article] [PubMed] [Google Scholar]
- 62.Crisostomo L, Soriano AM, Mendez M, Graves D & Pelka P Temporal dynamics of adenovirus 5 gene expression in normal human cells. PLoS One 14, e0211192 (2019). [DOI] [PMC free article] [PubMed] [Google Scholar]
- 63.Ramirez J et al. Targeting the Two Oncogenic Functional Sites of the HPV E6 Oncoprotein with a High-Affinity Bivalent Ligand. Angew Chem Int Ed Engl 54, 7958–7962 (2015). [DOI] [PMC free article] [PubMed] [Google Scholar]
- 64.Cheng J et al. Stabilized recombinant suppressors of RNA silencing: functional effects of linking monomers of Carnation Italian Ringspot virus p19. Biochim Biophys Acta 1774, 1528–1535 (2007). [DOI] [PubMed] [Google Scholar]
- 65.Travers T et al. Combinatorial diversity of Syk recruitment driven by its multivalent engagement with FcεRIγ. Mol Biol Cell 30, 2331–2347 (2019). [DOI] [PMC free article] [PubMed] [Google Scholar]
- 66.Milles S et al. Plasticity of an ultrafast interaction between nucleoporins and nuclear transport receptors. Cell 163, 734–745 (2015). [DOI] [PMC free article] [PubMed] [Google Scholar]
- 67.Chemes LB, Noval MG, Sanchez IE & de Prat-Gay G Folding of a cyclin box: linking multitarget binding to marginal stability, oligomerization, and aggregation of the retinoblastoma tumor suppressor AB pocket domain. J Biol Chem 288, 18923–18938 (2013). [DOI] [PMC free article] [PubMed] [Google Scholar]
- 68.Uversky VN What does it mean to be natively unfolded? Eur J Biochem 269, 2–12 (2002). [DOI] [PubMed] [Google Scholar]
- 69.Hofmann H et al. Polymer scaling laws of unfolded and intrinsically disordered proteins quantified with single-molecule spectroscopy. Proc Natl Acad Sci U S A 109, 16155–16160 (2012). [DOI] [PMC free article] [PubMed] [Google Scholar]
- 70.Kuzmic P, Moss ML, Kofron JL & Rich DH Fluorescence displacement method for the determination of receptor-ligand binding constants. Anal Biochem 205, 65–69 (1992). [DOI] [PubMed] [Google Scholar]
- 71.Muhandiram DR & Kay LE Gradient-Enhanced Triple-Resonance Three-Dimensional NMR Experiments with Improved Sensitivity. Journal of Magnetic Resonance, Series B 103, 203–216 (1994). [Google Scholar]
- 72.Wittekind M & Mueller L HNCACB, a High-Sensitivity 3D NMR Experiment to Correlate Amide-Proton and Nitrogen Resonances with the Alpha- and Beta-Carbon Resonances in Proteins. Journal of Magnetic Resonance, Series B 101, 201–205 (1993). [Google Scholar]
- 73.Johnson RA, B. A. R.; B. NMRView: a computer program for the visualization and analysis of NMR data. J. Biomol. NMR 4, 603–614 (1994). [DOI] [PubMed] [Google Scholar]
- 74.Tamiola K, Acar B & Mulder FA Sequence-specific random coil chemical shifts of intrinsically disordered proteins. J Am Chem Soc 132, 18000–18003 (2010). [DOI] [PubMed] [Google Scholar]
- 75.Blanchet CE et al. Versatile sample environments and automation for biological solution X-ray scattering experiments at the P12 beamline (PETRA III, DESY). J Appl Crystallogr 48, 431–443 (2015). [DOI] [PMC free article] [PubMed] [Google Scholar]
- 76.Girardot R, Viguier G, Pérez J & Ounsy MM FOXTROT: A JAVA-based application to reduce and analyse SAXS and WAXS piles of 2D data at synchrotron SOLEIL, Synchrotron Soleil, Saint-Aubin, France, canSAS-VIII, Apr. 14–16, J-PARC, Tokai, Japan. (2015). [Google Scholar]
- 77.Franke D et al. ATSAS 2.8: a comprehensive data analysis suite for small-angle scattering from macromolecular solutions. J Appl Crystallogr 50, 1212–1225 (2017). [DOI] [PMC free article] [PubMed] [Google Scholar]
- 78.Guinier A Diffraction of x-rays of very small angles-application to the study of ultramicroscopic phenomenon. Ann. Phys 12, 161–237 (1939). [Google Scholar]
- 79.Svergun Semenyuk AV; Feigin LA, D. I. Small-angle-scattering-data treatment by the regularization method. Acta Crystallogr. Sect. A Found. Crystallogr. 44, 244–250 (1988). [Google Scholar]
- 80.Panjkovich A & Svergun DI CHROMIXS: automatic and interactive analysis of chromatography-coupled small-angle X-ray scattering data. Bioinformatics 34, 1944–1946 (2018). [DOI] [PMC free article] [PubMed] [Google Scholar]
- 81.Balog ER, Burke JR, Hura GL & Rubin SM Crystal structure of the unliganded retinoblastoma protein pocket domain. Proteins 79, 2010–2014 (2011). [DOI] [PMC free article] [PubMed] [Google Scholar]
- 82.Schneidman-Duhovny D, Hammel M, Tainer JA & Sali A Accurate SAXS profile computation and its assessment by contrast variation experiments. Biophys J 105, 962–974 (2013). [DOI] [PMC free article] [PubMed] [Google Scholar]
- 83.Schneidman-Duhovny D, Hammel M, Tainer JA & Sali A FoXS, FoXSDock and MultiFoXS: Single-state and multi-state structural modeling of proteins and their complexes based on SAXS profiles. Nucleic Acids Res 44, W424–9 (2016). [DOI] [PMC free article] [PubMed] [Google Scholar]
- 84.Weinkam P, Pons J & Sali A Structure-based model of allostery predicts coupling between distant sites. Proc Natl Acad Sci U S A 109, 4875–4880 (2012). [DOI] [PMC free article] [PubMed] [Google Scholar]
- 85.Tria G, Mertens HD, Kachala M & Svergun DI Advanced ensemble modelling of flexible macromolecules using X-ray solution scattering. IUCrJ 2, 207–217 (2015). [DOI] [PMC free article] [PubMed] [Google Scholar]
- 86.Svergun Barberato C; Koch MHJ, CRYSOL D – a Program to Evaluate X-ray Solution Scattering of Biological Macromolecules from Atomic Coordinates. J. Appl. Crystallogr 28, 768–773 (1995). [Google Scholar]
- 87.Garcia De La Torre J, Huertas ML & Carrasco B Calculation of hydrodynamic properties of globular proteins from their atomic-level structure. Biophys J 78, 719–730 (2000). [DOI] [PMC free article] [PubMed] [Google Scholar]
- 88.Ortega A, Amoros D & Garcia de la Torre, J. Prediction of hydrodynamic and other solution properties of rigid proteins from atomic- and residue-level models. Biophys J 101, 892–898 (2011). [DOI] [PMC free article] [PubMed] [Google Scholar]
- 89.Vitalis A & Pappu RV ABSINTH: a new continuum solvation model for simulations of polypeptides in aqueous solutions. J Comput Chem 30, 673–699 (2009). [DOI] [PMC free article] [PubMed] [Google Scholar]
- 90.Vitalis A & Pappu RV Methods for Monte Carlo simulations of biomacromolecules. Annu Rep Comput Chem 5, 49–76 (2009). [DOI] [PMC free article] [PubMed] [Google Scholar]
- 91.Kozlov AG et al. Intrinsically disordered C-terminal tails of E. coli single-stranded DNA binding protein regulate cooperative binding to single-stranded DNA. J Mol Biol 427, 763–774 (2015). [DOI] [PMC free article] [PubMed] [Google Scholar]
- 92.Metskas LA & Rhoades E Conformation and Dynamics of the Troponin I C-Terminal Domain: Combining Single-Molecule and Computational Approaches for a Disordered Protein Region. J Am Chem Soc 137, 11962–11969 (2015). [DOI] [PMC free article] [PubMed] [Google Scholar]
- 93.McGibbon RT et al. MDTraj: A Modern Open Library for the Analysis of Molecular Dynamics Trajectories. Biophys J 109, 1528–1532 (2015). [DOI] [PMC free article] [PubMed] [Google Scholar]
- 94.Holehouse AS, Das RK, Ahad JN, Richardson MO & Pappu RV CIDER: Resources to Analyze Sequence-Ensemble Relationships of Intrinsically Disordered Proteins. Biophys J 112, 16–21 (2017). [DOI] [PMC free article] [PubMed] [Google Scholar]
- 95.Nygaard M, Kragelund BB, Papaleo E & Lindorff-Larsen K An Efficient Method for Estimating the Hydrodynamic Radius of Disordered Protein Conformations. Biophys J 113, 550–557 (2017). [DOI] [PMC free article] [PubMed] [Google Scholar]
- 96.Schymkowitz J et al. The FoldX web server: an online force field. Nucleic Acids Res 33, W382–8 (2005). [DOI] [PMC free article] [PubMed] [Google Scholar]
- 97.London N, Raveh B, Cohen E, Fathi G & Schueler-Furman O Rosetta FlexPepDock web server--high resolution modeling of peptide-protein interactions. Nucleic Acids Res 39, W249–53 (2011). [DOI] [PMC free article] [PubMed] [Google Scholar]
- 98.Good P Permutation, Parametric, and Bootstrap Tests of Hypotheses. (Springer-Verlag; New York, 2005). doi: 10.1007/b138696. [DOI] [Google Scholar]
- 99.Benjamini Y & Hochberg Y Controlling the False Discovery Rate: a Practical and Powerful Approach to Multiple Testing. Journal of the Royal Statistical Society. Series B (Methodological) 57, 289–300 (1995). [Google Scholar]
- 100.Mészáros B, Erdos G & Dosztányi Z IUPred2A: context-dependent prediction of protein disorder as a function of redox state and protein binding. Nucleic Acids Res 46, W329–W337 (2018). [DOI] [PMC free article] [PubMed] [Google Scholar]
- 101.Howe KL et al. Ensembl 2021. Nucleic Acids Res 49, D884–D891 (2021). [DOI] [PMC free article] [PubMed] [Google Scholar]
- 102.Ashkenazy H et al. ConSurf 2016: an improved methodology to estimate and visualize evolutionary conservation in macromolecules. Nucleic Acids Res 44, W344–50 (2016). [DOI] [PMC free article] [PubMed] [Google Scholar]
- 103.Waterhouse AM, Procter JB, Martin DMA, Clamp M & Barton GJ Jalview Version 2--a multiple sequence alignment editor and analysis workbench. Bioinformatics 25, 1189–1191 (2009). [DOI] [PMC free article] [PubMed] [Google Scholar]
- 104.Livingstone CD & Barton GJ Protein sequence alignments: a strategy for the hierarchical analysis of residue conservation. Comput Appl Biosci 9, 745–756 (1993). [DOI] [PubMed] [Google Scholar]
- 105.Jumper J et al. Highly accurate protein structure prediction with AlphaFold. Nature 596, 583–589 (2021). [DOI] [PMC free article] [PubMed] [Google Scholar]
- 106.Mirdita M et al. ColabFold - Making protein folding accessible to all. bioRxiv 2021.08.15.456425 (2021) doi: 10.1101/2021.08.15.456425. [DOI] [PMC free article] [PubMed] [Google Scholar]
- 107.Mirdita M, Steinegger M & Söding J MMseqs2 desktop and local web server app for fast, interactive sequence searches. Bioinformatics 35, 2856–2858 (2019). [DOI] [PMC free article] [PubMed] [Google Scholar]
- 108.Pettersen EF et al. UCSF Chimera--a visualization system for exploratory research and analysis. J Comput Chem 25, 1605–1612 (2004). [DOI] [PubMed] [Google Scholar]
Associated Data
This section collects any data citations, data availability statements, or supplementary materials included in this article.
Supplementary Materials
Data Availability Statement
SAXS raw data for Rb, E1AWT and the [E1AWT:Rb] complex has been deposited in SASDB (https://www.sasbdb.org) with codes SASDNK6 (Rb 1mg/ml), SASDNL6 (Rb 2mg/ml), SASDNM6 (Rb 4mg/ml), SASDNN6 (E1AWT 4.2mg/ml), SASDNP6 (E1AWT 5.6mg/ml), SASDNQ6 (E1AWT 7.0mg/ml), SASDNR6 ([E1AWT:Rb] 0.7mg/ml), SASDNS6 ([E1AWT:Rb] 1.4mg/ml), SASDNT6 ([E1AWT:Rb] 2.7mg/ml), SASDNU6 ([E1AWT:Rb] merged data), SASDNV6 (E1AWT, SEC-SAXS). Refined conformational ensemble models for E1AWT and [E1AWT:Rb] have been deposited in the Protein Ensemble Database (https://proteinensemble.org/P03255) with codes PED00175 (E1AWT) and PED00174 ([E1AWT:Rb]). Unfiltered conformational ensembles for the [E1AWT:Rb], [E1AΔL:Rb] and [E1AΔE:Rb] complexes are available at (https://moma.laas.fr/data/) under the description “Conformational ensemble models of the IDP E1A bound to Rb protein”. NMR assignments of backbone resonances for E1AWT, E1AΔE and E1AΔL are provided in Supplementary Data File 2. Trajectories for all E1A linker ensembles are provided at: Zenodo (https://zenodo.org/record/6332925), and trajectory analysis results are provided at: https://github.com/holehouse-lab/supportingdata/tree/master/2021/Gonzalez_Foutel_2021. PDB codes used in data analysis and prediction are: PDB:1GUX, PDB:3POM, PDB:2R7G, PDB:4YOZ. Raw data underlying Main Figures 1–5 and Extended Data Figures 1, 4, 7 and 10 are available as Source Data Files.