

Abstract
Limited studies have examined the associations between diet quality and gestational weight gain (GWG) among Chinese pregnant women, adopting Chinese GWG guidelines. We prospectively investigate the associations of diet quality, using the Chinese Healthy Diet Index for Pregnancy (CHDI‐P), which assessed diet quality from ‘Diversity’, ‘Adequacy’ and ‘Limitation’ dimensions with overall 100 points, with GWG among participants enroled in Southwest China. Food consumption was collected by 24 h dietary recalls for three consecutive days and CHDI‐P scores were divided into tertiles. GWG was calculated according to the weight measured before delivery and classified into adequate weight gain (AWG), insufficient weight gain (IWG) and excessive weight gain(EWG) following Chinese GWG guidelines. Multinomial regression analyses and stratified analyses by pre‐pregnancy body mass index were performed to estimate the association between CHDI‐P and GWG. A total of 1416 participants were recruited in early pregnancy, and 971 and 997 participants were respectively followed up in middle and late pregnancy. The mean CHDI‐P score was 56.44 ± 6.74, 57.07 ± 7.44 and 57.38 ± 7.94 points in early, middle and late pregnancy, respectively. Women in the lowest CHDI‐P scores group had an increased risk of EWG in middle (OR = 1.53, 95% confidence interval [CI] = 1.08–2.17) and late pregnancy (OR = 1.71, 95% CI = 1.21–2.41) than women in the highest group, while overweight/obese women had a greater risk of EWG in late pregnancy (OR = 4.25, 95% CI = 1.30–13.90). No association was found between the CHDI‐P scores and IWG. Poor diet quality in middle and late pregnancy was associated with a higher risk of EWG.
Keywords: diet, dietary assessment tools, food, maternal obesity, pregnancy and nutrition, weight gain
This study prospectively investigates the associations of diet quality, using the Chinese Healthy Diet Index for Pregnancy (CHDI‐P), with gestational weight gain (GWG) among participants enroled in Southwest China. Excessive weight gain (EWG) is a more obvious problem than insufficient weight gain (IWG) among Chinese pregnant women when evaluated by Chinese GWG guidelines. A higher‐quality diet in middle and late pregnancy could reduce the risk of EWG, while its effect on IWG was not found.

Key messages
Excessive gestational weight gain (EWG) is a more obvious problem than insufficient gestational weight gain (IWG) among Chinese pregnant women when evaluated by Chinese gestational weight gain (GWG) guidelines.
Maternal diet is a key determinant of GWG, and inadequate intake of healthy food, such as whole grains and dark‐coloured vegetables, is a risk factor for EWG.
Higher‐quality diet in middle and late pregnancy could reduce the risk of EWG, while its effect on IWG was not found.
Overweight pregnant women defined as overweight/obese by pre‐pregnancy body mass index had a significantly increased risk of EWG when adhering to an unhealthy diet in late pregnancy.
1. INTRODUCTION
Inappropriate gestational weight gain (GWG) has significant short‐and long‐term effects on both maternal and offspring health. On the one hand, excessive weight gain (EWG) is associated with an increased risk of gestational hypertensive disorders, preeclampsia and gestational diabetes mellitus (GDM) (Santos et al., 2019), and increasing the risk of large for gestational age (LGA), macrosomia and caesarean delivery (Goldstein et al., 2017). On the other hand, insufficient weight gain (IWG) is related to a higher risk of small for gestational age (SGA) and preterm birth (Goldstein et al., 2017). Women with a GWG above the recommended levels have a higher risk of postpartum weight retention (Berezowsky & Berger, 2021) and becoming overweight after pregnancy than women with GWG within the recommendations (Gunderson et al., 2000). In offspring, children whose maternal GWG was excessive have an increased risk of adiposity (Hochner et al., 2012).
According to a meta‐analysis across continents and ethnicities conducted in 2018, the prevalence of IWG in the United States and Europe was 21% and 18%, respectively, and the prevalence of EWG was 51% and 51%, respectively (Goldstein et al., 2018). In Asia, the prevalence of GWG below the guidelines recommended by the Institute of Medicine (IOM) was higher (31%), and that of GWG above the guidelines was lower (37%) compared with the United States and Europe (Goldstein et al., 2018). In China, the prevalence of IWG and EWG varies slightly among different regions. The prevalence of EWG in northern (Ren et al., 2021), eastern (Xu et al., 2021) and southwestern China (Liang et al., 2019) was 43.2%, 27.4% and 33.5%, respectively, whereas the prevalence of IWG was 16.7%, 20.0% and 31.1%, respectively. Considering the higher prevalence of inappropriate GWG, effective interventions must be developed.
Diet quality indices are increasingly used to determine associations between dietary intake with nutritional status and health outcomes (Fransen & Ocké, 2008). Data from American pregnancies found that, higher diet quality, which was measured by the Alternative Healthy Eating Index adapted for pregnancy (AHEI‐P), was observed in the adequate GWG group of women with normal weight (Parker et al., 2019). Similarly, a higher New Nordic Diet score during pregnancy was related to optimal GWG and foetal growth (Hillesund et al., 2014).
However, limited studies have examined the possible associations between diet quality and GWG among Chinese pregnant women. As there are variations in dietary guidelines across countries, the foreign diet quality indices may not be suitable for Chinese pregnant women. Moreover, Chinese diet quality indices, such as the Diet Balance Index for Pregnancy (Su et al., 2020), have an intricate scoring part for the application of nutritional guidance during pregnancy. However, the Chinese Dietary Guidelines Compliance Index for Pregnant Women, which assesses diet quality based on the Food Frequency Questionnaire and dietary patterns rather than the amount of food intake, has difficulty independently detecting the relationship between diet quality and GWG (Ding et al., 2021). Since GWG is a key mediator for maternal diet and birth outcomes, as well as a strong risk factor for other pregnancy complications on its own, it is necessary and meaningful to adopt an effective diet quality assessment tool to detect the effect of maternal diet on GWG (J. Yang et al., 2021).
Since the IOM updated the GWG guideline to provide specific recommendations regarding the ideal GWG (Medicine & Council, 2009), it has been widely used in both international and Chinese studies. However, due to the great differences in the genetic characteristics, dietary patterns and different criteria for categorizing BMI between Chinese and American populations (Wang et al., 2018), the applications of these studies were limited. Recently, the Chinese Nutrition Society (CNS) published the GWG guideline called Weight monitoring and evaluation during the pregnancy period of Chinese women (CNS, 2021), which was developed based on the big data of weight gain from Chinese pregnant women to determine the appropriate range for GWG and is more suitable for Chinese pregnant women.
Therefore, the purpose of this study was to investigate the association of diet quality during pregnancy with the adequacy of GWG in a population‐based pregnancy cohort evaluated by Chinese GWG guidelines. We hypothesized that adherence to a higher‐quality diet during pregnancy could facilitate optimal GWG.
2. METHODS
2.1. Study population
This study was a population‐based prospective study conducted in Sichuan Provincial Hospital for Women and Children, Southwest China, which was designed to investigate the effects of maternal dietary, lifestyle and gestational weight gain on the health of pregnant women. From February to July 2017, the study recruited 1673 healthy women at maternity clinics who met the inclusion criteria: singleton pregnancy, gestational ages ranging from 6 to 14 weeks and no chronic metabolic diseases (pregestational diabetes, hypertension and hyperlipidemia, etc.). After omitting those with incomplete gestational weight data (n = 222), there were 1451 pregnant women eligible for the study. After excluding the participants with implausible energy intake and those without physical activity (PA) information, the final sample sizes in early, middle and late pregnancy were 1416, 971 and 997, respectively (Supporting Information: Figure S1). The study was approved by the Ethics Committee of Sichuan University. All participants provided written informed consent when they were recruited for the study.
2.2. Maternal characteristics
Demographic information and lifestyle information, including maternal age, educational level, household income, smoking and drinking status, gravidity and parity, were collected by a self‐designed questionnaire at enrolment via a face‐to‐face interview. Information on PA and dietary intake during pregnancy was obtained at the follow‐up visits. Self‐reported pre‐pregnancy weight and measured height at inclusion were collected to calculate pre‐pregnancy body mass index (BMI), which was categorized as underweight (BMI < 18.5 kg/m2), normal weight (18.5 ≤ BMI < 24.0 kg/m2), overweight (24.0 ≤ BMI < 28.0 kg/m2) and obese (BMI ≥ 28.0 kg/m2) according to the Chinese criteria. PA (presented as the metabolic equivalent of task‐hours/week) was measured using the Pregnancy Physical Activity Questionnaire, which has demonstrated good reliability and validity in Chinese pregnant women. The level of PA was classified into tertiles for group comparison. Maternal age was divided into four categories (<25, 25–30, 31–34 and ≥35 years). Parity and gravidity were both divided into two categories. Educational level was divided into four groups (secondary level or below, college, university, and graduate level or above). Household income level was categorized into four groups (≤451.65, 451.80–752.85, 753.00–1505.85, ≥1506.00 USD/month). Smoking and drinking status were regarded as dichotomized variables.
2.3. Exposure assessment
The primary exposure of interest was diet quality, measured by the Chinese Healthy Diet Index for Pregnancy (CHDI‐P). We performed dietary assessments respectively in early (gestational ages ranging from 6 to 14 weeks), middle (gestational ages ranging from 24 to 28 weeks) and late pregnancy (gestational ages ranging from 32 to 36 weeks). Food consumption was assessed by 24 h dietary recalls for 3 consecutive days, including 2 weekdays and 1 weekend day. Information on all types and amounts of food consumed by the participants in the past 24 h was collected through a standardized face‐to‐face interview at recruitment. The interviewers used standard serving bowls, cups, spoons and illustrative food pictures of various portion sizes and taught all participants how to describe food portion sizes to improve portion size estimation (Y. Ding et al., 2021). The next 2 days of dietary information was collected by specialized investigators via telephone interviews. Before conducting structured telephone interviews, the participants sent all the pictures of food they ate and drank to us, which helped us to get a larger picture of their diet. The validity of telephone interviews in the assessment of dietary intake by 24 h recalls has been confirmed in other studies (Brustad et al., 2003). The average daily intake of energy and nutrients was calculated using a Nutrition Calculator (V2.7.3).
2.4. CHDI‐P
Maternal dietary information obtained by 24 h dietary recall throughout pregnancy was used to calculate CHDI‐P scores. The development of the CHDI‐P was based on key recommendations in the 2016 edition of the Chinese dietary guidelines for pregnant women (CDG‐PW) (Y. X. Yang et al., 2018) and the evidence of associations between identified components and related health outcomes. Twenty‐three components mapped to the key dietary recommendations of the CDG‐PW were determined, assessing diet quality from three dimensions: ‘Diversity’ (the exact number of species from four basic food groups) aimed to evaluate whether an individual's diet met the basic principle of food diversity. Foods are divided into four basic groups, including grains, tubers and mixed beans; vegetables and fruits; meat, poultry, fish and eggs; dairy, soybeans and nuts. ‘Adequacy’ assessed whether the amount of ‘healthy food’ was within the recommendations to estimate nutritional status. ‘Limitation’ aimed at preliminary forecasting of the risk of chronic diseases and adverse pregnancy outcomes by some evidenced unhealthy food. Food categories were based on the Chinese balanced dietary pagoda for pregnant women (Supporting Information: Table S5) (Y. X. Yang et al., 2018). Twenty‐two food categories, including a supplement, were classified into ‘healthy’ in the ‘Adequacy’ dimension (whole grains and mixed beans, tubers, dark‐coloured vegetables, fruits, marine algae, poultry, red meats, animal liver and blood, fish and seafood, eggs, dairy, soybeans, nuts, iodized salt and folic acid supplements) and ‘unhealthy’ groups in ‘Limitation’ dimension (refined grains, fried foods, processed meats, cooking oil, sugary beverages and alcohol) according to the evidence of associations between food and health. The classification of food items was shown in Supporting Information: Table S4. Each dimension was assigned a different score range, and the overall index ranged from 0 to 100 points. The score for ‘Diversity’ ranged from 0 to 12. Full marks were given when meeting the recommendation, and one point was awarded for one food when failing to meet the recommendation. Healthy food groups in ‘Adequacy’ were given full marks when achieving the minimum amount of the recommendations and unhealthy food groups in ‘Limitation’ were given full marks when they were not consumed. The overall score of ‘Adequacy’ and ‘Limitation’ was 61 and 27 points, respectively. A higher score represented better eating habits, diet quality and nutritional status (Supporting Information: Table S6). More detailed information on the scoring part of CHDI‐P in early (Supporting Information: Table S1), middle (Supporting Information: Table S2) and late (Supporting Information: Table S3) pregnancy are shown in the supporting information.
2.5. Outcome assessment
The pregnant women's weights were measured three times during the follow‐up using standardized digital weighing scales by trained staff. The total GWG and weekly weight gain or the rate of GWG during middle and late pregnancy were calculated as follows: Total GWG = the measured weight at delivery—the self‐reported weight before pregnancy; the rate of GWG during middle and late pregnancy = (the measured weight at delivery−the measured weight at 12 ± 2 weeks gestation)/the number of weeks between the two measurements. The main outcome to be assessed was the level of gestational weight gain, evaluated by the recommendations from the Weight monitoring and evaluation during the pregnancy period of Chinese women guideline (CNS, 2021). Briefly, the guideline recommends a total GWG of 11.0–16.0 kg for women with singleton pregnancies and a pre‐pregnancy BMI categorized as underweight (BMI < 18.5 kg/m2), 8.0–14.0 kg for women categorized as normal weight (18.5 ≤ BMI < 24.0 kg/m2), 7.0–11.0 kg for women categorized as overweight (24.0 ≤ BMI < 28.0 kg/m2) and 5.0–9.0 kg for women categorized as obese (BMI ≥ 28.0 kg/m2). GWG was classified into adequate weight gain (AWG), insufficient weight gain (IWG) and excessive weight gain (EWG) according to pre‐pregnancy BMI.
2.6. Statistical analysis
The distributions of categorical variables were described as frequencies and percentages. Continuous variables were presented as the means and standard deviations. The comparisons of categorical variables between groups were conducted by χ 2 tests. Nonparametric Kruskal–Wallis tests were used to compare the continuous variables between groups. According to the main outcome, a univariate analysis was carried out to compare the patients in terms of the following: maternal age, educational level, household income, smoking and alcohol drinking status, parity, gravidity, pre‐pregnancy BMI, CHDI‐P score and level of PA.
Multinomial logistic regression analyses were used to study the influence of different levels of CHDI‐P scores on GWG, which was categorized into AWG (reference group), IWG and EWG. We adjusted pre‐pregnancy BMI, age, parity, gravidity and PA level in the logistic regression model. Women whose diet quality scores were in the third tertile were used as the reference group. Stratified analyses were performed to assess whether the associations between the CHDI‐P score and GWG were modified by pre‐pregnancy BMI (underweight, normal weight and overweight/obesity). All confidence intervals were estimated at the 95% level, and a p < 0.05 was considered statistically significant. The statistical analyses were performed with SPSS Statistics version 25.0 (IBM Corp.).
To examine whether the results of the association between the CHDI‐P score and GWG were stable, we conducted sensitivity analyses presented as forest plots by testing the consistency between the results, using the recommendations from the IOM (Medicine & Council, 2009) and CNS (CNS, 2021). A total GWG within the IOM recommendations was considered as AWG, a total of GWG above the recommendations was considered as EWG and below the recommendations will be considered as IWG.
3. RESULTS
3.1. Baseline characteristics
The included pregnant women were divided into three groups, according to their adequacy of weight gain during pregnancy. The three categories were as follows: IWG, 170 women (11.7%); AWG, 612 women (42.2%); and EWG, 669 women (46.1%).
The maternal characteristics are shown in Table 1. The mean age of the participants from the three categories was 29.5 (SD 4.0) years in the IWG group, 28.8 (SD 4.1) years in the AWG group and 28.3 (SD 4.0) years in the EWG group. The mean pre‐pregnancy BMI was 22.0 (SD 3.3) kg/m2 in the IWG group, 20.7 (SD 2.6) kg/m2 in the AWG group and 21.1 (SD 2.6) kg/m2 in the EWG group. The women in the IWG group tended to be underweight or overweight before pregnancy, while the women in the EWG group tended to be obese before pregnancy. In terms of educational level, the participants with IWG had more years of schooling, while the pregnant women with EWG had fewer years of schooling.
Table 1.
Baseline population characteristics by the adequacy of GWG (n = 1451)
| Characteristics | Gestational weight gain | p a | ||
|---|---|---|---|---|
| IWG (n = 170) | AWG (n = 612) | EWG (n = 669) | ||
| Baseline age (years), N (%) | ||||
| <25 | 17 (10.0) | 101 (16.5) | 134 (20.0) | 0.953 |
| 25–30 | 109 (64.1) | 373 (60.9) | 405 (60.5) | |
| 31–34 | 23 (13.5) | 82 (13.4) | 76 (11.4) | |
| ≥35 | 21 (12.4) | 56 (9.2) | 54 (8.1) | |
| Pre‐pregnancy BMI (kg/m2), N (%) | ||||
| Low weight (BMI < 18.5) | 29 (17.1) | 102 (16.7) | 76 (11.4) | 0.001 |
| Adequate (BMI 18.5–24.0) | 105 (61.8) | 458 (74.8) | 498 (74.4) | |
| Overweight/obesity (BMI ≥ 24.0) | 36 (21.2) | 52 (8.5) | 95 (14.2) | |
| Educational level, N (%) | ||||
| Secondary level or below | 36 (21.2) | 126 (20.6) | 181 (27.1) | 0.016 |
| College level | 57 (33.5) | 228 (37.3) | 235 (35.1) | |
| University level | 60 (35.3) | 218 (35.6) | 217 (32.4) | |
| Graduate level or above | 17 (10.0) | 40 (6.5) | 36 (5.4) | |
| Household income (USD/month) b , N (%) | ||||
| ≤451.65 | 6 (3.5) | 20 (3.3) | 25 (3.7) | 0.857 |
| 451.80–752.85 | 52 (30.6) | 181 (29.6) | 193 (28.8) | |
| 753.00–1505.85 | 75 (44.1) | 289 (47.2) | 302 (45.1) | |
| ≥1506.00 | 37 (21.8) | 122 (19.9) | 149 (22.3) | |
| Smoking status, N (%) | 3 (1.8) | 19 (3.1) | 30 (4.5) | 0.163 |
| Alcohol intake status, N (%) | 8 (4.7) | 42 (6.9) | 61 (9.1) | 0.098 |
| Primiparity, N (%) | 111 (65.3) | 425 (69.4) | 493 (73.7) | 0.056 |
| Primigravida, N (%) | 66 (38.8) | 279 (45.6) | 289 (43.2) | 0.273 |
Abbreviations: AWG, adequate weight gain; BMI, body mass index; CNY, Chinese Yuan; EWG, excessive weight gain; GWG, gestational weight gain; IWG, insufficient weight gain; USD, US Dollar.
p value calculated using Pearson's χ 2 test to show differences between the groups of the characteristics. p < 0.05 was set as statistically significant and presented as bold values.
1 CNY = 0.1506 USD.
3.2. Associations between CHDI‐P and gestational weight gain risk
The median scores of CHDI‐P during pregnancy are shown in Table 2. We found significant differences in CHDI‐P scores between the three groups in the second and third trimesters, while no significant difference in the first trimester. A higher CHDI‐P score implied a higher intake of energy and nutrients. Most nutrient and energy intakes were significantly positively associated with the CHDI‐P score throughout pregnancy, p < 0.001 (Table S6).
Table 2.
CHDI‐P and PA of pregnant women throughout pregnancy according to the adequacy of GWG
| Variables | Gestational weight gain | p a | ||
|---|---|---|---|---|
| IWG | AWG | EWG | ||
| Early pregnancy b | n = 165 | n = 597 | n = 654 | |
| CHDI‐P total score, c N (%) | ||||
| 1st tertile (≤53.75) | 61 (37.0) | 208 (34.8) | 214 (32.7) | 0.325 |
| 2nd tertile (53.76−59.50) | 60 (36.4) | 189 (31.7) | 219 (33.5) | |
| 3rd tertile (≥59.51) | 44 (26.7) | 200 (33.5) | 221 (33.8) | |
| CHDI‐P components, d M (IQR) | ||||
| Diversity (0–12 points) | 10.0 (9.0–11.0) | 10.0 (9.0–11.0) | 10.0 (9.0–11.0) | 0.110 |
| Adequacy (0–55 points) | 21.5 (18.0–24.0) | 22.0 (18.0–25.0) | 21.5 (18.0–25.0) | 0.813 |
| Limitation (0–33 points) | 24.75 (22.00–27.50) | 24.75 (22.00–27.50) | 24.75 (22.00–27.50) | 0.164 |
| Total score (0–100 points) | 56.50 (51.75–60.00) | 56.50 (51.75–61.38) | 57.00 (52.19–61.50) | 0.442 |
| PA (MET‐h/week), c N (%) | ||||
| 1st tertile (≤86.26) | 48 (29.1) | 192 (32.2) | 223 (34.1) | 0.662 |
| 2nd tertile (86.27–123.40) | 60 (36.4) | 211 (35.3) | 206 (31.5) | |
| 3rd tertile (≥123.41) | 57 (34.5) | 194 (32.5) | 225 (34.4) | |
| Middle pregnancy b | n = 123 | n = 405 | n = 443 | |
| CHDI‐P total score, c N (%) | ||||
| 1st tertile (≤53.75) | 42 (34.1) | 114 (28.1) | 168 (37.9) | 0.008 |
| 2nd tertile (53.76–60.25) | 36 (29.3) | 144 (35.6) | 146 (33.0) | |
| 3rd tertile (≥60.26) | 45 (36.6) | 147 (36.3) | 129 (29.1) | |
| CHDI‐P components, d M (IQR) | ||||
| Diversity (0–12 points) | 11.0 (10.0–12.0) | 11.0 (10.0–12.0) | 11.0 (10.0–12.0) | 0.216 |
| Adequacy (0–61 points) | 25.0 (19.0–29.0) | 25.0 (20.5–29.0) | 23.5 (19.0–27.5) | 0.020 |
| Limitation (0–27 points) | 22.50 (20.25–24.75) | 22.50 (20.25–24.75) | 22.50 (20.25–24.75) | 0.083 |
| Total score (0–100 points) | 57.00 (51.50–62.25) | 57.75 (52.56–62.50) | 56.50 (50.81–61.50) | 0.009 |
| PA (MET‐h/week), c N (%) | ||||
| 1st tertile (≤85.38) | 39 (31.7) | 112 (27.7) | 164 (37.0) | 0.021 |
| 2nd tertile (85.39−119.96) | 42 (34.1) | 147 (36.3) | 139 (31.4) | |
| 3rd tertile (≥119.97) | 42 (34.1) | 146 (36.0) | 140 (31.6) | |
| Late pregnancy b | n = 113 | n = 437 | n = 447 | |
| CHDI‐P total score, c N (%) | ||||
| 1st tertile (≤53.75) | 27 (23.9) | 132 (30.2) | 167 (37.4) | <0.001 |
| 2nd tertile (53.76–61.00) | 33 (29.2) | 144 (33.0) | 159 (35.6) | |
| 3rd tertile (≥61.01) | 53 (46.9) | 161 (36.8) | 121 (27.1) | |
| CHDI‐P components, d M (IQR) | ||||
| Diversity (0–12 points) | 11.0 (11.0–12.0) | 11.0 (10.0–12.0) | 11.0 (10.0–12.0) | 0.465 |
| Adequacy (0–61 points) | 26.0 (21.0–30.0) | 24.0 (19.5–28.5) | 22.5 (17.5–27.5) | <0.001 |
| Limitation (0–27 points) | 22.50 (20.25–24.75) | 22.50 (22.50–24.75) | 22.50 (20.25–24.75) | 0.001 |
| Total score (0–100 points) | 60.75 (54.13–65.63) | 58.00 (52.75–63.75) | 56.00 (50.94–61.75) | <0.001 |
| PA (MET‐h/week), c N (%) | ||||
| 1st tertile (≤76.63) | 33 (29.2) | 134 (30.7) | 162 (36.2) | 0.037 |
| 2nd tertile (76.64–111.60) | 37 (32.7) | 139 (31.8) | 153 (34.2) | |
| 3rd tertile (≥111.61) | 43 (38.1) | 164 (37.5) | 132 (29.5) | |
Abbreviations: AWG, adequate weight gain; CHDI‐P, Chinese Healthy Diet Index of Pregnancy; EWG, excessive weight gain; GWG, gestational weight gain; IQR, interquartile range; IWG, insufficient weight gain; M, median; MET, metabolic equivalent of task; PA, physical activity.
Pearson's χ 2 test was used for categorical variables, and nonparametric Kruskal–Wallis test was used for continuous variables. p < 0.05 was set as statistically significant and presented as bold values.
Early pregnancy: 14 gestational weeks; middle pregnancy: 14 weeks≤ gestational ages <28 weeks; late pregnancy: ≥28 gestational weeks.
Categorical variables were shown in N (%).
Continuous variables were shown in median (IQR).
There was a significant difference among groups in terms of weekly weight gain during middle and late pregnancy. The median weight gain per week was increased more in the EWG women (0.61 kg/week) than in the AWG women (0.47 kg/week) and IWG women (0.28 kg/week), p < 0.001.
Multiple logistic regression with the CHDI‐P score, PA level, pre‐pregnancy BMI, maternal age, gravidity and parity identified the CHDI‐P score in middle pregnancy as an independent factor associated with EWG. The pregnant women whose CHDI‐P scores fell in T1 (≤52.50), indicating the poorest diet quality, had a 1.53 times greater chance of EWG (95% CI: 1.08–2.17, p = 0.016) than those with CHDI‐P scores in T3. In late pregnancy, the pregnant women whose CHDI‐P scores were in T1 and T2 had a 1.71‐fold (95% CI: 1.21–2.41, p = 0.002) and 1.59‐fold (95% CI: 1.13–2.23, p = 0.008) chance of EWG. The scores for ‘Adequacy’ in the second (OR = 0.97, 95% CI: 0.95–0.99, p = 0.010) and third trimesters (OR = 0.97, 95% CI = 0.95‐0.99, p = 0.014) had a protective association with EWG, while the scores for ‘Limitation’ (OR = 1.05, 95% CI = 1.01–1.08, p = 0.016) and ‘Diversity’ (OR = 1.10, 95% CI = 1.00–1.21, p = 0.041) in the first trimester had an adverse association with EWG. We did not find a significant association between CHDI‐P score and the risk of IWG throughout pregnancy, the same results were also observed between any components of CHDI‐P and IWG (Table 3).
Table 3.
Multiple multinomial regression analysis of the association between CHDI‐P and GWG
| Gestational weight gainb | Pregnancy c | Variables | OR | 95% CI | p a | |
|---|---|---|---|---|---|---|
| Inferior | Superior | |||||
| EWG | Early pregnancy (n = 1416) | CHDI‐P total score | ||||
| 1st tertile (≤53.75) | 0.86 | 0.65 | 1.14 | 0.290 | ||
| 2nd tertile (53.76–59.50) | 0.90 | 0.68 | 1.19 | 0.476 | ||
| 3rd tertile (≥59.51) d | 1.00 | |||||
| CHDI‐P components | ||||||
| Diversity (0–12 points) | 1.10 | 1.00 | 1.21 | 0.041 | ||
| Adequacy (0–55 points) | 0.99 | 0.97 | 1.02 | 0.421 | ||
| Limitation (0–33 points) | 1.05 | 1.01 | 1.08 | 0.016 | ||
| Middle pregnancy (n = 971) | CHDI‐P total score | |||||
| 1st tertile (≤53.75) | 1.53 | 1.08 | 2.17 | 0.016 | ||
| 2nd tertile (53.76–60.25) | 1.06 | 0.75 | 1.49 | 0.739 | ||
| 3rd tertile (≥60.26) d | 1.00 | |||||
| CHDI‐P components | ||||||
| Diversity (0–12 points) | 0.97 | 0.86 | 1.09 | 0.604 | ||
| Adequacy (0–61 points) | 0.97 | 0.95 | 0.99 | 0.010 | ||
| Limitation (0–27 points) | 0.97 | 0.92 | 1.03 | 0.351 | ||
| Late pregnancy (n = 997) | CHDI‐P total score | |||||
| 1st tertile (≤53.75) | 1.71 | 1.21 | 2.41 | 0.002 | ||
| 2nd tertile (53.76–61.00) | 1.59 | 1.13 | 2.23 | 0.008 | ||
| 3rd tertile (≥61.01) d | 1.00 | |||||
| CHDI‐P components | ||||||
| Diversity (0–12 points) | 1.04 | 0.91 | 1.19 | 0.569 | ||
| Adequacy (0–61 points) | 0.97 | 0.95 | 0.99 | 0.014 | ||
| Limitation (0–27 points) | 0.94 | 0.89 | 1.01 | 0.073 | ||
| IWG | Early pregnancy (n = 1416) | CHDI‐P total score | ||||
| 1st tertile (≤53.75) | 1.32 | 0.85 | 2.06 | 0.221 | ||
| 2nd tertile (53.76–59.50) | 1.40 | 0.90 | 2.18 | 0.134 | ||
| 3rd tertile (≥59.51) d | 1.00 | |||||
| CHDI‐P components | ||||||
| Diversity (0–12 points) | 0.99 | 0.86 | 1.13 | 0.845 | ||
| Adequacy (0–55 points) | 1.00 | 0.96 | 1.03 | 0.804 | ||
| Limitations (0–33 points) | 1.02 | 0.96 | 1.07 | 0.527 | ||
| Middle pregnancy (n = 971) | CHDI‐P total score | |||||
| 1st tertile (≤53.75) | 1.20 | 0.72 | 1.99 | 0.483 | ||
| 2nd tertile (53.76–60.25) | 0.79 | 0.47 | 1.31 | 0.363 | ||
| 3rd tertile (≥60.26) d | 1.00 | |||||
| CHDI‐P components | ||||||
| Diversity (0–12 points) | 0.91 | 0.77 | 1.08 | 0.275 | ||
| Adequacy (0–61 points) | 0.99 | 0.96 | 1.02 | 0.528 | ||
| Limitation (0–27 points) | 1.05 | 0.95 | 1.15 | 0.358 | ||
| Late pregnancy (n = 997) | CHDI‐P total score | |||||
| 1st tertile (≤53.75) | 0.65 | 0.38 | 1.12 | 0.119 | ||
| 2nd tertile (53.76–61.00) | 0.75 | 0.45 | 1.25 | 0.267 | ||
| 3rd tertile (≥61.01) d | 1.00 | |||||
| CHDI‐P components | ||||||
| Diversity (0–12 points) | 0.95 | 0.77 | 1.17 | 0.613 | ||
| Adequacy (0–61 points) | 1.03 | 1.00 | 1.07 | 0.086 | ||
| Limitation (0–27 points) | 1.10 | 1.00 | 1.22 | 0.058 | ||
Abbreviations: BMI, body mass index; CHDI‐P, Chinese Healthy Diet Index of Pregnancy; CI, confidence interval; EWG, excessive weight gain; GWG, gestational weight gain; IWG, insufficient weight gain; OR, odds ratio.
Multivariate model was adjusted for age (<25, 25–30, 31–34 and ≥35 years), pre‐pregnancy BMI (<18.5 kg/m2, 18.5–23.9 kg/m2, 24.0–27.9 kg/m2, ≥28.0 kg/m2), physical activity level (tertile 1, 2 and 3), primiparity (yes, no) and primigravida (yes, no). p < 0.05 was set as statistically significant and presented as bold values.
Adequate gestational weight gain group was the reference group.
Early pregnancy: 14 gestational weeks; middle pregnancy: 14 weeks ≤ gestational ages <28 weeks; late pregnancy: ≥28 gestational weeks.
CHDI‐P scores in tertile 3 were used as the reference group.
3.3. Stratified analyses
The prevalence of IWG and EWG was significantly higher among overweight/obese women categorized by pre‐pregnancy BMI. Underweight women tended to have insufficient weight gain compared with normal‐weight women (Supporting Information: Table S7).
The relationship of the overall CHDI‐P score in late pregnancy with EWG was negative among participants in the overweight/obesity (OR = 4.25, 95% CI = 1.30–13.90, p = 0.017) and normal weight subgroups (OR = 1.78, 95% CI = 1.20–2.65, p = 0.004). A negative association between the CHDI‐P score in middle pregnancy and EWG was found only among normal‐weight pregnant women (OR = 1.53, 95% CI = 1.03–2.28, p = 0.036). However, an association between the CHDI‐P score in any period of pregnancy and EWG was not found among underweight women. In terms of IWG, the lowest CHDI‐P score in early pregnancy was significantly associated with a 1.84‐fold chance (95% CI = 1.04–3.24, p = 0.036) of IWG among normal‐weight women, while a moderate CHDI‐P score in late pregnancy was significantly related to a lower risk of IWG among underweight women (OR = 0.14, 95% CI = 0.02–0.82, p = 0.029). We did not find a significant association between the CHDI‐P score and IWG among overweight/obese women (Table 4).
Table 4.
Multiple multinomial regression analyses of the association between CHDI‐P and GWG stratified by pre‐pregnancy BMI
| Gestational weight gain b | Pre‐pregnancy BMI | Pregnancy c | Variables | OR | 95% CI | p a | |
|---|---|---|---|---|---|---|---|
| Inferior | Superior | ||||||
| EWG | Underweight | Early pregnancy (n = 201) | 1st tertile | 1.27 | 0.58 | 2.78 | 0.546 |
| 2nd tertile | 1.02 | 0.47 | 2.24 | 0.960 | |||
| 3rd tertile d | 1.00 | ||||||
| Middle pregnancy (n = 127) | 1st tertile | 1.54 | 0.54 | 4.44 | 0.420 | ||
| 2nd tertile | 0.79 | 0.28 | 2.24 | 0.656 | |||
| 3rd tertile d | 1.00 | ||||||
| Late pregnancy (n= 134) | 1st tertile | 0.64 | 0.23 | 1.79 | 0.396 | ||
| 2nd tertile | 0.80 | 0.30 | 2.13 | 0.649 | |||
| 3rd tertile d | 1.00 | ||||||
| Normal weight | Early pregnancy (n = 1037) | 1st tertile | 0.88 | 0.64 | 1.22 | 0.445 | |
| 2nd tertile | 0.90 | 0.66 | 1.24 | 0.533 | |||
| 3rd tertile d | 1.00 | ||||||
| Middle pregnancy (n = 713) | 1st tertile | 1.53 | 1.03 | 2.28 | 0.036 | ||
| 2nd tertile | 1.08 | 0.73 | 1.59 | 0.708 | |||
| 3rd tertile d | 1.00 | ||||||
| Late pregnancy (n = 741) | 1st tertile | 1.78 | 1.20 | 2.65 | 0.004 | ||
| 2nd tertile | 1.77 | 1.20 | 2.60 | 0.004 | |||
| 3rd tertile d | 1.00 | ||||||
| Overweight/obesity | Early pregnancy (n = 178) | 1st tertile | 0.68 | 0.26 | 1.78 | 0.428 | |
| 2nd tertile | 0.90 | 0.32 | 2.54 | 0.840 | |||
| 3rd tertile d | 1.00 | ||||||
| Middle pregnancy (n = 131) | 1st tertile | 1.46 | 0.50 | 4.21 | 0.488 | ||
| 2nd tertile | 0.89 | 0.31 | 2.54 | 0.828 | |||
| 3rd tertile d | 1.00 | ||||||
| Late pregnancy (n = 122) | 1st tertile | 4.25 | 1.30 | 13.90 | 0.017 | ||
| 2nd tertile | 1.27 | 0.35 | 4.62 | 0.722 | |||
| 3rd tertile d | 1.00 | ||||||
| IWG | Underweight | Early pregnancy (n = 201) | 1st tertile | 1.14 | 0.39 | 3.28 | 0.815 |
| 2nd tertile | 0.74 | 0.27 | 2.08 | 0.572 | |||
| 3rd tertile d | 1.00 | ||||||
| Middle pregnancy (n = 127) | 1st tertile | 1.30 | 0.34 | 5.01 | 0.701 | ||
| 2nd tertile | 0.59 | 0.14 | 2.54 | 0.478 | |||
| 3rd tertile d | 1.00 | ||||||
| Late pregnancy (n = 134) | 1st tertile | 0.37 | 0.09 | 1.51 | 0.166 | ||
| 2nd tertile | 0.14 | 0.02 | 0.82 | 0.029 | |||
| 3rd tertile d | 1.00 | ||||||
| Normal weight | Early pregnancy (n = 1037) | 1st tertile | 1.84 | 1.04 | 3.24 | 0.036 | |
| 2nd tertile | 1.82 | 1.03 | 3.20 | 0.038 | |||
| 3rd tertile d | 1.00 | ||||||
| Middle pregnancy (n = 713) | 1st tertile | 1.31 | 0.71 | 2.44 | 0.393 | ||
| 2nd tertile | 0.80 | 0.43 | 1.52 | 0.502 | |||
| 3rd tertile d | 1.00 | ||||||
| Late pregnancy (n = 741) | 1st tertile | 0.63 | 0.32 | 1.25 | 0.188 | ||
| 2nd tertile | 1.01 | 0.55 | 1.85 | 0.977 | |||
| 3rd tertile d | 1.00 | ||||||
| Overweight/obesity | Early pregnancy (n = 178) | 1st tertile | 0.58 | 0.17 | 2.00 | 0.392 | |
| 2nd tertile | 1.02 | 0.28 | 3.71 | 0.978 | |||
| 3rd tertile d | 1.00 | ||||||
| Middle pregnancy (n = 131) | 1st tertile | 0.80 | 0.23 | 2.83 | 0.730 | ||
| 2nd tertile | 0.83 | 0.22 | 3.15 | 0.787 | |||
| 3rd tertile d | 1.00 | ||||||
| Late pregnancy (n = 122) | 1st tertile | 0.72 | 0.19 | 2.81 | 0.637 | ||
| 2nd tertile | 0.71 | 0.19 | 2.68 | 0.613 | |||
| 3rd tertile d | 1.00 | ||||||
Abbreviations: BMI, body mass index; CHDI‐P, Chinese Healthy Diet Index of Pregnancy; CI, confidence interval; EWG, excessive weight gain; GWG, gestational weight gain; IWG, insufficient weight gain; OR, odds ratio.
All participants were divided into underweight (BMI < 18.5 kg/m2), normal weight (18.5 ≤ BMI < 24.0 kg/m2), and overweight/obesity (BMI ≥ 24.0 kg/m2) to conducted stratified analyses. Multivariate model was adjusted for age (<25, 25–30, 31–34 and ≥35 years), physical activity level (tertile 1, 2 and 3), primiparity (yes, no) and primigravida (yes, no). p < 0.05 was set as statistically significant and presented as bold values.
Adequate gestational weight gain group was the reference group.
Early pregnancy: <14 gestational weeks; middle pregnancy: 14 weeks ≤ gestational ages <28 weeks; late pregnancy: ≥28 gestational weeks.
CHDI‐P scores in tertile 3 were used as the reference group.
3.4. Sensitivity analyses
We used the guidelines recommended by the IOM and CNS to compare the consistency of the results, adjusting for the same confounding factors but classifying gestational weight gain by different cut‐off values. We found that adopting different recommendations did not substantially change the association between CHDI‐P scores and the risk of EWG and IWG (Figure 1).
Figure 1.
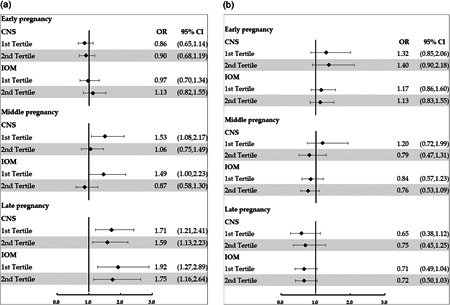
Forest plot of the association between CHDI‐P throughout pregnancy and GWG. (a) Forest plot of the association between CHDI‐P scores throughout pregnancy and EWG when classified by the recommendations of the IOM and CNS; (b) Forest plot of the association between CHDI‐P scores throughout pregnancy and IWG when classified by the recommendations of the IOM and CNS. Black dots denote logistic regression coefficients and horizontal lines denote 95% confidence intervals. CHDI‐P scores in the third tertile were used as the reference group. CHDI‐P, Chinese healthy diet index for pregnancy; CNS, Chinese Nutrition Society; EWG, excessive weight gain; GWG, gestational weight gain; IOM, Institute of Medicine; IWG, insufficient weight gain.
4. DISCUSSION
In this study, we used a new technique to evaluate diet quality during pregnancy and estimated its association with the adequacy of GWG assessed by recommendations developed by the CNS. We found a higher prevalence of EWG (46.1%) than IWG (11.7%) among Chinese pregnant women, while poorer diet quality in the middle and late pregnancy might contribute to EWG.
Compared with the previous diet quality index, the CHDI‐P is more comprehensive and applicable for Chinese pregnancies based on the CDG‐PW and the latest studies on pregnancy outcomes. According to the CDG‐PW(Y. X. Yang et al., 2018), the diversity of food intake, ensures a wider range of nutrients for a pregnant woman's body and the growing foetus (Cox & Phelan, 2008), is the basic principle of a balanced diet. Diversity is quantified by the number of consumed foods in the CDG‐PW (Y. X. Yang et al., 2018), so we calculated the number of foods consumed from four basic groups per day as the diversity score. The principle of ‘Adequacy’ in the CHDI‐P was the adequacy of nutrients during pregnancy. Therefore, except for commonly recommended foods, we particularly subdivided iron‐rich foods (animal liver, animal blood and red meats), iodize rich foods (iodized salt and marine algae) (Y. W. Yang & Pan, 2019) and folic acid supplements (because of the poor bioavailability of folic acid from food [Wright et al., 2010]) to further examine critical nutrients during pregnancy. Except for types of foods, the form of food preparation highly influenced health, which was the consideration in developing the ‘Limitation’ dimension. Foods high in oil, salt and sugar would increase the risk of GDM (Goran et al., 2019), EWG (Itani et al., 2020) and gestational hypertension (Raghavan et al., 2019). Hence, these foods were suggested to be limited in the CHDI‐P evaluation. Refined grains were scored for an appropriate range of intake based on recent studies that proved that carbohydrate sources with a higher glycaemic index tend to be high in energy density and could contribute to higher GWG (McGowan et al., 2013). Food categories and amounts were based on the Chinese balanced dietary pagoda for pregnant women (Y. X. Yang et al., 2018) (Supporting Information: Table S5). The scores of most food groups were equal to the Base Score (BS), except for whole grains (Pathirannehelage & Joye, 2020), dark‐coloured vegetables (Wallace et al., 2020; Zerfu et al., 2018), fish and seafood (Byrd et al., 2021; Liu & Ralston, 2021) and animal liver (Cook & Monsen, 1976), which have more beneficial effects on pregnancy outcomes, and were weighted as two times of the BS. The score for tubers was one‐third of the BS due to the evidence of a potentially harmful effect on health (Itani et al., 2020) (Supporting Information: Table S1‐S3). Because of different nutritional needs during different periods of pregnancy, the scoring system was distinguished between early, middle and late pregnancy. The comprehensive considerations of the chosen components and their significant associations with energy and nutrient intakes confirm the ability of the CHDI‐P to capture diet quality. Thus, it could serve as a nutritional assessment tool during pregnancy and be adopted by medical staff to assess an individual's diet using 24 h recall.
Before the weight monitoring and evaluation during the pregnancy period of Chinese women guideline was published, studies about GWG in Chinese pregnancies have mostly adopted the recommendations from the IOM. However, due to the great differences between Chinese and American populations in genetic characteristics, dietary patterns and the different criteria for categorizing BMI (Wang et al., 2018), the applications of these results were limited. Thus, it is necessary to adopt Chinese guidelines for GWG when evaluating the adequacy of GWG among Chinese pregnant women. Although the prevalence of IWG and EWG measured by the recommended guidelines from the IOM (IWG: 28.9%; EWG: 28.6%) and CNS were different, the results from the sensitivity analyses still demonstrated the significant effect of diet quality during pregnancy on GWG.
According to our research, EWG seemed to be a more serious problem than IWG in pregnant women in China (Liang et al., 2019; Xu et al., 2021) and other countries (Goldstein et al., 2018). Fortunately, we found that diet quality, specifically the CHDI‐P score, had a significant protective effect on EWG. Conversely, an association between diet quality and IWG was not observed in our study. Our findings corroborate the effect of dietary assessment tools on EWG from studies conducted in Brazil (Almeida et al., 2021), Norway (Hillesund et al., 2014) and Sweden (Augustin et al., 2020). Regardless of what components the tools consist of, a higher score was always correlated with a better intake of nutrients and good eating habits and food choices (Fransen & Ocké, 2008). However, a study performed in Malaysia that adopted the Healthy Eating Index score demonstrated an inverse association in the second and third trimesters among normal weight and overweight/obese women (Yong et al., 2019). Further analyses of specific food intakes found that those with higher intakes of fruits and milk in the third trimester were more likely to have EWG. In contrast, the upper intake of fruits was limited in the CHDI‐P, and the amount of dairy consumed by our participants was mostly below the recommendations. Moreover, the methods of food preparation influenced the energy density of foods such as fruits consumed as juice and sweet desserts, and milk consumed as flavoured milk and milkshakes (Yong et al., 2019). When these foods were still considered positive contributors to the total score, they led to an inverse conclusion, which also confirmed the significance of evaluating healthy and unhealthy foods distinguished by the form of eating. In our study, the dietary differences among groups divided by the adequacy of GWG are mainly embodied in the ‘Adequacy’ score. A higher score for the ‘Adequacy’ dimension reflected a higher intake of healthy foods, such as whole grains, dark‐coloured vegetables, fish and seafood. This finding could also be detected in a Michigan pregnancy cohort study suggesting that a higher intake of fruits and vegetables could reduce the odds of EWG (Hirko et al., 2020). Cano‐Ibanez et al. also concluded that dietary fibre, vitamins B9, D and E, calcium, iodine from vegetables, whole grains, nuts and olive oil contributed to reducing GWG (Cano‐Ibanez et al., 2020). In fact, the food groups in the ‘Adequacy’ dimension were rich sources of vitamins, minerals, fibres and antioxidants. These nutrients have a positive role in the stimulation of the immune system, cholesterol synthesis, antioxidant defence and hormone metabolism modulation (Lampe, 1999). The findings from a study showed that EWG, as well as high intake of Western‐like diets, were associated with higher concentrations of inflammatory factors such as high‐sensitivity C‐reactive protein, interleukin‐8 and serum amyloid (Hrolfsdottir et al., 2016). Thus, consuming healthy foods with a high content of anti‐inflammatory factors might reduce the occurrence of EWG caused by these inflammatory factors. We did not find any relationship between the ‘Limitation’ score and EWG. Food groups, including fried foods, sugary beverages, processed meats, alcohol, cooking oil and refined grains have been demonstrated to be associated with an increased risk of EWG in previous studies (Greathouse et al., 2021; Itani et al., 2020; Maugeri et al., 2019; Tielemans et al., 2015; J. Yang et al., 2021). The inconsistent conclusion might be because of a lower intake of these non‐healthy products reported by the pregnant women in our study, which made the identification of this association more difficult. Another explanation could be that women who presented a higher GWG (overweight/obese women) over‐reported food groups considered ‘healthy’, resulting in an information bias, as other authors had extensively communicated (Maugeri et al., 2019; Wrottesley et al., 2017). Last, an effect of the ‘Diversity’ score in middle and late pregnancy on GWG was not found in our study. Consistent (J. Yang et al., 2021) and inconsistent (Misgina et al., 2021) findings have been observed in previous studies. It is worth noting that these studies were both conducted in low‐income countries, and the dietary diversity tools used in these studies were developed by the Food and Agriculture Organization of the United Nations (FAO) to evaluate the nutritional adequacy of women from low‐income countries. However, the number of foods consumed by women was strongly influenced by the household income level and socioeconomic empowerment of women (Misgina et al., 2021), which might not be an obvious problem in our population.
Considering the lower prevalence of IWG among our participants and the limited sample size, the protective effect of the CHDI‐P score on IWG might not be observed. Similar results that prenatal diet quality might not predict IWG were also found among American pregnant women (Schlaff et al., 2020). Inaccurate dietary information should also be taken into consideration when interpreting the findings.
Our study also observed that the effect of the CHDI‐P score on GWG only existed in the second and third trimesters. The score in early pregnancy was the lowest throughout pregnancy, which was mainly influenced by symptoms of nausea and vomiting in early pregnancy (Moran et al., 2013). Furthermore, the contribution of weight gain in the first trimester to the total weight gain was not obvious and essential (Ancira‐Moreno et al., 2019), which also supported the suggestion of 0–2 kg weight gain during the first trimester from GWG guidelines. However, eating habits in early pregnancy reflected pre‐pregnancy dietary patterns, and they were more likely to be improved during pregnancy. Thus, it is still necessary to pay attention to diet quality in the first trimester to provide nutrition guidance.
It is worth noting that overweight/obese women had a significantly higher risk of EWG, while a relationship between diet quality and IWG was not found. Almeida et al. (2021) observed a 3‐fold higher risk of EWG among obese women, supporting our findings, while inconsistent observations also exist in the studies conducted by Yong et al. (2019) and Hillesund et al. (2014). A potential interpretation might be the different components composing the diet quality index, which signified a distinct emphasis on dietary patterns. Among normal‐weight pregnancies, we did not observe an obvious change in the risk for EWG but still observed the protective effect of diet quality on EWG in the second and third trimesters, similar to the results concluded from the Norwegian Mother and Child Cohort Study (Hillesund et al., 2014). However, the associations between CHDI‐P and IWG among underweight and normal‐weight women should be proved and interpreted by more studies with a larger sample size.
The CHDI‐P was constructed to assist individuals in achieving general health and better nutritional status rather than capturing the healthiest diet aiming at specific pregnancy outcomes. However, we found a convincing association between CHDI‐P scores and GWG, which is a key mediator for maternal diet and birth outcomes, as well as a strong risk factor for other pregnancy complications on its own, confirming the potential ability of the CHDI‐P as a predicator of other pregnancy outcomes. Therefore, it is necessary to investigate the association of CHDI‐P scores with other pregnancy outcomes in a larger population.
The strengths of our study, from a methodological perspective, were the comprehensive diet quality evaluation tool that was used to estimate diet quality during pregnancy and the use of the GWG guideline recommended by the CNS. The use of a comprehensive diet assessment tool, rather than investigating single food groups as exposures in relation to health outcomes, had the advantage of capturing a larger part of whole diet complexity with potential inherent interactive or synergistic effects of foods eaten in combination (Moeller et al., 2007). The use of the regional diet quality index and GWG guidelines increased the generalizability of our results to Chinese pregnant women. The sensitivity analyses of the consistency towards the results from the IOM and CNS for GWG proved the stability of the association between diet quality and GWG. Moreover, our study had a prospective design with detailed covariate information. We considered the effect of diet throughout pregnancy, rather than during a specific period, on GWG, which emphasized the importance of targeted nutritional instruction during specific periods and continuous nutritional monitoring throughout pregnancy.
Nevertheless, the present study also had some limitations. First, measurement error, which was associated with recall bias of 24 h dietary recall and the recognition of portion size, might have resulted in the inaccurate collection of food consumption data. Second, we used self‐reported pre‐pregnancy weight. Although high correlations were found between self‐reported and measured pre‐pregnancy weights (Oken et al., 2007), there might be potential misclassifications of pre‐pregnancy BMI. Third, our data were from a prospective cohort study from one hospital with good medical resources in Chengdu, which is in the southwestern region of China, indicating the lack of representativeness of the population. Thus, the extrapolation of our conclusions to other regions of China should be done with caution. In addition, consistent with other observational studies, the possibility of residual confounding from unmeasured or unknown covariates cannot be ruled out, although adjustment for multiple potential confounders was included in the analyses. Lastly, we did not collect information on the accurate intake of cooking oil and salt, which might lead to a bias when calculating the total CHDI‐P score. However, we adjusted the score according to an individual's salty and greasy taste preferences to reduce the potential bias.
5. CONCLUSION
In conclusion, poor diet quality in the second and third trimesters was associated with a higher risk of EWG, especially in women defined as being overweight/obese based on pre‐pregnancy BMI. Our study strengthens the importance of interventions on diet quality during pregnancy to reduce the risk of abnormal GWG. Furthermore, additional research that includes a larger sample size from other regions of China should be carried out to confirm the associations between the CHDI‐P scores and GWG.
AUTHOR CONTRIBUTIONS
Mengtong Yang, Qiuyu Feng, Cong Chen, Sijia Chen, Yishan Guo, Danping Su and Hong Chen performed the data acquisition. Mengtong Yang, Qiuyu Feng and Guo Zeng designed an analysis plan. Mengtong Yang conducted the statistical analysis and drafted the manuscript. Hong Sun, Hongli Dong and Guo Zeng reviewed and edited the manuscript. Guo Zeng supervised the statistical analysis. All authors read and approved the final manuscript.
CONFLICT OF INTEREST
The authors declare no conflict of interest.
ETHICS STATEMENT
The current study was conducted according to the guidelines laid down in the Declaration of Helsinki, and all procedures involving research study participants were approved by the Ethics Committee of Sichuan University (K2017037). Written informed consent was obtained from all subjects.
Supporting information
Supporting information.
ACKNOWLEDGEMENTS
The authors would like to thank all of the pregnant women who participated in the study. The study was supported by the Danone Nutrition Centre for dietary nutrition research and Education (grant number DIC2016‐06). The founders did not participate in the study design, analysis or article writing.
Yang, M. , Feng, Q. , Chen, C. , Chen, S. , Guo, Y. , Su, D. , Chen, H. , Sun, H. , Dong, H. , & Zeng, G. (2023). Healthier diet associated with reduced risk of excessive gestational weight gain: A Chinese prospective cohort study. Maternal & Child Nutrition, 19, e13397. 10.1111/mcn.13397
DATA AVAILABILITY STATEMENT
The data that support the findings of this study are available on request from the corresponding author. The data are not publicly available due to privacy or ethical restrictions.
REFERENCES
- Almeida, V. A. H. , Costa, R. A. , Paganoti, C. F. , Mikami, F. C. , Sousa, A. M. S. , Peres, S. V. , Lopes, M. A. B. , & Francisco, R. P. V. (2021). Diet quality indices and physical activity levels associated with adequacy of gestational weight gain in pregnant women with gestational diabetes mellitus. Nutrients, 13, 1842. 10.3390/nu13061842 [DOI] [PMC free article] [PubMed] [Google Scholar]
- Ancira‐Moreno, M. , Vadillo‐Ortega, F. , Rivera‐Dommarco, J. Á. , Sánchez, B. N. , Pasteris, J. , Batis, C. , Castillo‐Castrejón, M. , & O'Neill, M. S. (2019). Gestational weight gain trajectories over pregnancy and their association with maternal diet quality: Results from the PRINCESA cohort. Nutrition, 65, 158–166. 10.1016/j.nut.2019.02.002 [DOI] [PMC free article] [PubMed] [Google Scholar]
- Augustin, H. , Winkvist, A. , & Barebring, L. (2020). Poor dietary quality is associated with low adherence to gestational weight gain recommendations among women in Sweden. Nutrients, 12, 317. 10.3390/nu12020317 [DOI] [PMC free article] [PubMed] [Google Scholar]
- Berezowsky, A. , & Berger, H. (2021). Gestational weight gain and long‐term postpartum weight retention. Clinical and Experimental Obstetrics & Gynecology, 48, 466–471. 10.31083/j.ceog.2021.03.2413 [DOI] [Google Scholar]
- Brustad, M. , Skeie, G. , Braaten, T. , Slimani, N. , & Lund, E. (2003). Comparison of telephone vs face‐to‐face interviews in the assessment of dietary intake by the 24 h recall EPIC SOFT program—The Norwegian calibration study. European Journal of Clinical Nutrition, 57, 107–113. 10.1038/sj.ejcn.1601498 [DOI] [PubMed] [Google Scholar]
- Byrd, K. A. , Thilsted, S. H. , & Fiorella, K. J. (2021). Fish nutrient composition: A review of global data from poorly assessed inland and marine species. Public Health Nutrition, 24, 476–486. 10.1017/s1368980020003857 [DOI] [PMC free article] [PubMed] [Google Scholar]
- Cano‐Ibanez, N. , Miguel Martinez‐Galiano, J. , Angel Luque‐Fernandez, M. , Martin‐Pelaez, S. , Bueno‐Cavanillas, A. , & Delgado‐Rodriguez, M. (2020). Maternal dietary patterns during pregnancy and their association with gestational weight gain and nutrient adequacy. International Journal of Environmental Research and Public Health, 17, 7908. 10.3390/ijerph17217908 [DOI] [PMC free article] [PubMed] [Google Scholar]
- CNS . (2021). Weight monitoring and evaluation during pregnancy period of Chinese women (T/CNSS 009‐2021). Accessed October 1, 2021. Retrieved from: http://www.mcnutri.cn/guifanzn/952200200.html
- Cook, J. D. , & Monsen, E. R. (1976). Food iron absorption in human subjects. III. Comparison of the effect of animal proteins on nonheme iron absorption. American Journal of Clinical Nutrition, 29, 859–867. 10.1093/ajcn/29.8.859 [DOI] [PubMed] [Google Scholar]
- Cox, J. T. , & Phelan, S. T. (2008). Nutrition during pregnancy. Obstetrics and Gynecology Clinics of North America, 35, 369–383. 10.1016/j.ogc.2008.04.001 [DOI] [PubMed] [Google Scholar]
- Ding, Y. , Xu, F. , Zhong, C. , Tong, L. , Li, F. , Li, Q. , Chen, R. , Zhou, X. , Li, X. , Cui, W. , Zhang, Y. , Huang, L. , Xu, S. , Liu, C. , Wu, J. , Chen, X. , Gao, Q. , Yang, N. , & Wang, Z. (2021). Association between Chinese dietary guidelines compliance index for pregnant women and risks of pregnancy complications in the Tongji Maternal and Child Health Cohort. Nutrients, 13, 829. 10.3390/nu13030829 [DOI] [PMC free article] [PubMed] [Google Scholar]
- Fransen, H. P. , & Ocké, M. C. (2008). Indices of diet quality. Current Opinion in Clinical Nutrition and Metabolic Care, 11, 559–565. 10.1097/mco.0b013e32830a49db [DOI] [PubMed] [Google Scholar]
- Goldstein, R. F. , Abell, S. K. , Ranasinha, S. , Misso, M. , Boyle, J. A. , Black, M. H. , & Teede, H. J. (2017). Association of gestational weight gain with maternal and infant outcomes: A systematic review and meta‐analysis. Obstetrical & Gynecological Survey, 72, 573–575. 10.1097/ogx.0000000000000494 [DOI] [PMC free article] [PubMed] [Google Scholar]
- Goldstein, R. F. , Abell, S. K. , Ranasinha, S. , Misso, M. L. , Boyle, J. A. , Harrison, C. L. , Black, M. H. , Li, N. , Hu, G. , Corrado, F. , Hegaard, H. , Kim, Y. J. , Haugen, M. , Song, W. O. , Kim, M. H. , Bogaerts, A. , Devlieger, R. , Chung, J. H. , & Teede, H. J. (2018). Gestational weight gain across continents and ethnicity: Systematic review and meta‐analysis of maternal and infant outcomes in more than one million women. BMC Medicine, 16, 153. 10.1186/s12916-018-1128-1 [DOI] [PMC free article] [PubMed] [Google Scholar]
- Goran, M. I. , Plows, J. F. , & Ventura, E. E. (2019). Effects of consuming sugars and alternative sweeteners during pregnancy on maternal and child health: Evidence for a secondhand sugar effect. Proceedings of the Nutrition Society, 78, 262–271. 10.1017/s002966511800263x [DOI] [PMC free article] [PubMed] [Google Scholar]
- Greathouse, K. L. , Padgett, R. N. , Petrosino, J. , Hastings‐Tolsma, M. , & Faucher, M. A. (2021). Exploration of diet quality by obesity severity in association with gestational weight gain and distal gut microbiota in pregnant African American women: opportunities for intervention. Maternal and Child Health Journal, 26, 882–894. 10.1007/s10995-021-03198-0 [DOI] [PubMed] [Google Scholar]
- Gunderson, E. P. , Abrams, B. , & Selvin, S. (2000). The relative importance of gestational gain and maternal characteristics associated with the risk of becoming overweight after pregnancy. International Journal of Obesity, 24, 1660–1668. 10.1038/sj.ijo.0801456 [DOI] [PubMed] [Google Scholar]
- Hillesund, E. R. , Bere, E. , Haugen, M. , & Overby, N. C. (2014). Development of a New Nordic Diet score and its association with gestational weight gain and fetal growth—a study performed in the Norwegian mother and child cohort study (MoBa). Public Health Nutrition, 17, 1909–1918. 10.1017/s1368980014000421 [DOI] [PMC free article] [PubMed] [Google Scholar]
- Hirko, K. A. , Comstock, S. S. , Strakovsky, R. S. , & Kerver, J. M. (2020). Diet during pregnancy and gestational weight gain in a Michigan Pregnancy Cohort. Current Developments in Nutrition, 4, nzaa121. 10.1093/cdn/nzaa121 [DOI] [PMC free article] [PubMed] [Google Scholar]
- Hochner, H. , Friedlander, Y. , Calderon‐Margalit, R. , Meiner, V. , Sagy, Y. , Avgil‐Tsadok, M. , & Manor, O. (2012). Associations of maternal prepregnancy body mass index and gestational weight gain with adult offspring cardiometabolic risk factors the Jerusalem perinatal family follow‐up study. Circulation, 125, 1381–1389. 10.1161/circulationaha.111.070060 [DOI] [PMC free article] [PubMed] [Google Scholar]
- Hrolfsdottir, L. , Schalkwijk, C. G. , Birgisdottir, B. E. , Gunnarsdottir, I. , Maslova, E. , Granström, C. , Strøm, M. , Olsen, S. F. , & Halldorsson, T. I. (2016). Maternal diet, gestational weight gain, and inflammatory markers during pregnancy. Obesity, 24, 2133–2139. 10.1002/oby.21617 [DOI] [PubMed] [Google Scholar]
- Itani, L. , Radwan, H. , Hashim, M. , Hasan, H. , Obaid, R. S. , Ghazal, H. A. , Al Hilali, M. , Rayess, R. , Mohamed, H. J. J. , Hamadeh, R. , Al Rifai, H. , & Naja, F. (2020). Dietary patterns and their associations with gestational weight gain in the United Arab Emirates: Results from the MISC cohort. Nutrition Journal, 19,36. [DOI] [PMC free article] [PubMed] [Google Scholar]
- Lampe, J. W. (1999). Health effects of vegetables and fruit: Assessing mechanisms of action in human experimental studies. American Journal of Clinical Nutrition, 70, 475s–490s. 10.1093/ajcn/70.3.475s [DOI] [PubMed] [Google Scholar]
- Liang, Y. , Li, D. T. , Chen, M. X. , Gong, Y. H. , Zhang, X. , Yang, W. Y. , Liu, Y. , Cheng, G. , & Yang, D. G. (2019). Associations of pre‐pregnancy body mass index and gestational weight gain with gestational diabetes mellitus: Aohort study in southwest China. Sichuan Da Xue Xue Bao. Yi Xue Ban = Journal of Sichuan University. Medical Science Edition, 50, 83–87. [PubMed] [Google Scholar]
- Liu, C. , & Ralston, N. V. C. (2021). Seafood and health: What you need to know? Advances in Food and Nutrition Research, 97, 275–318. 10.1016/bs.afnr.2021.04.001 [DOI] [PubMed] [Google Scholar]
- Maugeri, A. , Barchitta, M. , Favara, G. , La Rosa, M. C. , La Mastra, C. , San Lio, R. M. , & Agodi, A. (2019). Maternal dietary patterns are associated with pre‐pregnancy body mass index and gestational weight gain: Results from the “Mamma & Bambino” Cohort. Nutrients, 11, 1308. 10.3390/nu11061308 [DOI] [PMC free article] [PubMed] [Google Scholar]
- McGowan, C. A. , Walsh, J. M. , Byrne, J. , Curran, S. , & McAuliffe, F. M. (2013). The influence of a low glycemic index dietary intervention on maternal dietary intake, glycemic index and gestational weight gain during pregnancy: A randomized controlled trial. Nutrition Journal, 12, 140. 10.1186/1475-2891-12-140 [DOI] [PMC free article] [PubMed] [Google Scholar]
- Medicine, I. O. , & Council, N. R. (2009). Weight gain during pregnancy: Reexamining the guidelines. The National Academies Press. [PubMed] [Google Scholar]
- Misgina, K. H. , van der Beek, E. M. , Boezen, H. M. , Bezabih, A. M. , & Groen, H. (2021). Pre‐conception and prenatal factors influencing gestational weight gain: A prospective study in Tigray region, northern Ethiopia. BMC Pregnancy and Childbirth, 21, 718. 10.1186/s12884-021-04171-z [DOI] [PMC free article] [PubMed] [Google Scholar]
- Moeller, S. M. , Reedy, J. , Millen, A. E. , Dixon, L. B. , Newby, P. K. , Tucker, K. L. , Krebs‐Smith, S. M. , & Guenther, P. M. (2007). Dietary patterns: Challenges and opportunities in dietary patterns research an experimental biology workshop, April 1, 2006. Journal of the American Dietetic Association, 107, 1233–1239. 10.1016/j.jada.2007.03.014 [DOI] [PubMed] [Google Scholar]
- Moran, L. J. , Sui, Z. , Cramp, C. S. , & Dodd, J. M. (2013). A decrease in diet quality occurs during pregnancy in overweight and obese women which is maintained post‐partum. Int J Obes, 37, 704–711. 10.1038/ijo.2012.129 [DOI] [PubMed] [Google Scholar]
- Oken, E. , Taveras, E. M. , Kleinman, K. P. , Rich‐Edwards, J. W. , & Gillman, M. W. (2007). Gestational weight gain and child adiposity at age 3 years. American Journal of Obstetrics and Gynecology, 196, 322.E1–322.E8. 10.1016/j.ajog.2006.11.027 [DOI] [PMC free article] [PubMed] [Google Scholar]
- Pathirannehelage, N. P. V. , & Joye, I. J. (2020). Dietary fibre from whole grains and their benefits on metabolic health. Nutrients, 12, 3045. 10.3390/nu12103045 [DOI] [PMC free article] [PubMed] [Google Scholar]
- Parker, H. W. , Tovar, A. , McCurdy, K. , & Vadiveloo, M. (2019). Associations between pre‐pregnancy BMI, gestational weight gain, and prenatal diet quality in a national sample. PLoS One, 14, e0224034. 10.1371/journal.pone.0224034 [DOI] [PMC free article] [PubMed] [Google Scholar]
- Raghavan, R. , Dreibelbis, C. , Kingshipp, B. L. , Wong, Y. P. , Abrams, B. , Gernand, A. D. , Rasmussen, K. M. , Siega‐Riz, A. M. , Stang, J. , Casavale, K. O. , Spahn, J. M. , & Stoody, E. E. (2019). Dietary patterns before and during pregnancy and maternal outcomes: A systematic review. American Journal of Clinical Nutrition, 109, 705s–728s. 10.1093/ajcn/nqy216 [DOI] [PubMed] [Google Scholar]
- Ren, Q. W. , Yang, F. F. , Han, T. B. , Guo, M. Z. , Zhao, N. , Feng, Y. L. , Yang, H. L. , Wang, S. P. , Zhang, Y. W. , & Wu, W. W. (2021). Relationship between the pre‐pregnancy BMI, gestational weight gain, and risk of preeclampsia and its subtypes. Zhonghua Liu Xing Bing Xue Za Zhi, 42, 2037–2043. 10.3760/cma.j.cn112338-20210126-00072 [DOI] [PubMed] [Google Scholar]
- Santos, S. , Voerman, E. , Amiano, P. , Barros, H. , Beilin, L. J. , Bergström, A. , Charles, M. A. , Chatzi, L. , Chevrier, C. , Chrousos, G. P. , Corpeleijn, E. , Costa, O. , Costet, N. , Crozier, S. , Devereux, G. , Doyon, M. , Eggesbø, M. , Fantini, M. P. , Farchi, S. , … Jaddoe, V. (2019). Impact of maternal body mass index and gestational weight gain on pregnancy complications: An individual participant data meta‐analysis of European, North American and Australian cohorts. Bjog—an International Journal Of Obstetrics And Gynaecology, 126, 984–995. 10.1111/1471-0528.15661 [DOI] [PMC free article] [PubMed] [Google Scholar]
- Schlaff, R. A. , Baruth, M. , Deere, S. J. , Boggs, A. , & Odabasic, A. (2020). Associations between prenatal diet quality and gestational weight gain. Nutrition and Health, 26, 13–18. 10.1177/0260106020903926 [DOI] [PubMed] [Google Scholar]
- Su, X. , Zhu, W. , Li, N. , Sun, J. , Zhu, Y. , Liu, T. , Xia, H. , Dai, Z. , Zhang, Y. , Pan, L. , & Jiang, W. (2020). Adjusting DBI‐2016 to dietary balance index for Chinese maternal women and assessing the association between maternal dietary quality and postpartum weight retention: A longitudinal study. PLoS One, 15, e0237225. 10.1371/journal.pone.0237225 [DOI] [PMC free article] [PubMed] [Google Scholar]
- Tielemans, M. J. , Erler, N. S. , Leermakers, E. T. , van den Broek, M. , Jaddoe, V. W. , Steegers, E. A. , Kiefte‐de Jong, J. C. , & Franco, O. H. (2015). A priori and a posteriori dietary patterns during pregnancy and gestational weight gain: The generation R study. Nutrients, 7, 9383–9399. 10.3390/nu7115476 [DOI] [PMC free article] [PubMed] [Google Scholar]
- Wallace, T. C. , Bailey, R. L. , Blumberg, J. B. , Burton‐Freeman, B. , Chen, C. O. , Crowe‐White, K. M. , Drewnowski, A. , Hooshmand, S. , Johnson, E. , Lewis, R. , Murray, R. , Shapses, S. A. , & Wang, D. D. (2020). Fruits, vegetables, and health: A comprehensive narrative, umbrella review of the science and recommendations for enhanced public policy to improve intake. Critical Reviews in Food Science and Nutrition, 60, 2174–2211. 10.1080/10408398.2019.1632258 [DOI] [PubMed] [Google Scholar]
- Wang, J. , Duan, Y. F. , Pang, X. H. , Jiang, S. , Yin, S. A. , Yang, Z. Y. , & Lai, J. Q. (2018). Gestational weight gain and optimal ranges in Chinese mothers giving singleton and full‐term births in 2013. Zhonghua yu fang yi xue za zhi, 52, 31–37. 10.3760/cma.j.issn.0253-9624.2018.01.007 [DOI] [PubMed] [Google Scholar]
- Wright, A. J. , King, M. J. , Wolfe, C. A. , Powers, H. J. , & Finglas, P. M. (2010). Comparison of (6 S)‐5‐methyltetrahydrofolic acid v. folic acid as the reference folate in longer‐term human dietary intervention studies assessing the relative bioavailability of natural food folates: Comparative changes in folate status following a 16‐week placebo‐controlled study in healthy adults. British Journal of Nutrition, 103, 724–729. 10.1017/s0007114509992339 [DOI] [PubMed] [Google Scholar]
- Wrottesley, S. V. , Pisa, P. T. , & Norris, S. A. (2017). The influence of maternal dietary patterns on body mass index and gestational weight gain in urban black South African women. Nutrients, 9, 732. 10.3390/nu9070732 [DOI] [PMC free article] [PubMed] [Google Scholar]
- Xu, H. , Ma, Y. , Zhang, L. , Liang, Z. , & Chen, D. (2021). Impact of pre‐pregnancy body mass index, weight gain and blood lipid level during pregnancy on pregnancy outcome in patients with gestational diabetes mellitus. Zhejiang da xue xue bao. Yi xue ban = Journal of Zhejiang University Medical Sciences, 50, 320–328. 10.3724/zdxbyxb-2021-0185 [DOI] [PMC free article] [PubMed] [Google Scholar]
- Yang, J. , Wang, M. , Tobias, D. K. , Rich‐Edwards, J. W. , Darling, A.‐M. , Abioye, A. I. , Noor, R. A. , Madzorera, I. , & Fawzi, W. W. (2021). Dietary diversity and diet quality with gestational weight gain and adverse birth outcomes, results from a prospective pregnancy cohort study in urban Tanzania. Maternal And Child Nutrition, 18, e13300. 10.1111/mcn.13300 [DOI] [PMC free article] [PubMed] [Google Scholar]
- Yang, Y. W. , & G. Pan, X. (2019). China food composition tables. Peking University Medical Press. [Google Scholar]
- Yang, Y. X. , Wang, X. L. , Leong, P. M. , Zhang, H. M. , Yang, X. G. , Kong, L. Z. , Zhai, F. Y. , Cheng, Y. Y. , Guo, J. S. , & Su, Y. X. (2018). New Chinese dietary guidelines: Healthy eating patterns and food‐based dietary recommendations. Asia Pacific Journal of Clinical Nutrition. 27, 908–913. 10.6133/apjcn.072018.03 [DOI] [PubMed] [Google Scholar]
- Yong, H. Y. , Shariff, Z. M. , Yusof, B. N. M. , Rejali, Z. , Tee, Y. Y. S. , Bindels, J. , & van der Beek, E. M. (2019). Pre‐pregnancy BMI influences the association of dietary quality and gestational weight gain: the SECOST study. International Journal of Environmental Research and Public Health, 16, 3735. 10.3390/ijerph16193735 [DOI] [PMC free article] [PubMed] [Google Scholar]
- Zerfu, T. A. , Pinto, E. , & Baye, K. (2018). Consumption of dairy, fruits and dark leafy vegetables is associated with lower risk of adverse pregnancy outcomes (APO): A prospective cohort study in rural Ethiopia. Nutrition & Diabetes, 8, 52. 10.1038/s41387-018-0060-y [DOI] [PMC free article] [PubMed] [Google Scholar]
Associated Data
This section collects any data citations, data availability statements, or supplementary materials included in this article.
Supplementary Materials
Supporting information.
Data Availability Statement
The data that support the findings of this study are available on request from the corresponding author. The data are not publicly available due to privacy or ethical restrictions.