

Summary
The opportunistic pathogen Staphylococcus aureus frequently colonizes the inflamed skin of people with atopic dermatitis (AD) and worsens disease severity by promoting skin damage. Here we show, by longitudinally tracking 23 children treated for AD, that S. aureus adapts via de novo mutations during colonization. Each patient’s S. aureus population is dominated by a single lineage, with infrequent invasion by distant lineages. Mutations emerge within each lineage at rates similar to S. aureus in other contexts. Some variants spread across the body within months, with signatures of adaptive evolution. Most strikingly, mutations in capsule synthesis gene capD underwent parallel evolution in one patient and across-body sweeps in two patients. We confirm capD negativity is more common in AD than in other contexts, via reanalysis of S. aureus genomes from 276 people. Together, these findings highlight the importance of the mutation level when dissecting the role of microbes in complex disease.
eTOC blurb
Key et al. investigate the spatial and temporal evolution of S. aureus on children with Atopic Dermatitis (AD). Patients are stably colonized by a single lineage, yet mutations emerge within each lineage and spread across the body. Mutations in a capsule production gene showed signatures of context-dependent adaptation.
Introduction
During colonization of human microbiomes, bacteria acquire adaptive mutations that enhance their ability to survive in the human environment, resist antibiotics, and outcompete other strains 1–4. While these de novo mutations rise in frequency due to the survival advantage they provide to the bacteria, their emergence may impact host metabolism, immune homeostasis, or microbiome dynamics. Understanding the tempo and consequences of variations across bacterial genomes is of particular importance for complex inflammatory diseases like atopic dermatitis and inflammatory bowel diseases, for which the causative role of the microbiome has been hard to pin down 5,6. While recent studies have identified bacterial strains associated with inflammatory states 7–9, classic metagenomic approaches do not provide the resolution to robustly identify individual mutations emerging in disease states. As a result, the potential impact of de novo microbiome mutations on complex diseases is poorly understood.
Atopic dermatitis (AD) is one such chronic inflammatory skin disease with strong microbial associations and a complex etiology. AD transiently affects up to 20% of people during their lifetime 10 and is particularly prominent among children, who develop itchy patches of inflamed skin, typically located on the cubital and popliteal fossae (inside of elbows and backs of knees) 11. Genetic and environmental defects in barrier function have been associated with AD, but are insufficient to explain the variation in disease development and response to treatment 12. Notably, symptomatic AD skin of children and adults is usually colonized by the opportunistic pathogen Staphylococcus aureus, with abundance proportional to disease severity 13–18; this species is usually lowly abundant on healthy skin 19,20. Its native reservoir is thought to be the nares, where it asymptomatically colonizes 30% of healthy individuals 19. However, S. aureus also causes a variety of human infections of the skin, bloodstream, lung, and bone 21.
S. aureus sequence types vary in virulence potential, in the antibiotic resistance cassettes they carry, and the disease contexts in which they are most often found (e.g. hospital or community associated) 21,22, yet no sequence types have been robustly associated with AD 23. A recent study has suggested that de novo mutations in a key quorum sensing pathway reduce the risk for healthy babies to develop AD 24-- supporting a possible role for S. aureus mutations beyond the strain level in AD. While de novo mutations occurring in S. aureus in young children with AD have been observed 25, the fate of these mutations over time and their consequences have not been characterized.
Results
Longitudinal tracking of S. aureus evolution in AD
Here, we use longitudinal sampling and culture-based whole-genome sequencing to identify mutations acquired by S. aureus that emerge under natural selection on individual people. We conducted a prospective, longitudinal study of 23 children (age 5 to 15 years old) in Mexico with moderate to severe AD at 5 visits over the course of approximately 9 months (Figure 1a). Patients were treated for AD with the standard of care, including topical steroids, emollients, and some with bleach baths. Treatment was modified at each visit according to severity, though patients were not closely followed between the fourth and final visits (Table S1). Three of the 23 patients were administered antibiotics in this initial period due to medical need, and 5 took antibiotics after this initial period; these patients were included in the analysis, and antibiotic usage is noted (see Table S1 for details). During each visit, AD severity was assessed using the SCORing Atopic Dermatitis (SCORAD) scale 26, and swabs were collected from seven affected and unaffected skin sites, including cubital and popliteal fossae, forearms and the nares (Figure 1a). From each of 225 swabs that yielded growth resembling S. aureus, we picked up to 10 single-colony isolates for subculture and sequencing (Methods), resulting in 1,499 S. aureus whole genomes.
Figure 1: The S. aureus population on each child with atopic dermatitis (AD) is dominated by a single, stable, patient-specific lineage.
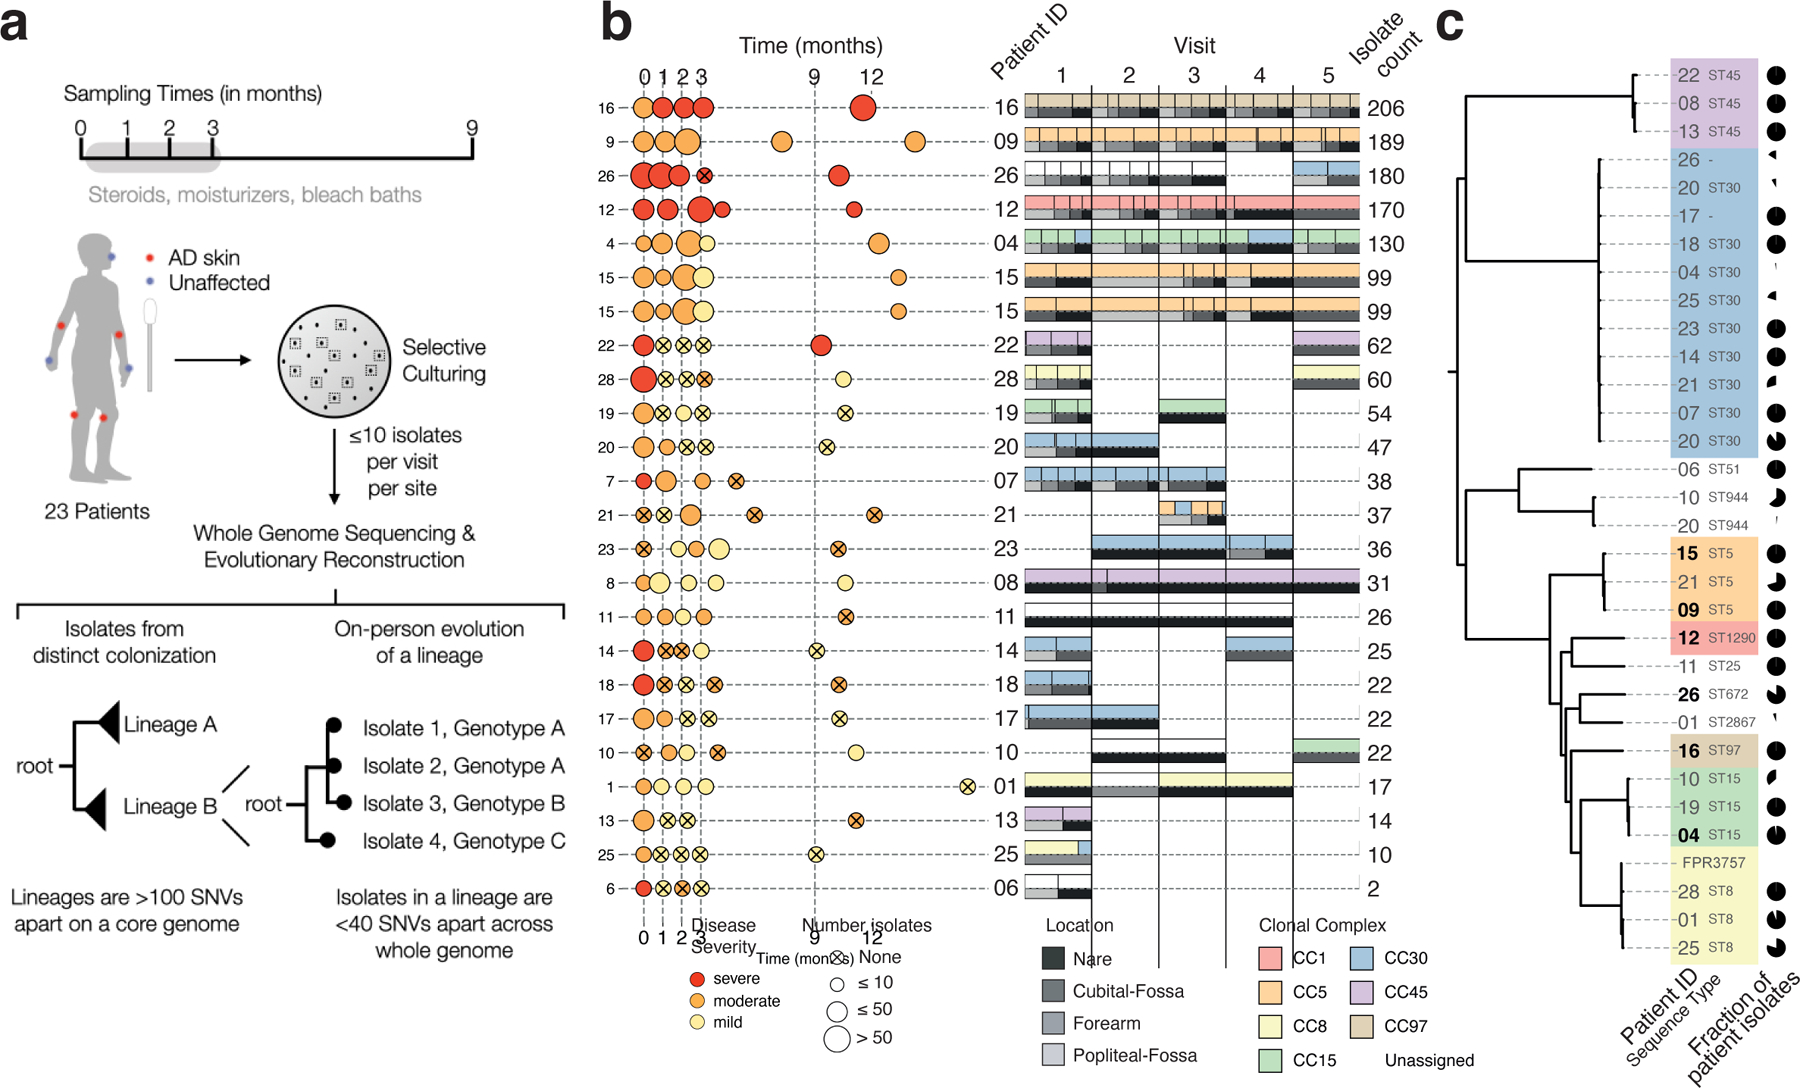
a, Swab samples were collected from each of 7 sites during each of 5 visits, including from nares and areas rarely affected by AD in children (forearms). Patient treatment for AD with standard treatment of care, with or without bleach baths, was monitored closely between the first four visits (Methods). From each swab, up to 10 colonies were cultured and processed for whole-genome sequencing. We then grouped isolates from each patient into lineages such that isolates from the same lineage are fewer than 100 mutations across the core genome, and performed more detailed evolutionary analysis using alignment of raw reads to lineage-specific assemblies built from reads of all isolates in a lineage. Isolates separated by 0 mutations in this more detailed analysis are then grouped into a single ‘genotype’. b, Left panel: Sampling time, mean disease severity at visit based on SCORAD (mild < 25 ≤ moderate < 50 ≤ severe), and number of isolates per visit (dot size) are shown for each patient. Some sampling visits deviated from the anticipated schedule (vertical dashed line), spacing shown reflects the actual sampling schedule achieved (Methods). Right panel: Pairwise stacked bar plots show the relative number of isolates from each visit that were from an inferred clonal complex (top) and sampling site (bottom). Small vertical lines separate groups of isolates from the same site and clonal complex. Six patients with ≥ 99 isolates were analyzed with the most detail. c, Phylogenetic tree showing the relationship between 1,499 S. aureus isolates, generated using 60,973 SNVs from a reference-based approach (Methods) and labeled by patient of origin and sequence type. Pie charts indicate the fraction of patient isolates that come from each lineage, showing most patients have a single major lineage. Patient 20 was colonized by three lineages, two of which are part of the same clonal complex (CC30). Lineages are colored according to their assigned clonal complex (Methods), highlighting that strains colonizing AD patients come from a wide variety of global diversity.
To understand the minimal number of independent colonizations of S. aureus onto each child, we first clustered each patient’s isolates into lineages, where each lineage is composed of isolates separated by < 100 mutations across the core genome. Given the known rates of mutation accumulation in S. aureus in other contexts (~8 mutations/whole genome/yr) 27–32, this cutoff ensures that all isolates that could have theoretically arisen from a single colonization and subsequent on-person diversification are grouped together. In practice, isolates from the same lineage are always less than 40 SNVs apart across core and whole genomes, and share the same multi-locus sequence type used in traditional S. aureus epidemiology (Figure S1, Table S1).
Most patients were stably colonized by a single major lineage, though we recovered minority lineages from 7 patients and major lineage replacements in 2 of 19 patients with S. aureus recovered at multiple timepoints (Figure 1b; Table S2). Overall, detected lineages span the diversity of the S. aureus species (Figure 1c) 33. The largest fraction of lineages are part of clonal complex 30 (33% of lineages; 15% of isolates), in contrast with a previous finding of clonal complex 1 dominance among people with AD in the UK 25.
The number of isolates recovered per visit from which sufficient sequencing reads were obtained is variable across visits and correlates with both disease severity and S. aureus relative abundance inferred from 16S rRNA sequencing 18 (0–68 isolates/visit; r2=0.36 and r2=0.16, respectively; Figure 1b and Figure S2). Six patients provided large numbers of isolates amenable to more in-depth quantitative analyses (99–206 isolates/patient; Figure 1b).
S. aureus mutants sweep across the body
To analyze the causes and consequences of bacterial mutation on each person, we next focused on the genetic variation within each stably colonizing lineage. For each patient’s major lineage, we generated a lineage-specific S. aureus assembly, used a rigorous alignment-based approach to identify single-nucleotide variants (SNVs), and built phylogenetic trees that illustrated mutation accumulation on the patient (Figure 2a, Methods). In many cases, multiple colonies from a timepoint were indistinguishable across their entire genome; we refer to each group of isolates with identical genomes as a ‘genotype’.
Figure 2. Despite high rates of mutation accumulation on each person, the intralineage diversity on each person is limited.
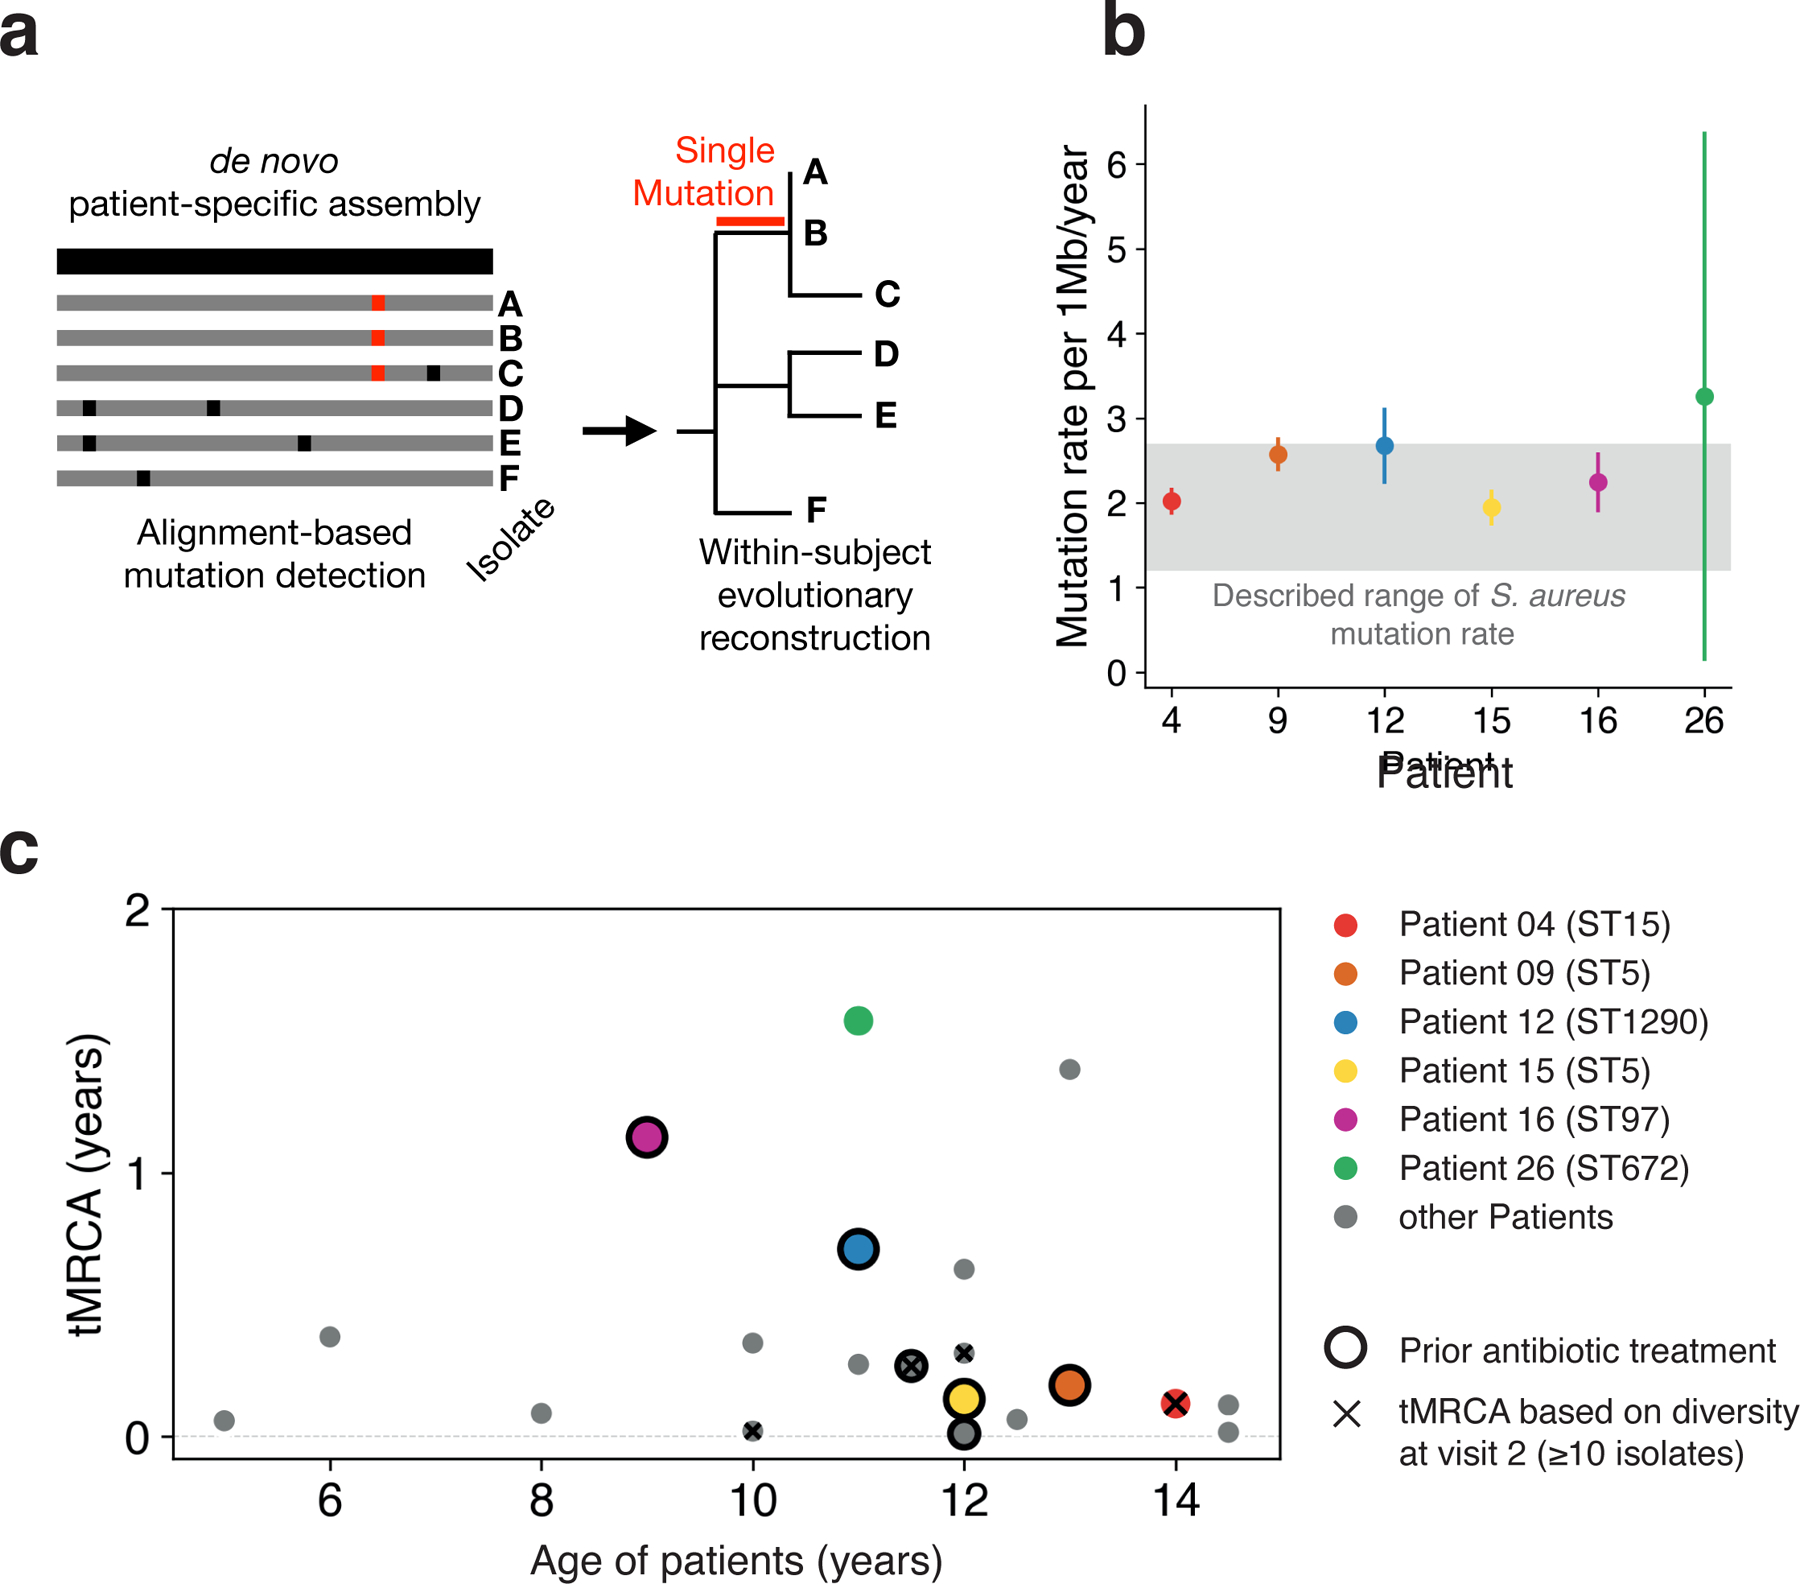
a, We built a de novo reference genome for each patient’s major lineage (black) and called de novo mutations by aligning raw reads from each sample individually to this reference genome, allowing the building of fine-resolution phylogenetic trees (Methods). b, The median molecular clock rate per megabase (Mb) is shown for the six patients with the most isolates (Linear least-squares regression). Error bars indicate 95% confidence intervals. The gray region indicates per Mb clock rates reported for S. aureus in other contexts, corresponding to approximately 3–8 mutations per genome per year 27–32. c, For each patient with ≥10 isolates at a visit (20 patients), the inferred time elapsed since the population’s most recent common ancestor (tMRCA; Methods) is plotted relative to the patient’s age. Low values of tMRCA indicate a recent single-cell bottleneck, and are found across patients regardless of antibiotic usage within the past 6 months (black outline) or age. The earliest such visit from each patient was used; x’s indicate patients for which visit 2 was used. Mutational distances were converted to time using the calculated molecular clocks for the 6 highlighted patients; for all others, the median rate was used.
In theory, the inflammatory environment on AD skin, or the application of treatments to the skin, might induce an elevated mutation rate. We estimated the molecular clock of the lineages colonizing the six patients with the most isolates. For five of these patientś lineages, molecular clock estimates were consistent with those of S. aureus in other contexts, including healthy carriage and in invasive infections (1.2 – 2.7 × 10⁻⁶ substitutions/site/year 27–32; Figure 2b). Patient 26’s major lineage had an apparently higher accumulation mutation rate of 3.3 × 10⁻⁶ substitutions/site/year (CI95 = 0.1 – 6.4 × 10⁻⁶ substitutions/site/year), but this difference was not significant. While this non-significantly elevated mutation accumulation rate could plausibly reflect environmental conditions that induced higher mutagenesis or a defect in DNA repair not apparent in our genomic analyses, we do not observe any mutations in DNA repair genes or a significant differences in mutational spectra across patients (Figure S3). Taken as a whole, these results suggest that AD-associated inflammation does not greatly increase S. aureus mutation rates.
Accumulation of mutations over time can produce two different patterns of on-person evolution: diversification into long co-existing genotypes or within-lineage genotypic replacement 34,35. To determine which of these patterns was more common, we calculated the time since each major lineage’s isolates shared a single-celled ancestor (time to the most recent common ancestor, tMRCA). We found that all 16 patients with sufficient data at the first visit (≥10 isolates) had low values of tMRCA indicating seeding of the population from a single genotype within the past few years (tMRCA <1.6 years; Figure 2c). We did not find a dependence on recent antibiotic usage (P = 0.81; two-sided Wilcoxon rank sum test). In addition, similarly low values of tMRCA were found for samples collected after initiation of study-related treatment (major lineages where visit 1 yielded ≤10 isolates; Figure 2c) and in a reanalysis of 8 AD patients from an unrelated study from which ≥10 isolates were collected at a single timepoint (Figure S4). Together with our observations of lineage-level stability (Figure 1b), these analyses suggest that within-lineage genotypic replacement is a common aspect of S. aureus growing on treated AD skin.
To better understand within-lineage replacement, we examined within-patient phylogenies for all patients (Figure 3; Figure S5–6). Visualizing the temporal evolutionary dynamics using Muller diagrams revealed a common pattern in which genotypes with newly acquired mutations repeatedly replaced existing diversity (Figure 3a–f). These replacements spanned the entire body; the spread of new mutations was not spatially restricted and included unaffected skin and the natural habitat of the nose (Figure 3g–h; Figure S5–6). For timepoints from which S. aureus was cultured from multiple sites, new mutations are typically found at multiple body sites -- making it difficult to tell at which site they originated. While some of these sweeps overlapped with antibiotic administration between samplings, many intervals without antibiotic usage demonstrate similarly dramatic changes in mutational composition, further supporting the presence of an antibiotic-independent mechanism of genotypic sweeps.
Figure 3. Rapid clonal spread of de novo mutations across the body implicates capsule loss as adaptive on treated AD skin.
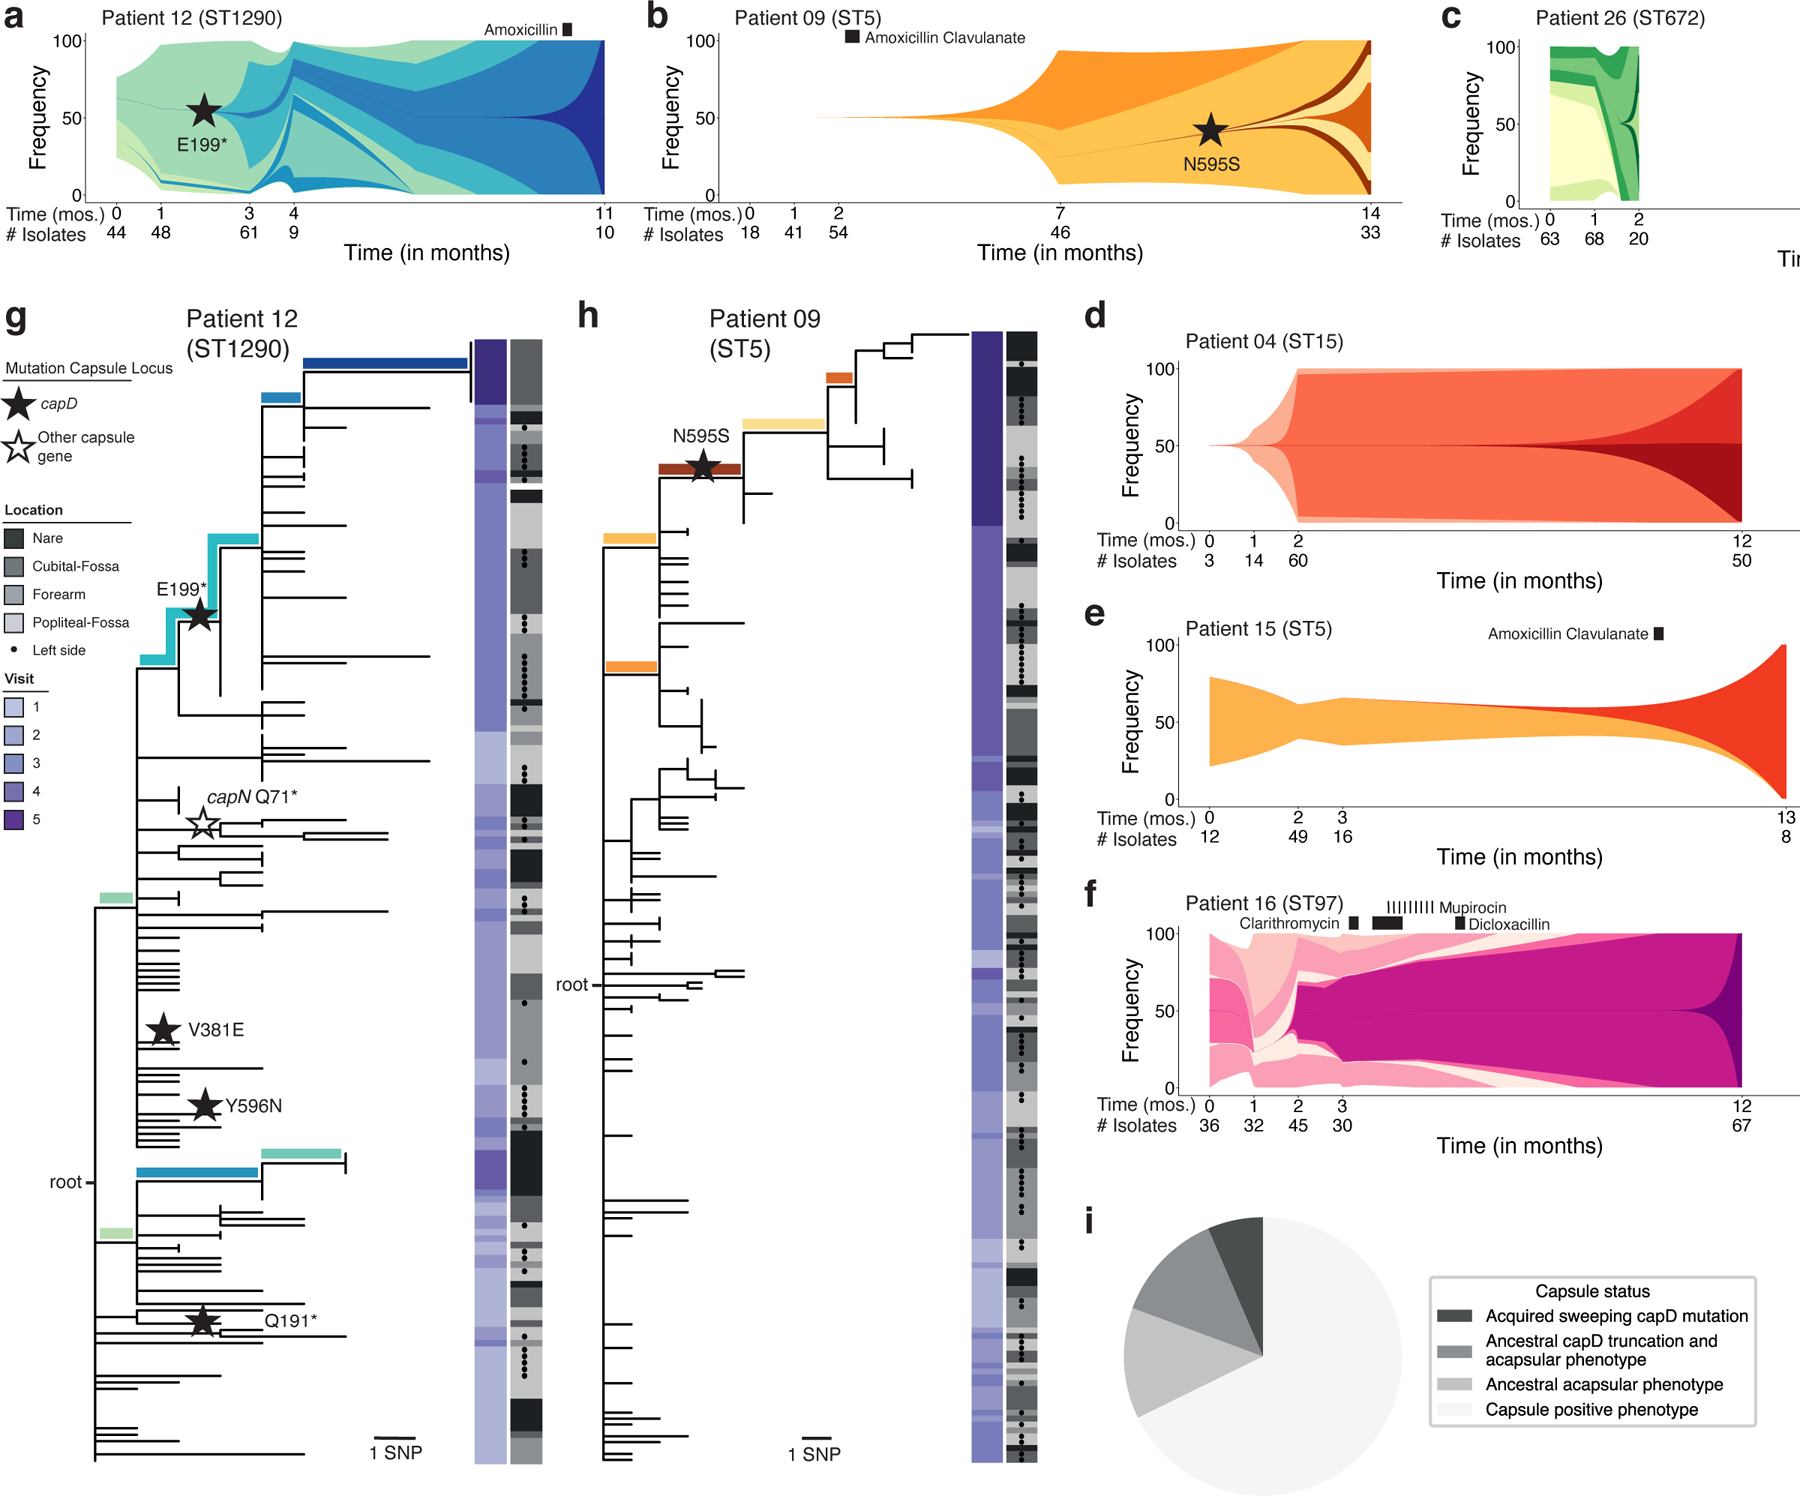
a-f, Schematics representing the on-person evolution for all patients with ≥ 99 isolates, illustrating the emergence and occasional population-wide sweep of new genotypes. Each color represents a unique genotype found in at least 3 isolates and with a frequency shift of ≥ 30% for at least one visit. The shape and spacing of lines between timepoints with data is modeled based on exponential growth for maximum visibility and speculative (Methods). Timepoints and number of isolates at each timepoint used for this modeling are indicated below the graph. A star indicates a mutation in capD; all other sweep-associated mutations are listed in Table S4. Black rectangles indicate time and duration of antibiotic treatment. g, h, Maximum parsimony tree of evolution of patient 12 (g) and patient 09 (h). The location from which each isolate was taken is indicated in gray (dots indicate left side of body) and timepoint is indicated by the purple heatmap. Stars indicate a mutation within the capsule locus. Branches representing mutations defining genotypes in panels a and b are colored accordingly. See Figures S5–S6 for phylogenies of all other subjects. i, Pie chart indicating the capsule status for 31 major and minor lineages recovered from all 23 patients. Sweeping capsule mutations were observed in 2 patients’ S. aureus populations, 4 lineages were determined genetically and by in vitro phenotyping to have lost the capsule prior to the start of our study, and 4 lineages were determined capsule-negative by in vitro phenotyping only (Table S3).
The ladder-like phylogenies we observe here, showing succession of closely related genotypes, strongly support a role for on-person mutation, rather than transmission from another person or outside source (e.g. Figure 3h). In theory, however, these phylogenies could arise if transmission between individuals was so frequent that there was back-and-forth transmission between each pair of visits. To understand intraperson transfer, we examined the one pair of siblings in our data set. These siblings share closely related lineages separated by 14 mutations, corresponding to a MRCA about 17.4 months prior to study start (95% confidence interval: 16.2 – 19 months). Despite this evidence of a recent shared ancestor, the siblings’ populations do not share mutations derived during the study period -- further supporting the notion that on-person evolution drives on-person phylogenetic diversity (Figure S1f). Altogether, these analyses suggest that new S. aureus genotypes commonly emerge via on-person de novo mutation on people being treated for AD, some of which subsequently sweep the on-person population.
Adaptive mutations alter polysaccharide capsule
The speed of genotype replacement raises the possibility that the underlying mutations provide a competitive advantage on AD skin. To test if this process was adaptive, or arose from a neutral bottleneck (e.g. growth following a reduction in cell number during treatment), we investigated mutated genes for adaptive signatures. We first searched for evidence of parallel evolution, i.e. multiple mutations in the same gene within a single patient 34. In patient 12, we observed four different mutations in capD, each in separate isolates. This mutational density is unlikely given the small number of mutations in this patient (P = 1.7 × 10⁻⁵, simulation), and all four mutations resulted in either amino acid replacement or a premature stop codon, further supporting an adaptive role for mutations in this gene (Figure 3g). The capD gene encodes an enzyme that performs the first step in synthesizing the capsular polysaccharide of S. aureus. One of the capD mutations in patient 12, premature stop codon E199*, is associated with a spread and replacement event in this patient (1 of 11 mutations associated with replacement in this patient). Strikingly, a spread and replacement event in patient 9 is also associated with a mutation in capD: a nonsynonymous N595S mutation (Figure 3h). While isolates containing the N595S mutation have detectable capsule expression (Methods; Table S3), this amino acid position is conserved within S. aureus and may be critical for native capsule structure (Figure S7). These observations of parallel evolution within a patient, parallel evolution across patients, and association with replacement events suggest that alterations in capD provide a survival advantage for S. aureus on AD skin.
We did not detect comparably strong signals of adaptive de novo mutation across patients in S. aureus genes other than capD. Varying selective pressures across patients may have weakened adaptive signatures, and some adaptive events may have been removed by our strict filtering criteria (putative adaptive signatures, including mutations associated with sweeps, are listed in Table S4). In addition, while the presence of mobile elements varied across isolates in a lineage (Figure S8; Table S5), we did not find any selective sweep that was associated with the gain of a mobile element.
Capsule loss is common in AD globally
The polysaccharide capsule of S. aureus has been well studied, and it is generally considered a virulence factor that shields the pathogen from phagocytosis and the innate immune system 36–38. However, the loss of the S. aureus capsule has been observed previously to emerge in vitro and in vivo 39,40 and it has been shown that capsule-negative S. aureus exhibits improved adherence to fibrinogen, platelets, and endothelial cells 41–43. The adaptive emergence of capD truncation mutations on AD skin suggests an advantage for the acapsular phenotype on AD skin.
We next sought to understand the generality of selection for capD alterations in our cohort. It is possible that replacement events involving capD emerged prior to the start of our study, given our inference of recent replacement events (Figure 2c). Alternatively, a patient’s S. aureus population may have been initially founded by a strain with a nonfunctional capD. We tested all patient isolates for a complete capD open-reading frame and observed that the major lineage of four additional patients had ancestral truncation mutations in this gene. Three of these patients share the same frameshift mutation (single base insertion at an adenine hexamere of capD) also found in many CC8 strains, indicating that this mutation was carried on their founding strains. The remaining lineage had a unique capD truncations (10 bp deletion). We also searched for capsule loss driven by non-truncation mutations or mutations in other genes by performing immunoblots, which identified two additional major lineages without detectable polysaccharide capsule in vitro. In total, 6 of 23 (26%) major lineages were acapsular at enrollment (Figure 3i, Table S3), and 2 (12%) of the capsule-expressing major lineages acquired capD mutations during the course of the study.
To better understand whether loss of capD is generally beneficial for S. aureus in vivo or specifically advantageous on AD skin, we leveraged publicly available genomes of isolates from people with and without AD. We analyzed 276 S. aureus isolate whole-genomes from the skin of 110 AD patients, the nares of 67 healthy carriers, and the site of invasion of 99 individuals who had other infections (blood-stream, soft tissue, bones, and joint; Figure 4a) 25,44–46. These samples were collected from individuals in Denmark, Ireland, and the UK.
Figure 4. Meta-analysis of published data confirms enrichment of capsule loss on AD skin.
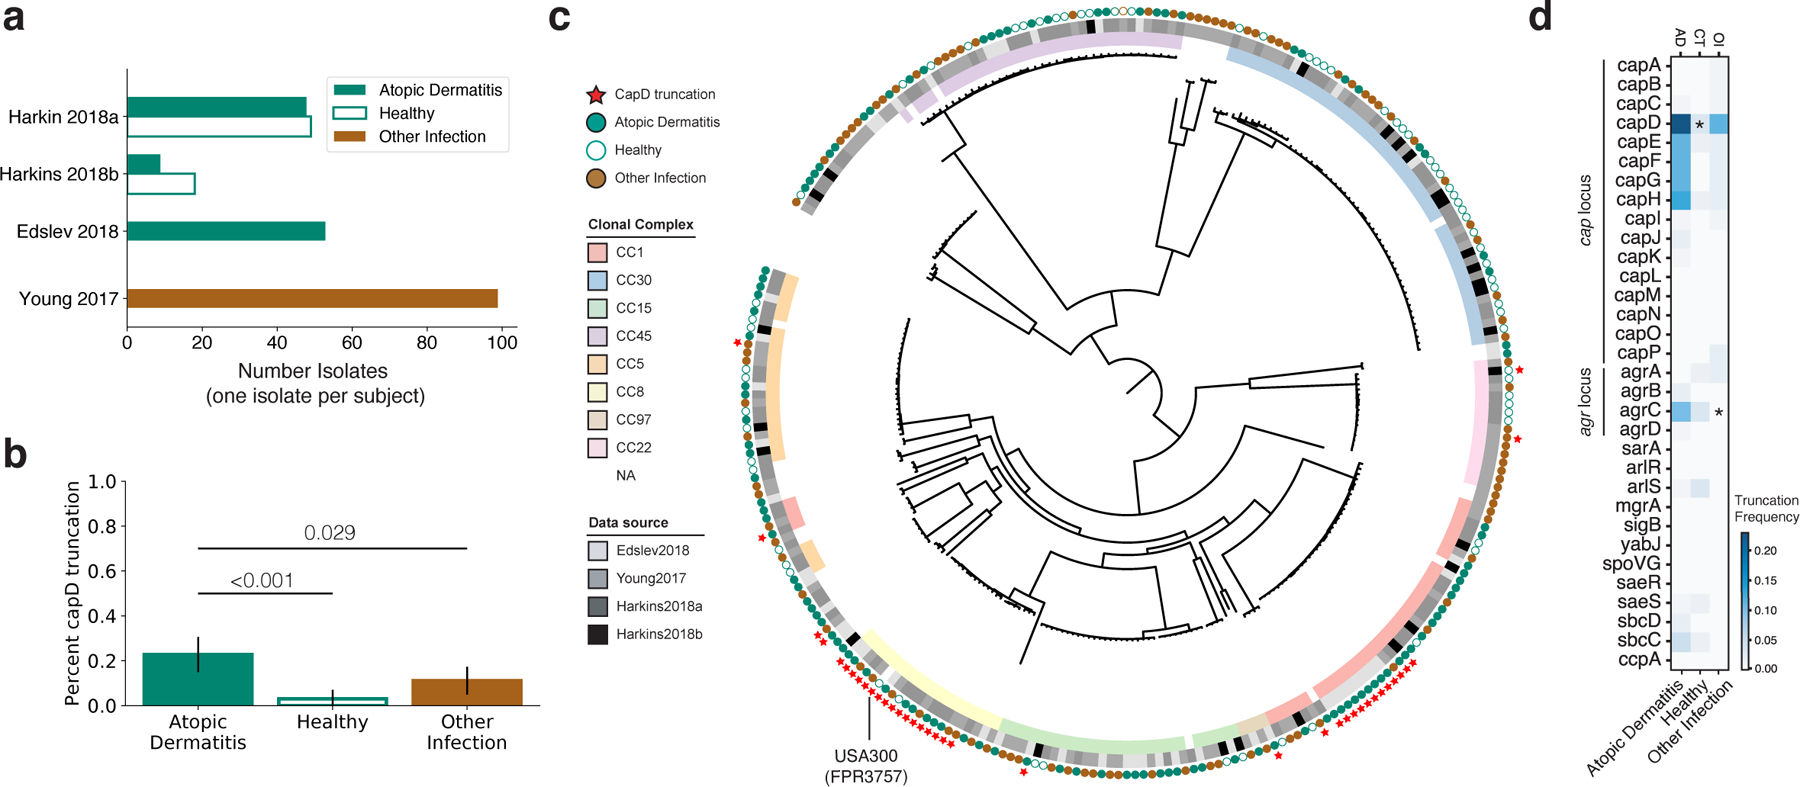
a, The number of S. aureus genomes downloaded from each of 4 public studies are shown 25,44–46. Isolates were collected either from people with AD (green), the nares of healthy individuals (white), or from a variety of other diseases, including bloodstream, bone/joint and soft-tissue infections (brown). When multiple isolates were available from a subject, only the isolate with the highest number of available reads was analyzed. b, The fraction of isolates with a truncated or missing capD is plotted as a function of isolation context. The 95% binomial proportion confidence interval is shown. c, Phylogenetic tree showing relationship between all S. aureus analyzed, generated using a reference-based approach and maximum-likelihood reconstruction (Methods). Isolates are labeled with squares indicating their membership in global clades and the study of origin, with circles indicating isolation context. Red stars indicate isolates without a full length capD, showing 9 different independent occurrences including two expanded clades. d, Analysis similar to that in (b) was performed for other genes involved in capsule regulation, and the percentage of isolates from each context lacking a full length copy of each gene is shown as a heatmap. * P < 0.001 vs. AD (one-sided Fisher’s exact test). See Figure S9–S10 for further analysis of the capsule locus and agrC loss.
Strikingly similar to our observation that 26% of AD patients carry a strain encoding a truncated CapD, 22.5% of AD-associated isolates in the public data lack a full-length capD gene. This represents a significant increase relative to isolates from healthy controls (7.2%, P < 0.001; one-sided Fisher’s exact test) and from those with other types of infections (10.5%, P = 0.020) (Figure 4b). Phylogenetic analysis confirms several independent emergences of capD truncations, supporting the notion that de novo loss of capD can drive S. aureus adaptation (Figure 4c). Notably, 78% of capD-truncation isolates come from two independent, globally successful clones with recent expansions, including a CC8 clade from which USA300 is descended and a CC1 clade with a large deletion spanning capD-capH. The observation of this successful CC1 clade with capD loss is surprising in light of the known advantages of the capsule for immune evasion 36–38. Nevertheless, the observed signal remains significant when isolates from CC8 are excluded (AD vs. healthy: P < 0.001, AD vs. other infection: P = 0.016) and when the entire dataset by Edslev et al. 45 is removed, which included most of the CC1-capD negative isolates (AD vs. healthy P = 0.014). Furthermore, when considering all genes in the capsule locus, we observe an even stronger statistical enrichment of truncation mutations in isolates from AD (P < 0.001, vs. healthy; Figure S9a). These genomic differences indicate that selective pressures felt by S. aureus on AD skin are distinct from those on healthy patients or in the context of acute infection.
To understand if capsule loss via mutations in other genes is also enriched in AD, we repeated the same analysis for genes known to be associated with capsule regulation 47,48. Interestingly, agrC, the histidine-kinase sensor in the agr quorum-sensing-dependent virulence regulation system, also showed a significant enrichment of independent loss-of-function mutations in AD compared to other infections (P < 0.001) but not isolates from healthy patients (Figure 4d; Figure S10). While recent work has suggested that retention of functional agr is associated with the onset of AD 24, agrA loss has been previously documented on the skin of a patient with AD 25. Loss of the agr system is known to suppress capsule production, among other virulence-associated pathways 47,49. While the selective advantage driving frequent agr loss in AD could be independent of capsule, this observation is consistent with an advantage for an acapsular phenotype on AD skin.
What is the mechanistic basis of acapsular advantage on AD skin? Possible, non-mutually exclusive, selective pressures for capsule loss include: (1) immune escape from capsule-targeted antibodies or innate immune components; (2) increased adherence to AD skin via improved accessibility of surface adhesin proteins; and (3) alleviation of metabolic costs. Antibiotic resistance is unlikely to be a driver of capsule loss, as resistance-associated genomic features were generally depleted from isolates from AD patients in our meta-analysis (Figure S9 and S11). The only antibiotic resistance enriched among isolates from AD patients was fusidic acid; we confirmed its efficacy is not impacted by capsule negativity (MIC 0.05ug/mL for all strain pairs tested from Pt. 9 and Pt. 12; Methods), and, therefore, that its usage is not driving the association of capD and AD in the meta-analysis.
Metabolic cost may explain the preponderance of mutations in capD -- the first gene in the biosynthetic pathway -- rather than an even distribution across all capsule-associated genes. To understand the cost of capsule production, we measured growth rates in rich media, and found that acapsular isolates grew 1.4 – 2% faster than their capsular ancestors (an advantage amplified over multiple generations; Methods; Figure S12). To test if this growth advantage translated to better growth or worse disease in vivo, we compared the ability of these strains to cause skin injury in an mouse model that mimics an AD flare 50,51 and to colonize the unbroken skin of the mouse ear 8 (Figure S13; Methods). The in vivo growth advantage of the acapsular strain did not translate to significantly worse disease or bacterial loads in these short-term models (< 1 week). Additionally, three AD isolates with point mutants that did not abrogate the capsule entirely did not show a growth advantage in vitro (Figure S12). Together, these data suggest additional selective pressures for the acapsular phenotype on AD skin that were not apparent in our mouse models, possibly due to the short duration of the in vivo experiment. The ability of acapsular strains to evade antibodies 52,53 and increase adhesion 41–43 have been demonstrated in mouse models of other infections and may play a role during long term colonization on humans.
Discussion
S. aureus is among the most successful opportunistic pathogens of humans, colonizing a third of the world’s population, responsible for numerous outbreaks in healthcare facilities, and causing a variety of acute and chronic diseases 21. Here, we report that S. aureus rapidly adapts via de novo mutations on people being treated for AD, that adaptive mutants spread across the whole body -- including the nares --, and that loss-of-function mutations in a S. aureus gene closely associated with virulence, capD, are more frequent on the skin of people with AD than healthy controls.
Our findings of on-person adaptive evolution and association of capsule loss with AD are surprising given the lack of a consistent signal between AD-status and sequence types, clonal complexes, or other phylogenetic groupings23; this paradox is heightened by the observation that several global clades are already acapsular (e.g. USA 300) 39. What is the cause of this discrepancy across genomic units? Possible explanations include selective tradeoffs 54, person-specific selection 55,56, and priority effects (advantage for early colonizers)57 that limit the ability of any S. aureus clade to dominate across patients 54. The possibility that such ecological factors dampen the signal for selection at the clade level raises the possibility that future studies with very large sample sizes powered for genome-wide analysis in the face of linkage 58 (see note in Methods) may reveal additional S. aureus variations associated with AD and other diseases.
One question arising from this work is whether the advantage to S. aureus of being acapsular is specific to AD skin or translates to long term skin colonization in general. Our data show that S. aureus isolates from AD patients are more often acapsular than those from infection or healthy nares, but we are unable to acquire a large number of genomes derived from the skin of people without AD for comparison. While the acapsular USA300 clade is known to spread between healthy individuals39, it remains to be determined if USA300’s acapsularity is beneficial for its spread or survival, or plays only a minor role given the other advantages that this clade has for colonization of nares 59. Regardless, our in-human results suggest that acapsular strains may be harder to remove from AD skin than capsular strains, and long-term colonization may raise the risk of strains with such phenotypes emerging.
Future work might combine small molecules or other therapies that specifically target S. aureus strains without a functional capsule locus with selective forces on the host to lower the burden of S. aureus colonization in AD. Further characterization of the mechanistic basis behind the CapD-negative advantage on AD skin (or skin in general) will be critical to the design of any such therapies, as unexpected consequences may emerge from selection for the capsular phenotype, which is more virulent in other disease contexts 36,60.
This study focused on S. aureus genotypes that could be easily recovered from swabs at 7 body sites from 23 people. Given the relatively small sample size of our cohort and other sources of disease severity variation, including host genetic variation and treatment, we were unable to directly associate S. aureus capD status with AD severity or duration. Similarly, we were unable to study the impact of specific treatment variation on sweeping patterns or capsule status, though we note that lineage-wide sweeps and the acquisition of mutations in the capsule locus were both observed in patients who did and did not receive bleach baths (Table S1, Figure 3a–f). We did not seek to characterize community members at low abundance, and it is possible that additional minority lineages and genotypes were present at undetected levels or at additional locations on the body (Figure S14 and S15). Similar limitations exist for culture-independent approaches, as it is difficult to distinguish between sample cross-contamination and low abundance colonization 61. Our data indeed support a model in which lineages can persistently colonize despite lack of detection; we recover the exact same lineages from four patients after visits at which no S. aureus was recovered (Figure 1b). Notwithstanding, we find no cases of within-lineage reemergence of replaced genotypes, supporting the durability of observed intralineage sweeps on the skin of people treated with AD. As all patients were treated for AD, additional work is needed to test if S. aureus has similar dynamics in untreated AD and to understand the specific contribution of treatment, and its resultant decrease in population size 62, on S. aureus on-person evolutionary dynamics.
Together, our results highlight the potential of de novo mutations for altering bacterial competitiveness in microbiomes, highlight the power of mutation tracking for identifying new potential therapeutic directions, and suggest that whole-genome resolution may be required for predicting the impact of microbial strains on complex diseases.
STAR Methods
Resource availability
Lead contact
Further information and requests for resources and reagents should be directed to and will be fulfilled by the lead contact, Tami Lieberman (tami@mit.edu).
Materials availability
Bacterial isolates generated in this study are available from the lead contact upon reasonable request. This study did not generate new unique reagents.
Data and Code Availability
Whole-genome sequence data have been deposited at SRA and are publicly available as of the date of publication. Accession numbers are listed in the key resources table. Metadata of each isolate including SRR identifier is available in Table S10.
All original code has been deposited at github and is publicly available as of the date of publication. DOI is listed in the key resources table.
Any additional information required to reanalyze the data reported in this work paper is available from the Lead Contact upon request.
Key resources table
| REAGENT or RESOURCE | SOURCE | IDENTIFIER |
|---|---|---|
| Antibodies | ||
| Capsule type-specific rabbit polyclonal antisera | Tollersrud et al.1 | N/A |
| Bacterial and virus strains | ||
| S. aureus isolates | This paper | N/A |
| Biological samples | ||
| Skin samples from children with atopic dermatitis | This paper | N/A |
| Chemicals, peptides, and recombinant proteins | ||
| Blood agar | BBL™ Blood Agar Base (Infusion Agar) | 90000–048 |
| PCRClean-DX SPRI beads | Aline Biosciences | C-1003–250 |
| Polyethylene glycol (PEG) 8000 | Hampton Research | HR2–535 |
| ReadyLyse Lysozyme Solution | EpiCentre | R1810M |
| KAPA HiFi HotStart ReadyMix | Roche | 7958927001 |
| Tryptic soy agar plates | Hardy Diagnostics | A10 |
| Nitrocellulose BA85 filters | Whatman, Inc. | Cat#09301102 |
| Trypsin, bovine pancreas | Fisher Scientific | Cat#AAJ6368803 |
| Skim milk | BD BBL™/Difco™ |
Cat#DF0032173 |
| Tween 20 | Millipore Sigma | Cat#P1379 |
| KPL 1-Component TMB Membrane Peroxidase Substrate | ThermoFisher Scientific | Cat#002019 |
| Fusidic acid | Sigma-Aldrich | CAS: 6990–06-3 |
| ChromAgar Colorex S. aureus | DRG international inc | Cat # TA672 |
| Critical commercial assays | ||
| Wizard Genomic DNA purification kit | Promega | A1120 |
| Illumina Tagment DNA TDE1 Enzyme and Buffer Kits | Illumina | 20034198 |
| PlexWell library prep system | seqWell | plexWell 384 |
| Puritan™ Opti- Tranz™ Liquid Amies Media Transport Tube with Rayon Tip Swab, Polysterne Handle | Puritan | LA-61PR |
| Puritan™ Opti- Tranz™ Liquid Amies Media Transport Tube with Miniature Rayon Tip Swab, Aluminum Handle | Puritan | LA61SAR |
| Experimental models: Organisms/strains | ||
| C57BL/6 female mice | Jackson Laboratories | Strain #:000664 |
| Deposited data | ||
| Raw sequencing data | This paper | Genbank: PRJNA715375, PRJNA715649, PRJNA816913 |
| Software and algorithms | ||
| All original code | This paper | https://github.com/keyfm/aureus_ad |
| Python (v3.7.3) | N/A | https://www.python.org/ |
| Snakemake (v5.4.2) | Mölder et al.2 | https://snakemake.github.io/ |
| Matlab (v2015b, v2018a) | Mathworks | https://www.mathworks.com/products/matlab.html |
| Cutadapt (v1.18) | Martin3 | https://cutadapt.readthedocs.io/en/stable/ |
| Sickle (v1.33) | Joshi & Fass4 | https://github.com/najoshi/sickle |
| Bowtie 2 (v2.2.6) | Langmead & Salzburg5 | http://bowtie-bio.sourceforge.net/bowtie2/index.shtml |
| SAMtools (v1.5) and BCFtools (v1.2) | Danecek et al.6 | https://github.com/samtools/ |
| Kraken 2 (v2.0.8) | Wood et al.7 | https://github.com/DerrickWood/kraken2 |
| BLAST (v2.7.1) | NCBI | https://blast.ncbi.nlm.nih.gov/Blast.cgi |
| PHYLIP (v3.69) | Felsenstein8 | https://evolution.genetics.washington.edu/phylip.html |
| FigTree (v1.4.4) | N/A | https://github.com/rambaut/figtree |
| SPAdes (v3.13) | Bankevich et al.9 | https://github.com/ablab/spades |
| Prokka (v4.8.1) | Seeman10 | https://github.com/tseemann/prokka |
| CD-HIT (v4.8) | Fu et al.11 | http://weizhong-lab.ucsd.edu/cd-hit/ |
| treeTime | Sagulenko et al.12 | http://https//github.com/neherlab/treetime |
| lolipop | N/A | https://github.com/cdeitrick/Lolipop |
| ggmueller | N/A | https://cran.r-project.org/package=ggmuller |
| growthrater | N/A | https://github.com/vedomics/growthrateR |
| SRST2 | Inouye et al.13 | https://github.com/katholt/srst2 |
| MLST | N/A | https://github.com/tseemann/mlst |
| treeWAS | Collins & Didelot 14 | https://github.com/caitiecollins/treeWAS |
| Other | ||
| Public S. aureus annotations used in annotation of assemblies | NCBI Genbank | NC_002745, NC_003140, NC_002758, NC_002774, NC_009641, NC_003923, NC_002952, NC_002953, NC_005951, NC_002951, NC_006629, NC_007795, NC_007793, NC_007790, NC_007791, NC_007792 |
| 276 public S. aureus genomes analyzed |
Edslev et al., Young et al., Harkins et al., Harkins et al. 15–18 | See Table S10 |
| Tegaderm (bio-occlusive film) | 3M | 1624W |
Experimental model and subject details
Study cohort and sample collection
Patients were recruited from the Dermatology Clinic at the National Institute for Pediatrics in Mexico City under a protocol approved by the Institutional Review Boards of the NIP (042/2016) and Massachusetts Institute of Technology. Inclusion criteria for enrollment were: ages 5 to 18 years, diagnosis of AD according to modified Hanifin and Rajka criteria 63 and SCORAD ≥ 25 at first visit. Parental guardians and children 12 years of age or older provided written informed consent. Patients were excluded if they self-reported taking systemic antibiotics within the past month. Upon later chart review, we identified one patient (Pt. 15) did take antibiotics immediately prior to enrolment. We have included this patient as its S.aureus tMRCA and sweeping pattern did not differ from any other highly colonized patient. Of the 23 children included, 13 were female (Table S1).
Patients were sampled at up to five timepoints (Figure 1a), during which they received standard treatment for AD (described in more detail below). Some patients were additionally instructed to use dilute bleach baths (0.005%) twice weekly as part of a trial for the efficacy of bleach baths on AD treatment 18. Some deviation from this schedule occurred due to patients’ schedules, as well as the disruption caused by the earthquake in September 2017. Patients were counseled to avoid irritants and adequate use of fragrance-free moisturizers and/or emollients 3 times daily. Treatment with anti-inflammatory medication (either class II-VII topical corticosteroids or the calcineurin inhibitor tacrolimus 0.1%) was prescribed considering multiple factors including skin sites affected, severity of AD, and age of the patient. Patients were instructed to apply the topical corticosteroids 2x or 3x daily on affected sites until improvement was achieved. Once improved, patients were instructed to continue using the topical medication twice weekly on previously affected areas for two more weeks. At each clinical visit patients were re-evaluated and either instructed to stop the topical medication, change the type/class of medication, or to continue using the same medication twice daily or twice weekly based on the assessment. Detailed information about patient care was collected at each of the first 3 follow-up visits, but not at the 6 month follow up; patients continued treatment at their own discretion between the 4th and 5th visits. Overview of patient data, including treatment, is in Table S1.
Method details
Culturing and single-colony sequencing
Skin swabs were collected from seven different locations, spanning sites both affected and unaffected by AD, at each visit in Liquid Amies transport media (Figure 1a). Swabs were directly inoculated on mannitol salt and blood agar plates and cultured for 24h at 37℃. For each culture plate, up to 10 colonies suspected to be S. aureus by colony morphology were selected. These colonies were restreaked on ¼ of a blood agar plate and cultured for 24h at 37℃ to obtain sufficient material for DNA extraction. DNA was extracted using the Wizard® Genomic DNA Purification Kit (Promega Corporation) for Gram-positive bacteria.
Dual-barcoded DNA libraries were constructed using the plexWell library prep system (SeqWell) for most samples and a modified version of the Nextera protocol for a small subset 64. Libraries were sequenced on the Illumina NextSeq 500 using paired end 75bp reads to an average of 1.7M read pairs per isolate. Demultiplexed reads were trimmed and filtered using cutadapt v1.18 65 and sickle-trim v1.13 66 (pe -q 20 -l 50).
We note that sequenced S. aureus genomes from each patient is an imperfect measure of S. aureus absolute abundance. In some cases, with heavy growth, it was difficult to isolate 10 colonies. In addition, some sequenced colonies were determined not to be S. aureus from genomic data and excluded from the analysis and some cultured isolates did not yield sequenceable libraries due to a failure in DNA extraction or library prep -- and thus could not be confirmed to be S. aureus. Regardless, we find good correlation between final colony count data and relative abundance inferred from 16S rRNA sequencing (Figure S2).
Assignment of isolates to lineages
Reads were aligned using bowtie2 v2.2.6 (-X 2000 --no-mixed --dovetail) against methicillin-resistant Staphylococcus aureus USA300-FPR3757 (RefSeq NC_007793). Candidate single nucleotide variants were called using samtools (v1.5), mpileup (-q30 -x -s -O -d3000), bcftools call (-c), and bcftools view (-v snps -q .75) 67,68.
To avoid issues arising from false-negative mutation calls, candidate variants found in at least one isolate were assessed for support of reference versus alternate alleles as described below. For each candidate variant, information for all reads aligning to that position (e.g. base call, quality, coverage), across all samples, were aggregated into a data structure for local filtering and analysis. Isolates were removed from analysis if they had a mean coverage 7 or below across variant positions (208 isolates removed of an initial 1,735). To identify isolates with contamination that would inhibit reliable read calling, the frequency of the second highest allele at each position, in each sample, was calculated (minor allele frequency) and those isolates with a mean minor allele frequency above 0.03 across candidate sites were removed (21 isolates). We filtered candidate SNVs using a publicly available protocol (see Data Availability) similar to that previously published 34, with the following filters. Basecalls were marked as ambiguous if the FQ score produced by samtools was above −30, the coverage per strand was below 2, or the major allele frequency was below 0.85. Variant positions were filtered if 5% or more of all isolates were called as ambiguous (this removes most of the ‘accessory’ genome) or if the median coverage across strains was below 3, or if no unmasked polymorphisms remained. These filters retained 60,973 SNVs across 1,506 isolates. A maximum-likelihood tree was built with RAxML v8.2.12 69 using the GTRCAT model, with rate heterogeneity disabled (-V). Sporadic isolates that were phylogenetically confined within the diversity of another patient were likely mislabeled and removed (7 isolates removed, leaving a final total of 1,499 isolates). The phylogenetic tree was visualized with iTol 70.
For each isolate the sequence type and clonal complex was inferred using the bioinformatic tools SRST2 (--truncation_score_tolerance 0.01 --max_unaligned_overlap 8 --min_edge_depth 8) 71 and MLST (https://github.com/tseemann/mlst). The S. aureus ST/CC database was obtained November 2022 (containing 7,898 allele combinations) 72. SRST2 isolate STs with identified mismatches (flagged with ‘?’) agreed with the ST identified among other isolates of that lineage and were accepted. All isolates flagged by SRST2 as non-identifiable allele combinations (‘*’, ‘NF’) have been set ‘NA’. Whenever the results of SRST2 and MLST disagreed the consensus ST was chosen, defined as the identified ST that was shared with the majority of other isolates assigned to that lineage. The ST typing results are reported for each isolate in Table S10. Isolates from patient 17 and minor lineage of patient 26 were manually assigned to CC30 after failing SRST2/MLST sequence type assignment, despite matched allele types for 6 out of 7 alleles that define CC30; the CC30 assignment is also supported by the phylogeny (Figure 1c). Other isolates that failed sequence typing were ignored for CC-dependent analysis and are not shown in Figure 1b (127 out of 1,499).
Lineages are defined as phylogenetically closely related S. aureus from the same patient which differ by less than 100 SNVs on the core genome (Figure S1). Analysis of minor lineage detection dependency on the number of isolates sampled at a given visit suggests that deeper sampling would have been unlikely to detect additional lineages from most patients (Figure S2e). A second phylogeny performed using the methicillin-sensitive S. aureus FDA209P (NCTC 7447, RefSeq NZ_AP014942, NZ_AP014943) genome as a reference for alignment 73 resulted in the same lineage groupings (data not shown).
Within-patient phylogenetic reconstruction
We constructed lineage-specific assemblies in order to capture true genome-wide diversity; when combined with alignment, this approach can capture variants in the accessory genome not shared by all isolates 4. For patients colonized by multiple lineages, we only analyzed isolates from the major lineage. Only isolates with ≥ 80% reads assigned to S. aureus on the species level (assigned using kraken2, default parameters, and standard database build Sep 24 2018) 74 were included for de-novo assembly, leaving 1,215 isolates. For each lineage, we concatenated up to 250,000 reads from each member isolate and assembled a reference genome with SPAdes 75 (v3.13, careful mode). All scaffolds of size 500b or larger were annotated using prokka 76 (v1.14.6), which was supplied with a list of proteins (--proteins) from nine publicly available S. aureus genomes and six accompanying plasmids (NCBI accession: NC_002745, NC_003140, NC_002758, NC_002774, NC_009641, NC_003923, NC_002952, NC_002953, NC_005951, NC_002951, NC_006629, NC_007795, NC_007793, NC_007790, NC_007791, NC_007792). The assemblies for each patient are summarized in Table S6.
We aligned the data of all initial 1,704 isolates from major lineages to their respective patient-specific assemblies using bowtie2 77 using the same parameters as described for assignment of isolates to lineages analysis. Isolates and candidate single nucleotide variants were processed with identical methods as listed in assignment of isolates to lineages, but with the following modifications: (1) To remove isolates with an inflated mean coverage across the assembled genomes due to high-copy number plasmids we required that at least 10% of the genome covered at 8X; (2) To detect variations within the accessory genome, the allowed maximum fraction of ambiguous isolates per site was increased from 5% to 25%; (3) To remove variants that emerged from recombination or other complex events, we identified SNVs that were less then 500b apart and covaried highly across isolates within a patient (a SNV was considered to highly covary with another SNV if its covariance was in the 90% percentile across covariances calculated with the focal SNV); these positions were removed from downstream analysis. (4) To remove cross-contaminated samples, isolates were omitted if they had minor mean allele-frequency of 9% across verified SNVs (removing 6 isolates of patient 19). Overall, these filters removed 284 isolates, leaving 1,422 isolates and 915 de novo on-person SNVs across 23 subjects (Table S7). Phylogenetic reconstruction was done using dnapars from PHYLIP v3.69 78. Each lineage’s tree was rooted using the isolate with the highest coverage from the most closely related lineage as an outgroup (based on assignment of isolates to lineages analysis).
Molecular clock and TMRCA
We estimated the number of de novo mutations per isolate using all positions variable within a patient lineage. The ancestral state of each variant is defined by the allele called in the lineage-specific outgroup (the isolate with the highest coverage from the most closely related lineage; see above). If this was not available, the major allele across the set of isolates used as an outgroup for any lineage was used. For Patient 26, we checked the predicted ancestral genotype using treetime 79 after noticing a significantly elevated molecular clock (using procedures below); we changed the ancestral allele of the outgroup at four basal mutation positions to match the best molecular clock fit predicted by treetime 79. We normalized the number of mutations per isolate to the number of positions on the patient-specific assembled reference with a depth of at least 8X. We inferred the molecular rate using linear regression implemented in scipy v.1.3.1 80 and the 95% confidence interval using the two-sided inverse Students t-distribution. Time to the most recent common ancestor (tMRCA) was calculated for each patient data from each patient’s earliest visit with at least 10 isolates, and the inferred uncertainty in the molecular clock was utilized to calculate the 95% confidence interval of the tMRCA. For each of the six highly colonized patients the tMRCA was calculated using their inferred mutation rate, while for all other patients the median molecular rate of the six highly colonized individuals was used (2.41 × 10⁻⁶ substitutions/site/year).
Signatures of on-person adaptive evolution
Each within-patient dataset was searched for genes with either of two signatures of adaptive evolution: parallel evolution at the gene level 1 and hard selective sweeps 81–83. First, we identified cases when two or more mutations arose in a single gene within a patient, with a minimum mutation density of 1 mutation per 1000 bp. We calculated a p-value for enrichment of mutations in each gene using a Poisson distribution 84. Only the capD gene in patient 12 had a significant p-value after Bonferroni correction for the number of genes on the genome (Table S4). Second, we searched for genomic positions at which the mutant allele frequency rose by at least 30% between visits. For each SNV, we assigned the ancestral allele as the allele found in the patient-specific outgroup, or, if that was not available, we used the allele present in the patient-specific assembly. We compared lists of genes with candidate adaptive signatures across patients using CD-HIT (v4.7, 95% identity) 85. All candidate signatures of adaptive evolution are reported in Table S4.
Creation of Muller plots
We visualized the change in frequency of mutations observed on each patient with ≥99 isolates using Mueller plots. Patient 04 and patient 15 yielded only two isolates at visit 4 and visit 2, respectively; these timepoints were omitted from visualization. We only drew mutations with an observed variation in frequency of ≥ 0.3 between timepoints. We converted mutation frequencies into genotype trajectories using lolipop v0.8.0 (https://github.com/cdeitrick/Lolipop), SNVs were grouped into a single genotype (color) if derived allele frequency difference was less than 8%. To make successive sweeps more visible, we used a custom-made python function to generate intermediate genotype frequencies between sampling timepoints. In brief, we created 100 time units per month, assumed mutations swept sequentially, and applied an exponential growth or decline following the function of frequency x = ℇ ^((ln(f1) - ln(f0) ) / g), with f0 is the frequency at preceding visit or 0, f1 is the frequency at the next visit and g is the number of time units (see code availability). The extended table was used again as the input for lolipop, which provided the input tables for plotting using the R package ggmueller v0.5.5 86.
Mobile genetic element analysis
We identified genetic gain and/or loss events based on the depth of coverage of each isolate aligned to its patient-specific assemblies along the six individuals with at least 99 isolates 4. To avoid spurious results due to uneven coverage across samples or genomic regions, we calculated a z-score for each position by normalizing each isolate’s depth of coverage at each position by sample and by position. We identified genomic regions greater than or equal to 5,000 bp long, for which each position’s z-score was below a threshold of −0.5 with a median threshold below −1.0. Identified candidate regions were further filtered to have at least one isolate with a median coverage of 0 and at least one with an average depth of at least 10X. These cutoffs were determined using a custom-made interactive python module for visualization of coverage across the entire candidate region across all samples (Table S5; see code availability).
Capsule typing
S. aureus capsule serotyping was performed as described previously 87. Briefly, duplicate tryptic soy agar plates were spot inoculated in a grid pattern with S. aureus isolates and incubated overnight at 37°C. The colonies were blotted onto nitrocellulose filter membranes for 5 min at ambient temperature. Adherent colonies were fixed to the membranes by heating them at 60°C for 15 min. After two washes with 10 mM sodium phosphate buffer-0.85% sodium chloride (phosphate-buffered saline; PBS) to remove excess cells, the filters were immersed in a solution of trypsin (1 mg/ml; Sigma) for 60 min at 37°C to remove protein A from the bacterial cells. After two washes in PBS, the filters were blocked with 0.05% skim milk for 1 h and washed in PBS containing 0.05% Tween 20 (PBST). Each filter was incubated with capsule type-specific rabbit polyclonal antisera (diluted 1:4,000 in PBST) at 37°C for 1 h. After washing in PBST, horseradish peroxidase-conjugated donkey anti-rabbit immunoglobulin (diluted 1:5000) was incubated with each filter for 1 h at 37°C. After three washes, KPL 1-Component TMB Membrane Peroxidase Substrate was added to the filters. A purple color developed within 5 min and was scored visually from 0 to 4+. The reactivities of the clinical isolates were evaluated by comparison with those of control S. aureus strains (serotypes 5, 8, and nontypeable isolates) included on each filter. Results are presented in Table S3.
Growth rate
Overnight cultures were inoculated into fresh TSB at a 1:100 dilution. Cultures were grown at 37℃ with shaking, for 24h in a Tecan plate reader (Infinite F Nano+, Tecan Trading AG, Switzerland). Absorbance at 595 nm was measured every 5 minutes. The plate containing growing cultures was sealed using its own lid. The growth rate was calculated using a regression on log-normalized data and selected for a single time interval across all strains where the r2 of the estimated growth rate was > 0.999. Code and raw data available at: github.com/vedomics/growthrateR. Results are presented in Figure S12.
All experiments were performed with representative test isolates carrying de novo mutations in the capD gene from patients enrolled in this study. For each test isolate, a phylogenetically closely related and basal control isolate was chosen (see Table S7).
Fusidic Acid Susceptibility
Overnight cultures of patient isolates of S. aureus were diluted and plated on varying concentrations of fusidic acid (Sigma-Aldrich), ranging from 0.02ug/Ll to 2.5ug/mL. Both capsule positive and capsule negative strains were found to be susceptible at 0.05ug/mL, although the emergence of resistant mutants was common on both backgrounds.
Public S. aureus isolate genome analysis
We investigated publicly available data to verify if loss of CapD is associated with S. aureus colonizing AD skin. We obtained whole-genome sequence data from 4 different publications analyzing S. aureus in healthy individuals, AD patients, or individuals with other S. aureus infections 25,44–46. When data from multiple isolates per patient was available, the isolate from the site of infection (if available) with the highest coverage was used. To examine gene content, we performed de novo assembly for each isolate using SPAdes (v3.13, --careful) 75 and annotated the assembly using Prokka (v1.14.6) 76 as described above. Isolates with assembly lengths of < 2.6M nucleotides were not considered and removed from consideration (removing 6 isolates). After this removal, we analyzed 276 isolates from 276 patients. To understand the relationship between isolates, we performed an alignment-based phylogenetic reconstruction using S.aureus COL (sequence version number: NC_002951.2, NC_006629.2) and the same filters as above. In addition, we included USA300-FPR3757 (RefSeq NC_007793) as a sample, by simulating raw reads for input to our cross-lineage phylogenetic analysis (cutting its genome in segments of size 150 b in steps of 1 b to simulate reads). The maximum likelihood phylogeny was built using RAxML v8.2.12 (-m GTRCAT) 69 and visualized with iTol 70.
We inferred the ORF status for all capsule and capsule-associated genes using the annotated assemblies and BLAST+ v2.7.1 88. Details about each query gene are available in Table S8. We compared the best BLAST match to each query gene for overlap with an annotated reading frame. We accepted an ORF as complete if the start and end of the best BLAST hit were each within 100 bp of a gene start or end of a single gene in the annotated assembly. S. aureus genomes colonizing humans are known to carry 1 of 2 predominant cap loci (type 5 or 8) 36 and 1 of 4 agr types 89 containing homologous versions of the same genes; for these cassettes we performed analysis only for the respective loci with the best BLAST match to a given isolate. Results are reported in Figure 4, Figures S9–S10 and summarized in Table S9. When only data from publications reporting both AD and controls are included, the enrichment of capD premature stop codons in AD vs controls remains significant (P=0.026).
We note that the relatively modest number of independent genomes used here, which were selected from a few studies to limit geographical bias, was not sufficient to identify genes associated with AD status in a hypothesis-free, whole-genome, approach given the complication of linkage for bacterial association studies 58. We identified presence / absence of genes among annotated genomes (using SPAdes and prokka as above) of the public S. aureus isolates using CD-HIT 85 (-s 0.9 -A 0.9 -g 1). We used TreeWAS 58, a phylogeny-corrected method for GWAS built for asexual organisms, to identify genes associated with AD status, and identified no hits that meet genome-wide significance (Fisher’s test). Our search for associations in capD presence was hypothesis-specific and thus does not require multiple hypothesis correction; nevertheless, based on the corrected p-values reported by TreeWAS for individual genes capD ranks 71 (Table S11; note that this list contains an unknown number of false positives).
in vivo infection models
In a previous version of this manuscript available on bioRxiv 90, we reported a difference between S. aureus Newman WT and a Newman Cap5D deletion mutant in an epicutaneous infection model in mice. However, the two strains were found to have additional point mutations between them, including a nonsynonymous mutation in the sensor kinase saeS that confounded the reported impact of cap5D deletion on disease severity in this model. We repeated the experiments with bacterial isolates collected from patients enrolled in this study and observed no difference in skin infection nor skin colonization (Figure S13).
All experiments were performed with representative bacterial isolates carrying de novo mutations in the capD gene from patients enrolled in this study. For each test isolate, a phylogenetically closely related and basal control isolate was chosen. Sometimes the test isolate contains additional mutations compared to the most closely related basal isolate observed. Patient 12: Control: 048-RI3; Test: 059-AI7 (Q199* in capD; synonymous mutation in a hypothetical protein). Patient 9: Control: 061-N5; Test: 186-RI6 (N595S in capD; G278D ComE operon protein 3 comEC; intergenic mutation between two hypothetical proteins).
Bacteria were grown to a stationary phase overnight at 37°C in Tryptic Soy Broth (TSB) at 250 r.p.m. Stationary phase cultures were diluted 1:100 in fresh TSB and grown for 3.5 hours to approximate mid-log phase. Cultures were then centrifuged at 800xg for 15 minutes, and the resulting pellet washed twice in phosphate buffered saline (PBS). Cells were resuspended to a concentration of ~1010 CFU/mL. Serial dilutions were plated on Tryptic Soy Agar (TSA) plates to confirm inoculum cell densities.
Eight-week old C57BL/6 female mice from Jackson Laboratories (Bar Harbor, ME, USA) were housed in specific pathogen free animal barrier facilities at MIT in individually ventilated isolator cages under a 12 h light/dark cycle with ad libitum food and water access. Euthanasia was performed by CO2 inhalation. All animal experiments were approved by the Institutional Animal Care and Use Committee (IACUC) at MIT.
Epicutaneous Skin Infection and Bacterial Load Measurements. Two days prior to epicutaneous infection, mice were shaved and the remaining hair removed using depilatory cream (Nair) along the length of their back/flank. A sterile 1 cm2 square of gauze was soaked in 100 uL of prepared S. aureus inoculum (~109 CFU/mL for each strain, see crosshatches in figures) and applied to the flank skin. The gauze was secured using bio-occlusive film (Tegaderm, 3M) and the tape checked and repaired daily to maintain its integrity. Gauze soaked in sterile PBS was used as a control. Seven days post-inoculation, mice were euthanized by CO2 and the dressing removed. Skin under the gauze was immediately scored for disease severity according to the following criteria: oedema (0–3), erythema (0–3), skin scale (0–3), and skin thickness (0– 3) and totaled for a max skin score of “12.”. A higher score indicated more severe disease/inflammation. For bacterial load, the flank skin immediately under the gauze (~1 cm2) was excised and resuspended in 1 mL cold PBS contained in a 2 mL microcentrifuge tube. The tissue was cut into smaller pieces using sterilized scissors, two metal ball bearings (4.5 mm) were added to each tube, and the tissue was homogenized using a TissueLyser II (Qiagen, Germany) at 25 s−1 for 5 min. Homogenates were briefly spun down, serially diluted in PBS, and then plated for CFU counts. Bacterial identity was confirmed by plating on ChromAgar Colorex S. aureus (ChromAgar, France) plates to differentiate any native microbiota that may have been present. A total of two replicates were performed. The analysis of all animal experiments was blinded. For colonization experiments, bacteria were prepared as above and ~107 CFU were applied to each ear in a 50 uL volume. Mice were euthanized 24 h later and tissue was harvested, homogenized, and serially diluted in PBS. Bacterial identity was confirmed by plating on ChromAgar Colorex S. aureus plates.
Collectors Curve Analysis
For each patient and sampling point (visit) with at least 10 isolates a collector curve was created for dMRCA or identified SNVs (Figure S14 and S15). For each patient-visit dataset we re-sampled with replacement 0 < x < n isolates each x sampled 100 times, calculated the within-sample diversity, and plotted the mean and standard deviation.
Quantification and statistical analysis
Information on the statistical tests and simulations can be found in the figure legends and in the corresponding Method Details. Statistics for all genomic analyses were computed in python and statistics for growth curve analyses were computed in R. All code is available github (see key resources table).
Supplementary Material
Table S2. Location and count of isolates from major and minor lineage recovered from patients with multiple lineages, related to Figure 1.
Table S3. Capsule typing with an in vitro immunoblot assay for single isolates and reference strains, related to Figure 3.
Table S4. Identified genes with candidate signatures of adaptive evolution across subjects, related to Figure 3.
Table S5. Gene content annotated in identified mobile genetic elements variable across isolates within a patient, related to STAR Methods.
Table S6. Summary for each lineage-specific assembly and annotation, related to Figure 3 and STAR Methods.
Table S7. All identified SNVs detected within major lineages, related to Figure 3.
Table S8. Reference nucleotide sequences and source used for searching S. aureus assemblies for capsule-associated genes, related to Figure 3 and 4.
Table S9. Inferred capsule, agr type and gene status for publicly available isolates used in meta-analysis, related to Figure 4.
Table S10. Metadata of all isolate genomes included in the across and within-patient analyses, related to STAR Methods.
Table S11. Genome-wide association of gene presence absence between publicly S. aureus isolates from Atopic Dermatitis patients versus healthy controls, related to STAR Methods.
Highlights.
Most patients are colonized stably by a single S. aureus sequence type
Within each lineage, de novo variants spread and replace their on-person ancestors
On-person and across-person parallel evolution in observed in capD
Capsule loss enriched on AD patients compared to healthy carriage or other diseases
Acknowledgements
We thank Mariana Matus and Eric Alm for assistance in the design of the clinical cohort, the BioMicroCenter at MIT for performing genomic sequencing, Adrián Martínez-Gayosso and Blanca L. Campos-Cabrera for assistance with patient sampling, Armando Jerónimo-Gallegos for assistance with colony preparation, Samantha Choi for technical support on animal experiments, Paul F. Koffi for performing in vitro capsule immunoblots, Chris Manusco and Calen Mendall for experimental assistance and members of the Lieberman lab for valuable advice and feedback on the manuscript. We acknowledge support from MISTI Global Seed Funds (to T.D.L. and M.T.G-R.), the National Institutes of Health (DP2-GM140922 to T.D.L., R01AI30019 to I.M.C.), Burroughs Wellcome Fund (to I.M.C.), the Mexican Government Ministry of Taxes Program E022 for Health Research and Technological Development 2018 (to M.T.G-R.), and DFG research fellowship (KE 2408/1–1 to F.M.K.).
Footnotes
Publisher's Disclaimer: This is a PDF file of an unedited manuscript that has been accepted for publication. As a service to our customers we are providing this early version of the manuscript. The manuscript will undergo copyediting, typesetting, and review of the resulting proof before it is published in its final form. Please note that during the production process errors may be discovered which could affect the content, and all legal disclaimers that apply to the journal pertain.
Declaration of interests
The lab of T.D.L. has received funding from Colgate PalmOlive for studies following this work. The lab of I.M.C. has received sponsored research work from Abbvie pharmaceuticals.
References
- 1.Lieberman TD, Michel JB, Aingaran M, Potter-Bynoe G, Roux D, Davis MR Jr, Skurnik D, Leiby N, LiPuma JJ, Goldberg JB, et al. (2011). Parallel bacterial evolution within multiple patients identifies candidate pathogenicity genes. Nat. Genet 43, 1275–1280. 10.1038/ng.997. [DOI] [PMC free article] [PubMed] [Google Scholar]
- 2.Snitkin ES, Zelazny AM, Gupta J, Nisc Comparative Sequencing Program, Palmore TN, Murray PR, and Segre JA (2013). Genomic insights into the fate of colistin resistance and Acinetobacter baumannii during patient treatment. Genome Res 23, 1155–1162. 10.1101/gr.154328.112. [DOI] [PMC free article] [PubMed] [Google Scholar]
- 3.Ernst CM, Braxton JR, Rodriguez-Osorio CA, Zagieboylo AP, Li L, Pironti A, Manson AL, Nair AV, Benson M, and Cummins K (2020). Adaptive evolution of virulence and persistence in carbapenem-resistant Klebsiella pneumoniae. Nat. Med 26, 705–711. [DOI] [PMC free article] [PubMed] [Google Scholar]
- 4.Zhao S, Lieberman TD, Poyet M, Kauffman KM, Gibbons SM, Groussin M, Xavier RJ, and Alm EJ (2019). Adaptive evolution within gut microbiomes of healthy people. Cell Host Microbe 25, 656–667. [DOI] [PMC free article] [PubMed] [Google Scholar]
- 5.Williams MR, and Gallo RL (2015). The Role of the Skin Microbiome in Atopic Dermatitis. Curr. Allergy Asthma Rep 15, 65. 10.1007/s11882-015-0567-4. [DOI] [PubMed] [Google Scholar]
- 6.Ni J, Wu GD, Albenberg L, and Tomov VT (2017). Gut microbiota and IBD: causation or correlation? Nat. Rev. Gastroenterol. Hepatol 14, 573. [DOI] [PMC free article] [PubMed] [Google Scholar]
- 7.Nakatsuji T, Chen TH, Narala S, Chun KA, Two AM, Yun T, Shafiq F, Kotol PF, Bouslimani A, and Melnik AV (2017). Antimicrobials from human skin commensal bacteria protect against Staphylococcus aureus and are deficient in atopic dermatitis. Sci. Transl. Med 9. [DOI] [PMC free article] [PubMed] [Google Scholar]
- 8.Byrd AL, Deming C, Cassidy SKB, Harrison OJ, Ng W-I, Conlan S, Belkaid Y, Segre JA, Kong HH, and Nisc Comparative Sequencing Program (2017). Staphylococcus aureus and Staphylococcus epidermidis strain diversity underlying pediatric atopic dermatitis. Sci. Transl. Med 9. [DOI] [PMC free article] [PubMed] [Google Scholar]
- 9.Hall AB, Yassour M, Sauk J, Garner A, Jiang X, Arthur T, Lagoudas GK, Vatanen T, Fornelos N, Wilson R, et al. (2017). A novel Ruminococcus gnavus clade enriched in inflammatory bowel disease patients. Genome Med 9, 103. 10.1186/s13073-017-0490-5. [DOI] [PMC free article] [PubMed] [Google Scholar]
- 10.Asher MI, Montefort S, Björkstén B, Lai CKW, Strachan DP, Weiland SK, and Williams H (2006). Worldwide time trends in the prevalence of symptoms of asthma, allergic rhinoconjunctivitis, and eczema in childhood: ISAAC Phases One and Three repeat multicountry cross-sectional surveys. Lancet 368, 733–743. 10.1016/S0140-6736(06)69283-0. [DOI] [PubMed] [Google Scholar]
- 11.Hay RJ, Johns NE, Williams HC, Bolliger IW, Dellavalle RP, Margolis DJ, Marks R, Naldi L, Weinstock MA, Wulf SK, et al. (2014). The Global Burden of Skin Disease in 2010: An Analysis of the Prevalence and Impact of Skin Conditions. J. Invest. Dermatol 134, 1527–1534. 10.1038/jid.2013.446. [DOI] [PubMed] [Google Scholar]
- 12.Baurecht H, Rühlemann MC, Rodríguez E, Thielking F, Harder I, Erkens A-S, Stölzl D, Ellinghaus E, Hotze M, Lieb W, et al. (2018). Epidermal lipid composition, barrier integrity, and eczematous inflammation are associated with skin microbiome configuration. J. Allergy Clin. Immunol 141, 1668– 1676.e16. 10.1016/j.jaci.2018.01.019. [DOI] [PubMed] [Google Scholar]
- 13.Leyden JJ, Marples RR, and Kligman AM (1974). Staphylococcus aureus in the lesions of atopic dermatitis. Br. J. Dermatol 90, 525–525. 10.1111/j.1365-2133.1974.tb06447.x. [DOI] [PubMed] [Google Scholar]
- 14.Kong HH, Oh J, Deming C, Conlan S, Grice EA, Beatson MA, Nomicos E, Polley EC, Komarow HD, Nisc Comparative Sequence Program, et al. (2012). Temporal shifts in the skin microbiome associated with disease flares and treatment in children with atopic dermatitis. Genome Res 22, 850–859. [DOI] [PMC free article] [PubMed] [Google Scholar]
- 15.Tauber M, Balica S, Hsu C-Y, Jean-Decoster C, Lauze C, Redoules D, Viodé C, Schmitt A-M, Serre G, and Simon M (2016). Staphylococcus aureus density on lesional and nonlesional skin is strongly associated with disease severity in atopic dermatitis. J. Allergy Clin. Immunol 137, 1272–1274. [DOI] [PubMed] [Google Scholar]
- 16.Huang JT, Abrams M, Tlougan B, Rademaker A, and Paller AS (2009). Treatment of Staphylococcus aureus colonization in atopic dermatitis decreases disease severity. Pediatrics 123, e808–e814. [DOI] [PubMed] [Google Scholar]
- 17.Paller AS, Kong HH, Seed P, Naik S, Scharschmidt TC, Gallo RL, Luger T, and Irvine AD (2019). The microbiome in patients with atopic dermatitis. J. Allergy Clin. Immunol 143, 26–35. 10.1016/j.jaci.2018.11.015. [DOI] [PMC free article] [PubMed] [Google Scholar]
- 18.Khadka VD, Key FM, Romo-González C, Martínez-Gayosso A, Campos-Cabrera BL, Gerónimo-Gallegos A, Lynn TC, Durán-McKinster C, Coria-Jiménez R, Lieberman TD, et al. (2021). The Skin Microbiome of Patients With Atopic Dermatitis Normalizes Gradually During Treatment. Front. Cell. Infect. Microbiol 11, 720674. 10.3389/fcimb.2021.720674. [DOI] [PMC free article] [PubMed] [Google Scholar]
- 19.Gorwitz RJ, Kruszon-Moran D, McAllister SK, McQuillan G, McDougal LK, Fosheim GE, Jensen BJ, Killgore G, Tenover FC, and Kuehnert MJ (2008). Changes in the Prevalence of Nasal Colonization with Staphylococcus aureus in the United States, 2001–2004. J. Infect. Dis 197, 1226–1234. 10.1086/533494. [DOI] [PubMed] [Google Scholar]
- 20.Oh J, Byrd AL, Deming C, Conlan S, Barnabas B, Blakesley R, Bouffard G, Brooks S, Coleman H, Dekhtyar M, et al. (2014). Biogeography and individuality shape function in the human skin metagenome. Nature 514, 59–64. 10.1038/nature13786. [DOI] [PMC free article] [PubMed] [Google Scholar]
- 21.Tong SYC, Davis JS, Eichenberger E, Holland TL, and Fowler VG (2015). Staphylococcus aureus Infections: Epidemiology, Pathophysiology, Clinical Manifestations, and Management. Clin. Microbiol. Rev 28, 603. 10.1128/CMR.00134-14. [DOI] [PMC free article] [PubMed] [Google Scholar]
- 22.Enright MC, Robinson DA, Randle G, Feil EJ, Grundmann H, and Spratt BG (2002). The evolutionary history of methicillin-resistant Staphylococcus aureus (MRSA). Proceedings of the National Academy of Sciences 99, 7687–7692. [DOI] [PMC free article] [PubMed] [Google Scholar]
- 23.Ogonowska P, Gilaberte Y, Barańska-Rybak W, and Nakonieczna J (2020). Colonization With Staphylococcus aureus in Atopic Dermatitis Patients: Attempts to Reveal the Unknown. Front. Microbiol 11, 567090. 10.3389/fmicb.2020.567090. [DOI] [PMC free article] [PubMed] [Google Scholar]
- 24.Nakamura Y, Takahashi H, Takaya A, Inoue Y, Katayama Y, Kusuya Y, Shoji T, Takada S, Nakagawa S, Oguma R, et al. (2020). Staphylococcus Agr virulence is critical for epidermal colonization and associates with atopic dermatitis development. Sci. Transl. Med 12, eaay4068. 10.1126/scitranslmed.aay4068. [DOI] [PMC free article] [PubMed] [Google Scholar]
- 25.Harkins CP, Pettigrew KA, Oravcová K, Gardner J, Hearn RMR, Rice D, Mather AE, Parkhill J, Brown SJ, Proby CM, et al. (2018). The Microevolution and Epidemiology of Staphylococcus aureus Colonization during Atopic Eczema Disease Flare. J. Invest. Dermatol 138, 336–343. 10.1016/j.jid.2017.09.023. [DOI] [PMC free article] [PubMed] [Google Scholar]
- 26.Chopra R, Vakharia PP, Sacotte R, Patel N, Immaneni S, White T, Kantor R, Hsu DY, and Silverberg JI (2017). Severity strata for Eczema Area and Severity Index (EASI), modified EASI, Scoring Atopic Dermatitis (SCORAD), objective SCORAD, Atopic Dermatitis Severity Index and body surface area in adolescents and adults with atopic dermatitis. Br. J. Dermatol 177, 1316–1321. [DOI] [PubMed] [Google Scholar]
- 27.Holden MT, Hsu LY, Kurt K, Weinert LA, Mather AE, Harris SR, Strommenger B, Layer F, Witte W, de Lencastre H, et al. (2013). A genomic portrait of the emergence, evolution, and global spread of a methicillin-resistant Staphylococcus aureus pandemic. Genome Res 23, 653–664. 10.1101/gr.147710.112. [DOI] [PMC free article] [PubMed] [Google Scholar]
- 28.McAdam PR, Templeton KE, Edwards GF, Holden MTG, Feil EJ, Aanensen DM, Bargawi HJA, Spratt BG, Bentley SD, Parkhill J, et al. (2012). Molecular tracing of the emergence, adaptation, and transmission of hospital-associated methicillin-resistant Staphylococcus aureus. Proc. Natl. Acad. Sci. U. S. A 109, 9107–9112. 10.1073/pnas.1202869109. [DOI] [PMC free article] [PubMed] [Google Scholar]
- 29.Nübel U, Nachtnebel M, Falkenhorst G, Benzler J, Hecht J, Kube M, Bröcker F, Moelling K, Bührer C, Gastmeier P, et al. (2013). MRSA Transmission on a Neonatal Intensive Care Unit: Epidemiological and Genome-Based Phylogenetic Analyses. PLoS One 8, e54898. 10.1371/journal.pone.0054898. [DOI] [PMC free article] [PubMed] [Google Scholar]
- 30.Uhlemann AC, Dordel J, Knox JR, Raven KE, Parkhill J, Holden MT, Peacock SJ, and Lowy FD (2014). Molecular tracing of the emergence, diversification, and transmission of S. aureus sequence type 8 in a New York community. Proc. Natl. Acad. Sci. U. S. A 111, 6738–6743. 10.1073/pnas.1401006111. [DOI] [PMC free article] [PubMed] [Google Scholar]
- 31.Young BC, Golubchik T, Batty EM, Fung R, Larner-Svensson H, Votintseva AA, Miller RR, Godwin H, Knox K, Everitt RG, et al. (2012). Evolutionary dynamics of Staphylococcus aureus during progression from carriage to disease. Proc. Natl. Acad. Sci. U. S. A 109, 4550–4555. 10.1073/pnas.1113219109. [DOI] [PMC free article] [PubMed] [Google Scholar]
- 32.Golubchik T, Batty EM, Miller RR, Farr H, Young BC, Larner-Svensson H, Fung R, Godwin H, Knox K, Votintseva A, et al. (2013). Within-Host Evolution of Staphylococcus aureus during Asymptomatic Carriage. PLoS One 8, e61319. 10.1371/journal.pone.0061319. [DOI] [PMC free article] [PubMed] [Google Scholar]
- 33.Turner NA, Sharma-Kuinkel BK, Maskarinec SA, Eichenberger EM, Shah PP, Carugati M, Holland TL, and Fowler VG (2019). Methicillin-resistant Staphylococcus aureus: an overview of basic and clinical research. Nat. Rev. Microbiol 17, 203–218. [DOI] [PMC free article] [PubMed] [Google Scholar]
- 34.Lieberman TD, Flett KB, Yelin I, Martin TR, McAdam AJ, Priebe GP, and Kishony R (2014). Genetic variation of a bacterial pathogen within individuals with cystic fibrosis provides a record of selective pressures. Nat. Genet 46, 82–87. 10.1038/ng.2848. [DOI] [PMC free article] [PubMed] [Google Scholar]
- 35.Nguyen D, and Singh PK (2006). Evolving stealth: genetic adaptation of Pseudomonas aeruginosa during cystic fibrosis infections. Proc. Natl. Acad. Sci. U. S. A 103, 8305–8306. 10.1073/pnas.0602526103. [DOI] [PMC free article] [PubMed] [Google Scholar]
- 36.O’Riordan K, and Lee JC (2004). Staphylococcus aureus capsular polysaccharides. Clin. Microbiol. Rev 17, 218–234. [DOI] [PMC free article] [PubMed] [Google Scholar]
- 37.Kuipers A, Stapels DAC, Weerwind LT, Ko Y-P, Ruyken M, Lee JC, van Kessel KPM, and Rooijakkers SHM (2016). The Staphylococcus aureus polysaccharide capsule and Efb-dependent fibrinogen shield act in concert to protect against phagocytosis. Microbiology 162, 1185. [DOI] [PMC free article] [PubMed] [Google Scholar]
- 38.Verbrugh HA, Peterson PK, Nguyen BY, Sisson SP, and Kim Y (1982). Opsonization of encapsulated Staphylococcus aureus: the role of specific antibody and complement. The Journal of Immunology 129, 1681– 1687. [PubMed] [Google Scholar]
- 39.Boyle-Vavra S, Li X, Alam MT, Read TD, Sieth J, Cywes-Bentley C, Dobbins G, David MZ, Kumar N, Eells SJ, et al. (2015). USA300 and USA500 clonal lineages of Staphylococcus aureus do not produce a capsular polysaccharide due to conserved mutations in the cap5 locus. MBio 6. 10.1128/mBio.02585-14. [DOI] [PMC free article] [PubMed] [Google Scholar]
- 40.Mohamed N, Timofeyeva Y, Jamrozy D, Rojas E, Hao L, Silmon de Monerri NC, Hawkins J, Singh G, Cai B, Liberator P, et al. (2019). Molecular epidemiology and expression of capsular polysaccharides in Staphylococcus aureus clinical isolates in the United States. PLoS One 14, e0208356. 10.1371/journal.pone.0208356. [DOI] [PMC free article] [PubMed] [Google Scholar]
- 41.Pöhlmann-Dietze P, Ulrich M, Kiser KB, Döring G, Lee JC, Fournier JM, Botzenhart K, and Wolz C (2000). Adherence of Staphylococcus aureus to endothelial cells: influence of capsular polysaccharide, global regulator agr, and bacterial growth phase. Infect. Immun 68, 4865–4871. 10.1128/iai.68.9.4865-4871.2000. [DOI] [PMC free article] [PubMed] [Google Scholar]
- 42.Risley AL, Loughman A, Cywes-Bentley C, Foster TJ, and Lee JC (2007). Capsular Polysaccharide Masks Clumping Factor A-Mediated Adherence of Staphylococcus aureus to Fibrinogen and Platelets. J. Infect. Dis 196, 919–927. 10.1086/520932. [DOI] [PubMed] [Google Scholar]
- 43.Tuchscherr LP, Buzzola FR, Alvarez LP, Caccuri RL, Lee JC, and Sordelli DO (2005). Capsule-negative Staphylococcus aureus induces chronic experimental mastitis in mice. Infect. Immun 73, 7932–7937. 10.1128/iai.73.12.7932-7937.2005. [DOI] [PMC free article] [PubMed] [Google Scholar]
- 44.Young BC, Wu C-H, Gordon NC, Cole K, Price JR, Liu E, Sheppard AE, Perera S, Charlesworth J, and Golubchik T (2017). Severe infections emerge from commensal bacteria by adaptive evolution. Elife 6, e30637. [DOI] [PMC free article] [PubMed] [Google Scholar]
- 45.Edslev SM, Clausen M-L, Agner T, Stegger M, and Andersen PS (2018). Genomic analysis reveals different mechanisms of fusidic acid resistance in Staphylococcus aureus from Danish atopic dermatitis patients. J. Antimicrob. Chemother 73, 856–861. [DOI] [PMC free article] [PubMed] [Google Scholar]
- 46.Harkins CP, McAleer MA, Bennett D, McHugh M, Fleury OM, Pettigrew KA, Oravcová K, Parkhill J, Proby CM, Dawe RS, et al. (2018). The widespread use of topical antimicrobials enriches for resistance in Staphylococcus aureus isolated from patients with atopic dermatitis. Br. J. Dermatol 179, 951– 958. 10.1111/bjd.16722. [DOI] [PMC free article] [PubMed] [Google Scholar]
- 47.Lei MG, and Lee CY (2020). MgrA Activates Staphylococcal Capsule via SigA-Dependent Promoter. J. Bacteriol 203, e00495–20. 10.1128/JB.00495-20. [DOI] [PMC free article] [PubMed] [Google Scholar]
- 48.Keinhörster D, George SE, Weidenmaier C, and Wolz C (2019). Function and regulation of Staphylococcus aureus wall teichoic acids and capsular polysaccharides. Int. J. Med. Microbiol 309, 151333. 10.1016/j.ijmm.2019.151333. [DOI] [PubMed] [Google Scholar]
- 49.Luong T, Sau S, Gomez M, Lee JC, and Lee CY (2002). Regulation of Staphylococcus aureus capsular polysaccharide expression by agr and sarA. Infect. Immun 70, 444–450. [DOI] [PMC free article] [PubMed] [Google Scholar]
- 50.Nakamura Y, Oscherwitz J, Cease KB, Chan SM, Muñoz-Planillo R, Hasegawa M, Villaruz AE, Cheung GYC, McGavin MJ, Travers JB, et al. (2013). Staphylococcus δ-toxin induces allergic skin disease by activating mast cells. Nature 503, 397–401. 10.1038/nature12655. [DOI] [PMC free article] [PubMed] [Google Scholar]
- 51.Nakagawa S, Matsumoto M, Katayama Y, Oguma R, Wakabayashi S, Nygaard T, Saijo S, Inohara N, Otto M, Matsue H, et al. (2017). Staphylococcus aureus Virulent PSMα Peptides Induce Keratinocyte Alarmin Release to Orchestrate IL-17-Dependent Skin Inflammation. Cell Host Microbe 22, 667–677.e5. 10.1016/j.chom.2017.10.008. [DOI] [PMC free article] [PubMed] [Google Scholar]
- 52.Shinefield H, Black S, Fattom A, Horwith G, Rasgon S, Ordonez J, Yeoh H, Law D, Robbins JB, Schneerson R, et al. (2002). Use of a Staphylococcus aureus Conjugate Vaccine in Patients Receiving Hemodialysis. N. Engl. J. Med 346, 491–496. 10.1056/NEJMoa011297. [DOI] [PubMed] [Google Scholar]
- 53.Tuchscherr LPN, Buzzola FR, Alvarez LP, Lee JC, and Sordelli DO (2008). Antibodies to Capsular Polysaccharide and Clumping Factor A Prevent Mastitis and the Emergence of Unencapsulated and Small-Colony Variants of Staphylococcus aureus in Mice. Infect. Immun 76, 5738–5744. 10.1128/IAI.00874-08. [DOI] [PMC free article] [PubMed] [Google Scholar]
- 54.Culyba MJ, and Van Tyne D (2021). Bacterial evolution during human infection: Adapt and live or adapt and die. PLoS Pathog 17, e1009872. 10.1371/journal.ppat.1009872. [DOI] [PMC free article] [PubMed] [Google Scholar]
- 55.Zdziarski J, Brzuszkiewicz E, Wullt B, Liesegang H, Biran D, Voigt B, Grönberg-Hernandez J, Ragnarsdottir B, Hecker M, Ron EZ, et al. (2010). Host Imprints on Bacterial Genomes—Rapid, Divergent Evolution in Individual Patients. PLoS Pathog 6, e1001078. 10.1371/journal.ppat.1001078. [DOI] [PMC free article] [PubMed] [Google Scholar]
- 56.Elhenawy W, Tsai CN, and Coombes BK (2019). Host-Specific Adaptive Diversification of Crohn’s Disease-Associated Adherent-Invasive Escherichia coli. Cell Host Microbe 25, 301–312.e5. 10.1016/j.chom.2018.12.010. [DOI] [PubMed] [Google Scholar]
- 57.Debray R, Herbert RA, Jaffe AL, Crits-Christoph A, Power ME, and Koskella B (2022). Priority effects in microbiome assembly. Nat. Rev. Microbiol 20, 109–121. 10.1038/s41579-021-00604-w. [DOI] [PubMed] [Google Scholar]
- 58.Collins C, and Didelot X (2018). A phylogenetic method to perform genome-wide association studies in microbes that accounts for population structure and recombination. PLoS Comput. Biol 14, e1005958. 10.1371/journal.pcbi.1005958. [DOI] [PMC free article] [PubMed] [Google Scholar]
- 59.Thurlow LR, Joshi GS, and Richardson AR (2012). Virulence strategies of the dominant USA300 lineage of community-associated methicillin-resistant Staphylococcus aureus (CA-MRSA). FEMS Immunol. Med. Microbiol 65, 5–22. 10.1111/j.1574-695X.2012.00937.x. [DOI] [PMC free article] [PubMed] [Google Scholar]
- 60.Suligoy CM, Díaz RE, Gehrke A-K, Ring N, Yebra G, Alves J, Gómez MI, Wendler S, Fitzgerald JR, Tuchscherr L, et al. (2020). Acapsular Staphylococcus aureus with a non-functional agr regains capsule expression after passage through the bloodstream in a bacteremia mouse model. Sci. Rep 10, 14108. 10.1038/s41598-020-70671-1. [DOI] [PMC free article] [PubMed] [Google Scholar]
- 61.Lou YC, Hoff J, Olm MR, West-Roberts J, Diamond S, Firek BA, Morowitz MJ, and Banfield JF (2022). Using strain-resolved analysis to identify contamination in metagenomics data. bioRxiv, 2022.01.16.476537. 10.1101/2022.01.16.476537. [DOI] [PMC free article] [PubMed]
- 62.Hauser C, Wuethrich B, Matter L, Wilhelm JA, Sonnabend W, and Schopfer K (1985). Staphylococcus aureus Skin Colonization in Atopic Dermatitis Patients. Dermatology 170, 35–39. 10.1159/000249493. [DOI] [PubMed] [Google Scholar]
- 63.Hanifin JM (1980). Diagnostic features of atopic dermatitis. Acta Derm. Venereol 92, 44–47. [Google Scholar]
- 64.Baym M, Kryazhimskiy S, Lieberman TD, Chung H, Desai MM, and Kishony R (2015). Inexpensive multiplexed library preparation for megabase-sized genomes. PLoS One 10, e0128036. 10.1371/journal.pone.0128036. [DOI] [PMC free article] [PubMed] [Google Scholar]
- 65.Martin M (2011). Cutadapt removes adapter sequences from high-throughput sequencing reads. EMBnet. journal 17, 10–12. [Google Scholar]
- 66.Joshi NA, and Fass JN (2011). Sickle: a sliding-window, adaptive, quality-based trimming tool for FastQ files
- 67.Li H, and Durbin R (2009). Fast and accurate short read alignment with Burrows–Wheeler transform. Bioinformatics 25, 1754–1760. 10.1093/bioinformatics/btp324. [DOI] [PMC free article] [PubMed] [Google Scholar]
- 68.Molder F, Jablonski KP, Letcher B, Hall MB, Tomkins-Tinch CH, Sochat V, Forster J, Lee S, Twardziok SO, Kanitz A, et al. (2021). Sustainable data analysis with Snakemake [version 1; peer review: 1 approved, 1 approved with reservations]. F1000Res 10. 10.12688/f1000research.29032.1. [DOI] [PMC free article] [PubMed] [Google Scholar]
- 69.Stamatakis A (2014). RAxML version 8: a tool for phylogenetic analysis and post-analysis of large phylogenies. Bioinformatics 30, 1312–1313. 10.1093/bioinformatics/btu033. [DOI] [PMC free article] [PubMed] [Google Scholar]
- 70.Letunic I, and Bork P (2021). Interactive Tree Of Life (iTOL) v5: an online tool for phylogenetic tree display and annotation. Nucleic Acids Res 49, W293–W296. [DOI] [PMC free article] [PubMed] [Google Scholar]
- 71.Inouye M, Dashnow H, Raven L-A, Schultz MB, Pope BJ, Tomita T, Zobel J, and Holt KE (2014). SRST2: Rapid genomic surveillance for public health and hospital microbiology labs. Genome Med 6, 90. 10.1186/s13073-014-0090-6. [DOI] [PMC free article] [PubMed] [Google Scholar]
- 72.Jolley KA, Bray JE, and Maiden MCJ (2018). Open-access bacterial population genomics: BIGSdb software, the PubMLST.org website and their applications. Wellcome Open Res 3, 124. 10.12688/wellcomeopenres.14826.1. [DOI] [PMC free article] [PubMed] [Google Scholar]
- 73.Singh M, Sasaki T, Matsuo M, Morimoto Y, Aiba Y, and Hiramatsu K (2015). Complete genome sequence of the drug-naive classical Staphylococcus aureus strain FDA209P. Genome Announc 3, e01343–15. [DOI] [PMC free article] [PubMed] [Google Scholar]
- 74.Wood DE, Lu J, and Langmead B (2019). Improved metagenomic analysis with Kraken 2. Genome Biol 20, 1–13. [DOI] [PMC free article] [PubMed] [Google Scholar]
- 75.Bankevich A, Nurk S, Antipov D, Gurevich AA, Dvorkin M, Kulikov AS, Lesin VM, Nikolenko SI, Pham S, Prjibelski AD, et al. (2012). SPAdes: a new genome assembly algorithm and its applications to single-cell sequencing. J. Comput. Biol 19, 455–477. 10.1089/cmb.2012.0021. [DOI] [PMC free article] [PubMed] [Google Scholar]
- 76.Seemann T (2014). Prokka: rapid prokaryotic genome annotation. Bioinformatics 30, 2068–2069. 10.1093/bioinformatics/btu153. [DOI] [PubMed] [Google Scholar]
- 77.Langmead B, and Salzberg SL (2012). Fast gapped-read alignment with Bowtie 2. Nat. Methods 9, 357. [DOI] [PMC free article] [PubMed] [Google Scholar]
- 78.Felsenstein J (1993). PHYLIP (phylogeny inference package), version 3.5 c (Joseph Felsenstein.)
- 79.Sagulenko P, Puller V, and Neher RA (2018). TreeTime: Maximum-likelihood phylodynamic analysis. Virus Evolution 4, vex042. 10.1093/ve/vex042. [DOI] [PMC free article] [PubMed] [Google Scholar]
- 80.Virtanen P, Gommers R, Oliphant TE, Haberland M, Reddy T, Cournapeau D, Burovski E, Peterson P, Weckesser W, Bright J, et al. (2020). SciPy 1.0: fundamental algorithms for scientific computing in Python. Nat. Methods 17, 261–272. 10.1038/s41592-019-0686-2. [DOI] [PMC free article] [PubMed] [Google Scholar]
- 81.Pritchard JK, Pickrell JK, and Coop G (2010). The Genetics of Human Adaptation: Hard Sweeps, Soft Sweeps, and Polygenic Adaptation. Curr. Biol 20, R208–R215. 10.1016/j.cub.2009.11.055. [DOI] [PMC free article] [PubMed] [Google Scholar]
- 82.Garud NR, Good BH, Hallatschek O, and Pollard KS (2019). Evolutionary dynamics of bacteria in the gut microbiome within and across hosts. PLoS Biol 17, e3000102. [DOI] [PMC free article] [PubMed] [Google Scholar]
- 83.Lang GI, Botstein D, and Desai MM (2011). Genetic variation and the fate of beneficial mutations in asexual populations. Genetics 188, 647–661. [DOI] [PMC free article] [PubMed] [Google Scholar]
- 84.Conwill A, Kuan AC, Damerla R, Poret AJ, Baker JS, Tripp AD, Alm EJ, and Lieberman TD (2022). Anatomy promotes neutral coexistence of strains in the human skin microbiome. Cell Host Microbe 30, 171–182.e7. 10.1016/j.chom.2021.12.007. [DOI] [PMC free article] [PubMed] [Google Scholar]
- 85.Fu L, Niu B, Zhu Z, Wu S, and Li W (2012). CD-HIT: accelerated for clustering the next-generation sequencing data. Bioinformatics 28, 3150–3152. [DOI] [PMC free article] [PubMed] [Google Scholar]
- 86.Noble R (2019). ggmuller: Create muller plots of evolutionary dynamics
- 87.Lee JC, Liu MJ, Parsonnet J, and Arbeit RD (1990). Expression of type 8 capsular polysaccharide and production of toxic shock syndrome toxin 1 are associated among vaginal isolates of Staphylococcus aureus. J. Clin. Microbiol 28, 2612. [DOI] [PMC free article] [PubMed] [Google Scholar]
- 88.. Madden T (2013). The BLAST sequence analysis tool. In The NCBI Handbook [Internet] 2nd edition (National Center for Biotechnology Information (US)). [Google Scholar]
- 89.Jarraud S, Lyon GJ, Figueiredo AM, Lina G, Vandenesch F, Etienne J, Muir TW, and Novick RP (2000). Exfoliatin-producing strains define a fourth agr specificity group in Staphylococcus aureus. J. Bacteriol 182, 6517–6522. 10.1128/jb.182.22.6517-6522.2000. [DOI] [PMC free article] [PubMed] [Google Scholar]
- 90.Key FM, Khadka VD, Romo-González C, Blake KJ, Deng L, Lynn TC, Lee JC, Chiu IM, García-Romero MT, and Lieberman TD (2021). On-person adaptive evolution of Staphylococcus aureus during atopic dermatitis increases disease severity. bioRxiv, 2021.03.24.436824. 10.1101/2021.03.24.436824. [DOI] [PMC free article] [PubMed]
- 91.Tollersrud T, Kenny K, Reitz AJ Jr & Lee JC Genetic and serologic evaluation of capsule production by bovine mammary isolates of Staphylococcus aureus and other Staphylococcus spp. from Europe and the United States. J. Clin. Microbiol 38, 2998–3003 (2000). [DOI] [PMC free article] [PubMed] [Google Scholar]
- 92.Mölder F et al. Sustainable data analysis with Snakemake. F1000Res 10, 33 (2021). [DOI] [PMC free article] [PubMed] [Google Scholar]
- 93.Martin M Cutadapt removes adapter sequences from high-throughput sequencing reads. EMBnet. journal 17, 10–12 (2011). [Google Scholar]
- 94.Joshi NA & Fass JN Sickle: a sliding-window, adaptive, quality-based trimming tool for FastQ files (2011).
- 95.Langmead B & Salzberg SL Fast gapped-read alignment with Bowtie 2. Nat. Methods 9, 357 (2012). [DOI] [PMC free article] [PubMed] [Google Scholar]
- 96.Danecek P et al. Twelve years of SAMtools and BCFtools. Gigascience 10, (2021). [DOI] [PMC free article] [PubMed] [Google Scholar]
- 97.Wood DE, Lu J & Langmead B Improved metagenomic analysis with Kraken 2. Genome Biol 20, 1–13 (2019). [DOI] [PMC free article] [PubMed] [Google Scholar]
- 98.Felsenstein J PHYLIP (phylogeny inference package), version 3.5 c (Joseph Felsenstein., 1993).
- 99.Bankevich A et al. SPAdes: a new genome assembly algorithm and its applications to single-cell sequencing. J. Comput. Biol 19, 455–477 (2012). [DOI] [PMC free article] [PubMed] [Google Scholar]
- 100.Seemann T Prokka: rapid prokaryotic genome annotation. Bioinformatics 30, 2068–2069 (2014). [DOI] [PubMed] [Google Scholar]
- 101.Fu L, Niu B, Zhu Z, Wu S & Li W CD-HIT: accelerated for clustering the next-generation sequencing data. Bioinformatics 28, 3150–3152 (2012). [DOI] [PMC free article] [PubMed] [Google Scholar]
- 102.Sagulenko P, Puller V & Neher RA TreeTime: Maximum-likelihood phylodynamic analysis. Virus Evolution 4, vex042 (2018). [DOI] [PMC free article] [PubMed] [Google Scholar]
- 103.Inouye M et al. SRST2: Rapid genomic surveillance for public health and hospital microbiology labs. Genome Med 6, 90 (2014). [DOI] [PMC free article] [PubMed] [Google Scholar]
- 104.Collins C & Didelot X A phylogenetic method to perform genome-wide association studies in microbes that accounts for population structure and recombination. PLoS Comput. Biol 14, e1005958 (2018). [DOI] [PMC free article] [PubMed] [Google Scholar]
- 105.Edslev SM, Clausen M-L, Agner T, Stegger M & Andersen PS Genomic analysis reveals different mechanisms of fusidic acid resistance in Staphylococcus aureus from Danish atopic dermatitis patients. J. Antimicrob. Chemother 73, 856–861 (2018). [DOI] [PMC free article] [PubMed] [Google Scholar]
- 106.Young BC et al. Severe infections emerge from commensal bacteria by adaptive evolution. Elife 6, e30637 (2017). [DOI] [PMC free article] [PubMed] [Google Scholar]
- 107.Harkins CP et al. The Microevolution and Epidemiology of Staphylococcus aureus Colonization during Atopic Eczema Disease Flare. J. Invest. Dermatol 138, 336–343 (2018). [DOI] [PMC free article] [PubMed] [Google Scholar]
- 108.Harkins CP et al. The widespread use of topical antimicrobials enriches for resistance in Staphylococcus aureus isolated from patients with atopic dermatitis. Br. J. Dermatol 179, 951–958 (2018). [DOI] [PMC free article] [PubMed] [Google Scholar]
Associated Data
This section collects any data citations, data availability statements, or supplementary materials included in this article.
Supplementary Materials
Table S2. Location and count of isolates from major and minor lineage recovered from patients with multiple lineages, related to Figure 1.
Table S3. Capsule typing with an in vitro immunoblot assay for single isolates and reference strains, related to Figure 3.
Table S4. Identified genes with candidate signatures of adaptive evolution across subjects, related to Figure 3.
Table S5. Gene content annotated in identified mobile genetic elements variable across isolates within a patient, related to STAR Methods.
Table S6. Summary for each lineage-specific assembly and annotation, related to Figure 3 and STAR Methods.
Table S7. All identified SNVs detected within major lineages, related to Figure 3.
Table S8. Reference nucleotide sequences and source used for searching S. aureus assemblies for capsule-associated genes, related to Figure 3 and 4.
Table S9. Inferred capsule, agr type and gene status for publicly available isolates used in meta-analysis, related to Figure 4.
Table S10. Metadata of all isolate genomes included in the across and within-patient analyses, related to STAR Methods.
Table S11. Genome-wide association of gene presence absence between publicly S. aureus isolates from Atopic Dermatitis patients versus healthy controls, related to STAR Methods.
Data Availability Statement
Whole-genome sequence data have been deposited at SRA and are publicly available as of the date of publication. Accession numbers are listed in the key resources table. Metadata of each isolate including SRR identifier is available in Table S10.
All original code has been deposited at github and is publicly available as of the date of publication. DOI is listed in the key resources table.
Any additional information required to reanalyze the data reported in this work paper is available from the Lead Contact upon request.
Key resources table
| REAGENT or RESOURCE | SOURCE | IDENTIFIER |
|---|---|---|
| Antibodies | ||
| Capsule type-specific rabbit polyclonal antisera | Tollersrud et al.1 | N/A |
| Bacterial and virus strains | ||
| S. aureus isolates | This paper | N/A |
| Biological samples | ||
| Skin samples from children with atopic dermatitis | This paper | N/A |
| Chemicals, peptides, and recombinant proteins | ||
| Blood agar | BBL™ Blood Agar Base (Infusion Agar) | 90000–048 |
| PCRClean-DX SPRI beads | Aline Biosciences | C-1003–250 |
| Polyethylene glycol (PEG) 8000 | Hampton Research | HR2–535 |
| ReadyLyse Lysozyme Solution | EpiCentre | R1810M |
| KAPA HiFi HotStart ReadyMix | Roche | 7958927001 |
| Tryptic soy agar plates | Hardy Diagnostics | A10 |
| Nitrocellulose BA85 filters | Whatman, Inc. | Cat#09301102 |
| Trypsin, bovine pancreas | Fisher Scientific | Cat#AAJ6368803 |
| Skim milk | BD BBL™/Difco™ |
Cat#DF0032173 |
| Tween 20 | Millipore Sigma | Cat#P1379 |
| KPL 1-Component TMB Membrane Peroxidase Substrate | ThermoFisher Scientific | Cat#002019 |
| Fusidic acid | Sigma-Aldrich | CAS: 6990–06-3 |
| ChromAgar Colorex S. aureus | DRG international inc | Cat # TA672 |
| Critical commercial assays | ||
| Wizard Genomic DNA purification kit | Promega | A1120 |
| Illumina Tagment DNA TDE1 Enzyme and Buffer Kits | Illumina | 20034198 |
| PlexWell library prep system | seqWell | plexWell 384 |
| Puritan™ Opti- Tranz™ Liquid Amies Media Transport Tube with Rayon Tip Swab, Polysterne Handle | Puritan | LA-61PR |
| Puritan™ Opti- Tranz™ Liquid Amies Media Transport Tube with Miniature Rayon Tip Swab, Aluminum Handle | Puritan | LA61SAR |
| Experimental models: Organisms/strains | ||
| C57BL/6 female mice | Jackson Laboratories | Strain #:000664 |
| Deposited data | ||
| Raw sequencing data | This paper | Genbank: PRJNA715375, PRJNA715649, PRJNA816913 |
| Software and algorithms | ||
| All original code | This paper | https://github.com/keyfm/aureus_ad |
| Python (v3.7.3) | N/A | https://www.python.org/ |
| Snakemake (v5.4.2) | Mölder et al.2 | https://snakemake.github.io/ |
| Matlab (v2015b, v2018a) | Mathworks | https://www.mathworks.com/products/matlab.html |
| Cutadapt (v1.18) | Martin3 | https://cutadapt.readthedocs.io/en/stable/ |
| Sickle (v1.33) | Joshi & Fass4 | https://github.com/najoshi/sickle |
| Bowtie 2 (v2.2.6) | Langmead & Salzburg5 | http://bowtie-bio.sourceforge.net/bowtie2/index.shtml |
| SAMtools (v1.5) and BCFtools (v1.2) | Danecek et al.6 | https://github.com/samtools/ |
| Kraken 2 (v2.0.8) | Wood et al.7 | https://github.com/DerrickWood/kraken2 |
| BLAST (v2.7.1) | NCBI | https://blast.ncbi.nlm.nih.gov/Blast.cgi |
| PHYLIP (v3.69) | Felsenstein8 | https://evolution.genetics.washington.edu/phylip.html |
| FigTree (v1.4.4) | N/A | https://github.com/rambaut/figtree |
| SPAdes (v3.13) | Bankevich et al.9 | https://github.com/ablab/spades |
| Prokka (v4.8.1) | Seeman10 | https://github.com/tseemann/prokka |
| CD-HIT (v4.8) | Fu et al.11 | http://weizhong-lab.ucsd.edu/cd-hit/ |
| treeTime | Sagulenko et al.12 | http://https//github.com/neherlab/treetime |
| lolipop | N/A | https://github.com/cdeitrick/Lolipop |
| ggmueller | N/A | https://cran.r-project.org/package=ggmuller |
| growthrater | N/A | https://github.com/vedomics/growthrateR |
| SRST2 | Inouye et al.13 | https://github.com/katholt/srst2 |
| MLST | N/A | https://github.com/tseemann/mlst |
| treeWAS | Collins & Didelot 14 | https://github.com/caitiecollins/treeWAS |
| Other | ||
| Public S. aureus annotations used in annotation of assemblies | NCBI Genbank | NC_002745, NC_003140, NC_002758, NC_002774, NC_009641, NC_003923, NC_002952, NC_002953, NC_005951, NC_002951, NC_006629, NC_007795, NC_007793, NC_007790, NC_007791, NC_007792 |
| 276 public S. aureus genomes analyzed |
Edslev et al., Young et al., Harkins et al., Harkins et al. 15–18 | See Table S10 |
| Tegaderm (bio-occlusive film) | 3M | 1624W |