Abstract
Background and Objectives
To investigate the potential of plasma neurofilament light (pNfL) as a biomarker of disease progression and treatment response in progressive multiple sclerosis (PMS) with and without acute disease activity.
Methods
A post hoc blinded analysis of pNfL levels in 2 placebo-controlled, phase 3 studies in secondary progressive multiple sclerosis (SPMS; EXPAND) and primary progressive multiple sclerosis (PPMS; INFORMS) using siponimod and fingolimod, respectively, as active compounds was performed. pNfL levels were quantified using a single molecule array (Homebrew Simoa) immunoassay from stored ethylenediaminetetraacetic acid (EDTA) plasma samples of all patients who consented for exploratory biomarker analysis in either study; pNfL levels were divided into high (≥30 pg/mL) and low (<30 pg/mL) at baseline. We investigated the association of pNfL levels with disability progression, cognitive decline, and brain atrophy and their sensitivity to indicate treatment response through clinical measures.
Results
We analyzed pNfL in 4,185 samples from 1,452 patients with SPMS and 1,172 samples from 378 patients with PPMS. Baseline pNfL levels were higher in SPMS (geomean 32.1 pg/mL) than in PPMS (22.0 pg/mL; p < 0.0001). In both studies, higher baseline pNfL levels were associated with older age, higher Expanded Disability Status Scale score, more Gd+ lesions, and higher T2 lesion load (all p < 0.05). Independent of treatment, high vs low baseline pNfL levels were associated with significantly higher risks of confirmed 3-month (SPMS [32%], hazard ratio [95% CI] 1.32 [1.09–1.61]; PPMS [49%], 1.49 [1.05–2.12]) and 6-month disability progression (SPMS [26%], 1.26 [1.01–1.57]; PPMS [48%], 1.48 [1.01–2.17]), earlier wheelchair dependence (SPMS [50%], 1.50 [0.96–2.34]; PPMS [197%], 2.97 [1.44–6.10]), cognitive decline (SPMS [41%], 1.41 [1.09–1.84]), and higher rates of brain atrophy (mean change at month 24: SPMS, −0.92; PPMS, −1.39). Baseline pNfL levels were associated with future disability progression and the degree of brain atrophy regardless of presence or absence of acute disease activity (gadolinium-enhancing lesions or recent occurrence of relapses before baseline). pNfL levels were lower in patients treated with siponimod or fingolimod vs placebo-treated patients and higher in those having experienced disability progression.
Discussion
pNfL was associated with future clinical and radiologic disability progression features at the group level. pNfL was reduced by treatment and may be a meaningful outcome measure in PMS studies.
Trial Registration Information
EXPAND (ClinicalTrials.gov identifier: NCT01665144) and INFORMS (ClinicalTrials.gov identifier: NCT00731692).
Multiple sclerosis (MS)—a chronic autoimmune disease of the CNS—is characterized by demyelination and neuronal loss, eventually leading to sustained disability.1,2 The extent of neuroaxonal injury is reflected by the amount of neurofilament light (NfL) released into CSF and blood.3,4 In relapsing MS, blood NfL has emerged as a biomarker of acute disease activity, long-term clinical outcomes, and treatment response.3-11
Most patients with relapsing-remitting MS may eventually transition to secondary progressive MS (SPMS), where disability develops largely independent of overt acute inflammatory activity (i.e. relapses and new lesion formation).12 Primary progressive MS (PPMS) is characterized by continuous disability worsening from disease onset in absence of attacks.2 The insensitivity of clinical outcome measures and the lack of end points to specifically measure features of progression are a serious impediment for the development of treatments for progressive MS (PMS).13
Although sensitivity and specificity of clinical and MRI metrics for assessment of disease outcomes in relapsing MS (RMS) have improved,14 there is an unmet need for a prognostic marker that anticipates the degree of disability progression better than current clinical and MRI measures. NfL as a specific measure of neuroaxonal injury in the entire nervous system may be a candidate biomarker to quantify progression at all stages of MS and may even serve as a future surrogate end point in clinical trials.15
Here we analyzed plasma NfL (pNfL) data from 2 large phase 3 clinical studies in PMS (EXPAND for SPMS16 and INFORMS for PPMS17) to assess (1) the relationship of patient demographics and MS disease characteristics with pNfL concentrations at baseline; (2) the treatment effect of 2 oral disease-modifying therapies (DMTs) (i.e. siponimod and fingolimod) on pNfL; (3) the prognostic potential of pNfL in determining clinical (disability progression, time to wheelchair dependence, cognitive impairment) and MRI outcomes (brain atrophy); and (4) on-study measures predicting pNfL levels at the end of study (EOS). We have used these results to provide a reference for the sample size calculation of future proof-of-concept studies in PMS.
Methods
Standard Protocol Approvals, Registrations, and Patient Consents
The study protocols (EXPAND and INFORMS) were approved by institutional review boards or ethics committees at all sites and were in accordance with the Declaration of Helsinki and with the International Conference on Harmonization Guidelines for Good Clinical Practice. Informed consent was obtained before individual enrollment into the studies.
Study Design and Patient Populations
In this post hoc biomarker analysis, we measured pNfL levels in all available ethylenediaminetetraacetic acid (EDTA) plasma samples of patients participating in the 2-year, double-blind, placebo-controlled, phase 3 EXPAND trial16 of siponimod in SPMS and in patients participating in the 3-year, placebo-controlled, phase 3 INFORMS trial17 of fingolimod in PPMS.
Details of study designs of EXPAND and INFORMS trials have been described.16,17 Briefly, EXPAND trial patients were age 18–60 years, with a diagnosis of SPMS, Expanded Disability Status Scale (EDSS) scores of 3–6.5, a documented EDSS progression within 2 years, and no relapse within 3 months before randomization. INFORMS enrolled patients 25–65 years of age, with PPMS diagnosis, EDSS scores of 3.5–6, and a documented EDSS progression within 1 year before the study. pNfL assessments were performed at baseline and end of treatment (EOT)/EOS visit (which could occur at any time due to an event-driven design) of the double-blind phase in EXPAND and at baseline and months 12, 24, and 36 in INFORMS. In EXPAND, pNfL data at months 3, 12, 24, and 36 were derived from remapping of pNfL data collected at EOT/EOS using visit windows shown in eTable 1 (links.lww.com/WNL/B920).
Study Assessments
The prognostic value of pNfL was assessed separately for the following outcomes: time to 3-month and 6-month confirmed disability progression (CDP), time to wheelchair (EDSS ≥7), time to 6-month confirmed 4-point Symbol Digit Modalities Test progression (CDPSDMT), time to 6-month confirmed 20% progression on Paced Auditory Serial Addition Test (CDPPASAT) (the latter 2 only available for EXPAND), and percent brain volume change (PBVC). Treatment effects of siponimod and fingolimod vs placebo on pNfL levels over time (separate comparison with baseline values of patients having month 12, 24, and 36 measurements) were investigated. The outcomes were also analyzed in the subgroups of patients with and without gadolinium-enhancing (Gd+) lesions at baseline and relapses in the 2 years prior to inclusion.
pNfL Measurement
pNfL levels were quantified using a single molecule array (Homebrew Simoa) immunoassay from stored EDTA plasma samples of all patients who consented for exploratory biomarker analysis in either study; the assay is described in detail elsewhere.3 All laboratory personnel remained blinded to treatment allocation and had no access to clinical data.
Statistical Analysis
pNfL Assessments
pNfL analyses were performed in all patients from whom ≥1 plasma samples were available (referred from here on as pNfL subset) and were presented as geomean values (geomean denotes the geometric mean). Patients were excluded from regression and repeated measures analyses if their covariate information was missing. The cutoff at 30 pg/mL, which was used to dichotomize baseline pNfL values into the high (≥30 pg/mL) and low (<30 pg/mL) categories, corresponds to the geomean in patients with relapsing MS, as established in a previous study using the same assay protocol.4
Association of pNfL With Demographic and MS Disease Characteristics
The association between baseline disease characteristics and pNfL was assessed by a multiple linear regression of log-transformed baseline pNfL on age, sex, disease duration since first symptoms, EDSS score, normalized brain volume, prior MS treatment (yes/no), presence of Gd+ lesions at baseline (yes/no), T2 lesion volume at baseline, and relapses in the previous 2 years (applicable for the EXPAND study only). Geomean ratios were derived from exponentiated regression coefficients and are presented with their 95% CIs and p values. For pNfL concentrations at EOS, an analogous linear regression analysis was performed in which treatment, 6-month CDP-EDSS, relapses during study, new T2 lesions on study, and log baseline (pNfL) were included as additional explanatory variables.
Treatment Effects on pNfL Over Time
The effect on pNfL levels after treatment with either siponimod or fingolimod vs placebo was analyzed by a mixed model for repeated measures (MMRM)18 with log(pNfL) as outcome and explanatory variables visit, age, sex, treatment, MS disease duration, prior use of MS medication, baseline EDSS, baseline T2 lesion volume, presence of Gd+ T1 lesions at baseline, superimposed relapses in 2 years prior to study (only in EXPAND), baseline log(NfL), and interactions visit × treatment and visit × baseline log(NfL). The interaction term of visit × treatment was included in order to assess whether the effect of treatment varies over time and inclusion of the visit × baseline interaction was used because the influence of the baseline values is assumed to decrease over time. Patient was the random effect in the model and a compound symmetry covariance structure was used. The MMRM uses all available information for all time points and corrects for missing information under the missing-at-random assumption. Patients were excluded from regression and repeated-measures analyses if their covariate information was missing. Estimated geomeans of pNfL by treatment and visit were obtained by exponentiating least square means estimates and are presented as line plots with geomeans and 95% CIs.
Prognostic Value of Baseline pNfL Levels for On-Study Disability Progression, Cognitive Impairment, and Brain Volume Loss
Patients were grouped according to their baseline pNfL levels into 2 categories (high: ≥30 pg/mL; low: <30 pg/mL)3 for 3-month and 6-month CDP, time to wheelchair, 6-month CDPSDMT, and 6-month CDPPASAT and were analyzed using a Cox regression model adjusted for age, treatment, pNfL category, and respective baseline score (EDSS, SDMT, or PASAT, as applicable). PBVC was analyzed using a linear mixed model for repeated measurements adjusted for age, treatment, sex, pNfL category, baseline normalized brain volume, baseline Gd+ T1 lesion number, and baseline T2 lesion volume. The models also included a treatment × pNfL category interaction to analyze whether the pNfL effect varies across treatments and whether the treatment effect depends on pNfL category. Patient was the random effect in the model and an unstructured covariance structure was used.
Sample Size Determination for a Hypothetical Future 1-Year Phase 2 Study in Either SPMS or PPMS Using pNfL as End Point
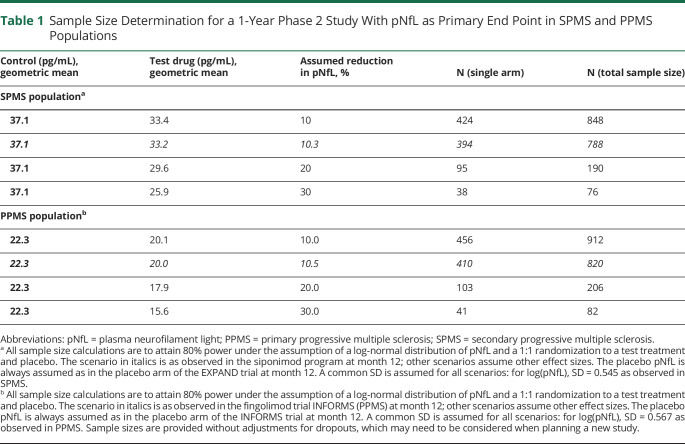
For illustration purposes of the size of a hypothetical 1-year phase II study in SPMS or PPMS, sample size calculations were performed under the assumption of a log-normal distribution of pNfL (Table 1). For the main scenario of this 1-year study, geomeans were assumed as observed in EXPAND or INFORMS at month 12 on active treatment or on placebo. In alternative scenarios, sample size calculations were performed assuming stronger treatment effects (e.g., 20% or 30% reduction in pNfL) relative to placebo than observed in EXPAND or INFORMS.
Table 1.
Sample Size Determination for a 1-Year Phase 2 Study With pNfL as Primary End Point in SPMS and PPMS Populations
Data Availability
Anonymized data that support the findings of this study will be made available to qualified external researchers, with requests reviewed and approved by an independent review panel on the basis of scientific merit.
Results
pNfL and Baseline Characteristics
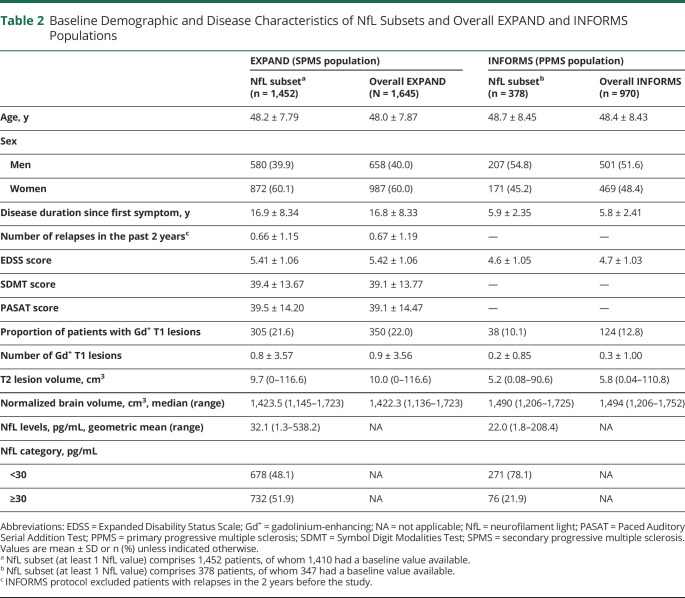
We analyzed 4,185 samples from 1,452 patients with SPMS and 1,172 samples from 378 patients with PPMS. They represented 88% and 39% of patients enrolled overall in respective studies. Baseline demographic and disease characteristics of pNfL subsets from both trials were comparable to the overall population of the respective studies (Table 2). Differences between the patient characteristics in the 2 trials included a longer disease duration, higher levels of disability, more focal acute inflammatory activity, and T2 lesion load in EXPAND vs INFORMS. Baseline pNfL levels were higher in patients with SPMS (geomean 32.1 pg/mL) than in those with PPMS (22.0 pg/mL; p < 0.0001).
Table 2.
Baseline Demographic and Disease Characteristics of NfL Subsets and Overall EXPAND and INFORMS Populations
Relationship Between pNfL Levels and Other Disease Characteristics at Baseline
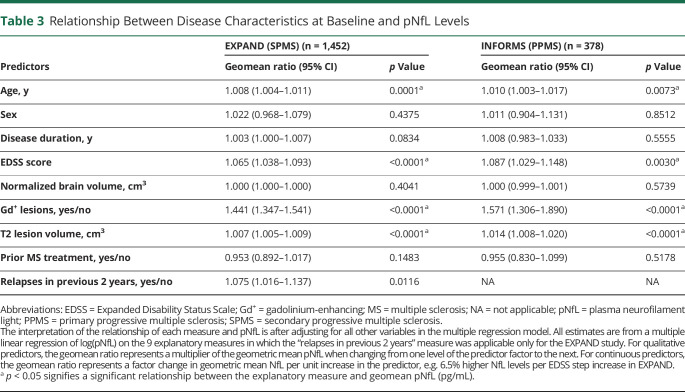
In multiple linear regression models that included 9 explanatory variables, high baseline pNfL levels were strongly and independently associated with high baseline T2 lesion volume (i.e., 0.7% and 1.4% higher pNfL level per cm3 T2 lesion volume in SPMS and PPMS, respectively), presence of Gd+ T1 lesions, higher EDSS, and older age in both SPMS and PPMS, and also with relapses in the previous 2 years in patients with SPMS (Table 3). In both studies, pNfL levels at baseline were not associated with sex, disease duration, normalized brain volume, or prior treatment.
Table 3.
Relationship Between Disease Characteristics at Baseline and pNfL Levels
Baseline pNfL and Future On-Study Disability Progression in PMS
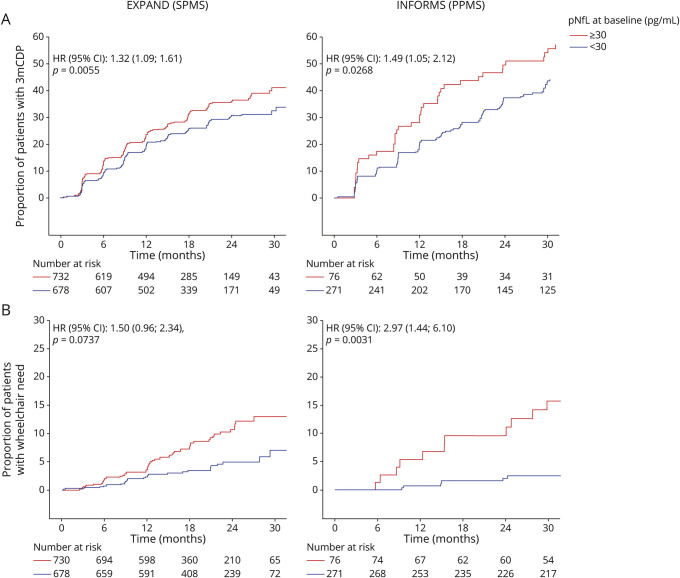
High pNfL levels were associated with increased risk of 3-month CDP by 32% in patients with SPMS and by 49% in patients with PPMS (Figure 1A). These results held true also in patients without Gd+ lesions at baseline in EXPAND (hazard ratio [HR] [95% CI] 1.29 [1.03–1.63]; p = 0.0274) and INFORMS (HR [95% CI]:1.72 [1.17–2.53]; p = 0.0057) and pointed in the same direction in patients without (HR [95% CI] 1.26 [0.98–1.62]; p = 0.0723) and with prior baseline relapses (HR [95% CI] 1.45 [1.05–2.01]; p = 0.0239; eFigure 1, links.lww.com/WNL/B920). When we stratified in EXPAND by treatment group, high baseline pNfL levels in the siponimod group were associated with higher risk of 3-month CDP events (HR [95% CI] 1.32 [1.03–1.69]; p = 0.0312) and the same trend was observed in the placebo group (1.34 [0.97–1.86]; p = 0.0737; eTable 2). Assessment of time to 3-month CDP by using other cutoffs for pNfL (32 or 28 pg/mL) at baseline as a sensitivity analysis yielded similar results as the 30 pg/mL cutoff in both studies (eTable 2).
Figure 1. Kaplan-Meier Plots by Baseline pNfL Categories for 3-Month CDP and Time to Wheelchair Dependence in EXPAND and INFORMS.
Kaplan-Meier plots by baseline plasma neurofilament light (pNfL) categories for (A) 3-month confirmed disability progression (CDP) and (B) time to wheelchair dependence in EXPAND (secondary progressive multiple sclerosis [SPMS]) and INFORMS (primary progressive multiple sclerosis [PPMS]). HR = hazard ratio.
High pNfL levels were associated with a 26% and 48% increased risk for 6-month CDP in SPMS (p = 0.0417) and in PPMS (p = 0.0431), respectively (eFigure 2, A and B, links.lww.com/WNL/B920).
In patients with PPMS, high baseline pNfL increased the risk of wheelchair dependence (EDSS score ≥7) by 197% (p = 0.0031; Figure 1B). In SPMS, patients with high baseline pNfL levels had a risk of wheelchair dependence that was numerically 50% higher than those with low pNfL (p = 0.0737) (Figure 1B). Overall, no significant interaction between treatment and pNfL was observed, suggesting that pNfL was prognostic of disability progression independent of therapy.
Patients with SPMS with high vs low pNfL concentrations had a significantly higher risk of reaching 6-month CDPSDMT (p = 0.0103; eFigure 3A, links.lww.com/WNL/B920). In patients with Gd+ lesions, the risk of 6-month CDPSDMT was increased by 135% in the high vs low pNfL category (p = 0.0289), whereas in patients without Gd+ lesions, the risk was only numerically increased by 34.2% in those with high pNfL levels (p = 0.0613; eFigure 3B). Patients with high pNfL at baseline were numerically at increased risk of 6-month CDPSDMT with and without relapses before baseline, but the difference vs low NfL levels missed significance levels (eFigure 3C). Furthermore, pNfL was not prognostic of cognitive decline, as determined by PASAT scores (eFigure 4).
Baseline pNfL and Future On-Study Brain Volume Loss
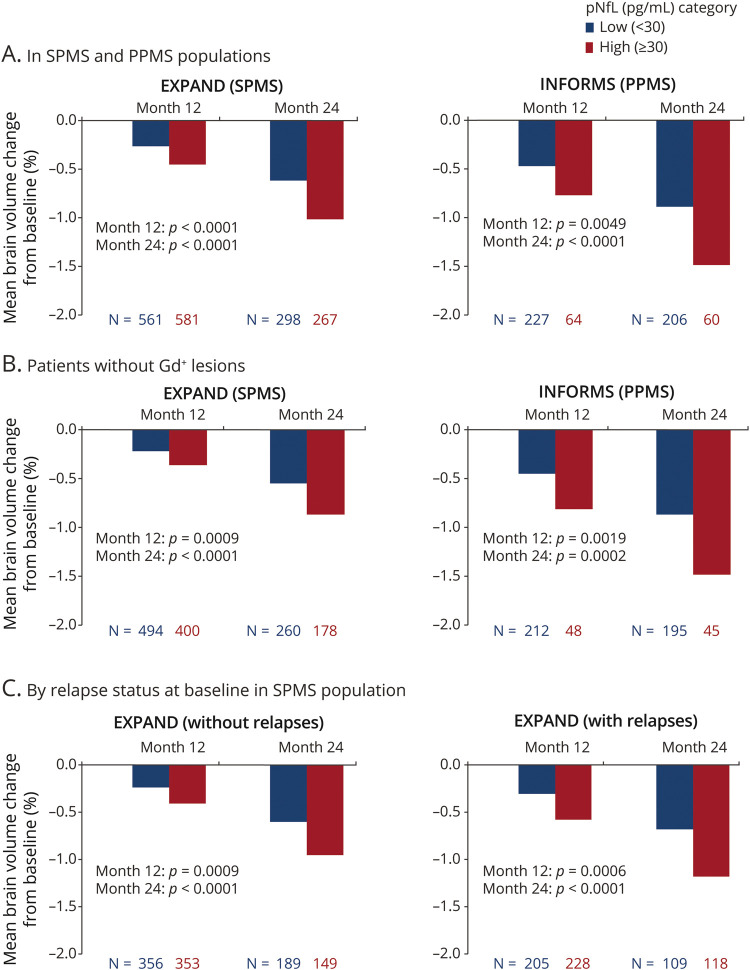
High vs low pNfL baseline levels were associated with higher rates of brain volume loss in both SPMS and PPMS populations at months 12 and 24 (Figure 2A); this association was sustained in patients without Gd+ lesions at baseline in SPMS and PPMS (Figure 2B). Similarly, in patients with SPMS with or without prebaseline relapses, high baseline pNfL levels were associated with more pronounced brain atrophy at months 12 and 24 (Figure 2C).
Figure 2. Percent Brain Volume Change From Baseline by Baseline pNfL in SPMS and PPMS Populations, in Patients Without Gd+ Lesions, and by Relapse Status at Baseline in the SPMS Population.
Percent brain volume change from baseline by baseline plasma neurofilament light (pNfL) (A) in secondary progressive multiple sclerosis (SPMS) and primary progressive multiple sclerosis (PPMS) populations, (B) in patients without gadolinium-enhancing (Gd+) lesions, and (C) by relapse status at baseline in the SPMS population. As per the INFORMS protocol, patients with relapses in the past 2 years prior to study start were excluded.
Longitudinal pNfL Levels Under Treatment and Association Between Baseline and EOS Levels of NfL and Clinical Baseline and On-Study/EOS Measures With pNfL
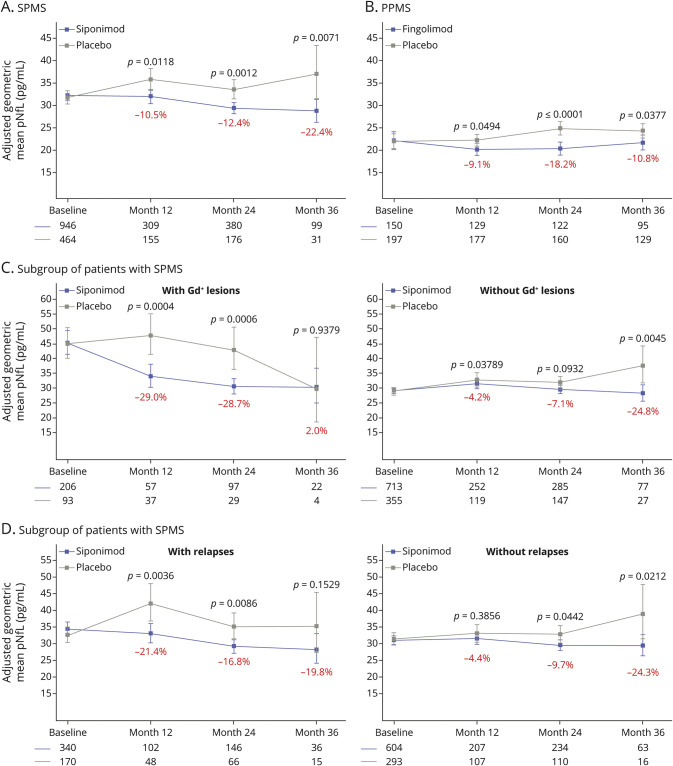
Siponimod and fingolimod reduced pNfL levels significantly vs placebo at months 12, 24, and 36 in SPMS and PPMS (Figure 3, A and B). In the EXPAND subgroup involving patients without Gd+ lesions or prior relapses at baseline, the effect on pNfL of treatment with siponimod vs placebo was smaller than in patients with disease activity (Figure 3, C and D).
Figure 3. Treatment Effects of Siponimod and Fingolimod on pNfL Levels Over Time in EXPAND (SPMS), INFORMS (PPMS), and Subgroups of Patients With SPMS With or Without Gd+ Lesions and With or Without Relapses.
Treatment effects of siponimod and fingolimod on plasma neurofilament light (pNfL) levels over time in (A) EXPAND (secondary progressive multiple sclerosis [SPMS]), (B) INFORMS (primary progressive multiple sclerosis [PPMS]), (C) a subgroup of patients with SPMS with or without gadolinium-enhancing (Gd+) lesions, and (D) a subgroup of patients with SPMS with or without relapses. In EXPAND, pNfL data at months 12, 24, and 36 were derived from remapping of pNfL data collected at end of treatment/end of study using visit windows (eTable 1, links.lww.com/WNL/B920). The adjusted geometric means and 95 CIs are based on repeated-measurements models for normally distributed data. The model includes the explanatory variables visit, treatment, sex, age, multiple sclerosis (MS) disease duration, prior use of MS medication, baseline Expanded Disability Status Scale score, baseline T2 lesion volume, presence of Gd+ T1 lesions at baseline, superimposed relapses in 2 years prior to study (only applies to SPMS population), baseline log(NfL), and interactions visit × treatment and visit × baseline log(NfL). The percentages represent the relative difference of the siponimod effect compared with the placebo effect.
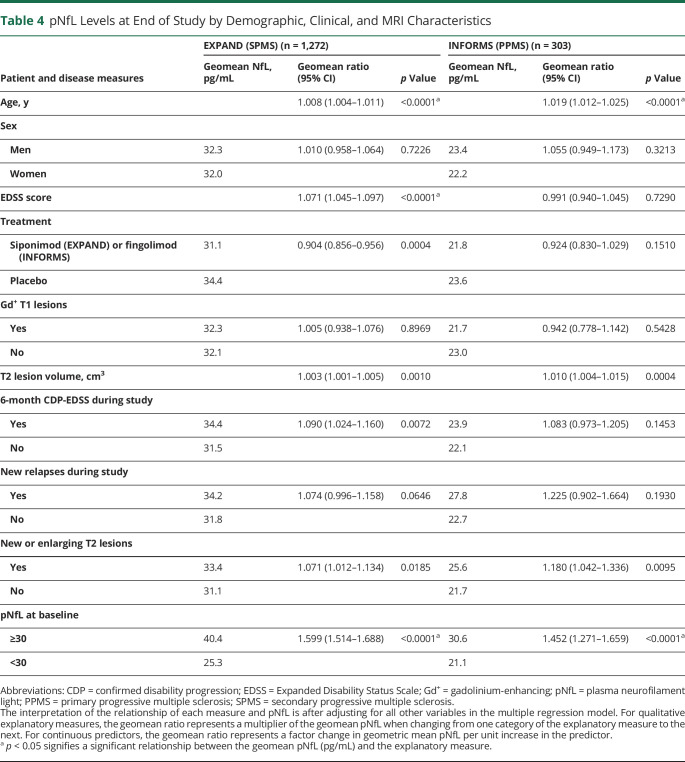
High pNfL at baseline and older age were the strongest prognostic factors of high pNfL at EOS in both populations (Table 4). This was also the case for high T2 lesion volume at baseline, as well as occurrence of new or enlarging T2 lesions during the studies. Patients with a 6-month CDP event during the EXPAND study had a 9% higher pNfL level at EOS, independent of clinical or MRI activity during the trial. A similar estimated increase (8.3%) of pNfL was found in INFORMS, which was not statistically significant (Table 4).
Table 4.
pNfL Levels at End of Study by Demographic, Clinical, and MRI Characteristics
Sample Size Estimation for Future Proof of Concept Studies With pNfL as an End Point
Using the observed effect size of 10.5% reduction of pNfL levels under active treatment vs placebo in EXPAND (Figure 3A), a sample size of 788 patients with SPMS (394 per arm) would be required to demonstrate superiority of test drug with 80% power in a 12-month trial (Table 1); with an effect size of 20% or 30% vs placebo on pNfL levels, the sample size would drop to 190 patients with SPMS (95 per arm) and 76 patients with SPMS (38 per arm) under otherwise the same assumptions.
Similarly, using the observed effect size of 9.1% reduction of pNfL levels under active treatment vs placebo in INFORMS (Figure 3B), a sample size of 912 patients with PPMS (456 per arm) would be required to demonstrate superiority of test drug with 80% power in a 12-month trial (Table 1); with an effect size of 20% or 30% vs placebo on pNfL levels, the sample size would drop to 206 patients (103 per arm) and 82 patients (41 per arm) under otherwise the same assumptions.
Discussion
The current results from 2 large clinical trials in PMS demonstrate that baseline pNfL levels are associated with future disability progression, cognitive decline, and brain volume loss in a setting with little or no signs of acute disease activity at the group level. We provide evidence that disability progression independently, as demonstrated by the multivariable model for EOS pNfL (Table 4), is reflected by increased pNfL levels. Our results corroborate earlier findings in a real-world cohort of RRMS and PMS where baseline pNfL independently predicted brain and spinal cord atrophy over 5 years and patients with higher baseline pNfL levels had a greater likelihood of EDSS increase in subsequent years.5 Serum NfL levels were associated with long-term (up to 10 years) brain atrophy, further supporting its value as a potential biomarker for disease severity stratification and to help guide treatment decisions.19,20 Two other studies reported association of serum or pNfL levels with current and future disability scores and with transition from RRMS to SPMS.21,22 This is further supported by findings from a longitudinal follow-up of a large population-based cohort of patients with MS with diverse clinical characteristics that reported association of elevated pNfL levels with a higher risk of transitioning to the progressive MS phase in relapsing-onset patients.23 A recent study investigating a comparably smaller cohort of patients with RRMS on natalizumab gave rise to the hypothesis that serum NfL may not be associated with disability progression in patients under anti-inflammatory therapy.24,25 Our appropriately powered subgroup analyses in EXPAND, however, revealed that pNfL was associated with future disability progression irrespective of anti-inflammatory treatment.
The homebrew assay used in this study yields values that are approximately 2-fold higher than those obtained with the now more commonly used commercial assay but are highly correlated (R2 = 0.99, unpublished data) to the NfL assay values.
The novel aspect of these results is that in PMS apparently without disease activity26 (no Gd+ lesions, no relapses), baseline pNfL levels were associated with on-study disability progression and brain volume loss. This supports the concept that in PMS, pNfL is sensitive enough to reflect subclinical neuronal damage that develops outside of acute disease activity. Standard imaging workup of brain does not capture this part of MS pathology. Furthermore, it neglects pathologic changes in spinal cord, which are regarded as a major driver of disability progression in progressive disease.16,27-29 In addition, pNfL levels reflect neuronal pathology of the entire nervous system, and hence may be most suitable to close a critical gap in clinical monitoring.
Cognitive impairment is a symptom of PMS highly relevant for quality of life, affecting up to 60% of patients with SPMS, where it is more prevalent than in PPMS.30-32 Our results demonstrate that high baseline pNfL levels in patients with SPMS were associated with an increased risk of cognitive disease progression, as measured by SDMT. We did not see an effect on the PASAT, possibly due to higher variability and lower number of progression events on the PASAT as compared with SDMT leading to higher variance and lower power.
Regarding the value of pNfL as a treatment response marker in PMS, the results in the 2 studies provide evidence that pNfL seems to be a more sensitive marker than conventional clinical measures. The degree of pNfL lowering in the course of therapy was in line with the primary and most of the secondary outcomes of EXPAND.16 The fact that pNfL was less reflective of a treatment effect in patients with nonactive vs active SPMS may be explained by siponimod being more effective in patients with SPMS with active than nonactive disease. In contrast, INFORMS17 did not meet its primary end point (reduction of CDP) or most of the secondary outcomes, despite pNfL measurements showing a significant effect in favor of fingolimod by approximately 9%–18% over placebo. One possible explanation for these findings is that NfL is a real-time marker of ongoing neuroaxonal loss, while it may take several years before neuroaxonal injury translates into measurable clinical outcomes, hence before treatment effects become apparent in terms of disability progression. Similarly, in the phase 3 ASCEND study (natalizumab vs placebo in SPMS), a treatment effect of natalizumab was seen on pNfL,33 but not on the study's primary end point (proportion of patients reaching a composite disability end point of EDSS or Timed 25-Foot Walk Test or 9-Hole Peg Test).34 These results suggest that in order to be successful in showing a meaningful effect on clinical end points in progressive MS within a typical 24-month study period, a new drug may need to show stronger effects (e.g., 20%–30%) on pNfL than those seen in the INFORMS and ASCEND trials, as proposed in our sample size calculation. In this same context, another added value of NfL could be to identify a subgroup of patients who show a relevant reduction in NfL levels under a given treatment and explore further whether this subgroup responds clinically with longer follow-up.
In order to compare the pNfL data for SPMS and PPMS and present them side by side, the EOS/EOT assessments from the EXPAND study were remapped to month 12, 24, and 36 visits. Hence, for patients who discontinued for reasons related to treatment, some bias cannot be excluded as the remapped EOT NfL values may have been higher compared with a hypothetical scheduled month 12, 24, and 36 visit measurement had this been collected. This limitation does not apply to the INFORMS data.
In both studies, the patients studied had typical characteristics of SPMS and PPMS, respectively. Although samples were only available for about 39% of all study participants from INFORMS and 88% from EXPAND, the comparison of baseline characteristics of those included in this analysis and the respective intention to treat population do not suggest any relevant selection bias.
The early clinical development of therapies for PMS could benefit from sensitive and dynamic phase 2 end point measures that are better associated with the clinical outcomes of interest than currently established clinical and MRI tools. Based on the observation of a prognostic effect of pNfL for brain volume change and disability outcomes in our study, and given that treatment effects on pNfL can be shown by relatively smaller samples sizes, if anticipated treatment effects are larger, pNfL could be a plausible and feasible biomarker in progressive MS. Moreover, pNfL measurements are minimally invasive and relatively inexpensive.
The results of this study support the potential value of pNfL levels as a meaningful biomarker in PMS as it (1) is associated with disability levels and subclinical disease burden cross-sectionally, (2) shows pharmacosensitivity to chronic disease features of MS and independent of acute disease activity after initiating an active therapy, and (3) is prognostic of future disease progression (brain volume loss, accumulation of disability, and cognitive decline). pNfL may be a potential efficacy end point in early treatment trials in PMS.
Acknowledgment
The authors thank Uma Kundu for review support.
Glossary
- CDP
confirmed disability progression
- DMT
disease-modifying therapy
- EDSS
Expanded Disability Status Scale
- EDTA
ethylenediaminetetraacetic acid
- EOS
end of study
- EOT
end of treatment
- Gd+
gadolinium-enhancing
- HR
hazard ratio
- MMRM
mixed model for repeated measures
- MS
multiple sclerosis
- NfL
neurofilament light
- PASAT
Paced Auditory Serial Addition Test
- PBVC
percent brain volume change
- PMS
progressive multiple sclerosis
- pNfL
plasma neurofilament light
- PPMS
primary progressive multiple sclerosis
- RMS
relapsing multiple sclerosis
- SDMT
Symbol Digit Modalities Test
- SPMS
secondary progressive multiple sclerosis
Appendix. Authors

Study Funding
Novartis Pharma AG, Basel, Switzerland, funded this study.
Disclosure
D. Leppert was an employee of Novartis Pharma AG until January 2019; he is now CMO of GeNeuro. H. Kropshofer and D.A. Häring are employees of Novartis Pharma AG, Basel. F. Dahlke was an employee of Novartis at the time of writing the manuscript. D. Tomic was an employee of Novartis at the time of this study. A. Patil is an employee of Novartis Healthcare Pvt. Ltd., India. R. Meinert is an employee of DATAMAP GmbH, Freiburg, Germany, which provides services to Novartis Pharma AG. L. Kappos's institution (University Hospital Basel) received in the last 3 years and used exclusively for research support at the department the following: steering committee, advisory board, consultancy fees, and support of educational activities from Actelion, Allergan, Almirall, Baxalta, Bayer, Biogen, Celgene/Receptos, CSL-Behring, Desitin, Excemed, Eisai, Genzyme, Japan Tobacco, Merck, Minoryx, Novartis, Pfizer, F. Hoffmann-La Roche Ltd, Sanofi Aventis, Santhera, and Teva; and license fees for Neurostatus-UHB products. The research of the MS Center in Basel has been supported by grants from Bayer, Biogen, Novartis, the Swiss MS Society, the Swiss National Research Foundation, Inno-Suisse, the European Union, and Roche Research Foundations. J. Kuhle received speaker fees, research support, or travel support from or served on advisory boards for Swiss MS Society, Swiss National Research Foundation (320030_189140/1), University of Basel, Progressive MS Alliance, Bayer, Biogen, Celgene, Merck, Novartis, Roche, and Sanofi. Go to Neurology.org/N for full disclosures.
References
- 1.Compston A, Coles A. Multiple sclerosis. Lancet. 2002;359(9313):1221-1231. [DOI] [PubMed] [Google Scholar]
- 2.Lassmann H, van Horssen J, Mahad D. Progressive multiple sclerosis: pathology and pathogenesis. Nat Rev Neurol. 2012;8(11):647-656. [DOI] [PubMed] [Google Scholar]
- 3.Disanto G, Barro C, Benkert P, et al. Serum neurofilament light: a biomarker of neuronal damage in multiple sclerosis. Ann Neurol. 2017;81(6):857-870. [DOI] [PMC free article] [PubMed] [Google Scholar]
- 4.Kuhle J, Kropshofer H, Haering DA, et al. Blood neurofilament light chain as a biomarker of MS disease activity and treatment response. Neurology. 2019;92(10):e1007-e1015. [DOI] [PMC free article] [PubMed] [Google Scholar]
- 5.Barro C, Benkert P, Disanto G, et al. Serum neurofilament as a predictor of disease worsening and brain and spinal cord atrophy in multiple sclerosis. Brain. 2018;141(8):2382-2391. [DOI] [PubMed] [Google Scholar]
- 6.Bittner S, Steffen F, Uphaus T, et al. Clinical implications of serum neurofilament in newly diagnosed MS patients: a longitudinal multicentre cohort study. EBioMedicine. 2020;56:102807. [DOI] [PMC free article] [PubMed] [Google Scholar]
- 7.Chitnis T, Gonzalez C, Healy BC, et al. Neurofilament light chain serum levels correlate with 10-year MRI outcomes in multiple sclerosis. Ann Clin Transl Neurol. 2018;5(12):1478-1491. [DOI] [PMC free article] [PubMed] [Google Scholar]
- 8.Kuhle J, Barro C, Disanto G, et al. Serum neurofilament light chain in early relapsing remitting MS is increased and correlates with CSF levels and with MRI measures of disease severity. Mult Scler. 2016;22(12):1550-1559. [DOI] [PubMed] [Google Scholar]
- 9.Novakova L, Zetterberg H, Sundstrom P, et al. Monitoring disease activity in multiple sclerosis using serum neurofilament light protein. Neurology. 2017;89(22):2230-2237. [DOI] [PMC free article] [PubMed] [Google Scholar]
- 10.Piehl F, Kockum I, Khademi M, et al. Plasma neurofilament light chain levels in patients with MS switching from injectable therapies to fingolimod. Mult Scler. 2018;24(8):1046-1054. [DOI] [PubMed] [Google Scholar]
- 11.Siller N, Kuhle J, Muthuraman M, et al. Serum neurofilament light chain is a biomarker of acute and chronic neuronal damage in early multiple sclerosis. Mult Scler. 2019;25(5):678-686. [DOI] [PubMed] [Google Scholar]
- 12.Ontaneda D, Thompson AJ, Fox RJ, Cohen JA. Progressive multiple sclerosis: prospects for disease therapy, repair, and restoration of function. Lancet. 2017;389(10076):1357-1366. [DOI] [PubMed] [Google Scholar]
- 13.Thompson AJ. Challenge of progressive multiple sclerosis therapy. Curr Opin Neurol. 2017;30(3):237-240. [DOI] [PubMed] [Google Scholar]
- 14.Ontaneda D, Cohen JA, Amato MP. Clinical outcome measures for progressive MS trials. Mult Scler. 2017;23(12):1627-1635. [DOI] [PubMed] [Google Scholar]
- 15.Sormani MP, Haering DA, Kropshofer H, et al. Blood neurofilament light as a potential end point in phase 2 studies in MS. Ann Clin Transl Neurol. 2019;6(6):1081-1089. [DOI] [PMC free article] [PubMed] [Google Scholar]
- 16.Kappos L, Bar-Or A, Cree BAC, et al. Siponimod versus placebo in secondary progressive multiple sclerosis (EXPAND): a double-blind, randomised, phase 3 study. Lancet. 2018;391(10127):1263-1273. [DOI] [PubMed] [Google Scholar]
- 17.Lublin F, Miller DH, Freedman MS, et al. Oral fingolimod in primary progressive multiple sclerosis (INFORMS): a phase 3, randomised, double-blind, placebo-controlled trial. Lancet. 2016;387(10023):1075-1084. [DOI] [PubMed] [Google Scholar]
- 18.Helen Brown RP. Applied Mixed Models in Medicine, 3rd ed. Wiley; 2015. [Google Scholar]
- 19.Canto E, Barro C, Zhao C, et al. Association between serum neurofilament light chain levels and long-term disease course among patients with multiple sclerosis followed up for 12 years. JAMA Neurol. 2019;76(11):1359-1366. [DOI] [PMC free article] [PubMed] [Google Scholar]
- 20.Plavina T, Singh CM, Sangurdekar D, et al. Association of serum neurofilament light levels with long-term brain atrophy in patients with a first multiple sclerosis episode. JAMA Netw Open. 2020;3(11):e2016278. [DOI] [PMC free article] [PubMed] [Google Scholar]
- 21.Häring DA, Kropshofer H, Kappos L, et al. Long-term prognostic value of longitudinal measurements of blood neurofilament levels. Neurol Neuroimmunol Neuroinflamm. 2020;7(5):e856. [DOI] [PMC free article] [PubMed] [Google Scholar]
- 22.Jakimovski D, Zivadinov R, Ramanthan M, et al. Serum neurofilament light chain level associations with clinical and cognitive performance in multiple sclerosis: a longitudinal retrospective 5-year study. Mult Scler. 2020;26(13):1670-1681. [DOI] [PubMed] [Google Scholar]
- 23.Manouchehrinia A, Stridh P, Khademi M, et al. Plasma neurofilament light levels are associated with risk of disability in multiple sclerosis. Neurology. 2020;94(23):e2457-e2467. [DOI] [PMC free article] [PubMed] [Google Scholar]
- 24.Bridel C, Leurs CE, van Lierop ZY, et al. Serum neurofilament light association with progression in natalizumab-treated patients with relapsing-remitting multiple sclerosis. Neurology. 2021;97(19):e1898-e1905. [DOI] [PubMed] [Google Scholar]
- 25.Goldschmidt C, Fox RJ. Relationship between serum neurofilament light and multiple sclerosis disability progression: clear as mud. Neurology. 2021;97(19):887-888. [DOI] [PubMed] [Google Scholar]
- 26.Lublin FD, Reingold SC, Cohen JA, et al. Defining the clinical course of multiple sclerosis: the 2013 revisions. Neurology. 2014;83(3):278-286. [DOI] [PMC free article] [PubMed] [Google Scholar]
- 27.Cortese R, Tur C, Prados F, et al. Ongoing microstructural changes in the cervical cord underpin disability progression in early primary progressive multiple sclerosis. Mult Scler. 2021;27(1):28-38. [DOI] [PubMed] [Google Scholar]
- 28.Song X, Li D, Qiu Z, et al. Correlation between EDSS scores and cervical spinal cord atrophy at 3T MRI in multiple sclerosis: a systematic review and meta-analysis. Mult Scler Relat Disord. 2020;37:101426. [DOI] [PubMed] [Google Scholar]
- 29.Tsagkas C, Magon S, Gaetano L, et al. Preferential spinal cord volume loss in primary progressive multiple sclerosis. Mult Scler. 2019;25(7):947-957. [DOI] [PubMed] [Google Scholar]
- 30.Denney DR, Sworowski LA, Lynch SG. Cognitive impairment in three subtypes of multiple sclerosis. Arch Clin Neuropsychol. 2005;20(8):967-981. [DOI] [PubMed] [Google Scholar]
- 31.Feinstein A, Freeman J, Lo AC. Treatment of progressive multiple sclerosis: what works, what does not, and what is needed. Lancet Neurol. 2015;14(2):194-207. [DOI] [PubMed] [Google Scholar]
- 32.Ruet A, Deloire M, Charre-Morin J, Hamel D, Brochet B. Cognitive impairment differs between primary progressive and relapsing-remitting MS. Neurology. 2013;80(16):1501-1508. [DOI] [PubMed] [Google Scholar]
- 33.Kapoor R, Smith KE, Allegretta M, et al. Serum neurofilament light as a biomarker in progressive multiple sclerosis. Neurology. 2020;95(10):436-444. [DOI] [PMC free article] [PubMed] [Google Scholar]
- 34.Kapoor R, Ho PR, Campbell N, et al. Effect of natalizumab on disease progression in secondary progressive multiple sclerosis (ASCEND): a phase 3, randomised, double-blind, placebo-controlled trial with an open-label extension. Lancet Neurol. 2018;17(5):405-415. [DOI] [PubMed] [Google Scholar]
Associated Data
This section collects any data citations, data availability statements, or supplementary materials included in this article.
Data Availability Statement
Anonymized data that support the findings of this study will be made available to qualified external researchers, with requests reviewed and approved by an independent review panel on the basis of scientific merit.


