

Background
There is a crisis of replicability in science [3], including in clinical research [4]. One possible cause of this is a concept called “statistical fragility” [30]. A study’s result is considered fragile if it would take only a few events occurring (or not occurring) to cause the statistical significance of that finding to change. For example, imagine a study that compares a new surgical technique with its conventional alternative, with 50 patients in each study group. Imagine further that a serious adverse event related to surgery occurred in 14 patients (28%) in the group treated with the conventional approach and five patients (10%) treated the new way. We might conclude that the new technique is superior for that outcome based on a calculated p value of approximately 0.04. However, what if one additional patient in the new-treatment group had the adverse event a few days after data collection was completed? Or what if the trial had been conducted in a different sample and one additional patient in that treatment group had the adverse event? The difference of one additional complication in the novel treatment group would result in the loss of statistical significance at the p < 0.05 level, and readers should correctly conclude that the finding of the trial is statistically fragile. In contrast, a study’s result may be considered “robust” if its significance would be maintained even if a few more events of interest were observed in one or the other of the groups being compared.
The fact that readers of clinical research should not be so focused on p values and inference testing is an important point that has been made before [17, 23], but this habit of mind seems to persist among clinicians. Therefore, it would be helpful to be able to characterize how statistically fragile a study’s result is. Thankfully, a tool for this job exists; it is a metric called the Fragility Index (FI) [30]. This tool has relevance for clinical decision-making. For example, one study looked at a subset of orthopaedic clinical trials that supported recommendations with “strong evidence” in the American Academy of Orthopaedic Surgeons Clinical Practice Guidelines [7]. Those authors found it would have taken a median of only two events to reverse the significance of a key finding in those trials. The FI, therefore, has implications for evidence-based recommendations.
Despite increased reporting of the FI in orthopaedic research in recent years and its potential advantages, several papers have called this metric into question [6, 24, 25]. We therefore describe the FI and contextualize its strengths and limitations to assist researchers and clinicians who wish to understand and use this metric.
Questions
What Is the Fragility Index?
The FI, as most commonly reported in orthopaedic research, is based on an approach described in 2014 by Walsh et al. [30]. This specific version of the FI was proposed to evaluate the fragility of findings in randomized controlled trials (RCTs) that had a statistically significant dichotomous outcome (“yes event” or “no event,” such as infection or deep venous thrombosis after surgery). It involves incrementally converting patients who did not have an event of interest into patients who had an event of interest until the p value changes from significant to nonsignificant at a prespecified p value threshold (such as p < 0.05). This conversion occurs in the arm with fewer events, likely in the treatment arm if the event is adverse (such as infection) or in the control arm if the event is positive (for example, home discharge). The smaller the FI, the fewer the number of events that need to be converted to change the study’s result from significant to nonsignificant and so the more fragile the result. An FI of 1 indicates that the determination of statistical significance for a study’s result hinges on the outcome of a single patient (Fig. 1). An online calculator is available to compute the FI using Walsh et al.’s method [30] at https://clincalc.com/Stats/FragilityIndex.aspx [15].
Fig. 1.
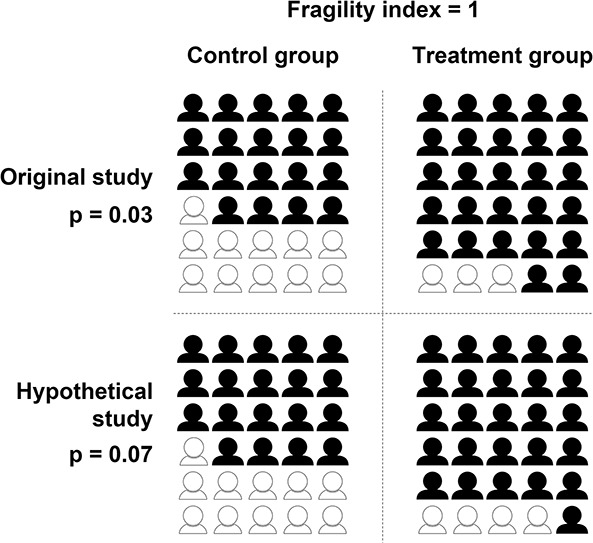
This figure reflects an example of calculating the fragility index in a two-arm randomized controlled trial. Events are dichotomous (for example, the presence of complications). The symbols represent the number of people in each study group, with black representing nonevents and white representing events. Using the methods of Walsh et al. [30], we converted a nonevent to an event in the group with fewer events in the original study until the p value became ≥ 0.05 in the hypothetical study. We calculated p values with the Fisher exact test.
What Is the FI’s Importance in Assessing the Robustness of Findings in Orthopaedics?
Orthopaedic studies have suggested the FI should routinely be reported along with p values [16, 21]. The FI has value in increasing or decreasing the reader’s confidence in the stability of a statistically significant finding. Although the FI is closely related to p values [6, 20, 26], it may be more easily understood by clinicians because it is expressed as a change in units of events (or patients) versus a change in probability. A statement that the statistical significance of a trial’s finding hinges on the outcomes of two patients may highlight uncertainty more clearly to the clinician than a probabilistic metric such as the p value.
Myths and Misperceptions
Myth 1: There Is a Consensus on What FI Value Is Considered “Fragile”
There are no clear thresholds for interpreting the FI and what would be considered “fragile.” Although two orthopaedic studies mentioned an FI of 2 as a benchmark for adequate stability [13, 18], this benchmark is based on an apparent misinterpretation of previous research that did not intend to provide a cutoff [7]. Some describe a finding as fragile if the FI is equal to or less than the number of patients lost to follow-up. This benchmark is proposed because a statistically significant finding may have become nonsignificant simply by maintaining follow-up of more participants [30]. However, this benchmark is not universally accepted and would be irrelevant, for example, in a study with a short-term endpoint of interest and no loss to follow-up. Another way to interpret the FI could be to compare fragility between studies. However, between-study comparison of FIs is complicated by the close relationship between the FI and the sample size. The fragility quotient is a related metric that allows more direct comparison between studies with different sample sizes. To calculate the fragility quotient, the FI is divided by the sample size, and the number can be multiplied by 100 to facilitate interpretation [1, 27]. The fragility quotient reflects the proportion (versus number) of events that need to change from “no” to “yes” to convert a statistically significant finding into one that is nonsignificant. However, there is also no clear benchmark to determine relative fragility between two studies.
Additionally, the method of calculating the FI can alter the magnitude of fragility. The method proposed by Walsh et al. [30] and reported most commonly in orthopaedic research uses a single analytic method (Fisher exact test) to recalculate the p value regardless of the initial analysis. However, the change in analytic method between the original and hypothetical study can cause an FI of 0, which means the finding is already not statistically significant even before changing any events in either study group. An FI of 0 is challenging to interpret because the original analytic method may have been more appropriate for the data. The possibility of an FI of 0 highlights limitations of Walsh et al.’s [30] method and its potential to inflate fragility in some cases through use of a less appropriate analytic method. Newer methods of calculating fragility have been proposed that allow flexible selection of analytic methods that are most appropriate for the data in each original study [2]. These advanced techniques may support improved interpretation and between-study comparison of FIs in the future.
Myth 2: Low FIs Indicate That Sample Sizes Should Routinely Be Increased in Trials
A common critique of the FI relates to power and trial design [9]. Trials are designed to efficiently detect an effect versus maximize stability. A low FI may, therefore, simply reflect a well-powered RCT. Expanding a sample size beyond that needed to detect an effect introduces ethical concerns related to increased risk for more individuals, delayed benefits to those outside the trial, and consumption of resources that could be used for other trials. However, the low FI found in many orthopaedic studies may be the fallout of improperly performed a priori sample size calculations (or the fact that many studies fail to perform a priori sample size calculations at all) [8]. Additionally, the low FI in smaller trials can increase clinicians’ awareness of the limitations of smaller trials, which tend to have larger treatment effects than larger trials [28]. These findings in small trials may be less replicable because of factors such as publication bias or sample characteristics that are less similar to those of the population [14]. A low FI can, therefore, remind the reader to be skeptical of the findings from a single, small trial even if it is well-designed.
Myth 3: A Low FI Can Be Interpreted as a Small Effect Size or an Indicator of Poor Study Quality
Authors might overstate what the FI indicates, and readers may misinterpret what it implies. The FI is simply a measure of the stability of the statistical significance of a finding and is, therefore, closely tied to the p value. Just as the p value should not be confused with the effect size (that is, the magnitude of change in a patient’s health status or outcomes score associated with a particular intervention) [17], the FI should not be interpreted as a measure of effect size. However, language in some studies that have used the FI can be confusing. For example, one spine article recommended reporting the FI in conjunction with the p value “to indicate the strength of statistical findings” [11]; this language of “strength” may imply to the clinician that the FI reflects the effect size. Similarly, the language of “clinical relevance” has been used in the context of the FI [12] and may imply magnitude or importance of a clinical change, which the FI does not directly address. Additionally, the FI might be mistakenly viewed as a proxy for trial quality. For example, the authors of an orthopaedic trauma paper concluded that the studies they reviewed were of “equal or higher quality” to other orthopaedic studies based on an FI calculation alone [10]. This is potentially misleading because high-quality studies may have small or large FIs, as might low-quality studies. The parameters of study quality (which includes elements such as risk of bias) and FI may not be related and should be considered separately [19]. The judgment of a trial’s quality should not be driven by the FI alone.
Myth 4: The FI Can Only Be Used to Evaluate Randomized Trials
The traditional FI proposed by Walsh et al. [30] was specifically intended for two-arm RCTs. Although RCTs often use unadjusted analyses because of their design, nonrandomized comparative trials or observational studies generally require adjusted analyses for meaningful interpretations. Although covariates cannot be incorporated into the traditional FI, modifications to FI calculations have been proposed that allow inclusion of covariates [2]. Such modifications allow quantification of how sensitive the findings of a nonrandomized study are to hypothetical changes in events in the study groups. Orthopaedic studies have demonstrated that the concept of an FI can be applied to nonrandomized comparative studies or even observational studies [22, 29]. Although those studies have used the traditional FI, future assessment of fragility in non-RCTs should consider using the newer analytic approaches.
Conclusion
The concept of fragility is a valuable one that clinicians should consider when making decisions about incorporating evidence into their practice. The FI technique introduced by Walsh et al. [30] is relatively intuitive and simple to apply, particularly with the available online calculator (https://clincalc.com/Stats/FragilityIndex.aspx) [15]. There are also exciting emerging applications of the FI that will allow expansion of the technique, such as to evaluate findings based on continuous outcomes in comparative studies [2, 5]. Reporting the FI in orthopaedic research reminds readers of the limitations of drawing conclusions from individual (especially small) RCTs, and of relying on dichotomous p value cutoffs. It is especially useful in communicating a result’s uncertainty in a way that can be easily understood by clinicians.
Footnotes
Each author certifies that there are no funding or commercial associations (consultancies, stock ownership, equity interest, patent/licensing arrangements, etc.) that might pose a conflict of interest in connection with the submitted article related to the author or any immediate family members.
All ICMJE Conflict of Interest Forms for authors and Clinical Orthopaedics and Related Research® editors and board members are on file with the publication and can be viewed on request.
References
- 1.Ahmed W, Fowler RA, McCredie VA. Does sample size matter when interpreting the fragility index? Crit Care Med. 2016;44:e1142-e1143. [DOI] [PubMed] [Google Scholar]
- 2.Baer BR, Gaudino M, Charlson M, Fremes SE, Wells MT. Fragility indices for only sufficiently likely modifications. Proc Natl Acad Sci U S A. 2021;118:e2105254118. [DOI] [PMC free article] [PubMed] [Google Scholar]
- 3.Baker M. 1,500 scientists lift the lid on reproducibility. Nature. 2016;533:452-454. [DOI] [PubMed] [Google Scholar]
- 4.Block JA. The reproducibility crisis and statistical review of clinical and translational studies. Osteoarthritis Cartilage. 2021;29:937-938. [DOI] [PubMed] [Google Scholar]
- 5.Caldwell JME, Youssefzadeh K, Limpisvasti O. A method for calculating the fragility index of continuous outcomes. J Clin Epidemiol. 2021;136:20-25. [DOI] [PubMed] [Google Scholar]
- 6.Carter RE, McKie PM, Storlie CB. The fragility index: a p-value in sheep’s clothing? Eur Heart J. 2017;38:346-348. [DOI] [PubMed] [Google Scholar]
- 7.Checketts JX, Scott JT, Meyer C, Horn J, Jones J, Vassar M. The robustness of trials that guide evidence-based orthopaedic surgery. J Bone Joint Surg Am. 2018;100:e85. [DOI] [PubMed] [Google Scholar]
- 8.Copsey B, Thompson JY, Vadher K, et al. Sample size calculations are poorly conducted and reported in many randomized trials of hip and knee osteoarthritis: results of a systematic review. J Clin Epidemiol. 2018;104:52-61. [DOI] [PubMed] [Google Scholar]
- 9.Dervan LA, Watson RS. The fragility of using p value less than 0.05 as the dichotomous arbiter of truth. Pediatr Crit Care Med. 2019;20:582-583. [DOI] [PubMed] [Google Scholar]
- 10.Forrester LA, McCormick KL, Bonsignore-Opp L, et al. Statistical fragility of surgical clinical trials in orthopaedic trauma. J Am Acad Orthop Surg Glob Res Rev. 2021;5:e20.00197. [DOI] [PMC free article] [PubMed] [Google Scholar]
- 11.Gupta A, Mo K, Movsik J, Al Farii H. Statistical fragility of ketamine infusion during scoliosis surgery to reduce opioid tolerance and postoperative pain. World Neurosurg. 2022;164:135-142. [DOI] [PubMed] [Google Scholar]
- 12.Hameed I, Gaudino M. The fragility index and trial significance—reply. JAMA Intern Med. 2020;180:1554-1555. [DOI] [PubMed] [Google Scholar]
- 13.Herndon CL, McCormick KL, Gazgalis A, Bixby EC, Levitsky MM, Neuwirth AL. Fragility index as a measure of randomized clinical trial quality in adult reconstruction: a systematic review. Arthroplast Today. 2021;11:239-251. [DOI] [PMC free article] [PubMed] [Google Scholar]
- 14.Hong C, Salanti G, Morton SC, et al. Testing small study effects in multivariate meta-analysis. Biometrics. 2020;76:1240-1250. [DOI] [PMC free article] [PubMed] [Google Scholar]
- 15.Kane SP. Fragility Index Calculator. ClinCalc; 2018. [Google Scholar]
- 16.Kyriakides PW, Schultz BJ, Egol K, Leucht P. The fragility and reverse fragility indices of proximal humerus fracture randomized controlled trials: a systematic review. Eur J Trauma Emerg Surg. 2022;48:4545-4552. [DOI] [PubMed] [Google Scholar]
- 17.Leopold SS, Porcher R. Editorial: threshold p values in orthopaedic research-we know the problem. What is the solution? Clin Orthop Relat Res. 2018;476:1689-1691. [DOI] [PMC free article] [PubMed] [Google Scholar]
- 18.McCormick KL, Tedesco LJ, Swindell HW, Forrester LA, Jobin CM, Levine WN. Statistical fragility of randomized clinical trials in shoulder arthroplasty. J Shoulder Elbow Surg. 2021;30:1787-1793. [DOI] [PubMed] [Google Scholar]
- 19.Muthu S, Ramakrishnan E. Fragility analysis of statistically significant outcomes of randomized control trials in spine surgery: a systematic review. Spine (Phila Pa 1976). 2021;46:198-208. [DOI] [PubMed] [Google Scholar]
- 20.Niforatos JD, Zheutlin AR, Chaitoff A, Pescatore RM. The fragility index of practice changing clinical trials is low and highly correlated with P-values. J Clin Epidemiol. 2020;119:140-142. [DOI] [PubMed] [Google Scholar]
- 21.Parisien RL, Constant M, Saltzman BM, et al. The fragility of statistical significance in cartilage restoration of the knee: a systematic review of randomized controlled trials. Cartilage. 2021;13:147S-155S. [DOI] [PMC free article] [PubMed] [Google Scholar]
- 22.Parisien RL, Trofa DP, Cronin PK, et al. Comparative studies in the shoulder literature lack statistical robustness: a fragility analysis. Arthrosc Sports Med Rehabil. 2021;3:e1899-e1904. [DOI] [PMC free article] [PubMed] [Google Scholar]
- 23.Phillips M. Letter to the editor: editorial: threshold p values in orthopaedic research-we know the problem. What is the solution? Clin Orthop Relat Res. 2019;477:1756-1758. [DOI] [PMC free article] [PubMed] [Google Scholar]
- 24.Porco TC, Lietman TM. A fragility index: handle with care. Ophthalmology. 2018;125:649. [DOI] [PubMed] [Google Scholar]
- 25.Potter GE. Dismantling the fragility index: a demonstration of statistical reasoning. Stat Med. 2020;39:3720-3731. [DOI] [PubMed] [Google Scholar]
- 26.Reito A, Raittio L, Helminen O. Fragility index, power, strength and robustness of findings in sports medicine and arthroscopic surgery: a secondary analysis of data from a study on use of the fragility index in sports surgery. PeerJ. 2019;7:e6813. [DOI] [PMC free article] [PubMed] [Google Scholar]
- 27.Schröder A, Muensterer OJ, Oetzmann von Sochaczewski C. Meta-analyses in paediatric surgery are often fragile: implications and consequences. Pediatr Surg Int. 2021;37:363-367. [DOI] [PMC free article] [PubMed] [Google Scholar]
- 28.Sterne JA, Gavaghan D, Egger M. Publication and related bias in meta-analysis: power of statistical tests and prevalence in the literature. J Clin Epidemiol. 2000;53:1119-1129. [DOI] [PubMed] [Google Scholar]
- 29.Svantesson E, Hamrin Senorski E, Danielsson A, et al. Strength in numbers? The fragility index of studies from the Scandinavian knee ligament registries. Knee Surg Sports Traumatol Arthrosc. 2020;28:339-352. [DOI] [PMC free article] [PubMed] [Google Scholar]
- 30.Walsh M, Srinathan SK, McAuley DF, et al. The statistical significance of randomized controlled trial results is frequently fragile: a case for a fragility index. J Clin Epidemiol. 2014;67:622-628. [DOI] [PubMed] [Google Scholar]