Abstract
The loss of mitochondrial cristae integrity and mitochondrial swelling are hallmarks of multiple forms of necrotic cell death. One of the most well-studied and relevant inducers of mitochondrial swelling is matrix calcium (Ca2+). Respiring mitochondria will intake available Ca2+ into their matrix until a threshold is reached which triggers the opening of the mitochondrial permeability transition pore (MPTP). Upon opening of the pore, mitochondrial membrane potential dissipates and the mitochondria begin to swell, rendering them dysfunctional. The total amount of Ca2+ taken up by a mitochondrion prior to the engagement of the MPTP is referred to as mitochondrial Ca2+ retention capacity (CRC). The CRC/swelling assay is a useful tool for observing the dose-dependent event of mitochondrial dysfunction in real-time. In this technique, isolated mitochondria are treated with specific boluses of Ca2+ until they reach CRC and undergo swelling. A fluorometer is utilized to detect an increase in transmitted light passing through the sample as the mitochondria lose cristae density, and simultaneously measures calcium uptake by way of a Ca2+-specific membrane impermeable fluorescent dye. Here we provide a detailed protocol describing the mitochondrial CRC/swelling assay and we discuss how varying amounts of mitochondria and Ca2+ added to the system affect the dose-dependency of the assay. We also report how to validate the assay by using MPTP and calcium uptake inhibitors and troubleshooting common mistakes that occur with this approach.
Keywords: Mitochondria, Fluorometry, Calcium retention capacity, CRC, Calcium Green 5 N, Mitochondrial dysfunction, Cell death, Mitochondrial swelling, Mitochondrial permeability transition pore (MPTP)
1. Introduction
The disruption of calcium homeostasis plays a significant role in numerous pathological events such as ischemic injuries and degenerative disorders [1]. During such states, cytosolic calcium (Ca2+) levels increase above physiological thresholds, which then influx into the matrix of mitochondria [2]. High concentration of mitochondrial matrix Ca2+ triggers the opening of the mitochondrial permeability transition pore (MPTP), a nonspecific pore that results in the permeabilization of the inner mitochondrial membrane and allows for the free flow of solutes up to 1.5 kDa in size [3]. Sustained MPTP opening induces complete mitochondrial dysfunction, characterized by loss of membrane potential, subsequent inhibition of ATP production, and mitochondrial swelling [4, 5]. Mitochondrial dysfunction is a hallmark of MPTP-dependent necrosis, which is a critical regulator of ischemic injuries, degenerative disorders, aging, and many other necrotic death related diseases [6-9].
Mitochondrial function is often used as a marker of cellular viability. Inversely, mitochondrial dysfunction serves as a marker of cellular damage and can be measured in several ways; morphological changes by transmission electron microscopy (TEM), loss of membrane potential by membrane-potential-dependent fluorescent dyes, decreases in mitochondrial respiration or capacity by measuring oxygen consumption, or by analyzing the accumulations of mitochondrial DNA mutations [10-12]. Here we describe another powerful technique to assess the sensitivity of Ca2+-dependent mitochondrial dysfunction in real time, known as the calcium retention capacity (CRC) assay and the mitochondrial swelling assay.
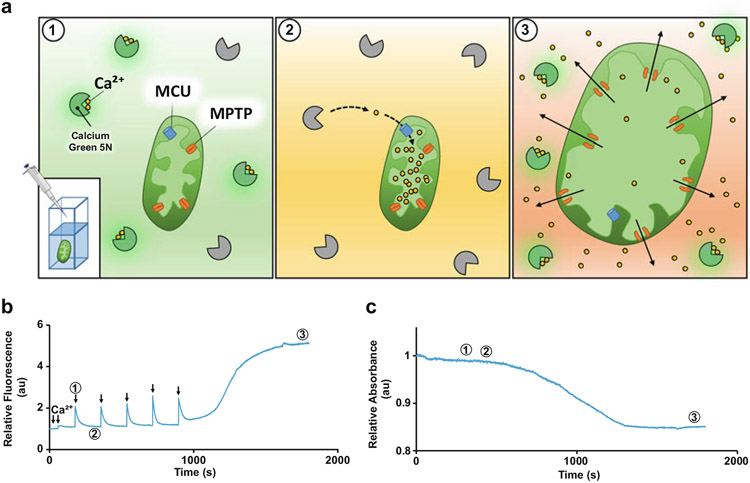
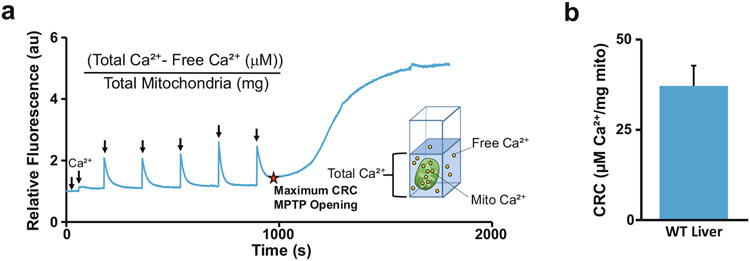
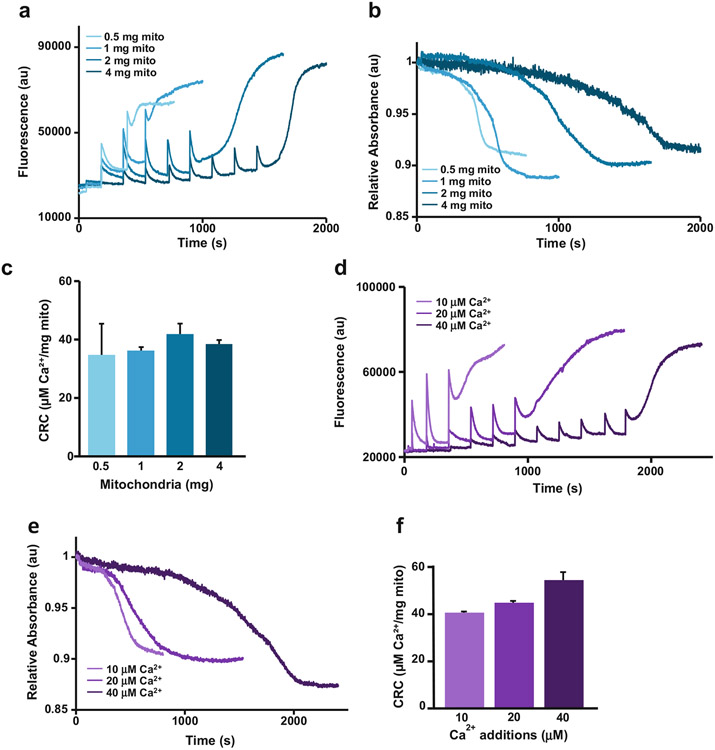
CRC assay is an ex vivo fluorometric method performed by kinetically acquiring changes in fluorescence when mitochondria are challenged with Ca2+ [13]. The mitochondrial swelling assay is an ex vivo light absorbance method performed by kinetically acquiring changes in transmitted light following Ca2+ stimulation. Fortunately, a fluorometer that is equipped with two detectors, one to acquire fluorescence and the other to acquire transmittance, can simultaneously obtain both parameters streamlining experimentation and increasing the efficiency per sample. The machine we use is the Photon Technology International (PTI) QuantaMaster 8000 Series from HORIBA Scientific where the detector acquiring fluorescence is positioned 90° from the sample and the light source, while the detector acquiring transmittance is positioned 180° from the sample and the light source. We utilize a cell-impermeable Ca2+ indicator Calcium Green™-5 N (CG5N) which becomes excited at a wavelength of 506 nm and emits fluorescence at 532 nm [14]. Upon transiently binding Ca2+ upon stimulation with Ca2+ the dye in the cuvette immediately fluoresces represented by an immediate peak [15]. Over time, mitochondria within the cuvette begin taking up the Ca2+, which is represented by a decrease in fluorescence (Fig. 1a, b). The mitochondria are continuously incubated with additional Ca2+ and the process is repeated until maximum Ca2+ capacity is achieved. At this point, the MPTP engages and the mitochondria swell and begin to extrude Ca2+ [16]. Simultaneously, the mitochondria begin to swell, which is exhibited by a continuous increase in transmitted light passing through the sample (Fig. 1b, c). In addition, CRC traces are quantified by taking into account the amount of Ca2+ injected into the cuvette versus the amount taken up by the mitochondria (Fig. 2). Notably, the quantitation of this assay relies heavily on the total number of mitochondria put into the cuvette as well as the concentration of each Ca2+ injection (Fig. 3).
Fig. 1.
Schematic representation of mitochondrial CRC/swelling assay with representative traces. (a) Schematic representing the events within the cuvette during the mitochondrial CRC/swelling assay. Numbers coordinate to events displayed on the traces. (b) and (c) 2 mg of mitochondria continuously dosed with 20 μM Ca2+ (arrows) over specified increments of time until CRC and swelling events occur. Excitement of calcium green 5 N (CG5N) is shown by sharp increase in fluorescence at the time of calcium treatment (event 1). Mitochondrial uptake is represented by a subsequent decrease in fluorescence, demonstrating that Ca2+ becomes unbound from the dye and enters the mitochondrial matrix (event 2). CRC is achieved once there is a release of Ca2+ from the mitochondria demonstrated by the steady increase and eventual plateau in fluorescence (event 3). Mitochondrial swelling is indicated by the sharp decrease in absorbance, which represents the opening of the MPTP
Fig. 2.
Quantification of the CRC Assay. Mitochondrial CRC is the maximum amount of Ca2+ taken up by the mitochondria prior to MPTP opening. (a) Representative trace of the CRC assay and equation for quantifying CRC. The red star indicates the point of CRC. (b) The CRC assay was repeated using three individual liver mitochondria samples, and the amount of μg Ca2+/mg mitochondria (mito) was averaged then graphed (n = 3) error bars (S.E.M)
Fig. 3.
Dose-dependency of mitochondria and Ca2+ concentrations for the CRC/Mitochondrial swelling assay. (a) and (b) Varying amounts of mitochondria (0.5, 1, 2, 4 mg) subjected to the CRC/swelling assay using the same additions of 20 μM Ca2+. Representative traces demonstrate that increasing the concentration of mitochondria in the cuvette correlates with an increase in total Ca2+ required to induce MPTP opening. (c) Quantification of figure a showing that the CRC remains constant although increasing amounts of mitochondria were used (n = 3). (d) and (e) 2 mg of mitochondria subjected to the CRC/swelling assay using increasing concentrations of Ca2+ additions (10, 20, 40 μM). Representative traces show that MPTP opening is achieved sooner with higher additions of Ca2+, demonstrating the dose-dependent nature of CRC assay. (f) Quantification of figure d showing that the CRC remains constant although increasing amounts of Ca2+ were used (n = 3) error bars (S.E.M)
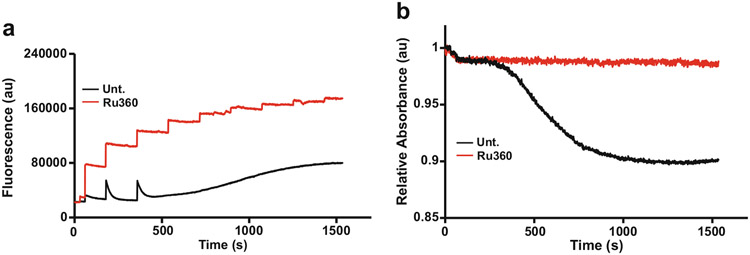
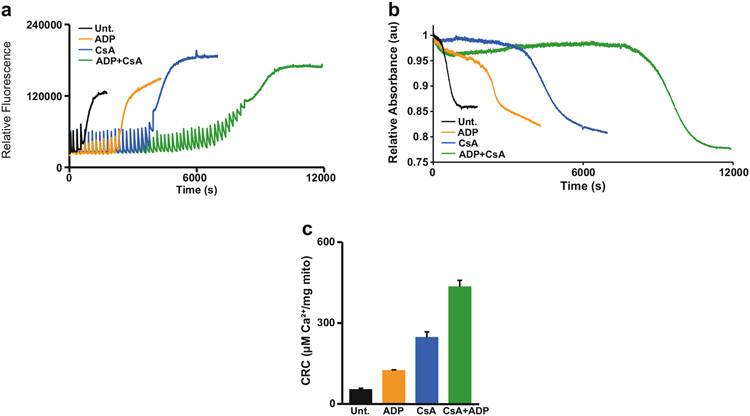
The combination of the swelling assay with the CRC assay not only doubles the amount of data acquired per analysis, but also increases the ability to determine the efficacy of pharmacological and/or genetic inhibitors and inducers of the MPTP. Compounds that are commonly used to validate the CRC and swelling assays include the cyclophilin D (CypD) inhibitor, cyclosporin A (CsA), and the substrate of the adenine nucleotide translocator (ANT), adenosine diphosphate (ADP), or the mitochondrial calcium uniporter (MCU) inhibitor, Ru360, which is an oxygen-bridged di-nuclear ruthenium amine complex. Both CRC and mitochondrial swelling rely on mitochondrial Ca2+ uptake through the MCU, therefore, the inhibition of the MCU by Ru360 prevents calcium uptake and consequentially, prevents mitochondrial swelling [17, 18]. Thus, Ru360 is used to validate the CRC assay’s ability to measure mitochondrial Ca2+ uptake, and when added to the sample, a stair-step pattern in fluorescence as well as no change in absorbance is observed following multiple additions of Ca2+ (Fig. 4). To increase mitochondrial CRC, CsA, and/or ADP can be added to the sample [19]. When individually added, CsA- or ADP-treated mitochondria can intake significantly more Ca2+ before the MPTP engages and swelling occurs (Fig. 5a, b). However, in combination, mitochondria become highly resistant to Ca2+-induced MPTP opening, which results in a further increase in CRC (Fig. 5).
Fig. 4.
MCU Inhibitor RU360 prevents uptake of Ca2+. (a) and (b) 2 mg of mitochondria were incubated with or without mitochondrial calcium uniporter (MCU) inhibitor 10 μM Ru360 and subjected to the CRC/swelling assay. Untreated (Unt.) mitochondria are able to take up Ca2+ until the MPTP engages, while Ru360 treated mitochondria are unable to intake Ca2+ and never undergo MPTP opening
Fig. 5.
Desensitization of the MPTP with CsA and ADP. (a) and (b) Representative CRC and swelling traces of 2 mg mitochondria stimulated with 40 μM Ca2+ treated with cyclosporin A (2 μM CsA) and/or adenosine phosphate (300 μM ADP). Mitochondria incubated with CsA and/or ADP have greater CRC than untreated (Unt.) mitochondria. (c) Quantification of figure a. (n = 3) error bars (S.E.M)
The origins of the mitochondrial swelling assay began with experiments in the mid-twentieth century, which were conducted using standard spectrophotometry [20-22]. Due to the advancement of florescent dyes and methods of detection, the classic mitochondrial swelling assay has evolved into the modern CRC/swelling assay, enabling researchers to examine Ca2+ uptake into mitochondria prior to mitochondrial swelling and increasing the amount of data obtained. In addition to swelling, total Ca2+ capacity and the rate of Ca2+ uptake may now be obtained concurrently. The combination of these analyses into a single assay is an extremely powerful tool to study MPTP sensitivity and mitochondrial dysfunction.
2. Materials
All the following solutions and isolated biological samples should remain at 4 °C or on ice, except for the assay buffer, which can remain at room temperature.
2.1. Mitochondrial Isolation Reagents, Buffers, and Equipment
Isolation buffer: 225 mM mannitol, 75 mM sucrose, 5 mM HEPES, 1 mM EGTA, pH 7.4. Add 20.5 g mannitol, 12.8 g sucrose, 0.60 g HEPES, and 1 mL of 0.5 M EGTA into a 1 L beaker. Add 400 mL water and stir until dissolved, cool overnight at 4 °C. Next day, adjust pH with KOH and HCl and bring up the final volume to 500 mL. Store at 4 °C.
Assay buffer: 125 mM KCl, 20 mM HEPES, 2 mM KH2PO4, 40 μM EGTA, pH to 7.2. Weigh 4.7 g KCl, 2.8 g HEPES, 0.14 KH2PO4 in a 500 mL beaker. Add 0.04 mL of 0.5 M EGTA and raise volume up to 400 mL with water while stirring. Adjust pH using KOH and HCL to 7.2 and raise the final volume to 500 mL with additional water. Store at room temperature.
8 mL glass homogenizer, with polytetrafluoroethylene (PTFE) pestle.
Standard temperature controlled large centrifuge with a fixed rotor capable of housing 15 mL volume conical tubes.
2.2. CRC Assay Reagents and Equipment
Calcium Green™-5 N (CG5N): 50 μM stock concentration. Add 8.39 mL water to 500 μg, aliquot and store at −20 °C within a desiccator. Keep from light.
Sodium pyruvate: 1 M stock concentration, pH 7.2. Add 3.3 g of pyruvate into 30 mL of assay buffer. Aliquot (1 mL) and store at −20 °C.
DL-Malic acid: 1 M stock concentration, pH 7.2. Add 4 g of DL-Malic acid into 30 mL assay buffer. Aliquot (1 mL) and store at −20 °C.
Calcium Chloride (CaCl2, Ca2+): 1 M stock concentration. Dissolve 3.3 g of CaCl2 into 30 mL deionized water (mild exothermic reaction). To make 10 mM CaCl2, add 120 μL of 1 M CaCl2 into 12 mL final volume of deionized water. Vortex well and store at room temperature.
Cyclosporin A (CsA): 5 mM stock concentration. Dissolve 10 mg of CsA in 1.6 mL 100% ethanol, aliquot and store at −20 °C.
Adenine Diphosphate (ADP): 50 mM stock concentration. Dissolve 5 mg ADP in 585 mL of assay buffer, aliquot and store at −20 °C.
Ru360: 5 mM stock concentration. Dissolve 500 μg Ru360 in 182.9 μl of deionized water. Aliquot and store protected from light at −20 °C.
Fluorometer (Photon Technology International (PTI) QuantaMaster 8000 Series, Horiba Scientific).
Photon Technology International (PTI) FelixGX software.
3500 μL macro fluorescent cuvette, glass quartz.
Small cuvette stool square for elevating the 1 mL sample into the path of the laser.
1.5 mm flea micro stir bar.
Laboratory grade swabs.
3. Methods
3.1. Mitochondrial Isolation from Mouse Liver
Cool the centrifuge to 4 °C prior to mitochondrial isolation.
Euthanize mouse and carefully access abdominal cavity.
Dissect largest lobe of liver from mice. In a weigh boat, wash with mitochondrial isolation buffer.
Transfer tissue to a small beaker (50 mL) containing 7 mL of ice cold isolation buffer. Keep on ice.
While on ice, finely mince the lobe with scissors (1–2 mm pieces) and transfer to 8 mL glass tissue homogenizer (see Note 1).
Dounce with a PTFE pestle until the mixture is homogenous and all pieces of tissue are no longer visible (7–10 plunges) (see Note 2) and transfer into a 15 mL conical.
Centrifuge sample at 800 × g for 5 min at 4 °C.
Remove sample from centrifuge. Transfer supernatant into new 15 mL conical. Discard pellet.
Centrifuge sample at 10,000 × g for 10 min at 4 °C.
Remove sample from centrifuge. Aspirate the supernatant, careful not to aspirate the pellet.
While on ice, reconstitute the pellet in 7 mL of chilled isolation buffer by gently pipetting up and down until the pellet is suspended.
Centrifuge for an additional 10 min at 10,000 × g at 4 °C.
Aspirate supernatant and completely suspend pellet in 1 mL of assay buffer. Transfer into 1.7 mL micro-centrifuge tube. Keep on ice.
Determine protein concentration of the sample. Record concentration in μg/μL and keep on ice (see Note 3).
3.2. CRC/Swelling Assay
Prepare required equipment and reagents (see Notes 4 and 5).
Load 2 mg of mitochondria into the cuvette per assay. Calculate the volume per assay necessary based on determined sample concentration (see Note 6).
Calculate the volume of reagents and mitochondria necessary per run and add them into a clean quartz cuvette with the stir bar. Final concentrations of reagents in the cuvette containing 1 mL final volume: 7 mM pyruvate, 1 mM malic acid, 0.5 μM CG5N, and lastly add the 2 mg of mitochondria (see Notes 7 and 8).
Once all components are added into the cuvette, place cuvette into the fluorometer device and incubate for 5 min with stirring with the lid closed.
Click “start” on the FelixGX™ program to obtain a baseline measurement.
When adding Ca2+ to the cuvette, press the “pause” button, open the lid of the fluorimeter and manually add Ca2+ (2 μL of 10 mM CaCl2 stock or other desired concentration) at a preferred time. Quickly close the lid and press “continue” to resume the assay (see Notes 9 and 10).
Once fluorescence has plateaued, add another dose of Ca2+ into the cuvette.
Repeat step 7 until mitochondrial swelling is observed, which is identified as a sharp and steady increase in transmittance (see Note 11).
Allow fluorescence and transmittance curve to plateau (time may vary dependent on the presence of inhibitors) and the press “stop” to end run.
Clean cuvette and stir bar thoroughly with swabs and deionized water. Prepare the desired following assay with additional inhibitors/alternate inducers of mitochondrial swelling (see Notes 12 and 13).
3.3. Data Analysis and Quantification
Save file on program and export all traces into a text (.TXT) file. The data can then be copied and pasted into another program such as Microsoft® Excel® for graphing and data analysis.
Convert transmittance values to absorbance using a baseline value and the Beer–Lambert equation .
Mitochondrial swelling curves can be graphed as raw values. However, if there are large baseline differences between samples, graphing the traces relative to the baseline absorbance may be appropriate.
The fluorescent curves should be graphed using raw values since minor differences in baseline fluorescence is negligible to assay interpretation.
In order to quantify mitochondrial CRC, first determine the “total amount of Ca2+” added to the assay. This can be easily determined by counting the number of peaks in the graphs, total volume of Ca2+ added per peak, and knowing the CaCl2 stock used.
Calculate the amount of “free Ca2+” (extra-mitochondrial Ca2+) at the point of MPTP opening (see Note 14).
Calculate CRC using the following equation: (see Note 15).
Once sufficient experimental replicates are achieved to perform statistical analyses, the data can be represented qualitatively using a representative traces and quantitatively using the calculated CRC values (Fig. 2).
4. Notes
To help transfer all minced tissue at once efficiently, swirl beaker and quickly pour contents into homogenizer. Letting tissue settle at the bottom of the homogenizer, return some buffer into the beaker and repeat this method to transfer all remnants of tissue.
Gently homogenize tissue without forming bubbles and twist plunger during upward strokes to homogenize the tissue.
Invert micro-centrifuge tube containing sample to keep mitochondria from settling in bottom of the tube for a more accurate reading of protein concentration. Keep mitochondria on ice throughout the rest of the procedure. However, the mitochondria are also time-sensitive and will remain useful for the CRC/swelling assay for approximately 6 h.
Allow pyruvate, malic acid, and MPTP inhibitors such as cyclosporin A and ADP to defrost on ice until thawed.
Turn on the fluorometer for approximately 15 min prior to using to allow the light source to warmup completely. Connect to energy source, hit laser switch, press ignite button, and check for lamp light which should be green. Check to see if motor driver stirrer is on (should make a faint sound).
The CRC/mitochondrial swelling assay is very dose-dependent, meaning the timing of achieving CRC and swelling is very dependent on the amount of mitochondria used, or the amount of calcium used per spike (Fig. 3). Keep this in mind to determine the optimal amount of either to use, if seeking to detect more sensitive analysis a greater amount of mitochondria and lower concentration of calcium is recommended.
The addition of 10 μM Ru360 into the cuvette prior to any additions of Ca2+ may be used to confirm if the assay is truly detecting mitochondrial Ca2+ uptake (Fig. 4).
The addition of 2 μM CsA and/or 300 μM ADP into to the cuvette prior to any additions of Ca2+ may be used as a positive control for MPTP desensitization (Fig. 5).
Once the assay is resumed after adding Ca2+, the fluorescence curve should spike upwards immediately. First addition(s) to the cuvette will be buffered by the EGTA within the assay buffer (depending on the concentration of Ca2+ added), but subsequent additions will stimulate the response of the CG5N dye.
Do not open the lid of the fluorometer prior to pressing the “pause” button. Opening the lid will prematurely disrupt the assay and all recorded fluorescence and transmittance traces will drop to zero due to a shutter automatically blocking the light source when the lid is open.
Do not add additional calcium once CRC is reached and mitochondrial swelling begins (simultaneous event). This moment in the assay is evident by an increase followed by a plateau in fluorescent light and by a simultaneous increase in transmitted light.
The use of laboratory grade swabs to clean the cuvettes with water may help prevent residual inhibitors from affecting the following assays.
When performing multiple assays that will be qualitatively compared, use consistent time points when adding Ca2+ into the cuvette and allow all runs to transpire until MPTP opening occurs.
In order to calculate “free Ca2+,” the user must first calibrate the Calcium green 5 N dye on their fluorescent system. Once calibrated, the “free Ca2+” concentration at the point of MPTP opening can be determined by the fluorescent value at that time (Fig. 2).
Final CRC data is represented as “μM Ca2+/mg mitochondria.”
Acknowledgments
This work was supported by the National Heart, Lung, and Blood Institute of the National Institutes of Health under award number R01HL150031 and the NIH training grant award number 5T32HL007676-29.
References
- 1.Bernardi P, Lisa FD (2015) The mitochondrial permeability transition pore: molecular nature and role as a target in cardioprotection. J Mol Cell Cardiol 78:100–106 [DOI] [PMC free article] [PubMed] [Google Scholar]
- 2.Gunter TE, Buntinas L, Sparagna G et al. (2000) Mitochondrial calcium transport: mechanisms and functions. Cell Calcium 28(5–6):285–296 [DOI] [PubMed] [Google Scholar]
- 3.Briston T, Roberts M, Lewis S et al. (2017) Mitochondrial permeability transition pore: sensitivity to opening and mechanistic dependence on substrate availability. Sci Rep 7:10492. [DOI] [PMC free article] [PubMed] [Google Scholar]
- 4.Karch J, Kwong JQ, Burr AR et al. (2013) Bax and Bak function as the outer membrane component of the mitochondrial transition pore. PNAS 111(29):10396–10397 [Google Scholar]
- 5.Kroemer G, Reed J (2000) Mitochondrial control of cell death. Nat Med 6:513–519 [DOI] [PubMed] [Google Scholar]
- 6.Patel P, Karch J (2019) Regulation of cell death in the cardiovascular system. Int Rev Cell Mol Biol 353:153–209 [DOI] [PubMed] [Google Scholar]
- 7.Millay DP, Sargent MA, Osinska H et al. (2008) Genetic and pharmacologic inhibition of mitochondrial-dependent necrosis attenuates muscular dystrophy. Nat Med 14(4):442–447 [DOI] [PMC free article] [PubMed] [Google Scholar]
- 8.Panel M, Ghaleh B, Morin D (2018) Mitochondria and aging: a role for the mitochondrial transition pore? Aging Cell 17(4):e12793. [DOI] [PMC free article] [PubMed] [Google Scholar]
- 9.Readnower RD, Hubbard WB, Kalimon OJ et al. (2021) Genetic approach to elucidate the role of Cyclophilin D in traumatic brain injury pathology. Cell 10(2):199. [DOI] [PMC free article] [PubMed] [Google Scholar]
- 10.Burattini S, Falcieri E (2013) Analysis of cell death by electron microscopy. Methods Mol Biol 1004:77–89 [DOI] [PubMed] [Google Scholar]
- 11.Crowley LC, Christensen ME, Waterhouse NJ (2016) Measuring mitochondrial transmembrane potential by TMRE staining. Cold Spring Harb Protoc 2016:pdb.prot087361. [DOI] [PubMed] [Google Scholar]
- 12.Martin DB, David GN (2011) Assessing mitochondrial dysfunction in cells. Biochem J 435(2):297–312 [DOI] [PMC free article] [PubMed] [Google Scholar]
- 13.Harisseh R, Abrial M, Chiari P et al. (2019) A modified calcium retention capacity assay clarifies the roles of extra-and intracellular calcium pool in mitochondrial permeability transition pore opening. J Biol Chem 294:15282–15292 [DOI] [PMC free article] [PubMed] [Google Scholar]
- 14.Rajdev S, Reynolds IJ (1993) Calcium green-5N, a novel fluorescent probe for monitoring high intracellular free Ca2+ concentrations associated with glutamate excitotoxicity in cultured rat brain neurons. Neurosci Lett 162(1–2):149–152 [DOI] [PubMed] [Google Scholar]
- 15.Deak AT, Jean-Quartier C, Bondarenko AI et al. (2015) Assessment of mitochondrial Ca2+ uptake. Methods Mol Biol 1264:421–439 [DOI] [PubMed] [Google Scholar]
- 16.Javadov S, Chapa-Dubocq X, Makarov V (2018) Different approaches to modeling analysis of mitochondrial swelling. Mitochondrion 38:58–70 [DOI] [PMC free article] [PubMed] [Google Scholar]
- 17.Marchi S, Pinton P (2014) The mitochondrial calcium uniporter complex: molecular components, structure and physiopathological implications. J Physiol 592(5):829–839 [DOI] [PMC free article] [PubMed] [Google Scholar]
- 18.Pan X, Liu J, Nguyen T, Liu C et al. (2013) The physiological role of mitochondrial calcium revealed by mice lacking the mitochondrial calcium uniporter. Nat Cell Biol 15:1464–1472 [DOI] [PMC free article] [PubMed] [Google Scholar]
- 19.Karch J, Bround MJ, Khalil H et al. (2019) Inhibition of mitochondrial permeability transition by deletion of the ANT family and CypD. Science. Advances 5:EAAW4597. [DOI] [PMC free article] [PubMed] [Google Scholar]
- 20.Tedeschi H, Harris DL (1955) The osmotic behavior and permeability to non-electrolytes of mitochondria. Arch Biochem Biophys 58:52–57 [DOI] [PubMed] [Google Scholar]
- 21.Beavis AD, Brannan RD, Garlid KD (1985) Swelling and contraction of the mitochondrial matrix. I. A structural interpretation of the relationship between light scattering and matrix volume. J Biol Chem 260:13424–13433 [PubMed] [Google Scholar]
- 22.Selwyn MJ (1986) Use of transmittance to record mitochondrial swelling. Biochem Soc Trans 14(6):1045–1046 [Google Scholar]


