

Abstract
Recent progress in mass spectrometry (MS) lipidomics has led to a rapid proliferation of studies across biology and biomedicine and facilitating important discoveries. These generate extremely large raw datasets requiring sophisticated tailored solutions to support automated data processing. To address this, numerous software tools have been developed, tailored for specific tasks in the data analysis pipeline. However, for researchers, deciding which approach best suits their application relies on ad hoc testing, which is inefficient and time-consuming. Here, we first review the data processing pipeline, summarizing the number and scope of available tools. Next, to support researchers, LIPID MAPS provides an interactive online portal listing open-access tools with a graphical user interface. This guides users towards appropriate solutions within major areas in data processing including (1) lipid-oriented databases, (2) MS data repositories, (3) analysis of targeted lipidomics datasets, (4) lipid identification, and (5) quantification from untargeted lipidomics datasets, (6) statistical analysis and visualization, and (7) data integration solutions. Detailed descriptions of functions and requirements are provided to guide customized data analysis workflows.
Lipidomics is a rapidly growing sub-area of metabolomics, reporting on the generation and metabolism of small molecule hydrophobic species during health and disease1–5. There is increasing interest in the use of lipidomics to identify biomarkers and new targets for intervention in disease progression, as well as to delineate underpinning mechanisms6–8. Over the last 10 years, there has been an explosion in the establishment and application of lipidomics mass spectrometry (MS) approaches for biomedical research. Newer generation MS instruments, particularly high-resolution time-of-flight and orbitrap configurations enable the generation of large “omics” type datasets that can report on literally thousands of lipids in a single analytical run. With the current drive in the field being to analyse large numbers of samples (e.g. blood plasmas, tissue extracts), the amount of data generated experimentally is increasing exponentially. This is leading to significant challenges in both data processing and downstream storage for later (open access) re-use that requires computational solutions.
Researchers have responded strongly to the emerging challenges of data analytics in lipidomics through developing new algorithms and tools that enable effective computational processing of data. These tools have already begun to enable the application of new lipidomics methods to the characterisation of diverse biological processes, in many cases leading to significant discoveries, and some examples are listed here. Several tools have been applied to profiling of plasma lipidomics, for example LipidXplorer, LipidFinder, and Lipid Data Analyser (LDA).9,10 LDA has also contributed to a diverse range of biochemical studies including adipocyte derived extracellular vesicle characterisation11, determining the role of phosphatidylserine in autophagy12 analysis of the role of lipids in flavivirus replication13 and how the lipid bilayer stabilises the 5HT receptor14. Meanwhile, LipidFinder performed an extended clean-up of high resolution MS data for the first report of the SARS-CoV2 envelope composition15. As further examples, the Lipid Ontology enrichment web-tool, LION/web16 enabled investigation of the role of lipids in bone-marrow neutrophils during aging17 and the effect of sex and genetics in the metabolic response to calorie restriction18. Several of the tools described in this review including LionWeb and XCMS have enabled investigation of metabolic states in non-alcoholic fatty liver disease (NAFLD)19,20. Furthermore, XCMS enabled a role for sphingolipids in neuropathic pain to be identified21. Although this is only a small illustrative list of studies using existing tools, the number and diversity of biological applications for lipidomics tools is increasing significantly as more and more researchers enter the field. Evidencing the significant user base for lipidomics, LIPID MAPS has around 72K users globally, with the LIPID MAPS Structure Database downloaded >4.6K times and viewed ~380K times in 2021, along with ~2.5K citations in publications during 2020/2021 (Google Scholar, Google Analytics data).
When it comes to choice of which approach to use, researchers need to consider the underlying data structure and also the research questions being asked. They also need to understand the underlying approaches used by algorithms in order to determine whether they will perform as expected for their particular data. However, making decisions on the most appropriate software is currently based on ad hoc processes, such as manual searching of the literature and testing packages individually. This is time consuming and inefficient since implementing tools requires extensive training and familiarisation. Furthermore, the inappropriate use of software can lead to significant errors, for example incorrect annotation of lipid identifications or erroneous interpretation of noise as peaks, to suggest the presence of lipids in samples.
To address these issues, and to support researchers with identification and testing of appropriate computational solutions for lipidomics, LIPID MAPS has generated Lipidomics Tools Guide, accessible through our home page. This comprises an interactive display that guides researchers towards appropriate solutions, and provides detailed descriptions of key features and performance of individual tools, enabling the informed decision making on processing pipelines (Figure 1). To accompany the tool, in this review we provide full details on the Lipidomics Tools Guide and listed software, together with practical advice from the individual developers relating to the primary and secondary applications of each tool. Additionally, two tutorial provided as Supplementary Note illustrated interoperability of different tools exemplified for targeted and untargeted lipidomics experiments.
Figure 1. A screenshot of Lipidomics Tools Guide guiding the choice of the tools organized by the major tasks for lipidomics data processing.
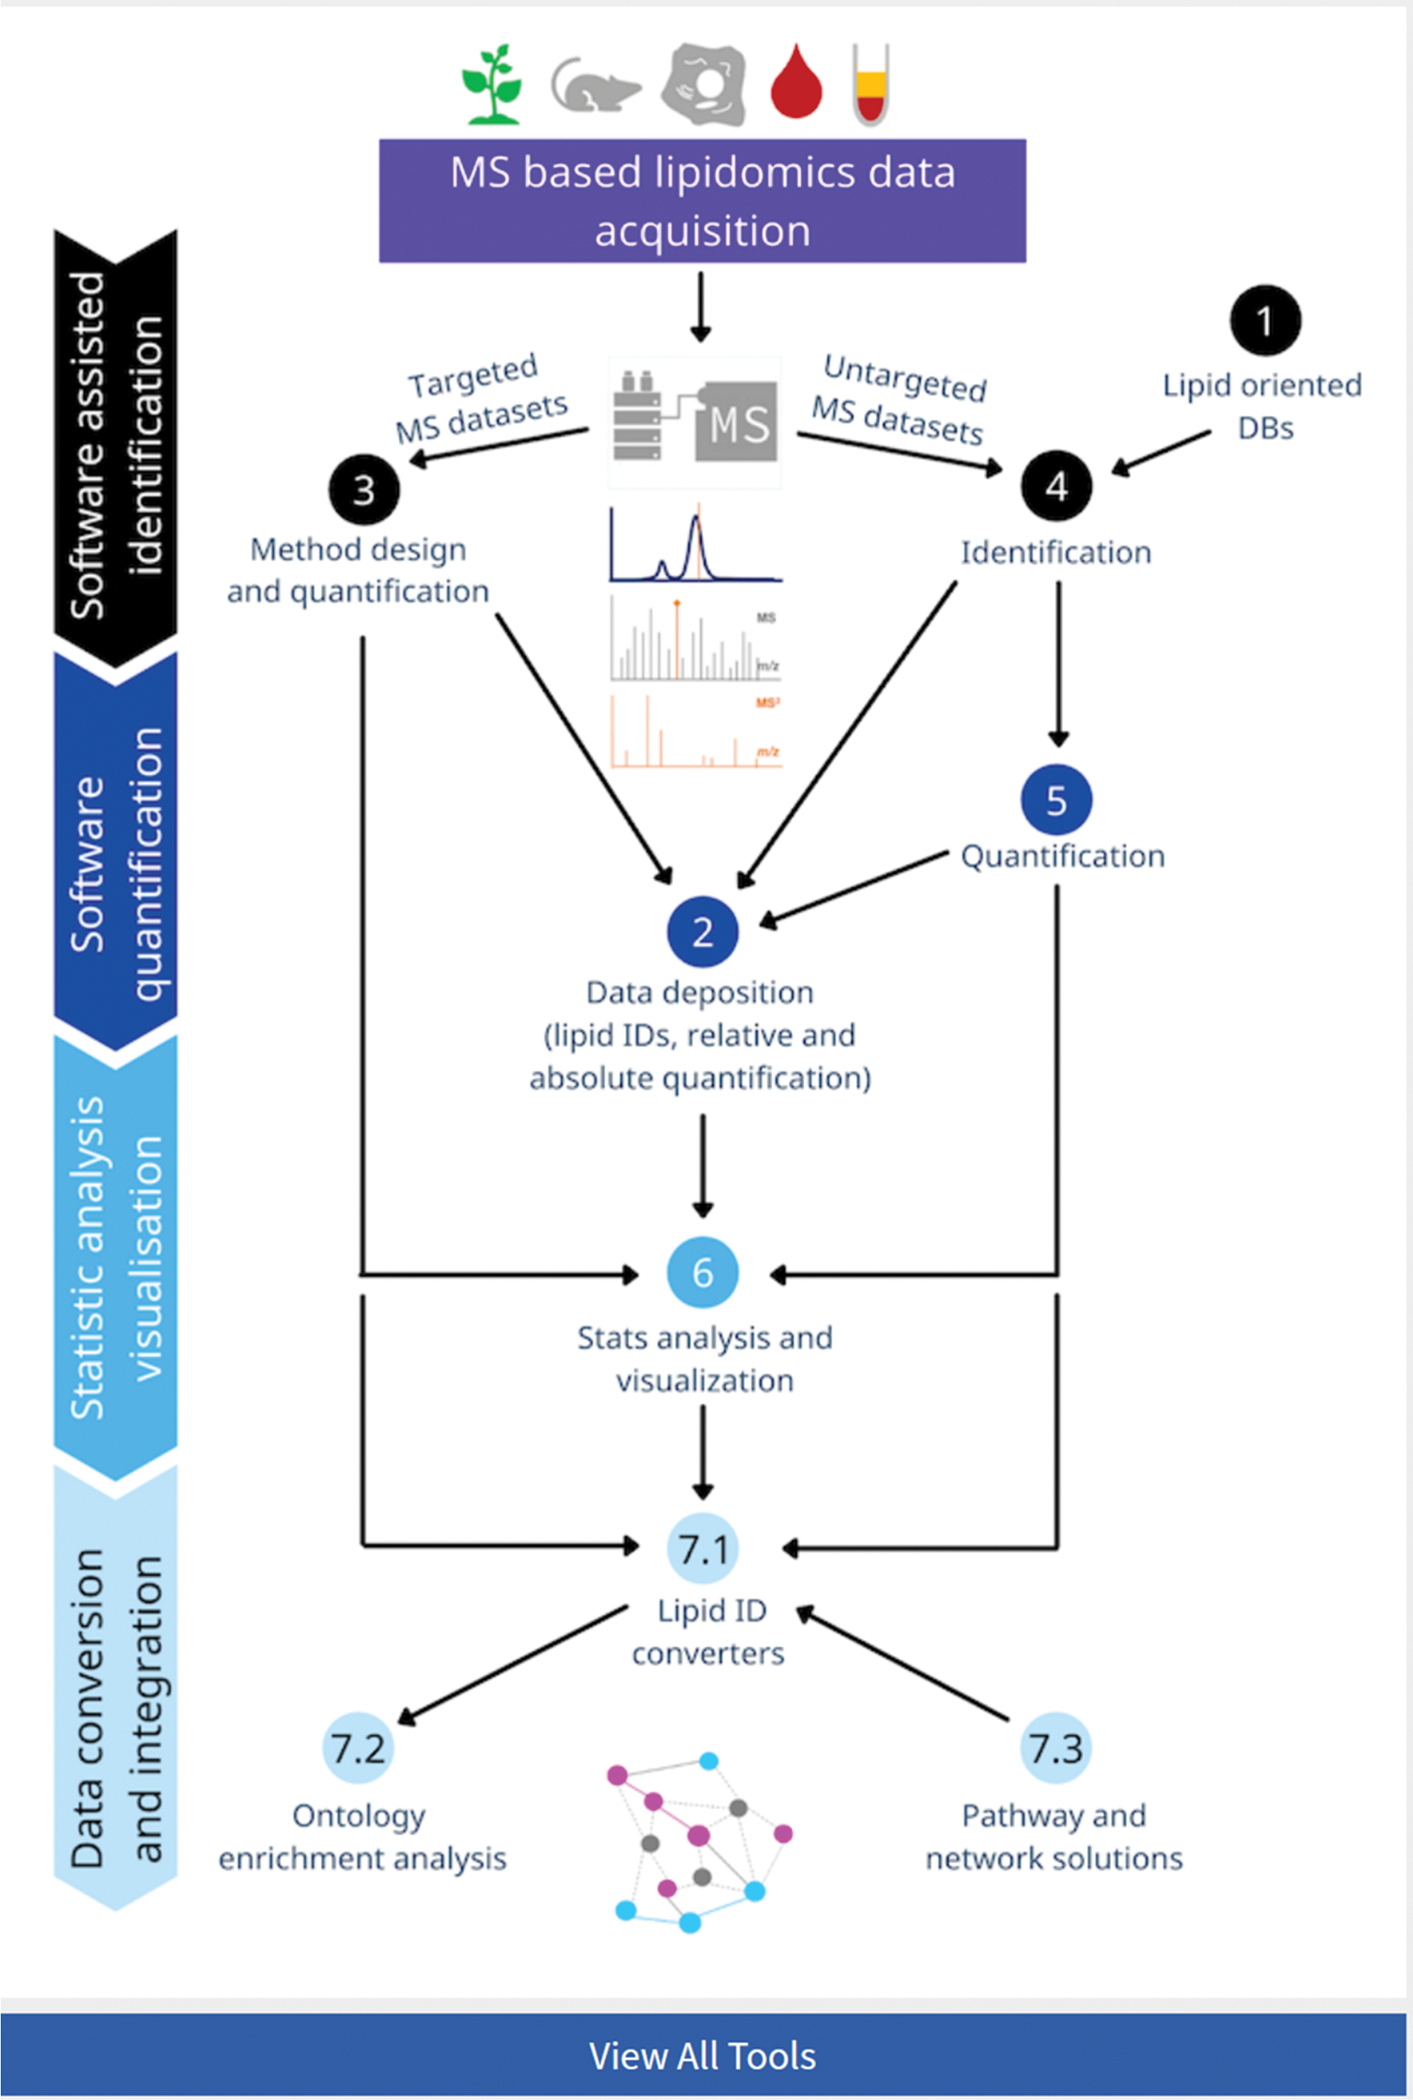
Each task is marked by a clickable button to redirect the user to the list of corresponding tools and their descriptions.
On the LIPID MAPS website, the tools are represented in the form of an interactive flow chart (https://www.lipidmaps.org/resources/tools?page=flow_chart) which covers available, open access solutions supported by a graphical user interface (GUI) for different types of lipidomics derived datasets. This is integrated into LIPID MAPS with links, descriptions, video tutorials and contact details for software developers. The new tool comprehensively covers the seven major areas in lipidomics data processing, as follows: (1) lipid-oriented databases, (2) MS data repositories, (3) analysis of targeted lipidomics datasets, (4) lipid identification and (5) quantification from untargeted lipidomics datasets, (6) statistical analysis and visualization, and (7) data integration solutions (Figure 2). To support informed decision making by lipidomics analysts, for each software a short description is provided, highlighting the main functionalities and the areas of applications, followed by the specific features listed under “Technical information” and “Task specific information” tabs (Figures 3 and 4). Additionally, user get review simplified, tabular representation of available function for each tool in a given section by using “Tools Overview” tab.
Figure 2. List of tools represented within LIPID MAPS Lipidomics Tools Guide assigned for each of the seven data processing categories.
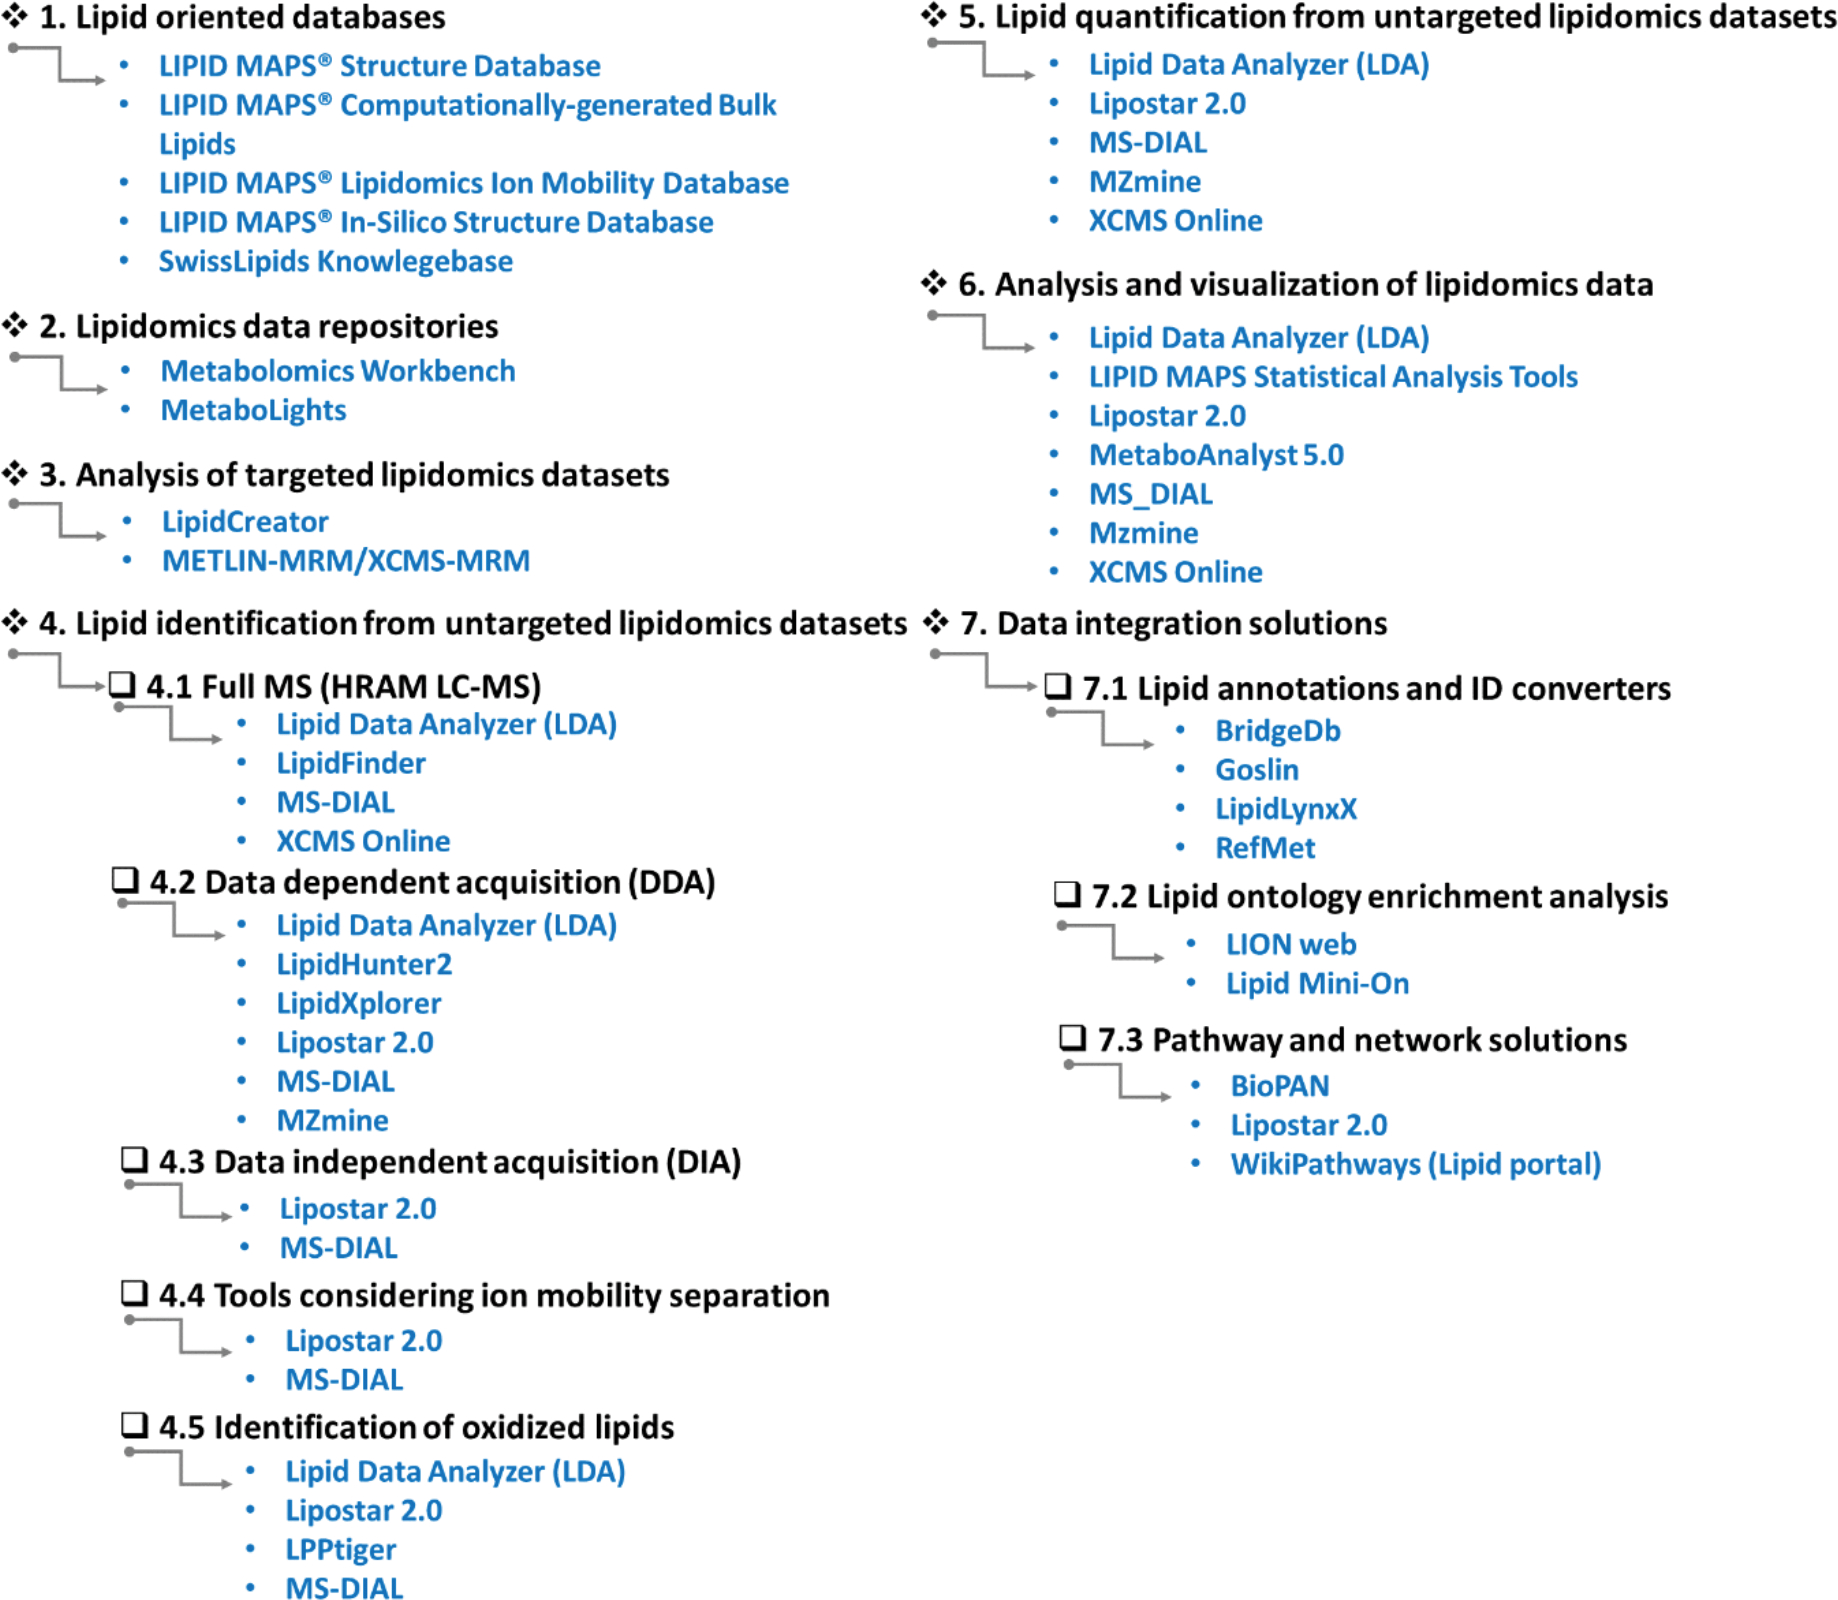
These include (1) lipid-oriented databases, (2) MS data repositories, (3) analysis of targeted lipidomics datasets, (4) lipid identification, and (5) quantification from untargeted lipidomics datasets, (6) statistical analysis and visualization, and (7) data integration solutions.
Figure 3. A screenshot example of individual tool details pages from LIPID MAPS Structure Database.
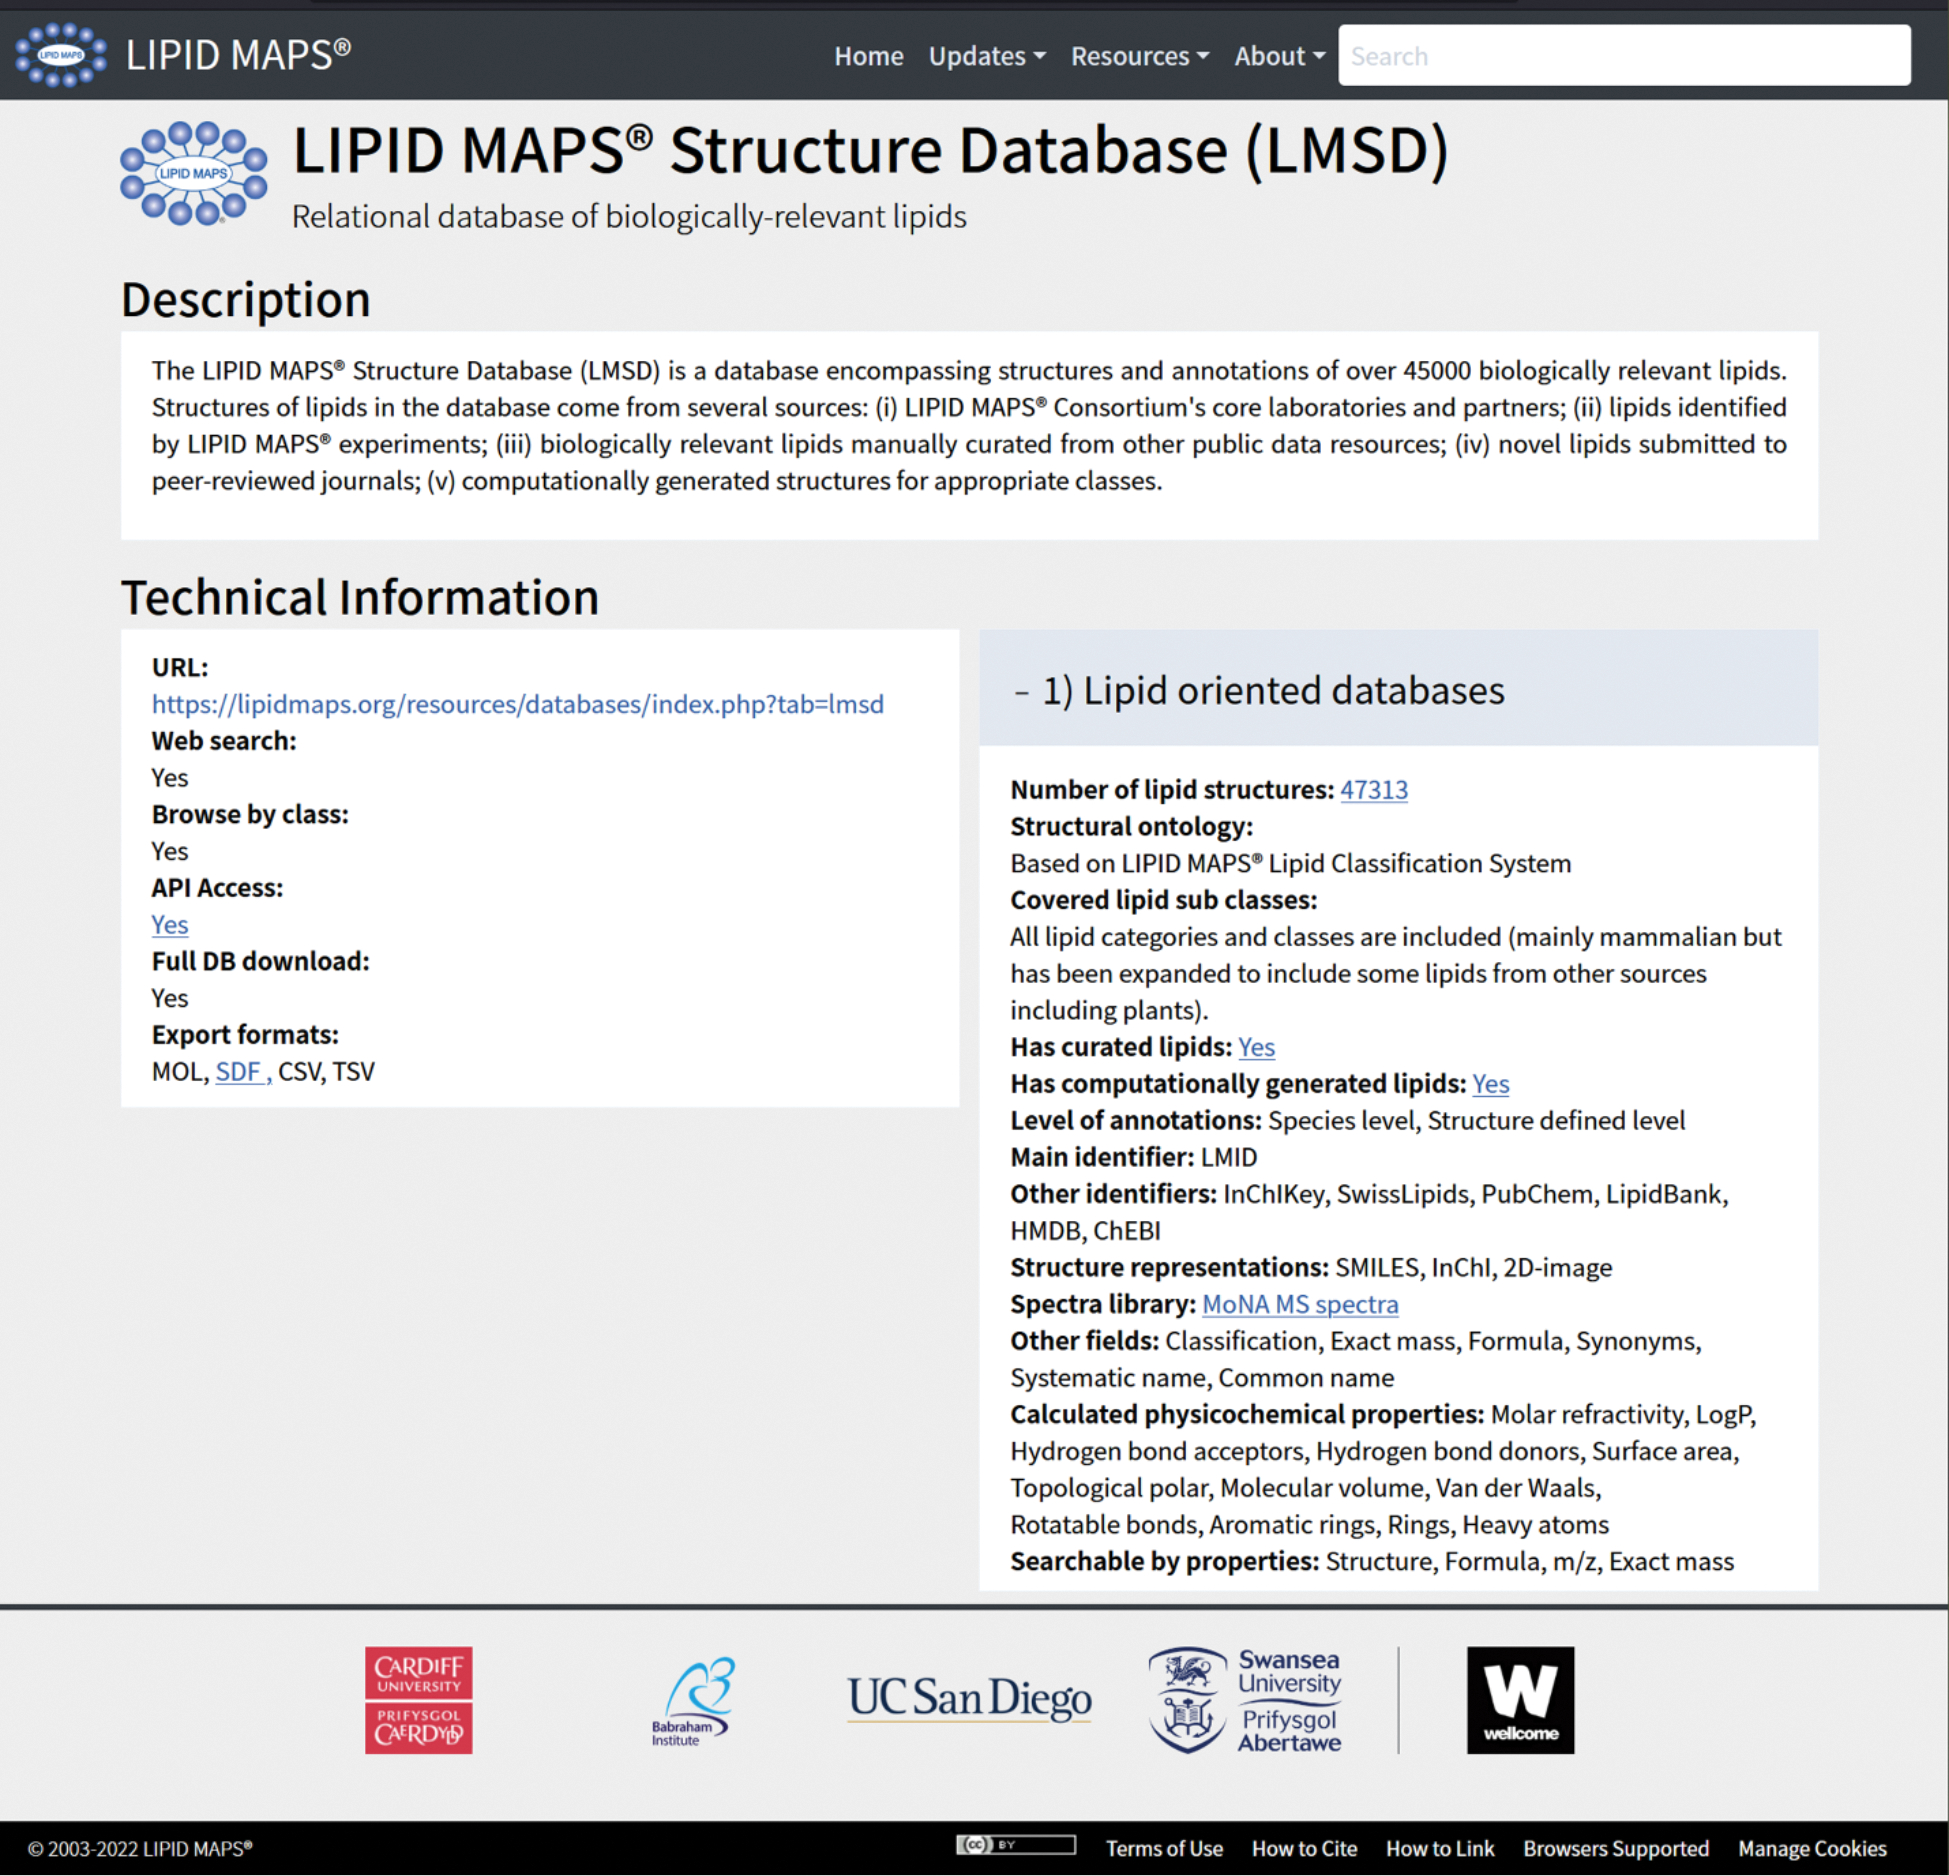
Each tool has three sections: a “Description” section for the brief introduction of the tool, a “Technical Information” section listing all essential technical information from links to compatible file formats, and a “Task specific information” section containing detailed features tailored to the corresponding task. Hovering on the underlined text field displays further features for the section.
Figure 4. A screenshot example of individual tool details pages LipidLynxX.
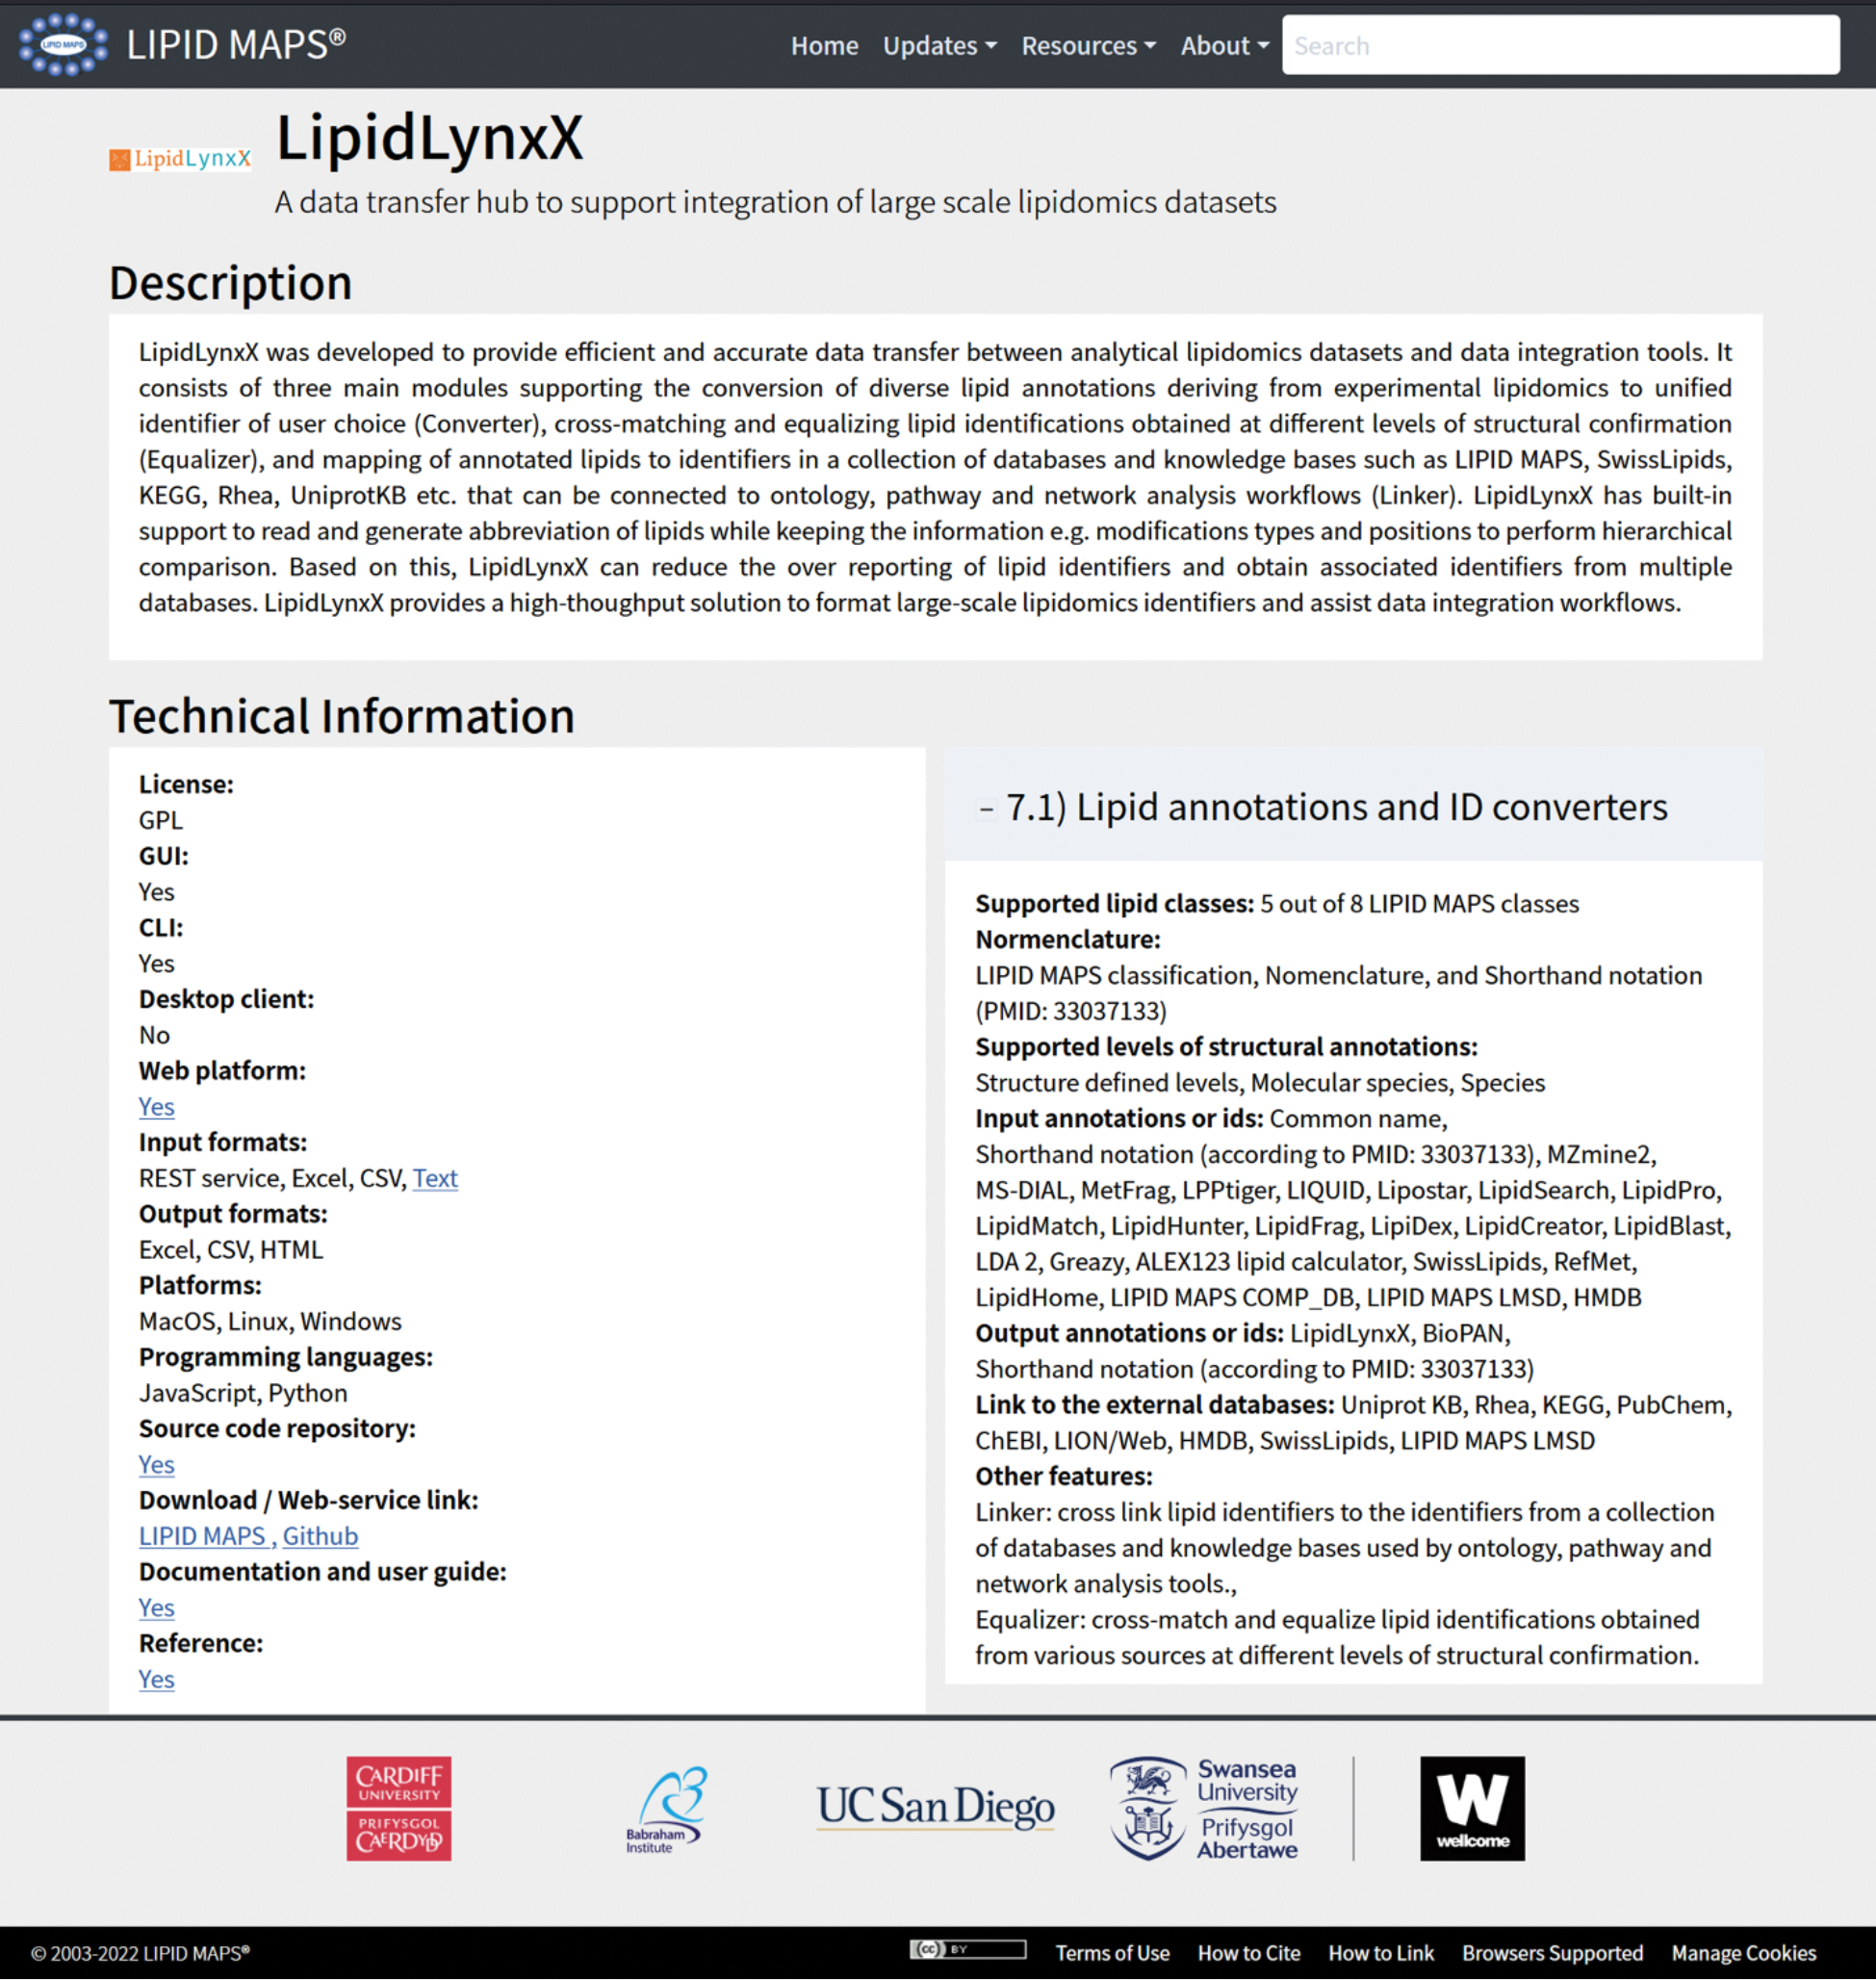
Each tool has three sections: a “Description” section for the brief introduction of the tool, a “Technical Information” section listing all essential technical information from links to compatible file formats, and a “Task specific information” section containing detailed features tailored to the corresponding task. Hovering on the underlined text field displays further features for the section.
In the “Technical information” section, users can view the type of the license under which the tool is distributed, the availability of desktop and/or web platform-based interfaces, data input/output formats, and compatibility with different operating systems (e.g. Windows, Linux, macOS). There is also information accessible via clickable links which allow the downloading of the tool together with related documentation, user guides and training datasets. Additional fields list how to use the tool through command line, or via API interfaces for advanced users wishing to construct their own customized pipelines. “Task specific information” tabs navigate users to pages describing functionalities of the software towards particular tasks covering the seven areas outlined above (Figures 1 and 2). Some comprehensive tools have multiple functions integrated into one combined package and can be configured for a wide range of workflows. These tools are assigned to each task with associated descriptions accordingly, and the list of tools is shown in Table 1. In the next section, we provide more details about each area and its associated software and tools.
Table 1. The list of tools covered by the interactive LIPID MAP Lipidomics Tools Guide assigned with the corresponding task.
URL, links to video tutorials (when available) and reference are provided for each tool.
The categories of lipidomics tools
1. Lipid oriented databases:
Databases that curate individual lipid structures, both from historical and new publications, into organised repositories are essential for researchers who aim to identify the specific molecules present in their biological samples. Databases also serve as a foundation for many data analysis pipelines as well as key knowledge bases for lipid research. Over the last 5–10 years, the size of lipidomics research datasets generated using MS and MS/MS has increased massively and their routine analysis requires automated programmatic approaches to enable database searching. To support selection of the databases suitable for a particular application, the “Task specific information” tabs within Lipid Oriented Databases section provide an overview of the database functionalities including the number of included lipid structures, structural ontology, covered lipid (sub)classes, levels of curation and annotation. Automated approaches to support data searchability and utility are described, including used identifiers, structural representation, availability of spectral libraries, and calculated physicochemical properties when available.
The most widely used lipid-specific databases are provided by LIPID MAPS and SwissLipids. LIPID MAPS hosts several databases in which lipid structures are catalogued, according to the LIPID MAPS nomenclature and classification22,46,47. Specific databases provide utility for different use-cases as follows. LIPID MAPS Structure Database (LMSD)22 contains over 47K lipids (status on April 2022) obtained from sources that include experimental work performed by the LIPID MAPS consortium, from other lipid databases, from the scientific literature, and also some that are computationally generated based on commonly occurring fatty acid chains in mammalian lipids. LMSD can return either bulk (lipid species) annotations for MS data, based on the shorthand nomenclature described by Liebisch et al 47, or fully annotated names (structure defined lipids), where users already have additional structural information, e.g. from tandem mass spectrometry experiments. LMSD has recently implemented a display of reaction data to link together lipid species by biochemical transformations. This was initially obtained from Rhea48, WikiPathways45, Reactome49, and other sources and is now in place for many generic lipids. This is in the process of being cascaded down to individual lipid species. In the case of (high resolution) MS experiments, the user may only have information on the m/z value of detected lipid ions. In this case, searching databases will provide information on elemental compositions and using this, generate putative matches. It is recommended to use the BULK search tool on LIPID MAPS in order to perform this operation since this returns shorthand nomenclature as a first step. Putative matches based on MS indicate the number of carbons in fatty acyl chains, and double bonds/rings present, but not how these are distributed between/within acyl chains in the molecule. For some users, the LIPID MAPS Computationally-generated Bulk Lipids (COMP_DB)22 may be a more suitable resource to query. This database contains over 59,000 lipid species in shorthand format (in the major classes such as fatty acyls, glycero- and glycerophospholipids, sterols, and sphingolipids), computationally generated from a list of commonly occurring acyl and alkyl chains. Most entries in this database represent hierarchical structures that could map to many different specific annotations. The LIPID MAPS In Silico Structure Database (LMISSD)22 contains over 1.1M entries derived from the computational expansion of headgroups and chains for common lipid classes. These are provided as specific structural annotations but can also be provided as a hierarchy of sum composition and chain composition. Last, The Lipidomic Ion Mobility Database22 was developed using data from the McLean and Griffin labs50–52 to provide collisional cross section measurements for drift tube MS experiments.
The SwissLipids knowledgebase23 was developed to aid lipidomics researchers to interpret experimental datasets and integrate them with prior biological knowledge, allowing also for data exploration and hypothesis generation. In SwissLipids, experimentally characterized lipids are curated from peer-reviewed literature using the ChEBI53 ontology (www.ebi.ac.uk/chebi/). Lipid metabolism is described using the Rhea knowledgebase48 for biochemical and transport reactions (www.rhea-db.org), itself based on ChEBI, while enzymes, transporters and interacting proteins are described using the UniProt Knowledgebase UniProtKB54 (www.uniprot.org), for which Rhea is the reference vocabulary for such annotation.55 As the number of experimentally characterized lipid structures represents only a small fraction of the possible structures that may exist in nature, expert curated knowledge of lipid structures and metabolism in ChEBI, Rhea and UniProt is used to design and create library of all theoretically feasible lipid structures in silico, which is fully mapped to these three resources. The current version of the SwissLipids library contains almost 600,000 lipid structures from over 550 lipid classes, organized into two distinct hierarchical lipid classifications – one that parallels the structural classification of LIPID MAPS56, and one based on the shorthand notation for MS-data57 that links lipid identifications from MS-based experiments to structures and biological knowledge.
2. MS data repositories:
Raw and/or processed data deposition using free repositories services, although a standard task prior publication of the results in the field of proteomics for many years, is only now finding its way into the lipidomics community58. MS data repositories increase data transparency and reproducibility, allow reanalysis for new discoveries and data-driven hypothesis generation as well as benchmarking of new software tools59. Although numerous platforms for upload of raw MS datasets exist (e.g. MassIVE: https://massive.ucsd.edu/, ProteomeXchange: http://www.proteomexchange.org/), specific functionalities to support metadata, sample preparation protocols, and data matrices are necessary to improve the reusability of the deposited datasets following FAIR principles60. To select the optimal solution for data upload/download, users would need to be informed about the types of stored raw, processed and metadata, curation strategy, total number of available datasets, and species coverage.
Repositories tuned for metabolomics and lipidomics data such as Metabolomic Workbench24 and MetaboLights25 have functionality to associate deposited data with compound query results to enhance the reusability of the datasets, allowing further interrogation. Each dataset is assigned a unique project accession ID, sufficient space to host the raw and/or processed data, supported by detailed information including study design, associated metadata, details on sample preparation, and analysis protocols. Datasets can be browsed and searched by specific keywords, organisms of origin, reported compounds, and are usually associated with a source publication. MetaboLights has unique fields for data transformation and metabolite identification, and provides an online viewer to review lipid identifiers, quantities, and corresponding structures, while MetabolomicsWorkbench is bundled with the RefMet42 data resource (containing over 160,000 annotated metabolite species including a large collection of lipids) and a suite of online data analysis tools. Metabolights and Metabolomics Workbench are accepted by mainstream journals as data repositories for publications of lipidomics datasets.
3. Analysis of targeted lipidomics datasets:
Lipidomics data acquisition strategies can be generally subdivided into targeted and untargeted workflows. In targeted lipidomics, a predefined set of lipids with known mass-to-charge ratio (m/z) of the precursor and fragment/product ion(s) need to be provided by the user before data acquisition. Moreover, optimisation of ionization and MS parameters for each pair of precursor–product ions (so called “transition”) must be performed to optimise sensitivity of the method. Targeted analysis using single or multiple reaction monitoring (SRM, MRM) on triple quadrupole instruments and more recently parallel reaction monitoring (PRM) on orbitrap and QTOF based instruments are successfully applied to the quantification of selected sets of lipids as well as hundreds of lipids in large sample cohorts (e.g. over 600 lipid species in one LC-MS/MS analysis61). However, to quantify a large number of lipids in a correspondingly large sample cohort, targeted lipidomics workflows should be quick to establish, and obtained results should be easy to inspect and validate. This process can be extremely time consuming and most often is not accessible to non-experts. Thus, specialized tools can be used to facilitate both method design and data processing steps. For software-assisted method design, the user should define the type of the targeted acquisition method planned (SRM/MRM, or PRM), and lipid (sub)classes/species aimed to be covered. The selection of transitions can be done among experimentally-validated or computationally-optimized or can be even predicted on-fly based on a common knowledge of lipid subclass specific gas phase fragmentation chemistry. The set of fragment ions and their yield will strongly depend on class, number of double bonds and fatty acyl length and even the type of instrument on which data were acquired. For instance, with LipidCreator26 the targeted assay can be generated in three steps. In brief, during step 1 the user would select the lipid category and class to work with and define fatty acyl, double bonds, hydroxyl group, and adduct constrains (precursor selection) as well as the polarity mode to analyse lipids of interest. In step 2 the monitored fragments at MS/MS level can be defined. In step 3 the designed molecules can be added to the target list, reviewed, and transferred to the MS instrument for data acquisition. METLIN-MRM27 is another data rich resource where users can choose from experimentally and/or computationally optimized transitions or even public repository transitions with links to corresponding DOIs.
Although method design requires careful optimization and is time consuming, post-acquisition data processing of targeted lipidomics datasets is relatively straightforward and follows general rules of LC-MS/MS based targeted quantification accepted in both the proteomics and metabolomics communities. Indeed, several open access tools originally developed for targeted analysis of peptides (Skyline) or metabolites (XCMS-MRM) have been adapted for lipidomics applications. Thus, LipidCreator is fully integrated with Skyline62 for small molecules, making it a vendor-independent software. METLIN-MRM assisted method development can be directly extended to post-acquisition data processing using the XCMS-MRM27 platform. Both Skyline and XCMS-MRM tools provide automated solutions for peak integration, relative and absolute quantification, and data quality control.
4. Lipid identification from untargeted lipidomics datasets:
A second analytical strategy commonly used in lipidomics relates to untargeted workflows based on data dependent (DDA) or data independent acquisition (DIA). Here users perform MS analysis of a lipidome in so-called “discovery” mode, without prior knowledge of the exact set of lipids to be analysed in the sample. Generally, the main aim of the untargeted lipidomics is to analyse and ideally identify as many lipid species as possible (ultimately all ionizable constituents extracted from the sample). Both DDA and DIA experiments rely on the iteration of instrument cycles which include MS1 survey scans (usually acquired at high resolution to define the elemental composition of the lipid ions) and a number of MS/MS spectra in which lipid ions, selected based on their abundance (DDA) or within a given m/z range (DIA), undergo collision-induced-dissociation (CID). MS/MS information is then used to assign lipids to particular molecular species based on their known gas phase fragmentation patterns. Thus, untargeted lipidomics experiments can support lipid identification at different levels of structural assignment with high resolution MS spectra providing elemental composition and thus the putative bulk composition of the lipid (e.g. PC 36:4) only, but with additional MS/MS information supporting the identification of lipids at molecular species levels (e.g. PC 16:0_20:4). Although this is possible by manually checking MS and corresponding MS/MS spectra, lipid identification requires automated solutions to support analysis throughput, as within commonly used LC-MS/MS DDA setups, thousands of individual MS/MS spectra are generated within a single analysis.
Due to the high demand and popularity of untargeted lipidomics workflows, numerous tools have been developed to support this area. Thus, the section of the interactive chart for untargeted lipidomics is represented by 9 software tools with open access for academic users. By clicking on the corresponding “Task specific information” tabs, users can get familiar with the tools which support specific acquisition strategies only, versus other tools which cover larger application areas. To support selection of the optimal identification tool the user can select between high resolution MS applications (Lipid Data Analyzer (LDA)63, LipidFinder29, MS-DIAL30, XCMS on-line31, DDA (LDA28,64, MS-DIAL, LipidHunter232, LipidXplorer33, Lipostar234, and MZmine35,65,66), DIA (MS-DIAL and Lipostar2), and even datasets acquired using ion mobility methods which provide orthogonal to LC-MS/MS separation (MS-DIAL, MZmine, Lipostar2). Furthermore, analysis of epilipidomics datasets focusing on the identification of oxidized lipids can be supported by LDA67, Lipostar2, LPPtiger36 and MS-DIAL tools. For each particular application listed above, the “Task specific information” tab provides the information about the main principles of operation and scoring, accuracy measures.
5. Lipid quantification from untargeted lipidomics datasets
The quantification of lipids provides their abundance (relative or absolute) in a biological sample, enabling comparison with other samples. Quantified values aid harmonization across lipidomics datasets. Quantitative analysis can be performed using data acquired from targeted and untargeted approaches regardless of whether they were acquired using Full-MS, DDA or DIA modes. Untargeted lipidomics quantification can be subdivided into relative (e.g. fold change between condition 1 vs condition 2) and semi-absolute (e.g. expressed in pmol/μg of proteins). Due to the extremely large diversity of lipid structures in natural lipidomes and relatively limited numbers of commercially available lipid standards, it is not feasible to perform absolute quantification at true lipidome level68,69. On the other hand, due to the close similarity in ionization and MS behaviour of lipids from the same subclass, the use of one or a small number of internal standards (ISTD) per subclass is currently considered as a compromise. Isotopic correction algorithms can be used during data processing to minimize the effect of structural differences between internal standards and individual lipid molecular species70. Lipids present a particular challenge for accurate identification since there will be several hundreds of lipids distributed over a relatively narrow m/z range (e.g. from 400 to 900 m/z), as well as a high number of isobaric and even isomeric species. Additionally, lipids are detected over a large dynamic range of concentrations in natural lipidomes. These issues result in significant challenges for accurate peak assignment and integration, and downstream accurate quantification69. Tools for processing quantitative lipidomics datasets have benefited from previously developed software solutions designed for quantitative proteomics and metabolomics. However, due to the special properties of lipids as outlined above, additional optimizations are necessary to ensure the accuracy of lipidomics data processing. For instance, data normalization using a preconfigured set of ISTD (e.g. Lipostar 2 and MS-DIAL) is introduced to simplify the normalization process and reduce post-processing of the data matrix. Additionally, robust peak picking and peak boundary selection algorithms are critical for obtaining accurate peak areas for quantitative analysis. Though several robust peak picking algorithms are available, manual adjustment and re-integration is often required due to the high number of isobaric and isomeric species. Additional features integrated within data processing tools such as peak alignment and deconvolution are important to handle lipid species with multiple adducts types and to process DIA datasets. Current available quantification tools such as LDA, Lipostar 2, MS-DIAL, MZmine, and XCMS on-line generally provide integrated pipelines from lipid identification up to quantification including essential normalization functions. For each tool, the “Task specific information” section within the LIPID MAPS Lipidomics Tools Guide displays multiple features to guide the choice of the tool based on user requirements, including details on quantification methods and accuracy measures.
6. Statistical analysis and visualization of lipidomics datasets:
Lipidomics research generates large datasets, and the complexity of experimental design is also increasing. Therefore, a critical bottleneck in lipidomics data processing is often the statistical analysis, which requires extensive use of tailored approaches that take into account the specific characteristics of lipid data. Different methods are available for the analysis of lipidomics data, each one with its own advantages and pitfalls. The choice of statistical methods to be applied should be first guided by the aim of the lipidomic study. When testing for statistical significance between pre-defined groups is desired (e.g., health vs. disease), differences between groups of samples is usually evaluated by applying parametric (e.g. t-test, ANOVA) or non-parametric (e.g. Wilcoxon signed-rank test, Kruskal-Wallis) statistical hypothesis tests71. With often over hundreds of lipids being considered in lipidomics experiments, the high number of variables increases the chance to find spurious correlated variables (false positives). Therefore, correction for multiple comparison testing is required. In addition, in lipidomics variables (lipids) are usually not all truly independent (for example, one lipid can be represented by several ions/adducts), meaning that corrections commonly applied for genomics/transcriptomics, such as Bonferroni or Benjamini Hochberg can significantly overcorrect. Here, softer corrections, such as Sequential Goodness of Fit represent an alternative that maybe more appropriate72.
Another consideration is that detected features might not always follow a normal distribution73. Thus, multivariate statistical approaches, in which all the variables are considered simultaneously, often by assuming they are correlated and not fully independent, are extensively applied in lipidomics. For explorative purposes, principal component analysis (PCA)74 represents the most widely used approach in omics, including lipidomics75. Using PCA, the original dataset is represented in a lower-dimensional subspace that maintains most of the relevant information (variance). Being an unsupervised method, PCA does not require a priori knowledge of the dataset and can be used not only to explore clusters of samples eventually formed but also for interpretation without imposing any information on classification or cluster association. Hierarchical or non-hierarchical clustering methods aim at grouping samples by similarity, which is measured utilizing statistical distances or similarities between samples76. Supervised regression algorithms for dimensionality reduction, as linear discriminant analysis77,78 or partial least squares discriminant analysis (PLS-DA)79,80, are also available to evaluate and classify sample identity. In addition to PLS-based methods, other machine learning approaches have been also used in lipidomics applications. Among them, supervised methods like support vector machine81 and random forest82 were used for classification purposes and can also be used for feature selection. Despite the wide availability of statistical tools applied to lipidomics, several potential issues need to be considered. For example, in large studies, the so-called “batch-effect” can hamper statistical analysis, and correction with internal standards and/or quality controls has to be made before the application of statistical tools. Also, missing data, which are the result of molecule concentrations below detection limits and very common in lipidomics, can be detrimental in model generation and interpretation, with some tools more sensitive than others75. Nevertheless, several strategies for missing data imputation have been proposed83.
Generally, the multi-functional tools described above for quantitative lipidomics all provide integrated platforms for statistical analysis and data visualization (LDA, Lipostar 2, MS-DIAL, MZmine, and XCMS on-line). Additionally, several tools were specifically developed to support chemometrics analysis and results visualization of metabolomics and lipidomics data (LIPID MAPS Statistical Analysis Tools37 and MetaboAnalyst 5.038). Integrated statistical analysis and visualization functions provide easy access to most common functions including univariate (parametric and non-parametric testing) as well as multivariate (non-supervised and supervised) solutions with a close interactive connection to the corresponding lipid quantification data matrix and often bundled with data pre-treatments including normalization, scaling, and visualization of filtered data subset. Dedicated tools (LIPID MAPS Statistical Analysis Tools and MetaboAnalyst 5.0) might require researchers to transform the quantification data according to specific templates for dataset import but can provide a more extensive set of statistical and visualization functions with detailed customizable configurations. MetaboAnalyst 5.0 for instance has a dedicated utility for batch-effect correction which contains nine methods well established in the field of metabolomics as well as eight methods for missing value imputation84.
7. Data integration solutions:
The ultimate aim of many lipidomics studies is to investigate biological relevance and mechanisms behind lipidome remodelling driven by the specific biological conditions. Considering the nature of “big data” produced by lipidomics experiments, manual evaluation of biological significance of obtained results would be extremely time consuming and require extensive knowledge in diverse areas of biochemistry and cell biology. Such advanced data integration goes well beyond single lipidomics data matrices and extends into related multiomics approaches using curated pathways or network analysis strategies. The combination and utilization of multiomics data from different sources require sophisticated data pre-treatments including manual curation and advanced bioinformatics solutions. This type of workflow can be generally divided into three steps: conversion of lipid annotations to their corresponding IDs within knowledge and ontology databases, lipid ontology enrichment, and advanced pathway/network analysis.
Tools that are capable of bridging lipid annotations supported by purely lipidomics software with the structural or functional IDs in data integration tools provide the first critical step towards systems biology integration of lipidomics datasets. To reduce the complexity of ID cross-validation and database queries, several tools are available to assist this conversion (Goslin40, LipidLynxX41, and RefMet42) and to link lipid identifiers to various databases (BridgeDb39, Goslin, LipidLynxX, and RefMet). For example, BridgeDb has mappings to other databases for almost 19K LIPID MAPS identifiers85.
Biological interpretation of lipidomics data is often driven by the focus on individual lipids. Although this approach is useful in biomarker discovery, it obscures the possible effects of shared properties of molecules related to the biological phenomenon. A way to circumvent this is to manually curate lipid groups that share specific properties (e.g., lipid class, level of unsaturation) and report aggregate statistics. However, the manual construction of these groups is often laborious due to the ambiguity in lipid nomenclature and introduces a risk of cherry-picking. Ontologies, formalizations of concepts, and their relations have been successful in other omics fields to provide frameworks for constructing groups of molecules with shared biological properties. For lipidomics data, several ontologies, such as Lipid Ontology (LION/Web)16 and Lipid Mini-On43, are useful in aiding in the biological interpretation. Currently, LION links over 50,000 lipids to chemical (e.g., LIPID MAPS classification, fatty acid associations), physiochemical (e.g., membrane fluidity, intrinsic curvature), and cell biological (e.g., predominant subcellular localization) properties and Lipid Mini-On uses a text mining strategy to attribute Lipid Ontology (LO) structural terms to lipids.
Typically, ontology-derived groups of molecules (‘terms’) are analysed using enrichment analysis approaches. In these analyses, a given term is enriched if the molecules belonging to the term are overrepresented in a target-list, or are higher ranked in a list of molecules ordered by a statistic (e.g., fold-change, P-value) than expected by chance. Both LION/web and Lipid Mini-On are freely available online tools that performs ontology-term enrichment analysis of user-provided lipidomics data. LION/web allows specific LION-term categories to be included for analysis. After submission, LION/web reports descriptive matching statistics and enrichment analysis, as well as publication-ready figures. Traditionally, enrichment analyses compare two groups of samples. To analyse datasets with more sample groups, LION/web was recently expanded with the PCA-LION heatmap module. This module generates a heatmap showing the most dynamic LION-terms for all samples based on the enrichment analysis of a given number of principle components. Lipid IDs of significant enriched terms can be further mapped to available pathways and networks to investigate the changes at systems level. Lipid Mini-On enables to generate a variety of visualization of lipid enrichment by structural characteristics. Lipids and their associated LO terms can be visualized as a network to hierarchize interpretations of the enrichment performed.
Several tools are available to support pathway and network analysis of lipidomics datasets including integrated pathway graph analysis modules in Lipostar 2, stand-alone web application BioPAN44, which allows the visualisation of quantitative lipidomics data in the context of known biosynthetic pathways as well as the central hub of community driven pathways represented by the Lipid Portal on WikiPathways45, in collaboration with LIPID MAPS Though more advanced analysis can be performed with highly customized programs and scripts by experienced bioinformaticians, these tools provide simple interfaces for researchers to begin to map lipidomics data to obtain essential lipid centric analysis results from predefined pathways and networks in e.g., PathVisio86 and Cytoscape87. Furthermore, the pathways from WikiPathways can be easily converted to a network through the WikiPathways App88, after which these networks can be extended with additional knowledge such as miRNAs, transcription factors, or drugs, through the CyTargetLinker89 app.
Conclusion
Lipidomics is a fast-growing field, which increasingly is supporting the analysis of ever larger datasets of high complexity. To assist with high-throughput data processing, many new software tools have been developed by academic researchers, and are now openly available on developers’ websites. To guide the user, and provide a point of contact for finding these tools, in this review, we provide detailed specifications on the most widely used software packages for lipidomics along with a complimentary interactive Lipidomics Tools Guide available on LIPID MAPS. Two tutorials are provided as Supplementary Notes exemplify interoperability of the Guide and how to combine different tools for targeted and untargeted lipidomics experiments. This portal can help researchers to construct a complete lipidomics data analysis workflow starting with lipid identification and quantification till advanced visualization and data integration using open access software solutions with clickable graphical user interface. The lipidomics Tools Guide will be regularly reviewed and updated to reflect new developments in the field as well as continuously support the listed tools. Moreover, the Guide can be updated upon request by authors of the software, within the scope of this resource. The LIPID MAPS interactive Lipidomics Tools Guide (https://www.lipidmaps.org/resources/tools?page=flow_chart) summarizes essential information about each tools to assist beginners in lipidomics as well as advanced data scientists in selecting the most suitable tool for each of the steps in the processing of MS-derived lipidomics data.
Supplementary Material
Acknowledgements:
This publication is based upon work from COST Action EpiLipidNET, Pan-European Network in Lipidomics and Epilipidomics (CA19105; https://www.epilipid.net), supported by COST (European Cooperation in Science and Technology). Funding from the Wellcome Trust is gratefully acknowledged for LIPID MAPS (203014/Z/16/Z). LIPID MAPS receives sponsorship from Cayman Chemical, Merck and Avanti Polar Lipids. T.P. is supported by the Czech Science Foundation Grant 21–11563M. “{Sonderzuweisung zur Unterstützung profilbestimmender Struktureinheiten 2021” by the SMWK is gratefully acknowledged.
References
- 1.Wenk MR The emerging field of lipidomics. Nature Reviews Drug Discovery 4, 594–610 (2005). [DOI] [PubMed] [Google Scholar]
- 2.Yang K & Han X Lipidomics: Techniques, Applications, and Outcomes Related to Biomedical Sciences. Trends in Biochemical Sciences 41, 954–969 (2016). [DOI] [PMC free article] [PubMed] [Google Scholar]
- 3.Wood PL Lipidomics of Alzheimer’s disease: Current status. Alzheimer’s Research and Therapy 4, 1–10 (2012). [DOI] [PMC free article] [PubMed] [Google Scholar]
- 4.Meikle PJ, Wong G, Barlow CK & Kingwell BA Lipidomics: Potential role in risk prediction and therapeutic monitoring for diabetes and cardiovascular disease. Pharmacology & Therapeutics 143, 12–23 (2014). [DOI] [PubMed] [Google Scholar]
- 5.Yang L et al. Recent advances in lipidomics for disease research. Journal of Separation Science 39, 38–50 (2016). [DOI] [PubMed] [Google Scholar]
- 6.Watson AD Thematic review series: Systems Biology Approaches to Metabolic and Cardiovascular Disorders. Lipidomics: a global approach to lipid analysis in biological systems. Journal of Lipid Research 47, 2101–2111 (2006). [DOI] [PubMed] [Google Scholar]
- 7.Hu C et al. Analytical strategies in lipidomics and applications in disease biomarker discovery. Journal of Chromatography B 877, 2836–2846 (2009). [DOI] [PubMed] [Google Scholar]
- 8.Shevchenko A & Simons K Lipidomics: coming to grips with lipid diversity. Nature Reviews Molecular Cell Biology 2010 11:8 11, 593–598 (2010). [DOI] [PubMed] [Google Scholar]
- 9.Vvedenskaya O et al. Nonalcoholic fatty liver disease stratification by liver lipidomics. Journal of Lipid Research 62, 100104–100105 (2021). [DOI] [PMC free article] [PubMed] [Google Scholar]
- 10.Vvedenskaya O, Wang Y, Ackerman JM, Knittelfelder O & Shevchenko A Analytical challenges in human plasma lipidomics: A winding path towards the truth. TrAC Trends in Analytical Chemistry 120, 115277 (2019). [Google Scholar]
- 11.Durcin M et al. Characterisation of adipocyte-derived extracellular vesicle subtypes identifies distinct protein and lipid signatures for large and small extracellular vesicles. Journal of Extracellular Vesicles 6, (2017). [DOI] [PMC free article] [PubMed] [Google Scholar]
- 12.Durgan J et al. Non-canonical autophagy drives alternative ATG8 conjugation to phosphatidylserine. Molecular Cell 81, 2031–2040.e8 (2021). [DOI] [PMC free article] [PubMed] [Google Scholar]
- 13.Zhuang X et al. The circadian clock components BMAL1 and REV-ERBα regulate flavivirus replication. Nature Communications 2019 10:1 10, 1–13 (2019). [DOI] [PMC free article] [PubMed] [Google Scholar]
- 14.Zhang Y et al. Asymmetric opening of the homopentameric 5-HT3A serotonin receptor in lipid bilayers. Nature Communications 2021 12:1 12, 1–15 (2021). [DOI] [PMC free article] [PubMed] [Google Scholar]
- 15.Saud Z et al. The SARS-CoV2 envelope differs from host cells, exposes procoagulant lipids, and is disrupted in vivo by oral rinses. Journal of Lipid Research 63, 100208 (2022). [DOI] [PMC free article] [PubMed] [Google Scholar]
- 16.Molenaar MR et al. LION/web: A web-based ontology enrichment tool for lipidomic data analysis. Gigascience 8, 1–10 (2019). [DOI] [PMC free article] [PubMed] [Google Scholar]
- 17.Lu RJ et al. Multi-omic profiling of primary mouse neutrophils predicts a pattern of sex- and age-related functional regulation. Nature Aging 2021 1:8 1, 715–733 (2021). [DOI] [PMC free article] [PubMed] [Google Scholar]
- 18.Green CL et al. Sex and genetic background define the metabolic, physiologic, and molecular response to protein restriction. Cell Metabolism 34, 209–226.e5 (2022). [DOI] [PMC free article] [PubMed] [Google Scholar]
- 19.Beyer BA et al. Metabolomics-based discovery of a metabolite that enhances oligodendrocyte maturation. Nature Chemical Biology 2017 14:1 14, 22–28 (2017). [DOI] [PMC free article] [PubMed] [Google Scholar]
- 20.Rappez L et al. SpaceM reveals metabolic states of single cells. Nature Methods 2021 18:7 18, 799–805 (2021). [DOI] [PMC free article] [PubMed] [Google Scholar]
- 21.Patti GJ et al. Metabolomics implicates altered sphingolipids in chronic pain of neuropathic origin. Nature Chemical Biology 2011 8:3 8, 232–234 (2012). [DOI] [PMC free article] [PubMed] [Google Scholar]
- 22.Sud M et al. LMSD: LIPID MAPS structure database. Nucleic Acids Research 35, D527–D532 (2007). [DOI] [PMC free article] [PubMed] [Google Scholar]
- 23.Aimo L et al. The SwissLipids knowledgebase for lipid biology. Bioinformatics 31, 2860–2866 (2015). [DOI] [PMC free article] [PubMed] [Google Scholar]
- 24.Sud M et al. Metabolomics Workbench: An international repository for metabolomics data and metadata, metabolite standards, protocols, tutorials and training, and analysis tools. Nucleic Acids Research 44, D463–D470 (2016). [DOI] [PMC free article] [PubMed] [Google Scholar]
- 25.Haug K et al. MetaboLights: a resource evolving in response to the needs of its scientific community. Nucleic Acids Research 48, D440–D444 (2020). [DOI] [PMC free article] [PubMed] [Google Scholar]
- 26.Peng B et al. LipidCreator workbench to probe the lipidomic landscape. Nature Communications 2020 11:1 11, 1–14 (2020). [DOI] [PMC free article] [PubMed] [Google Scholar]
- 27.Domingo-Almenara X et al. XCMS-MRM and METLIN-MRM: a cloud library and public resource for targeted analysis of small molecules. Nature Methods 15, 681–684 (2018). [DOI] [PMC free article] [PubMed] [Google Scholar]
- 28.Hartler J et al. Deciphering lipid structures based on platform-independent decision rules. Nature Methods 2017 14:12 14, 1171–1174 (2017). [DOI] [PMC free article] [PubMed] [Google Scholar]
- 29.Fahy E et al. LipidFinder on LIPID MAPS: peak filtering, MS searching and statistical analysis for lipidomics. Bioinformatics 35, 685–687 (2018). [DOI] [PMC free article] [PubMed] [Google Scholar]
- 30.Tsugawa H et al. A lipidome atlas in MS-DIAL 4. Nature Biotechnology 38, 1159–1163 (2020). [DOI] [PubMed] [Google Scholar]
- 31.Tautenhahn R, Patti GJ, Rinehart D & Siuzdak G XCMS online: A web-based platform to process untargeted metabolomic data. Analytical Chemistry 84, 5035–5039 (2012). [DOI] [PMC free article] [PubMed] [Google Scholar]
- 32.Ni Z, Angelidou G, Lange M, Hoffmann R & Fedorova M LipidHunter Identifies Phospholipids by High-Throughput Processing of LC-MS and Shotgun Lipidomics Datasets. Analytical Chemistry 89, 8800–8807 (2017). [DOI] [PubMed] [Google Scholar]
- 33.Herzog R et al. LipidXplorer: A Software for Consensual Cross-Platform Lipidomics. PLOS ONE 7, e29851 (2012). [DOI] [PMC free article] [PubMed] [Google Scholar]
- 34.Goracci L et al. Lipostar, a Comprehensive Platform-Neutral Cheminformatics Tool for Lipidomics. Analytical Chemistry 89, 6257–6264 (2017). [DOI] [PubMed] [Google Scholar]
- 35.Pluskal T, Castillo S, Villar-Briones A & Orešič M MZmine 2: Modular framework for processing, visualizing, and analyzing mass spectrometry-based molecular profile data. BMC Bioinformatics 11, 1–11 (2010). [DOI] [PMC free article] [PubMed] [Google Scholar]
- 36.Ni Z, Angelidou G, Hoffmann R & Fedorova M LPPtiger software for lipidome-specific prediction and identification of oxidized phospholipids from LC-MS datasets. Scientific Reports 7, 15138 (2017). [DOI] [PMC free article] [PubMed] [Google Scholar]
- 37.Fahy E, Sud M, Cotter D & Subramaniam S LIPID MAPS online tools for lipid research. Nucleic Acids Research 35, W606–W612 (2007). [DOI] [PMC free article] [PubMed] [Google Scholar]
- 38.Pang Z et al. MetaboAnalyst 5.0: narrowing the gap between raw spectra and functional insights. Nucleic Acids Research 49, W388–W396 (2021). [DOI] [PMC free article] [PubMed] [Google Scholar]
- 39.Ding D et al. The BridgeDb framework: standardized access to gene, protein and metabolite identifier mapping services. BMC Bioinformatics 11, (2010). [DOI] [PMC free article] [PubMed] [Google Scholar]
- 40.Kopczynski D, Hoffmann N, Peng B & Ahrends R Goslin: A grammar of succinct lipid nomenclature. Analytical Chemistry 92, 10957–10960 (2020). [DOI] [PMC free article] [PubMed] [Google Scholar]
- 41.Ni Z & Fedorova M LipidLynxX: a data transfer hub to support integration of large scale lipidomics datasets. bioRxiv (2020) doi: 10.1101/2020.04.09.033894. [DOI] [Google Scholar]
- 42.Fahy E & Subramaniam S RefMet: a reference nomenclature for metabolomics. Nat Methods 17, 1173–1174 (2020). [DOI] [PubMed] [Google Scholar]
- 43.Clair G et al. Lipid Mini-On: Mining and ontology tool for enrichment analysis of lipidomic data. Bioinformatics 35, 4507–4508 (2019). [DOI] [PMC free article] [PubMed] [Google Scholar]
- 44.Gaud C et al. BioPAN: a web-based tool to explore mammalian lipidome metabolic pathways on LIPID MAPS. F1000Res 10, 4 (2021). [DOI] [PMC free article] [PubMed] [Google Scholar]
- 45.Martens M et al. WikiPathways: connecting communities. Nucleic Acids Research 49, D613–D621 (2021). [DOI] [PMC free article] [PubMed] [Google Scholar]
- 46.Fahy E et al. Update of the LIPID MAPS comprehensive classification system for lipids. Journal of Lipid Research vol. 50 S9–S14 (2009). [DOI] [PMC free article] [PubMed] [Google Scholar]
- 47.Liebisch G et al. Update on LIPID MAPS Classification, Nomenclature and Shorthand Notation for MS-derived Lipid Structures. J Lipid Res jlr.S120001025 (2020) doi: 10.1194/jlr.S120001025. [DOI] [PMC free article] [PubMed] [Google Scholar]
- 48.Bansal P et al. Rhea, the reaction knowledgebase in 2022. Nucleic Acids Res 50, D693–D700 (2022). [DOI] [PMC free article] [PubMed] [Google Scholar]
- 49.Gillespie M et al. The reactome pathway knowledgebase 2022. Nucleic Acids Res 50, D687–D692 (2022). [DOI] [PMC free article] [PubMed] [Google Scholar]
- 50.Stow SM et al. An Interlaboratory Evaluation of Drift Tube Ion Mobility-Mass Spectrometry Collision Cross Section Measurements. Analytical Chemistry 89, 9048–9055 (2017). [DOI] [PMC free article] [PubMed] [Google Scholar]
- 51.Hinz C et al. A Comprehensive UHPLC Ion Mobility Quadrupole Time-of-Flight Method for Profiling and Quantification of Eicosanoids, Other Oxylipins, and Fatty Acids. Analytical Chemistry 91, 8025–8035 (2019). [DOI] [PMC free article] [PubMed] [Google Scholar]
- 52.Leaptrot KL, May JC, Dodds JN & McLean JA Ion mobility conformational lipid atlas for high confidence lipidomics. Nature Communications 10, 985 (2019). [DOI] [PMC free article] [PubMed] [Google Scholar]
- 53.Hastings J et al. ChEBI in 2016: Improved services and an expanding collection of metabolites. Nucleic Acids Res 44, D1214–D1219 (2016). [DOI] [PMC free article] [PubMed] [Google Scholar]
- 54.Bateman A et al. UniProt: the universal protein knowledgebase in 2021. Nucleic Acids Res 49, D480–D489 (2021). [DOI] [PMC free article] [PubMed] [Google Scholar]
- 55.Morgat A et al. Enzyme annotation in UniProtKB using Rhea. Bioinformatics 36, 1896–1901 (2020). [DOI] [PMC free article] [PubMed] [Google Scholar]
- 56.Fahy E et al. A comprehensive classification system for lipids. Journal of Lipid Research 46, 839–861 (2005). [DOI] [PubMed] [Google Scholar]
- 57.Liebisch G et al. Shorthand notation for lipid structures derived from mass spectrometry. J Lipid Res 54, 1523–30 (2013). [DOI] [PMC free article] [PubMed] [Google Scholar]
- 58.Odonnell VB et al. Steps Toward Minimal Reporting Standards for Lipidomics Mass Spectrometry in Biomedical Research Publications. Circulation: Genomic and Precision Medicine 737–741 (2020) doi: 10.1161/CIRCGEN.120.003019. [DOI] [PMC free article] [PubMed] [Google Scholar]
- 59.Tsugawa H et al. Mass Spectrometry Data Repository Enhances Novel Metabolite Discoveries with Advances in Computational Metabolomics. Metabolites 9, 119 (2019). [DOI] [PMC free article] [PubMed] [Google Scholar]
- 60.Wilkinson MD et al. The FAIR Guiding Principles for scientific data management and stewardship. Sci Data 3, 160018 (2016). [DOI] [PMC free article] [PubMed] [Google Scholar]
- 61.Huynh K et al. High-Throughput Plasma Lipidomics: Detailed Mapping of the Associations with Cardiometabolic Risk Factors. Cell Chemical Biology 26, 71–84.e4 (2019). [DOI] [PubMed] [Google Scholar]
- 62.Adams KJ et al. Skyline for Small Molecules: A Unifying Software Package for Quantitative Metabolomics. Journal of Proteome Research 19, 1447–1458 (2020). [DOI] [PMC free article] [PubMed] [Google Scholar]
- 63.Hartler J et al. Lipid Data Analyzer: unattended identification and quantitation of lipids in LC-MS data. Bioinformatics 27, 572–577 (2010). [DOI] [PubMed] [Google Scholar]
- 64.Hartler J et al. Automated Annotation of Sphingolipids including Accurate Identification of Hydroxylation Sites Using MS nData. Analytical Chemistry 92, 14054–14062 (2020). [DOI] [PMC free article] [PubMed] [Google Scholar]
- 65.Korf A et al. Three-dimensional Kendrick mass plots as a tool for graphical lipid identification. Rapid Communications in Mass Spectrometry 32, 981–991 (2018). [DOI] [PubMed] [Google Scholar]
- 66.Korf A, Jeck V, Schmid R, Helmer PO & Hayen H Lipid Species Annotation at Double Bond Position Level with Custom Databases by Extension of the MZmine 2 Open-Source Software Package. Analytical Chemistry 91, 5098–5105 (2019). [DOI] [PubMed] [Google Scholar]
- 67.Krettler CA, Hartler J & Thallinger GG Identification and Quantification of Oxidized Lipids in LC-MS Lipidomics Data. Studies in Health Technology and Informatics 271, 39–48 (2020). [DOI] [PubMed] [Google Scholar]
- 68.Wang M, Wang C & Han X Selection of internal standards for accurate quantification of complex lipid species in biological extracts by electrospray ionization mass spectrometry—What, how and why? Mass Spectrometry Reviews 36, 693–714 (2017). [DOI] [PMC free article] [PubMed] [Google Scholar]
- 69.Khoury S et al. Quantification of Lipids: Model, Reality, and Compromise. Biomolecules 8, (2018). [DOI] [PMC free article] [PubMed] [Google Scholar]
- 70.Lange M & Fedorova M Evaluation of lipid quantification accuracy using HILIC and RPLC MS on the example of NIST® SRM® 1950 metabolites in human plasma. Analytical and Bioanalytical Chemistry 412, 3573–3584 (2020). [DOI] [PMC free article] [PubMed] [Google Scholar]
- 71.Miller J. N. (James N.), Miller J. C. (Jane C. & Miller RD (Chemist). Statistics and chemometrics for analytical chemistry. 292. [Google Scholar]
- 72.Carvajal-Rodríguez A, de Uña-Alvarez J & Rolán-Alvarez E A new multitest correction (SGoF) that increases its statistical power when increasing the number of tests. BMC Bioinformatics 10, 209 (2009). [DOI] [PMC free article] [PubMed] [Google Scholar]
- 73.Griffin JL, Liggi S & Hall Z CHAPTER 2:Multivariate Statistics in Lipidomics. New Developments in Mass Spectrometry 2020-January, 25–48 (2020). [Google Scholar]
- 74.Wold S, Esbensen K & Geladi P Principal component analysis. Chemometrics and Intelligent Laboratory Systems 2, 37–52 (1987). [Google Scholar]
- 75.Checa A, Bedia C & Jaumot J Lipidomic data analysis: Tutorial, practical guidelines and applications. Analytica Chimica Acta 885, 1–16 (2015). [DOI] [PubMed] [Google Scholar]
- 76.Kaya Gülağiz F & Şahin S Comparison of Hierarchical and Non-Hierarchical Clustering Algorithms. International Journal of Computer Engineering and Information Technology 9, 6–14 (2017). [Google Scholar]
- 77.Mika S, Ratsch G, Weston J, Scholkopf B & Muller KR Fisher discriminant analysis with kernels. Neural Networks for Signal Processing - Proceedings of the IEEE Workshop 41–48 (1999) doi: 10.1109/NNSP.1999.788121. [DOI] [Google Scholar]
- 78.Tharwat A, Gaber T, Ibrahim A & Hassanien AE Linear discriminant analysis: A detailed tutorial. AI Communications 30, 169–190 (2017). [Google Scholar]
- 79.Wold S, Sjöström M & Eriksson L PLS-regression: a basic tool of chemometrics. Chemometrics and Intelligent Laboratory Systems 58, 109–130 (2001). [Google Scholar]
- 80.Lee LC, Liong CY & Jemain AA Partial least squares-discriminant analysis (PLS-DA) for classification of high-dimensional (HD) data: a review of contemporary practice strategies and knowledge gaps. Analyst 143, 3526–3539 (2018). [DOI] [PubMed] [Google Scholar]
- 81.Cortes C, Vapnik V & Saitta L Support-vector networks. Machine Learning 1995 20:3 20, 273–297 (1995). [Google Scholar]
- 82.Breiman L Random Forests. Machine Learning 2001 45:1 45, 5–32 (2001). [Google Scholar]
- 83.Gromski PS et al. Influence of Missing Values Substitutes on Multivariate Analysis of Metabolomics Data. Metabolites 2014, Vol. 4, Pages 433–452 4, 433–452 (2014). [DOI] [PMC free article] [PubMed] [Google Scholar]
- 84.Stacklies W, Redestig H, Scholz M, Walther D & Selbig J pcaMethods--a bioconductor package providing PCA methods for incomplete data. Bioinformatics 23, 1164–1167 (2007). [DOI] [PubMed] [Google Scholar]
- 85.Slenter D Metabolite BridgeDb ID Mapping Database (20210109). (2021) doi: 10.6084/m9.figshare.13550384.v1. [DOI] [Google Scholar]
- 86.Kutmon M et al. PathVisio 3: an extendable pathway analysis toolbox. PLoS Comput Biol 11, (2015). [DOI] [PMC free article] [PubMed] [Google Scholar]
- 87.Shannon P et al. Cytoscape: A Software Environment for Integrated Models of Biomolecular Interaction Networks. Genome Research 13, 2498–2504 (2003). [DOI] [PMC free article] [PubMed] [Google Scholar]
- 88.Kutmon M, Lotia S, Evelo CT & Pico AR WikiPathways App for Cytoscape: Making biological pathways amenable to network analysis and visualization. F1000Research 2014 3:152 3, 152 (2014). [DOI] [PMC free article] [PubMed] [Google Scholar]
- 89.Kutmon M, Ehrhart F, Willighagen EL, Evelo CT & Coort SL CyTargetLinker app update: A flexible solution for network extension in Cytoscape. F1000Research 2019 7:743 7, 743 (2019). [DOI] [PMC free article] [PubMed] [Google Scholar]
Associated Data
This section collects any data citations, data availability statements, or supplementary materials included in this article.