

Abstract
The influenza A virus (IAV) RNA polymerase is an essential driver of IAV evolution. Mutations that the polymerase introduces into viral genome segments during replication are the ultimate source of genetic variation, including within the three subunits of the IAV polymerase (polymerase basic protein 2, polymerase basic protein 1, and polymerase acidic protein). Evolutionary analysis of the IAV polymerase is complicated, because changes in mutation rate, replication speed, and drug resistance involve epistatic interactions among its subunits. In order to study the evolution of the human seasonal H3N2 polymerase since the 1968 pandemic, we identified pairwise evolutionary relationships among ∼7000 H3N2 polymerase sequences using mutual information (MI), which measures the information gained about the identity of one residue when a second residue is known. To account for uneven sampling of viral sequences over time, we developed a weighted MI (wMI) metric and demonstrate that wMI outperforms raw MI through simulations using a well-sampled severe acute respiratory syndrome coronavirus 2 (SARS-CoV-2) dataset. We then constructed wMI networks of the H3N2 polymerase to extend the inherently pairwise wMI statistic to encompass relationships among larger groups of residues. We included hemagglutinin (HA) in the wMI network to distinguish between functional wMI relationships within the polymerase and those potentially due to hitch-hiking on antigenic changes in HA. The wMI networks reveal coevolutionary relationships among residues with roles in replication and encapsidation. Inclusion of HA highlighted polymerase-only subgraphs containing residues with roles in the enzymatic functions of the polymerase and host adaptability. This work provides insight into the factors that drive and constrain the rapid evolution of influenza viruses.
Keywords: Influenza Avirus, RNA-dependent RNA polymerase, virus evolution, information theory
Introduction
The evolution of influenza A viruses (IAVs) is constrained by epistatic interactions that limit viral exploration of sequence space (Lyons and Lauring 2018). Thus, epistasis can alter how IAVs evade our two primary pharmaceutical interventions—vaccines and antiviral drugs. While most RNA viruses encode a single subunit polymerase, IAVs express a heterotrimeric polymerase (Te Velthuis, Grimes, and Fodor 2021). This complex, consisting of polymerase basic protein 2 (PB2), polymerase basic protein 1 (PB1), and polymerase acidic protein (PA), works with nucleoprotein to bind viral RNA and carry out transcription and genome replication (Te Velthuis, Grimes, and Fodor 2021). Complex relationships between all three subunits determine the functions of the IAV polymerase. Furthermore, recent studies indicate that epistatic relationships within the IAV polymerase can manifest as a genetic barrier to drug resistance (Bloom, Gong, and Baltimore 2010; Pauly et al. 2017; Goldhill et al. 2018).
Epistasis, a nonadditive fitness relationship between mutations, can occur due to structural and/or functional interactions. One indicator of protein epistasis is coevolution between residues, which can be measured when enough sequence data over evolutionary time are available. Inferring epistasis from coevolution assumes that the co-selection of two or more mutations arises as a result of a positive epistatic relationship between these mutations (Dunn, Wahl, and Gloor 2008). Existing approaches for measuring coevolution between protein residues tend to rely on phylogenetic inference (Yeang and Haussler 2007; Gong, Suchard, and Bloom 2013), which requires significant computational resources and is subject to issues with model mis-specification (e.g. different models can result in different trees and thus different estimates of coevolution) (Dutheil 2012).
In contrast, methods based on information theory do not require model fitting and can detect a broader range of relationships. For example, mutual information (MI) (Shannon 1948), which measures the amount of information shared between two random variables, has been used to identify coevolving residues in proteins (Dunn, Wahl, and Gloor 2008; Dutheil 2012). Substantial effort has been spent in refining MI to predict protein structures by identifying residue contacts (Weigt et al. 2009; Morcos et al. 2011; Kamisetty, Ovchinnikov, and Baker 2013; Figliuzzi et al. 2016). However, IAV polymerase evolution is likely driven by factors beyond structural contacts. For instance, protein allostery, RNA–protein interactions, RNA–RNA interactions, and interactions with cellular binding partners (including the ribosome and tRNAs) can all influence epistatic relationships within the IAV polymerase (Pflug et al. 2014; Dadonaite et al. 2019; Kim et al. 2020).
While information theory provides simple and interpretable tools for studying coevolutionary relationships using sequencing data, there are several biases that need to be addressed prior to their application. First, these measures do not account for uneven sampling across categories or time. Second, they are limited to identifying pairwise interactions. Third, they do not address the possibility of genetic hitch-hiking. Here, we present solutions to these three problems and use the improved MI calculation to identify coevolutionary relationships within the H3N2 polymerase complex.
Results
When applied to a multiple sequence alignment (MSA), MI quantifies the amount of information (measured as Shannon entropy) gained about one random variable ( ) by observing a second random variable (
 ) (Shannon 1948) (Equations 1 and 2),
 |
(1) |
 |
(2) |
where n is the number of distinct amino acids in site  ,
,  is the frequency of a given amino acid,
  , in site
  ,
,  is the Shannon entropy of site
  , and
, and  is the joint entropy of
  and
and  (calculated using di-residue frequencies).
Thus, MI quantifies how much easier it would be to predict the identity of an observed residue in one site if the identity of the residue in a second site is known. Importantly, MI is zero when the compared sites are completely conserved or completely randomly assorting. Therefore, MI cannot predict epistatic relationships between completely conserved residues.
Weighted MI corrects for uneven sequence sampling over time
To quantify the MI between residues in the H3N2 polymerase, we first generated a joint MSA of all complete H3N2 polymerase sequences (PB2, PB1, and PA) available from the Global Initiative on Sharing All Influenza Data (GISAID) from 1968 to 2015. There were increasing numbers of IAV genomes available in recent years as sequencing technology advanced and surveillance infrastructure expanded; more H3N2 genomes were sequenced in 2015 than in the first five decades of H3N2 infections combined (Fig. 1A). Because MI is calculated from the frequencies of a pair of random variables (Equations 1 and 2), calculations of entropy and MI will be more influenced by heavily sampled years. However, the skewed sampling over time will only alter these calculations if the MI (and entropy) changes over time for residues in the IAV polymerase. Given that epistasis (and MI) tends to increase in viral proteins under strong selection or in changing environments (Gupta and Adami 2016), we hypothesized that the MI for residues within the H3N2 polymerase varies over the past 50 years. We used a sliding-window approach to discover that the MI of H3N2 polymerase residues is not constant over time (Fig. 1B). Therefore, calculations of MI across our entire dataset that do not account for the uneven sampling over time will be inflated for residues with high MI in recent years (e.g. PB2-590 and PB1-709, Fig. 1B) and deflated for residues with high MI in earlier years (e.g. PA-350 and PB1-469, Fig. 1B).
Figure 1.
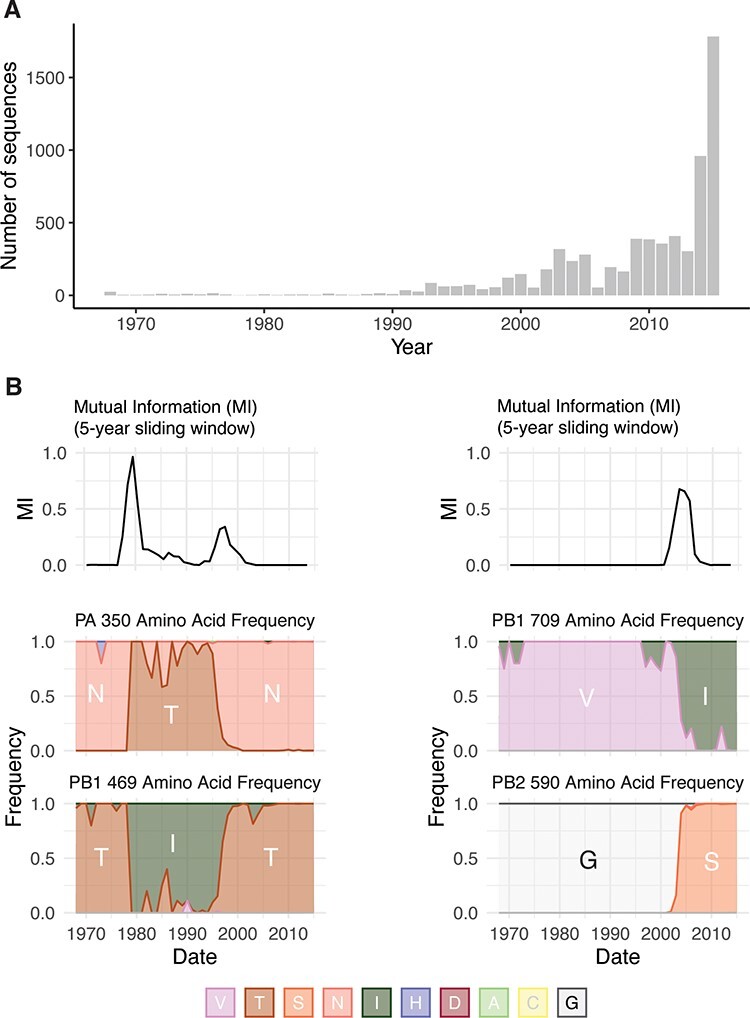
Uneven sampling of H3N2 polymerase sequences over time influences Shannon entropy and MI. (A) The distribution of complete H3N2 polymerase sequences on GISAID per year between 1968 and 2015. (B) Upper panels, Sliding window analysis of MI for residue pairs PA-350/PB1-469 and PB2-590/PB1-709. Sliding windows were constructed with a width of 5 years and a slide length of 1 year. Lower panels, Plots of the frequency of amino acids for each residue over the period 1968–2015.
We accounted for the uneven sampling over time by creating weighted entropy and MI metrics. Previously, MI metrics have been developed that re-weight sequences in an MSA according to how many other sequences in the MSA exhibit similarity (e.g. Hamming distance) above a predefined threshold (Morcos et al. 2011). In our case, similarity reweighting presents two issues. First, MI and sequence similarity are not independent, and as such, reweighting by one value will confound estimates of the other. Second, the distribution of similar sequences in our dataset contains essential information about selection and evolution that we want to capture in our calculation of MI. Thus, we designed new weighted entropy and MI metrics based on inverse probability weighting. Here, we used the weighted average of the residue frequencies (or di-residue frequencies) over each unit of time (e.g. year, month) to calculate the entropy and MI (Equation 3).
 |
(3) |
where  is the number of time units and
  is the weight for a given unit time.
We chose to apply the weighting procedure directly to the residue frequencies rather than the resulting entropy or MI to avoid overlooking years in which there is no residue variation (i.e. years where the entropy or MI is zero). We use ‘wMI’ to refer to the weighted MI.
In an ideal scenario, the weight for each unit of time would be proportional to the number of virus infections per unit of time, as this would be best correlated with the amount of evolution. However, surveillance data from the early decades of H3N2 circulation are also variable and incomplete. Therefore, we evaluated how equal weighting (Equation 4) of each unit of time would compare to either weighting by disease incidence (Equation 5) or no weighting using a dataset of SARS-CoV-2 spike receptor-binding domain (RBD) protein sequences generated by our laboratory in 2021 and 2022 (Valesano et al. 2021a, 2021b).
 |
(4) |
 |
(5) |
The original spike protein dataset is evenly sampled over each month with respect to disease incidence (Fig. 2A) (https://www.michigan.gov/coronavirus/stats). We first generated 100 samples with replacement of the Spike MSA to simulate the uneven sampling present in the H3N2 polymerase MSA (Fig. 2B, compare to Fig. 1A) (see the Methods section). We then assessed the ability of wMI to correct for the simulated uneven sampling by calculating the unweighted, equal-weighted, and incidence-weighted wMIs for each sample and comparing these values to the MIs calculated from the original spike dataset. We found that incidence-weighted and equal-weighted wMIs closely approximated the MIs from the original spike dataset (incidence-weighted mean ρ = 0.985, 95 per cent confidence interval (CI): 0.964–0.995; equal-weighted mean ρ = 0.971, 95 per cent CI: 0.956–0.980) (Fig. 2C). Moreover, both weighting procedures significantly outperformed the unweighted MI (mean ρ = 0.904, 95 CI: 0.841–0.945). This analysis shows that wMI calculated with equal weighting or incidence weighting yields improved calculations of the true MI for datasets that are unevenly sampled over time. Because we do not have good incidence data for H3N2 infections over time, we used equal weighting to calculate the pairwise wMI scores within the H3N2 polymerase.
Figure 2.
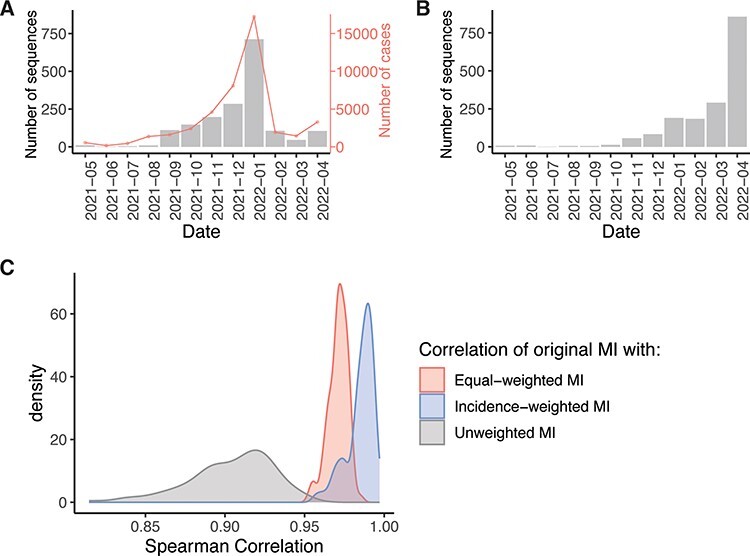
Re-weighting of amino acid frequencies improves MI estimates for unevenly sampled data. (A) The distribution of SARS-CoV-2 Spike RBD sequences generated by our laboratory per month between 1 May 2021 and 30 April 2021 from Washtenaw County, MI. The line shows the number of confirmed Coronavirus Disease-19 (COVID-19) cases in Washtenaw County, MI over the same time period. (B) Representative distribution of sampled Spike RBD sequences used to simulate the uneven sampling of H3N2 polymerase sequences (see Fig. 1A). (C) The distribution of Spearman correlation coefficients between the MI from the original Spike RBD dataset and the unweighted, equal-weighted, or incidence-wMI of 100 sampled datasets.
Correcting wMI for the influence of phylogenetic relationships
Entropy and MI assume that all observations in a dataset are independent (Shannon 1948). However, as essentially, every H3N2 polymerase sequence (since the reassortment event in 1968 that introduced avian PB1) has shared ancestry, this assumption is strongly violated (Dutheil 2012). The average product correction (APC) devised by Gloor et al. corrects for phylogenetic relationships by estimating the background MI signal due to non-independence (Dunn, Wahl, and Gloor 2008). This is accomplished by calculating the mean MI for each member of a residue pair and for the dataset as a whole (Equation 6), which therefore assumes that the true number of coevolving amino acid pairs is a tiny fraction of the total possible pairs in the MSA.
 |
(6) |
The corrected MI (or corrected wMI) for a given pair is calculated by subtracting the APC.
wMI reveals coevolutionary relationships among mutations crucial for host range expansion
We next investigated pairwise coevolutionary relationships within the H3N2 polymerase complex. Calculating an equal-weighted wMI by influenza season would only be possible for one fifth of the time period covered by the H3N2 polymerase dataset, as we only have reliable collection month information for sequences after ∼2003. Therefore, we chose to weight across collection year (rather than season, month, or week), because that is the highest level of precision across all sequence metadata in our dataset.
We first investigated whether the top wMI scores capture known relationships within the H3N2 polymerase. For example, the PB2 627 residue is known to mediate adaptation to mammalian hosts, and mutations in or near this residue often occur during host range expansion to restore ANP32A binding and improve viral replication (Subbarao, London, and Murphy 1993). Among the top wMI pairs (normalized wMI > 4), 53 residues coevolve with PB2-627. We identified the top five residues paired with PB2-627 by wMI: PB2-44, PB2-199, PB2-591, PB2-645, and PA-268, and then plotted these residues on the encapsidation–replication dimer conformation of the influenza C polymerase (Carrique et al. 2020) (Fig. 3A-B). These paired residues are located within the N-terminal and 627 domains of PB2 and within the C-terminal domain of PA (Fig. 3B, C). The residues PB2-591 and PB2-627 interact in the encapsidation–replication dimer conformation of the polymerase with host protein ANP32A (Carrique et al. 2020) (Fig. 3A), and mutations in these residues are known to cooperatively increase polymerase activity in H1N1 viruses (Mehle and Doudna 2009; Liu et al. 2012). PB2-645 and PB2-199 are located near PB2-591, PB2-627 and ANP32A and thus could cooperate with these residues to modify ANP32A binding and replication. Thus, our wMI approach identified a known cooperative interaction and at least two other interactions that are structurally plausible.
Figure 3.
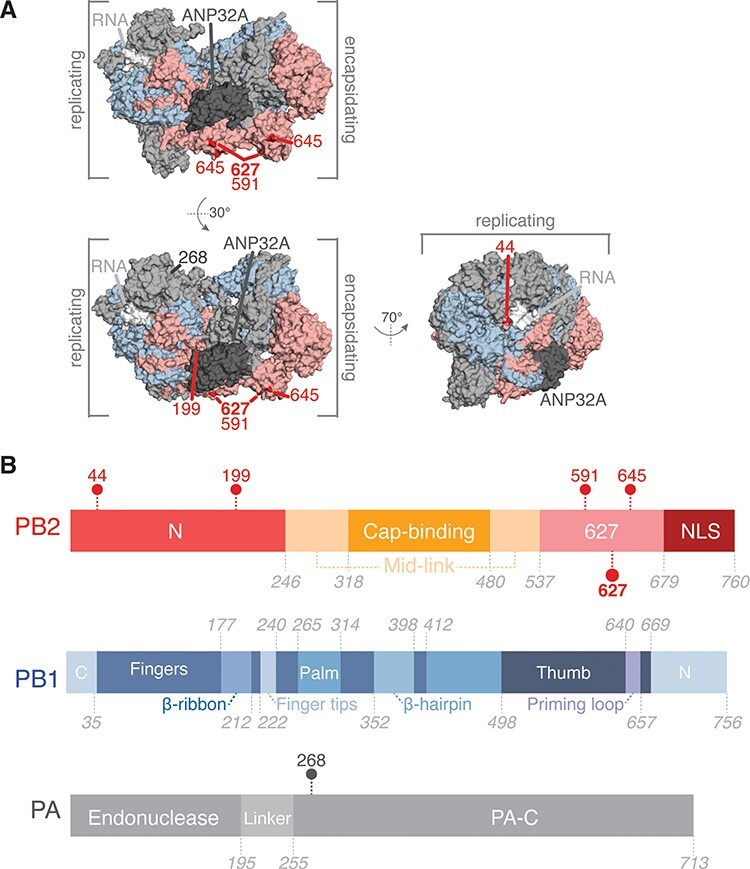
Coevolving residues with PB2-627. (A) Residues that coevolve with PB2-627 shown highlighted on the replicating–encapsidating dimer conformation of the influenza C polymerase (Protein Data Bank (PDB) ID 6XZR) (Carrique et al. 2020). (B) Domain organization of the IAV polymerase with coevolving residues indicated.
We plotted the changes in residue frequency for PB2-627 and the five wMI-paired residues to identify the specific substitutions that account for the wMI score. These plots reveal coincident mutations around 2011 (Fig. S1) that likely underlie the wMI signal. Interestingly, one of these mutations is PB2 K627E, a reversion of the human-adaptive PB2 E627K. The sequence metadata for all sequences containing this reversion revealed that the co-mutations underlying the wMI arose from a cluster of human infections in the US Midwest with swine-derived vH3N2 viruses containing the M segment of H1N1/pdm2009. The shared PB2 mutations we identified in these viruses also suggest a possible reassortment event with PB2, which is further supported by the proximity of these residues to the binding site of host ANP32A. In all, this analysis demonstrates that wMI can identify distinct epidemiological features within viral sequence datasets spanning extensive periods or geographic areas.
We next examined whether the top wMI pairs (normalized wMI > 4) represent interactions within or between the three polymerase subunits (Fig. S2). Given that the polymerase subunits have similar substitution rates (Bhatt, Holmes, and Pybus 2011) and similar protein lengths, we would expect similar numbers of co-mutating residue pairs among each of the six gene segment pairs purely by chance. However, we observed that a large majority (869/2671 residue pairs) of top wMI pairs are specifically between PB2 and PA (a single category). Relatively few of the top wMI pairs involve PB1 at all (871/2671 residue pairs totaled across all segment pairs involving PB1). One explanation for this result is that H3N2 PB2 and PA have coevolved for a much longer period as they were inherited from the 1918 H1N1 virus, while PB1 was introduced through a reassortment event with an avian IAV in 1968 (Kawaoka, Krauss, and Webster 1989). Another possible explanation is that PB2 and PA contain highly dynamic domains that together coordinate complex activities such as cap-snatching and dimerization (Te Velthuis and Fodor 2016). 33 per cent of top wMI pairs include residues in the cap-binding domain of PB2 or the endonuclease domain of PA, both involved in cap-snatching, despite these domains only comprising 16 per cent of the residues in the polymerase complex. This suggests that wMI captures coevolutionary interactions related to the enzymatic functions of the IAV polymerase.
wMI networks identify higher-order coevolutionary relationships
The wMI statistic captures coevolutionary relationships between pairs of residues. However, the coevolutionary relationships that drive polymerase function may involve more than two residues. Thus, we constructed wMI networks to extend the inherently pairwise MI statistic to encompass relationships among larger groups of residues. In these networks, nodes represent residues and edges represent the normalized wMI between residues.
When a network is generated with an edge for each of the top wMI pairs (n = 2671), the resulting visualization is dense and challenging to interpret due to the high degree of interconnectedness within the network. Therefore, we sought an approach to focus on the most important higher-order wMI relationships within our data. Percolation theory states that in a random network, one giant interconnected graph (as opposed to many small isolated subgraphs) will quickly form as the probability of drawing an edge is increased (Newman 2018). Given that random networks tend toward a giant subgraph, we identified an edge-strength (normalized wMI) threshold at which the behavior of our network is most distinct from the one containing a giant subgraph, as previously described by Strayer et al. (2023). In other words, since a network with a giant subgraph is characterized by one large subgraph with many nodes and few other subgraphs, we set our threshold to minimize the size of the largest subgraph relative to the average size of all other subgraphs (i.e. the relative maximum subgraph size, see Fig. S3) (Strayer et al. 2023). This threshold results in a network visualization containing nine distinct subgraphs encompassing relationships among 40 residues (Fig. 4A).
Figure 4.
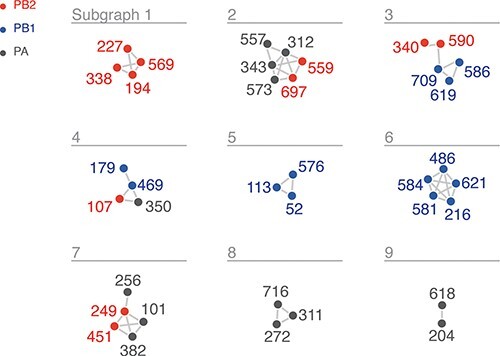
wMI network of the H3N2 polymerase (PB2, PB1, and PA). Nodes represent residues, and edges represent the normalized wMI between residues. An edge threshold was set at the normalized wMI score (58) that minimizes relative maximum subgraph size (see Fig. S3). The network visualization was created using the associationSubgraphs package for R (Strayer et al. 2023).
We investigated the residues within the first two subgraphs to identify potential mechanisms behind their coevolution. Subgraph 1 contains four residues within PB2: 194, 227, 338, and 569. Plotting the changes in amino acid frequency for these residues reveals that a selective sweep starting around 1985 (Q194R, M227I, I338V, and T569A) explains much of the coevolutionary signal (Fig. 5A). The location of these residues on the replication–encapsidation polymerase structure (Carrique et al. 2020) suggests that they may participate in dimerization and binding of host ANP32A; residues 194, 227, 338, and 569 are located in the dimerization interface of the RNA-bound replicating polymerase, and residue 569 is near the host ANP32A binding site (Fig. 5B). The mutations Q194R and V227I were also shown to be human-adaptive markers in a study of H3N2 sequences from human and avian hosts (Wen et al. 2018). Subgraph 2 contains a mix of PA and PB2 residues: PA-312, PA-343, PA-557, PA-573, PB2-559, and PB2-697. A selective sweep around 2005 (PA R312K, PA A343S, PA M557I, PA I573V, PB2 T559A, and PB2 L697I) contributed to the high wMI among these residues (Fig. 5A). These residues are located within the C-terminal domain of PA and the 627 and nuclear localization signal domains of PB2, at the interface of the replication–encapsidation polymerase dimer (Carrique et al. 2020) (Fig. 5C). In addition, the mutations PB2 T569A (Subgraph 1) and PB2 T559A (Subgraph 2) are known regulators of host-range expansion in the H7N9 polymerase (Chen et al. 2016). In all, the construction of wMI networks in the H3N2 polymerase identified relationships between residues that regulate host adaptibility and are likely involved in replication, encapsidation, and association with host ANP32A.
Figure 5.
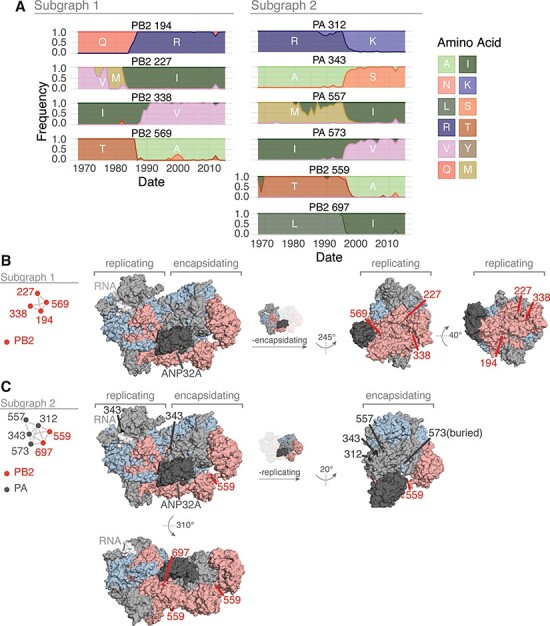
Features of the residues in Subgraphs 1 and 2 from the wMI network of the H3N2 polymerase. (A) Amino acid frequencies from 1968 to 2015 for the residues within Subgraph 1 (left) or 2 (right). Location of the residues in Subgraphs 1 (B) and 2 (C) plotted on the replicating–encapsidating dimer conformation of the influenza C polymerase (PDB ID: 6XZR) (Carrique et al. 2020).
wMI networks can reveal genetic hitch-hiking
Coevolving sites within the IAV polymerase may be falsely assumed to have biological significance due to genetic hitch-hiking with HA or neuraminidase during antigenic drift. Antigenic variants that promote immune escape are under strong selection; when these mutations undergo a selective sweep, neutral or even deleterious mutations in other regions of the IAV genome may also rise in frequency in the population due to linkage disequilibrium (Chen and Holmes 2010; Lyons and Lauring 2018). We accounted for this possibility with HA by calculating wMI scores for a joint MSA of the three polymerase proteins and HA. We found that most of the top wMI pairs (normalized wMI > 4) occur within HA, which is expected due to the higher substitution rate of HA versus the polymerase proteins (Fig. S4A) (Bhatt, Holmes, and Pybus 2011). In addition, the top wMI pairs within HA antigenic regions A–E (Wiley, Wilson, and Skehel 1981; Wilson, Skehel, and Wiley 1981; Skehel et al. 1984) have higher normalized wMI overall than top wMI HA pairs in other regions of the protein (Fig. S4C). Interestingly, there are fewer top wMI pairs among the polymerase proteins than between each polymerase protein and HA (Fig. S4A, B). Overall, this suggests a high level of coevolution between the polymerase complex and HA and underscores the need to parse coevolution due to functional relationships versus genetic hitch-hiking due to antigenic selection.
We then constructed a wMI network and reasoned that subgraphs containing both polymerase and HA residues represent potential genetic hitch-hiking events (Figs. 6A and S5). In the polymerase–HA wMI network, many of the relationships with HA involve residues within the antigenic regions A–E (Wiley, Wilson, and Skehel 1981; Wilson, Skehel, and Wiley 1981; Skehel et al. 1984), including known epistatic residues within antigenic Region B (Fig. 6) (Wu et al. 2020). As the wMI relationships between the polymerase and HA antigenic residues may indicate genetic hitch-hiking, we defined a set of polymerase-only subgraphs likely to be functionally important. We again evaluated the functional implications of the residues in these networks by examining changes in amino acid frequency and placing them on the post-cap-snatching polymerase structure (Fan et al. 2019) (Fig. 7A-D). Subgraphs 4 and 8 contain residues co-varying in amino acid frequency between 1970 and 2005 (Fig. 7A). Subgraph 4 is a pairwise interaction between PB1-619 and PB1-709, which are located in the thumb and C-terminal domains, respectively (Fig. 7B). The thumb domain forms the right-side wall of the viral RNA–dependent polymerase (RdRp) active site chamber, while the C-terminal domain interacts closely with the PB2 N-terminus and PA endonuclease domains. In addition, the mutations V709I and D619N in PB1 each lead to increased polymerase activity (by minigenome assay in human cells) in the early pandemic H3N2 strain A/Hong Kong/1/1968(HK/68) (Sun et al. 2022: 1). PB1-52 and PB1-576 of Subgraph 8 are in the finger and thumb domains of PB1 (Fig. 7C). The finger domain of PB1 forms the roof and left-side wall of the RdRp active site chamber. While PB1-52 and PB1-576 are not in close proximity, the mutation PB1 I576L is one of seven differences between consensus avian PB1 and H1N1 PB1 from the 1918 pandemic (Taubenberger et al. 2005), and K52R is found in a significantly higher proportion of IAVs isolated from humans than swine (Chen et al. 2017). Thus, PB1-52 and PB1-576 may be residues associated with host adaptability. Subgraph 10 contains residues from all three polymerase subunits: PB2-107, PB1-469, and PA-350. These residues undergo two collective shifts in amino acid frequency, first starting in 1977 and again near 1996 (Fig. 7A). They are located in the N-terminal domain of PB2, the palm domain of PB1, and the C-terminal domain of PA (Fig. 7D). The N-terminal domain of PB2 closely associates with the RdRp, and the C-terminal domain of PA associates with the thumb domain of the RdRp. The PB1 palm subdomain forms the floor of the RdRp active site chamber. Residue PB1 469 is also a determinant of host range for H1N1: the mutation A469T determines transmissibility in guinea pigs, and this mutation also arose after serial passage of pdm09 H1N1 in pigs (Wei et al. 2014). In all, the non-HA-associated subgraphs highlight residues near the main enzymatic activities of the RdRp that may alter host adaptability.
Figure 6.
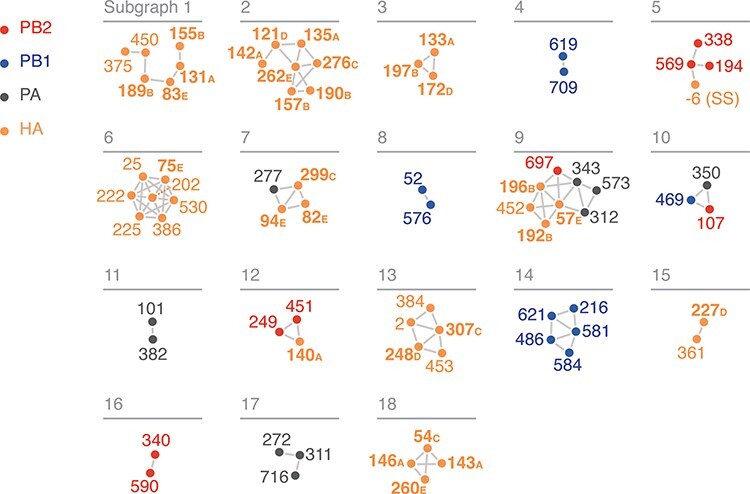
wMI network of the H3N2 polymerase (PB2, PB1, and PA) and HA. Nodes represent residues, and edges represent the normalized wMI between residues. Residue nodes are colored as in Fig. 4. HA residues that are located in antigenic regions A–E are shown in bold. Residue −6 (signal peptide sequence, (SS)) is in the cleaved N-terminal signal sequence of HA. An edge threshold was set at the normalized wMI score (40.506) that minimizes relative maximum subgraph size (see Fig. S5). The network visualization was created using the associationSubgraphs package for R (Strayer et al. 2023).
Figure 7.
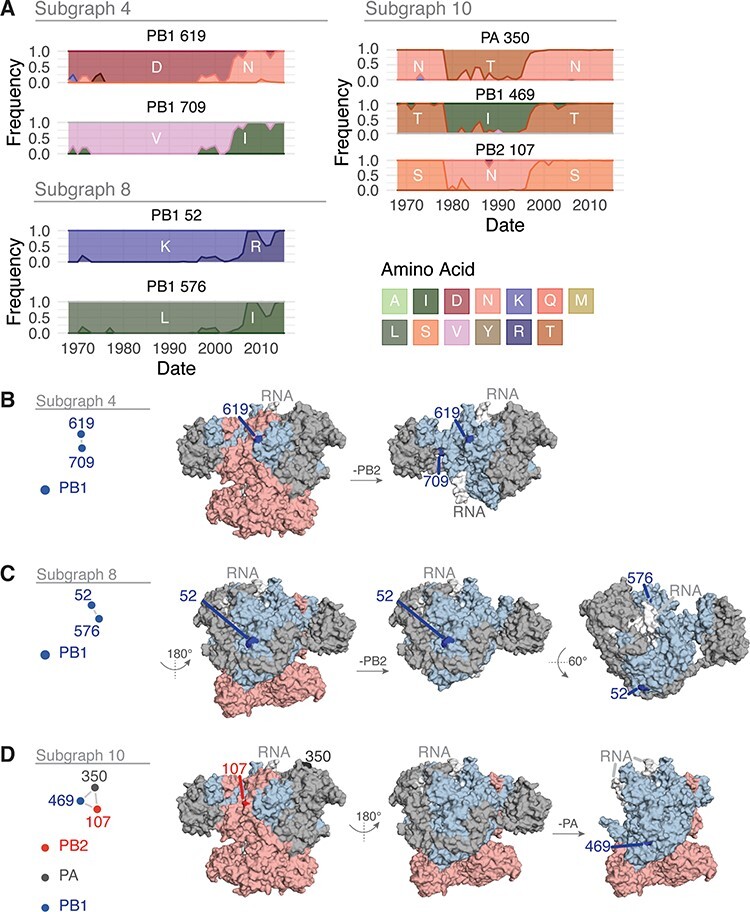
Features of the residues in Subgraphs 4, 8, and 10 from the wMI network of the H3N2 polymerase and HA. (A) Amino acid frequencies from 1968 to 2015 for the residues within Subgraph 4 (top left), 8 (bottom left), or 10 (right). Location of the residues in Subgraph 4 (B), 8 (C), or 10 (D) plotted on the post-cap-snatching conformation of the H3N2 polymerase (PDB ID: 6RR7) (Fan et al. 2019).
Subgraphs that contain both polymerase and HA residues represent potential genetic hitch-hiking. However, the presence and direction of hitch-hiking must be investigated case-by-case and confirmed experimentally. For example, polymerase residues in Subgraphs 5 and 9 from the polymerase–HA network (corresponding to Subgraphs 1 and 2 in the polymerase-only network) may have high wMI due to genetic hitch-hiking with mutations in HA. The residues in Subgraph 5 all underwent a selective sweep around 1985 (Fig. S6). However, the mutation in PB2-194 precedes the mutation in HA (−6). Thus, whether genetic hitch-hiking is occurring and the direction of potential hitch-hiking are unclear. On the other hand, the residues in Subgraph 9 underwent a simultaneous selective sweep starting in 1995. The timing of this sweep and the association with residues in HA antigenic regions B and E indicate that high wMI among polymerase residues in this subgraph may be due to selection acting on mutations in HA. In all, wMI networks are a useful diagnostic tool to form hypotheses about hitch-hiking relationships that may be further investigated.
Discussion
The wMI metric introduced in this study addresses several issues using information-based measures to investigate evolution and coevolution in rapidly evolving populations. Weighting across years accounts for sampling variations over time. Using the wMI metric, we identified a robust coevolutionary relationship between PB2-627 and PB2-591. These residues are known to interact and are essential for host range expansion (Mehle and Doudna 2009), validating our approach. We generated network visualizations (Newman 2018; Strayer et al. 2023) of wMI to facilitate the identification of higher-order interactions and provide a method for addressing genetic hitch-hiking. This analysis identified clusters of coevolving residues with roles in cap-snatching, dimerization, replication, and host adaptability. We included HA in the network to identify polymerase-only wMI relationships with potential roles in the enzymatic functions of the RdRp and host-range expansion.
The wMI method has several strengths compared to other methods for detecting coevolution. Unlike weighting by sequence similarly, wMI preserves the changes in allele frequency that are crucial for detecting coevolution in rapidly evolving populations. wMI also does not require fitting a model and thus does not suffer from model selection or fit issues (Dutheil 2012). In addition, the simplicity of the wMI metric makes it relatively easy and fast to implement. Previous methods to detect coevolution have used intramolecular distances from structural data as a benchmark (Weigt et al. 2009; Morcos et al. 2011; Kamisetty, Ovchinnikov, and Baker 2013; Figliuzzi et al. 2016). However, structural proximity is only one factor that can lead to coevolution (Ackerman, Tillier, and Gatti 2012). Other factors include protein function, RNA function, RNA structure, stochastic processes, and phylogeny (although corrected in our approach). In one recent study, structural proximity was found to contribute to general low-level MI across a protein, while functional relationships are indicated by strong MI (Mohan, Ozer, and Ray 2022). Thus, evaluating coevolution–detection methods based on the structure alone will select methods that cannot capture all of the biology at play.
The wMI method combined with network visualization provides a new way of identifying and excluding coevolutionary relationships due to genetic hitch-hiking. Our method cannot definitively confirm or refute the presence of hitch-hiking. However, it does produce a tractable set of hypotheses about whether hitch-hiking underlies the most important coevolutionary relationships in a system. Accounting for other proteins besides HA under strong selection, such as NA, will yield additional insights into hitch-hiking relationships between IAV genes.
The methods introduced in this study have several limitations. A primary limitation is that increasing (through weighting) the influence of a year with few observations can increase the variability in the resulting wMI. However, assuming that there is no pattern in sampling variability, the sum effect on the wMI of upweighting all low observation years should be negligible. A second limitation of using wMI is the assumption that there are no unknown confounders. We assume in this method that the sequence observations in each year represent a random sample of the viral genomes present in that year. In recent decades, the distribution of sequences from different geographic regions has become heavily biased toward North America and Europe. However, increased spread of IAVs between geographic regions (Grais, Ellis, and Glass 2003) means that the effect of this bias on genome variability is reduced. Furthermore, the wMI method introduced in this paper could be similarly used to address uneven sampling across geographic regions, although the assumptions inherent in equal weighting (versus incidence weighting) may prove problematic. An additional possibility is that even if the genomes in our dataset represent a sufficiently random sample, the observed changes in allele frequency could reflect genetic drift rather than natural selection. Another major limitation of this study is that MI and wMI can only detect dependencies among residues that have evolved, as residues that are fully conserved over the study period will have an entropy of 0. Thus, MI and wMI cannot capture the assuredly meaningful relationships among strongly conserved positions. A final limitation is that wMI does not provide insight into the coevolving residues’ function(s). Instead, relationships identified using wMI represent preliminary hypotheses for further investigation.
The wMI-edge threshold we set is informed by the behavior of random networks and helps form hypotheses about functional coevolutionary relationships to test experimentally (Newman 2018; Strayer et al. 2023). However, coevolutionary relationships within the H3N2 polymerase are not limited to what happens at that threshold. Furthermore, it is not easy to interpret how a particular threshold influences the findings. For example, would a slightly higher or lower threshold result in different hypotheses regarding hitch-hiking? To this end, we have developed a Shiny Application (Chang et al. 2022) to dynamically visualize our network at different thresholds. The Shiny Application can be accessed at https://virusevolution.shinyapps.io/MI_Networks_App/ and contains all the wMI results presented in this study.
The wMI metric we introduce solves several critical issues that have limited the application information-theoretic methods to studies of evolution. The simplicity of the wMI metric means that implementation and application to other systems are relatively straightforward. Notably, the solutions we propose for uneven sampling, identifying higher-order interactions, and accounting for genetic hitch-hiking have utility in systems beyond the H3N2 polymerase.
Materials and methods
H3N2 sequence acquisition
IAV polymerase sequences (amino acid) were downloaded from GISAID on 30 August 2022. Entries were filtered for A/H3N2 subtype, human host, all locations and collection times, and only complete sequences for PB2, PB1, PA, and HA. In all, this resulted in 7250 entries. Each segment was downloaded as a separate fasta file. Metadata for each sequence is provided in Supplemental Table 1 (GISAID acknowledgement table).
H3N2 sequence processing
Sequences were first filtered to remove any entries passaged in egg, using the regular expression ‘egg|Egg|E[0-9]|AM|Am|E’. Entries with duplicate sequences were removed entirely. Lastly, any sequences containing insertions or deletions were removed by filtering for sequence length. In all, these filtering steps removed 314 sequences, leaving 6936 sequences for downstream analysis. Sequences for all segments were then aligned using MAFFT v7.490 (Katoh et al. 2002) (released on 30 October 2021). Aligned sequences were concatenated by isolate ID using the order: PB2-PB1-PA-HA.
Calculation of weighted amino acid frequencies, entropy, and MI
Weighted amino acid frequencies were calculated according to Equations 3–5. Shannon entropy and MI were calculated according to Equations 1 and 2. For weighted entropy and MI, the weighted amino acid frequencies were used in Equations 1 and 2 as described earlier. Finally, each MI or wMI was corrected for the influence of phylogenetic signals using the average product correction (Equation 6) as previously described (Dunn, Wahl, and Gloor 2008) and then normalized.
Sliding-window analysis
Five-year sliding windows starting at each year were constructed from 1968–2011, moving over 1 year per window (the last window including years 2011–15). MIs (including the average product correction) were calculated for the sequences in each window using Equations 1 and 2.
SARS-CoV-2 spike simulations
Washtenaw County SARS-CoV-2 sequences were downloaded (as nucleotide) from GISAID using the isolate IDs provided in Supplemental File 2 (GISAID acknowledgement table). Sequences were subset to the spike gene and filtered to remove sequences containing ‘N’ or ‘K’. Then, the sequences were aligned using MAFFT v7.490 (Katoh et al. 2002) (released on 30 October 2021), and aligned sequences were translated into amino acids and subset to the RBD domain. Spike RBD sequences were then sampled by month with replacement using the binned sampling density of the IAV polymerase (number of bins = 12, to match the number of months in the Spike RBD dataset). This sampling was repeated to generate 100 independent samples. The raw MI, wMI (using disease incidence), and wMI (using  ) were calculated for each sample, and the raw MI was calculated for the original Spike RBD dataset. The original sampling frequency is roughly proportional to disease incidence (Fig. 2A). The average product correction was not applied to any of the calculated MIs in this analysis. The Spearman correlation was then calculated to compare the original Spike RBD dataset MI to the MIs for each sample. A kernel density plot was generated using the geom_density function with default parameters from the ggplot2 R package (Wickham 2016). Washtenaw County SARS-CoV-2-positive cases were taken from ‘Cases and Deaths by County by Date of Onset and Date of Death’ downloaded from https://www.michigan.gov/coronavirus/stats
Network construction and thresholding
Networks were visualized using the associationSubgraphs package for R (Strayer et al. 2023). The input data was subset to the top (length of MSA/2) pairs to improve computational speed and rendering. A network edge threshold was chosen using the ‘min-max rule’ (i.e. minimizing the relative maximum subgraph size) as previously described (Strayer et al. 2023).
Protein visualizations
All protein visualizations were constructed using PyMOL (version 2.5.4) (Schrodinger LLC 2015). Python scripts to generate PyMOL image files were adapted from scripts on the Bloom lab github site (https://github.com/jbloomlab/PB2-DMS) (Soh et al. 2019). The domain structure for the polymerase proteins was adapted from Pflug et al. (2014).
Supplementary Material
Acknowledgements
We thank Dirk Eggink for helpful discussion and Julie Gilbert for providing access to SARS-CoV-2 sequencing data and metadata. This work was supported by NIH R01 AI170520 (to A.S.L.) and a Burroughs Wellcome Fund Investigator in the Pathogenesis of Infectious Disease Award (to A.S.L.). Dr Arcos was supported, in part, by NIH T32 AI007528.
Contributor Information
Sarah Arcos, Department of Microbiology and Immunology, University of Michigan, 1150 West Medical Center Drive, 5641 Medical Science II, Ann Arbor, MI 48109, USA.
Alvin X Han, Department of Medical Microbiology and Infection Prevention, Amsterdam University Medical Center, Meibergdreef 9, Amsterdam 1105 AZ, The Netherlands.
Aartjan J W te Velthuis, Department of Molecular Biology, Princeton University, 119 Lewis Thomas Laboratory, Washington Road, Princeton, NJ 08544, USA.
Colin A Russell, Department of Medical Microbiology and Infection Prevention, Amsterdam University Medical Center, Meibergdreef 9, Amsterdam 1105 AZ, The Netherlands.
Adam S Lauring, Department of Microbiology and Immunology, University of Michigan, 1150 West Medical Center Drive, 5641 Medical Science II, Ann Arbor, MI 48109, USA; Division of Infectious Diseases, Department of Internal Medicine, University of Michigan, 1500 East Medical Center Drive, 3110 Taubman Center, SPC 5368, Ann Arbor, MI 48109, USA.
Supplementary data
Supplementary data are available at Virus Evolution online.
Conflict of interest:
None declared.
Code Availability
Code for generating all analyses and visualizations in this study is provided at https://github.com/lauringlab/timeMI. Functions for calculating raw and wMI are available as a separate package for R: https://github.com/lauringlab/weightedMI. Interactive network visualizations containing all wMI results published in this study can be viewed at https://virusevolution.shinyapps.io/MI_Networks_App/
References
- Ackerman S. H., Tillier E. R., and Gatti D. L. (2012) ‘Accurate Simulation and Detection of Coevolution Signals in Multiple Sequence Alignments’, PloS One, 7: e47108. [DOI] [PMC free article] [PubMed] [Google Scholar]
- Bhatt S., Holmes E. C., and Pybus O. G. (2011) ‘The Genomic Rate of Molecular Adaptation of the Human Influenza A Virus’, Molecular Biology and Evolution, 28: 2443–51. [DOI] [PMC free article] [PubMed] [Google Scholar]
- Bloom J. D., Gong L. I., and Baltimore D. (2010) ‘Permissive Secondary Mutations Enable the Evolution of Influenza Oseltamivir Resistance’, Science, 328: 1272–5. [DOI] [PMC free article] [PubMed] [Google Scholar]
- Carrique L. et al. (2020) ‘Host ANP32A Mediates the Assembly of the Influenza Virus Replicase’, Nature, 587: 638–43. [DOI] [PMC free article] [PubMed] [Google Scholar]
- Chang W. et al. (2022), Shiny: Web Applicatoin Framework for R. <https://shiny.rstudio.com/> accessed 1 Jan 2021.
- Chen G.-W. et al. (2016) ‘Genomic Signatures for Avian H7N9 Viruses Adapting to Humans’, PloS One, 11: e0148432. [DOI] [PMC free article] [PubMed] [Google Scholar]
- Chen W. et al. (2017) ‘Genetic Variation and Co-evolutionary Relationship of RNA Polymerase Complex Segments in Influenza A Viruses’, Virology, 511: 193–206. [DOI] [PubMed] [Google Scholar]
- Chen R., and Holmes E. C. (2010) ‘Hitchhiking and the Population Genetic Structure of Avian Influenza Virus’, Journal of Molecular Evolution, 70: 98–105. [DOI] [PMC free article] [PubMed] [Google Scholar]
- Dadonaite B. et al. (2019) ‘The Structure of the Influenza A Virus Genome’, Nature Microbiology, 4: 1781–9. [DOI] [PMC free article] [PubMed] [Google Scholar]
- Dunn S. D., Wahl L. M., and Gloor G. B. (2008) ‘Mutual Information without the Influence of Phylogeny or Entropy Dramatically Improves Residue Contact Prediction’, Bioinformatics, 24: 333–40. [DOI] [PubMed] [Google Scholar]
- Dutheil J. Y. (2012) ‘Detecting Coevolving Positions in a Molecule: Why and How to Account for Phylogeny’, Briefings in Bioinformatics, 13: 228–43. [DOI] [PubMed] [Google Scholar]
- Fan H. et al. (2019) ‘Structures of Influenza A Virus RNA Polymerase Offer Insight into Viral Genome Replication’, Nature, 573: 287–90. [DOI] [PMC free article] [PubMed] [Google Scholar]
- Figliuzzi M. et al. (2016) ‘Coevolutionary Landscape Inference and the Context-Dependence of Mutations in Beta-Lactamase TEM-1’, Molecular Biology and Evolution, 33: 268–80. [DOI] [PMC free article] [PubMed] [Google Scholar]
- Goldhill D. H. et al. (2018) ‘The Mechanism of Resistance to Favipiravir in Influenza’, Proceedings of the National Academy of Sciences U.S.A, 115: 11613–8. [DOI] [PMC free article] [PubMed] [Google Scholar]
- Gong L. I., Suchard M. A., and Bloom J. D. (2013) ‘Stability-mediated Epistasis Constrains the Evolution of an Influenza Protein’, eLife, 2: e00631. [DOI] [PMC free article] [PubMed] [Google Scholar]
- Grais R. F., Ellis J. H., and Glass G. E. (2003) ‘Assessing the Impact of Airline Travel on the Geographic Spread of Pandemic Influenza’, European Journal of Epidemiology, 18: 1065–72. [DOI] [PubMed] [Google Scholar]
- Gupta A., and Adami C. (2016) ‘Strong Selection Significantly Increases Epistatic Interactions in the Long-Term Evolution of a Protein’, PLOS Genetics, 12: e1005960. [DOI] [PMC free article] [PubMed] [Google Scholar]
- Kamisetty H., Ovchinnikov S., and Baker D. (2013) ‘Assessing the Utility of Coevolution-based Residue–residue Contact Predictions in a Sequence- and Structure-rich Era’, Proc. Natl. Acad. Sci. U. S. A, 110: 15674–9. [DOI] [PMC free article] [PubMed] [Google Scholar]
- Katoh K. et al. (2002) ‘MAFFT: A Novel Method for Rapid Multiple Sequence Alignment Based on Fast Fourier Transform’, Nucleic Acids Research, 30: 3059–66. [DOI] [PMC free article] [PubMed] [Google Scholar]
- Kawaoka Y., Krauss S., and Webster R. G. (1989) ‘Avian-to-human Transmission of the PB1 Gene of Influenza A Viruses in the 1957 and 1968 Pandemics’, Journal of Virology, 63: 4603–8. [DOI] [PMC free article] [PubMed] [Google Scholar]
- Kim B. et al. (2020) ‘Discovery of Widespread Host Protein Interactions with the Pre-replicated Genome of CHIKV Using VIR-CLASP’, Molecular Cell, 78: 624–640.e7. [DOI] [PMC free article] [PubMed] [Google Scholar]
- Liu Q. et al. (2012) ‘Combination of PB2 271A and SR Polymorphism at Positions 590/591 Is Critical for Viral Replication and Virulence of Swine Influenza Virus in Cultured Cells and in Vivo’, Journal of Virology, 86: 1233–7. [DOI] [PMC free article] [PubMed] [Google Scholar]
- Lyons D. M., and Lauring A. S. (2018) ‘Mutation and Epistasis in Influenza Virus Evolution’, Viruses, 10: 407. [DOI] [PMC free article] [PubMed] [Google Scholar]
- Mehle A., and Doudna J. A. (2009) ‘Adaptive Strategies of the Influenza Virus Polymerase for Replication in Humans’, Proceedings of the National Academy of Sciences U. S. A, 106: 21312–6. [DOI] [PMC free article] [PubMed] [Google Scholar]
- Mohan S., Ozer H. G., and Ray W. C. (2022) ‘The Importance of Weakly Co-Evolving Residue Networks in Proteins Is Revealed by Visual Analytics’, Frontiers in Bioinformatics, 2: 836526. [DOI] [PMC free article] [PubMed] [Google Scholar]
- Morcos F. et al. (2011) ‘Direct-coupling Analysis of Residue Coevolution Captures Native Contacts across Many Protein Families’, Proceedings of the National Academy of Sciences U. S. A, 108: E1293–1301. [DOI] [PMC free article] [PubMed] [Google Scholar]
- Newman M. (2018) Networks, 2nd edn. Oxford, New York: Oxford University Press. [Google Scholar]
- Pauly M. D. et al. (2017) ‘Epistatic Interactions within the Influenza A Virus Polymerase Complex Mediate Mutagen Resistance and Replication Fidelity’, mSphere, 2: e00323–17. [DOI] [PMC free article] [PubMed] [Google Scholar]
- Pflug A. et al. (2014) ‘Structure of Influenza A Polymerase Bound to the Viral RNA Promoter’, Nature, 516: 355–60. [DOI] [PubMed] [Google Scholar]
- Schrodinger LLC. (2015). The PyMOL Molecular Graphics System.
- Shannon C. E. (1948) ‘A Mathematical Theory of Communication’, Bell System Technical Journal, 27: 379–423. [Google Scholar]
- Skehel J. J. et al. (1984) ‘A Carbohydrate Side Chain on Hemagglutinins of Hong Kong Influenza Viruses Inhibits Recognition by A Monoclonal Antibody.’, Proceedings of the National Academy of Sciences U.S.A, 81: 1779–83. [DOI] [PMC free article] [PubMed] [Google Scholar]
- Soh Y. S. et al. (2019) ‘Comprehensive Mapping of Adaptation of the Avian Influenza Polymerase Protein PB2 to Humans’, eLife, 8: e45079. [DOI] [PMC free article] [PubMed] [Google Scholar]
- Strayer N. et al. (2023) ‘Interactive Network-based Clustering and Investigation of Multimorbidity Association Matrices with associationSubgraphs’, Bioinformatics, 39: btac780. [DOI] [PMC free article] [PubMed] [Google Scholar]
- Subbarao E. K., London W., and Murphy B. R. (1993) ‘A Single Amino Acid in the PB2 Gene of Influenza A Virus Is A Determinant of Host Range’, Journal of Virology, 67: 1761–4. [DOI] [PMC free article] [PubMed] [Google Scholar]
- Sun T. et al. (2022) ‘Evolution of the PB1 Gene of Human Influenza A (H3N2) Viruses Circulating between 1968 and 2019’, Transboundary and Emerging Diseases, 69: 1824–36. [DOI] [PubMed] [Google Scholar]
- Taubenberger J. K. et al. (2005) ‘Characterization of the 1918 Influenza Virus Polymerase Genes’, Nature, 437: 889–93. [DOI] [PubMed] [Google Scholar]
- Te Velthuis A. J. W., and Fodor E. (2016) ‘Influenza Virus RNA Polymerase: Insights into the Mechanisms of Viral RNA Synthesis’, Nature Reviews Microbiology, 14: 479–93. [DOI] [PMC free article] [PubMed] [Google Scholar]
- Te Velthuis A. J. W., Grimes J. M., and Fodor E. (2021) ‘Structural Insights into RNA Polymerases of Negative-sense RNA Viruses’, Nature Reviews Microbiology, 19: 303–18. [DOI] [PMC free article] [PubMed] [Google Scholar]
- Valesano A. L. et al. (2021a) ‘SARS-CoV-2 Genomic Surveillance Reveals Little Spread from a Large University Campus to the Surrounding Community’, Open Forum Infectious Diseases, 8: ofab518. [DOI] [PMC free article] [PubMed] [Google Scholar]
- ——— et al. (2021b) ‘Temporal Dynamics of SARS-CoV-2 Mutation Accumulation within and across Infected Hosts’, PLOS Pathogens, 17: e1009499. [DOI] [PMC free article] [PubMed] [Google Scholar]
- Wei K. et al. (2014) ‘Influenza A Virus Acquires Enhanced Pathogenicity and Transmissibility after Serial Passages in Swine’, Journal of Virology, 88: 11981–94. [DOI] [PMC free article] [PubMed] [Google Scholar]
- Weigt M. et al. (2009) ‘Identification of Direct Residue Contacts in Protein–protein Interaction by Message Passing’, Proceedings of the National Academy of Sciences U.S.A, 106: 67–72. [DOI] [PMC free article] [PubMed] [Google Scholar]
- Wen L. et al. (2018) ‘Large-scale Sequence Analysis Reveals Novel Human-adaptive Markers in PB2 Segment of Seasonal Influenza A Viruses’, Emerging Microbes & Infections, 7: 47. [DOI] [PMC free article] [PubMed] [Google Scholar]
- Wickham H. 2016, Ggplot2: Elegant Graphics for Data Analysis. Springer; New York, NY, <https://ggplot2.tidyverse.org> accessed 1 Jan 2021. [Google Scholar]
- Wiley D. C., Wilson I. A., and Skehel J. J. (1981) ‘Structural Identification of the Antibody-binding Sites of Hong Kong Influenza Haemagglutinin and Their Involvement in Antigenic Variation’, Nature, 289: 373–8. [DOI] [PubMed] [Google Scholar]
- Wilson I. A., Skehel J. J., and Wiley D. C. (1981) ‘Structure of the Haemagglutinin Membrane Glycoprotein of Influenza Virus at 3 A Resolution’, Nature, 289: 366–73. [DOI] [PubMed] [Google Scholar]
- Wu N. C. et al. (2020) ‘Major Antigenic Site B of Human Influenza H3N2 Viruses Has an Evolving Local Fitness Landscape’, Nature Communications, 11: 1233. [DOI] [PMC free article] [PubMed] [Google Scholar]
- Yeang C.-H., and Haussler D. (2007) ‘Detecting Coevolution in and among Protein Domains’, PLoS Computational Biology, 3: e211. [DOI] [PMC free article] [PubMed] [Google Scholar]
Associated Data
This section collects any data citations, data availability statements, or supplementary materials included in this article.