Abstract
Traditional methods to assay enzymatic cleavage of DNA are discontinuous and time consuming. In contrast, recently developed fluorescence methods are continuous and convenient. However, no fluorescence method has been developed for single-stranded DNA digestion. Here we introduce a novel method, based on molecular beacons, to assay single-stranded DNA cleavage by single strand-specific nucleases. A molecular beacon, a hairpin-shaped DNA probe labeled with a fluorophore and a quencher, is used as the substrate and enzymatic cleavage leads to fluorescence enhancement in the molecular beacon. This method permits real time detection of DNA cleavage and makes it easy to characterize the activity of DNA nucleases and to study the steady-state cleavage reaction kinetics. The excellent sensitivity, reproducibility and convenience will enable molecular beacons to be widely useful for the study of single-stranded DNA cleaving reactions.
DNA cleavage reactions are important for cellular events, such as DNA replication, recombination and repair, as well as for molecular cloning and DNA analysis. These cleavage reactions are usually catalyzed by various enzymes, including the most commonly used restriction nucleases and non-specific nucleases (1,2). To assay the cleavage efficiency of these enzymes, several traditional methods have been used, such as gel electrophoresis, filter binding and high performance liquid chromatography (HPLC) (3–5). All these methods, however, are discontinuous, time consuming and laborious. Furthermore, detecting cleavage at low substrate concentrations necessitates radiolabeling. A continuous UV assay based on hyperchromic effects has been reported, but its application is limited by its narrow dynamic range of substrate concentration (6). Enzyme-linked immunosorbent assay (ELISA) has been used for enzymatic cleavage studies, but also suffers from being discontinuous (7). There have been recent efforts towards the development of fluorescence assays for DNA cleavage (8). These assays are based on fluorescence resonance energy transfer (FRET) or non-FRET quenching mechanisms. Usually, a fluorescence signal enhancement is observed after the cleavage reaction (8–11). These assays are continuous and convenient. However, up to now all of them have been designed only for restriction endonucleases and double-stranded DNA substrates. Furthermore, the potential for achieving high sensitivity through FRET has not been fully realized for the study of DNA cleavage (the signal to background ratio is only ~2 or less).
In this report, we introduce a fluorescence assay to monitor the cleavage of single-stranded DNA by single-strand-specific nucleases using recently developed molecular beacons. So far, many single-strand-specific nucleases that hydrolyze nucleic acids have been isolated from various sources, including fungi, bacteria, yeast, plants and animals. These enzymes exhibit high selectivity for single-stranded nucleic acids and produce mono- and oligonucleotides terminating in 5′-phosphoryl and 3′-phosphoryl groups (1,2,12). These nucleases are not only involved in biological processes (12), but have also found wide application in molecular biology and biotechnology, such as nucleic acid hybridization, analysis of nucleic acid structure, isolation of specific genes and gene manipulation (13–18). However, traditional methods, such as gel electrophoresis and sedimentation, to assay these nucleases are time consuming and usually require isotope labeling. It is necessary to develop sensitive, convenient and non-isotope-labeled methods to characterize these nucleases and their cleavage reactions. The assay introduced in this paper will enable an extremely high signal to background ratio (~40) to be achieved by taking advantage of the signal transduction mechanism built into the molecular beacon. The sensitivity of DNA cleavage assay is improved 20-fold in this report, compared with previous fluorescence methods. Molecular beacons are hairpin-shaped oligonucleotide probes which can report the presence of specific nucleic acids in solution (19,20). With the advantages of reporting target sequences in real time with high sensitivity and without isotope labeling, molecular beacons have found rapid application, from monitoring PCR to watching living cell hybridization to detecting DNA–protein binding events (21–24). Here we show that molecular beacons can be used to efficiently monitor in real time the cleavage of single-stranded DNA by single-strand-specific nucleases.
The mechanism of application of molecular beacons to monitoring DNA cleavage is shown schematically in Figure 1. The detailed structures and the synthesis of molecular beacons have been described previously (24). The molecular beacon contains a fluorophore moiety at one end and a non-fluorescent quencher moiety at the other. On its own, the molecular beacon adopts a hairpin-shaped structure. The stem of the hairpin keeps the two moieties in close proximity to each other, causing the fluorescence of the fluorophore to be quenched by FRET. In the presence of a single-strand-specific nuclease, the nuclease binds to and cleaves the single-stranded loop portion of the molecular beacon. Binding and cleavage by the nuclease may also break the stem and thus separate the fluorophore and quencher from each other, producing two DNA fragments. As a result, the fluorescence of the molecular beacon is restored. There are two possible situations where the fluorescence of the molecular beacon will not be restored (as indicated by the dashed arrow in Fig. 1). In the first case, the separated DNA fragments may anneal to each other again to form a new stem. In the second case, nuclease binding and cleavage may not result in breaking of the molecular beacon stem, thus producing two DNA fragments still linked to each other by the molecular beacon stem. However, the two fragments of the cleaved molecular beacon should be separated from each other because their melting temperatures are much lower than the cleavage temperature (37°C). Consequently, cleavage should give rise to an irreversible fluorescence enhancement. This constitutes the basis for quantitative analysis of the cleavage reaction.
Figure 1.
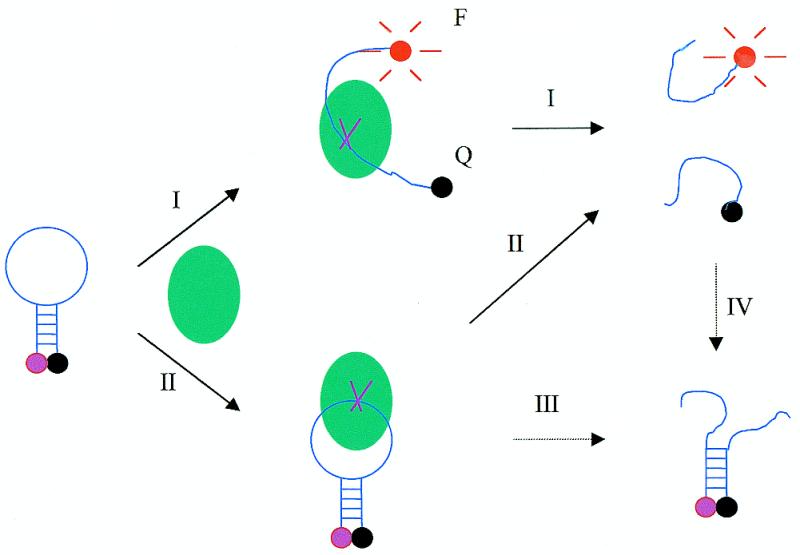
Schematic representation of the fluorescence mechanism of the molecular beacon during cleavage by single-strand-specific DNA nuclease (indicated by solid arrows). The solid arrows indicate two paths (I and II) leading to fluorescence enhancement during digestion. The dashed arrows represent two possible processes (III and IV) in which no fluorescence enhancement is produced. Only the first cut is shown here. Even though the nuclease may keep on cutting one single strand many times, only the first cut contributes to the fluorescence signal increase. The ball represents the nuclease. MB, F and Q represent molecular beacon, fluorophore and quencher, respectively. Here the fluorophore and quencher are tetramethylrhodamine (TAMRA) and 4-(4′-dimethylaminophenylazo)benzoic acid (DABCYL), respectively.
Molecular beacons can be used to study digestion with high sensitivity. In Figure 2a, time curves of fluorescence intensity of three molecular beacon solutions are recorded during digestion by three nucleases, S1 nuclease, mung bean nuclease and DNase I (1,2). The fluorescence intensities of the three samples gradually increase upon digestion before fluorescence intensity plateaus are reached. The fluorescence enhancement reflects restoration of the fluorescence of the fluorophore, which is a result of cleavage of the molecular beacon. Therefore, the fluorescence–time curves reveal the cleavage processes in real time. The minor differences in the plateau heights among the three nucleases is due to differences in their respective digestion buffers. It is known that DNase I can digest both single- and double-stranded DNA completely (1–3), thus the fluorophore and quencher in the molecular beacon should be separated from each other after DNase I digestion. The fact that all three nucleases cause similar enhancements in fluorescence intensity (Fig. 2a) indicates that cleavage by S1 and mung bean nucleases can also separate the fluorophore and quencher with similar efficiency. The fluorescence intensity enhancement factor (signal to noise ratio) is ~40 for S1 nuclease, mung bean nuclease and DNase I. This value is higher than the enhancement factor, ~35, produced by the complementary DNA of the molecular beacon. This is reasonable because in the former case the fluorophore and quencher of the cleaved molecular beacon are completely separated from each other, while the two moieties are still linked to each other by one fragment of double-stranded DNA in the cDNA case. These high fluorescence enhancements clearly demonstrate that molecular beacons can be used as ultrasensitive probes for monitoring DNA digestion in real time. Moreover, the initial digestion rate can be measured from the linear portion of the time curve. This initial cleavage rate is calculated using the data obtained in the first 90 s of the time curve. It can then be used to determine the enzyme activity in the cleavage reaction. An alternative method to measure enzyme activity is to calculate the average digestion rate based on the fluorescence spectra taken at different times of digestion, as shown in the insert in Figure 2a. However, the initial rate method is simpler.
Figure 2.
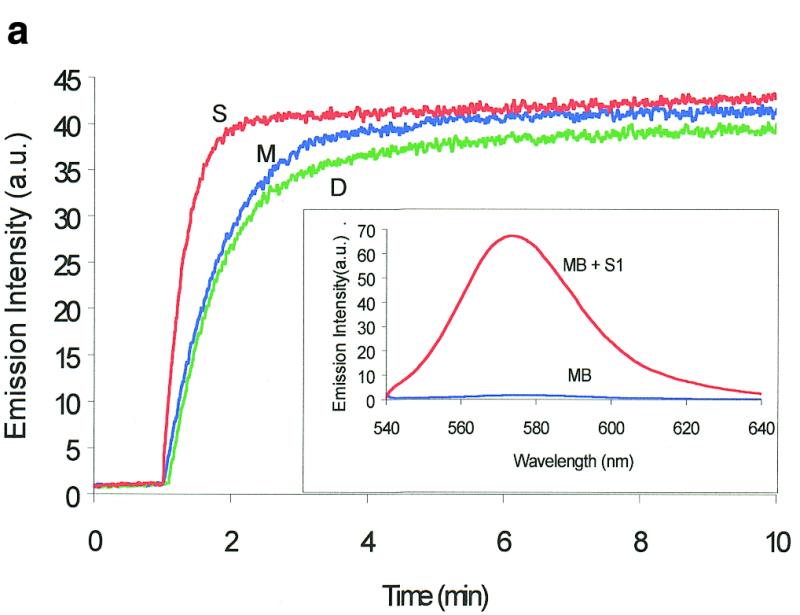
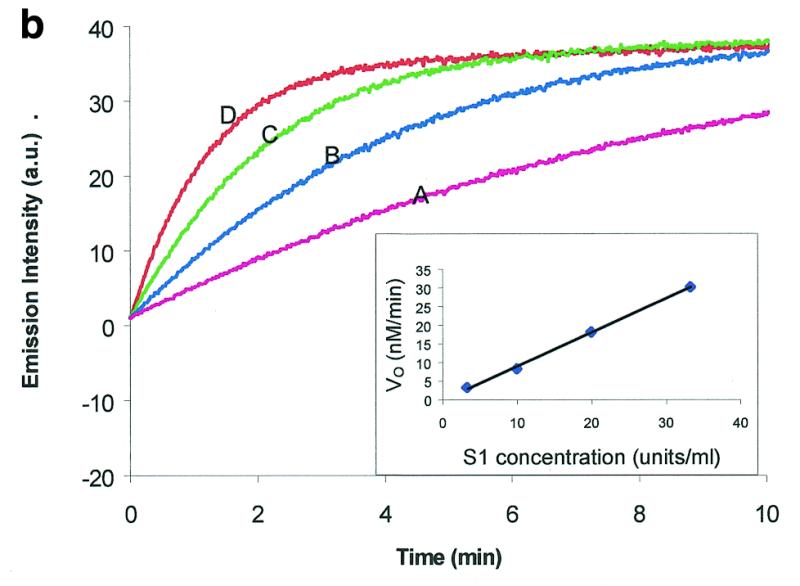
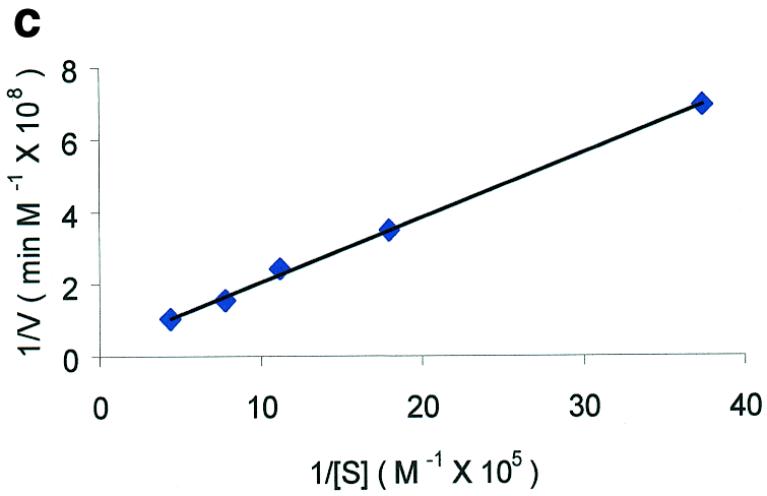
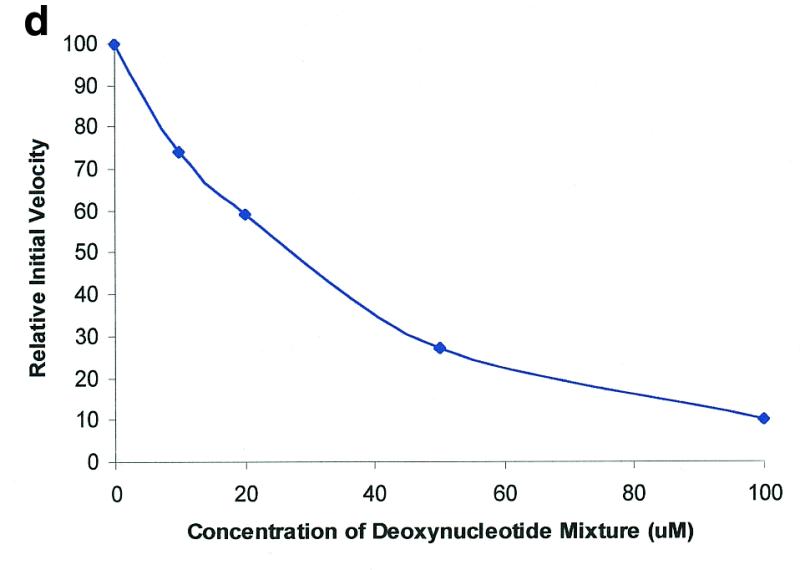
Molecular beacon assay for the cleavage of single-stranded DNA. All cleavage reactions catalyzed by S1 (Promega, Madison, WI) and mung bean (New England Biolabs, Beverly, MA) nucleases were carried out in a buffer consisting of 50 mM NaAc, pH 5.0, 30 mM NaCl, 1 mM ZnSO4. The cleavage buffer for DNase I (Sigma, St Louis, MO) was similar except that ZnSO4 was replaced by 2 mM MgCl2. All reactions were performed at 37°C. All excitation and emission wavelengths for time curves were 558 and 580 nm, respectively, except that 530 nm excitation was used for the emission spectrum. (a) Time curves of the fluorescence intensity of the molecular beacon during digestion by several nucleases. S, M and D represent S1 and mung bean nucleases and DNase I, respectively. (Inset) Fluorescence spectrum of the molecular beacon before (molecular beacon) and after digestion (molecular beacon + S1). [Molecular beacon] = 500 nM; [S1 nuclease] = 200 U/ml; [DNase I] = 1.6 U/ml; [mung bean nuclease] = 500 U/ml. (b). Time curves of cleavage of the molecular beacon by S1 nuclease at different enzyme concentrations. (Insert) Initial cleavage velocity as a function of increasing S1 concentration. [Molecular beacon] = 50 nM; 1 U of S1 nuclease = 7.8 × 10⁻¹⁴ mol. (c) Lineweaver–Burk plot of the cleavage reaction of molecular beacon by S1 nuclease. [S1 nuclease] = 0.015 nM. The concentration of molecular beacon was changed from 120 to 2300 nM. (d) Inhibitory effect of deoxynucleoside triphosphates (dNTP) on the initial cleavage velocity of the molecular beacon by S1 nuclease. [Molecular beacon] = 100 nM; [S1 nuclease] = 10 U/ml. The dNTP solution contained equal moles of dATP, dGTP, dTTP and dCTP.
The cleavage reaction rate is dependent on enzyme concentration. The cleavage reaction was monitored as a function of enzyme concentration. S1 nuclease was chosen as an example. Figure 2b shows the time curves of the digestion reaction of a fixed amount of molecular beacon with different S1 nuclease concentrations. A good linear relationship was observed between initial digestion rate and enzyme concentration (shown as the insert in Fig. 2b). This indicates that the cleavage reaction is first order with respect to S1 nuclease concentration. This is consistent with the general model for enzyme-catalyzed reactions (25).
To further confirm the validity of the molecular beacon-based method, the relationship between initial digestion rate and substrate concentration was studied. As shown in Figure 2c, the initial digestion rate increases with an increase in substrate concentration. The initial cleavage rate, V0, was measured from the time curves. Plotting 1/V0 versus 1/[S] (V0 and [S] represent the initial velocity and substrate concentration, respectively) yields a straight line (the Lineweaver–Burk plot in Fig. 2c). This indicates that the kinetics data fit well with the Michaelis–Menten equation (25). From the Lineweaver–Burk plot, several important kinetic parameters, Vmax (maximum initial velocity), Km (Michaelis–Menten constant) and kcat (turnover number), are determined. For S1 nuclease, Vmax, Km and kcat are 6.3 × 10⁻¹⁰ M s–1, 6.8 × 10⁻⁶ M and 42 s–1, respectively. kcat/Km is calculated to be 6.2 × 10⁶ M–1 s–1. Km for S1 nuclease has been reported to vary from 5 × 10⁻³ to 2 × 10⁻⁸ M (26–28). Such a significant difference in Km is caused by different reaction conditions and the various substates used by different authors.
The molecular beacon-based assay detects only the first cleavage of a molecular beacon by single-strand-specific nucleases. In contrast to restriction endonucleases, single- strand-specific nucleases can make many cuts in a single-stranded DNA (1,2). One initial binding and cutting event may be followed by many successive cutting events before substrate release or the nuclease may rebind to an incomplete digestion product and then cleave it (in the initial digestion stage where initial velocity is measured, rebinding can be neglected because of the relative abundance of the intact substrate). Because the first bind and cut gives rise to fragmentation of the molecular beacon and fluorescence enhancement, subsequent cutting does not further change the fluorescence enhancement. Therefore, this assay extracts only kinetics information for the first binding and cutting event and effectively eliminates subsequent cutting events. As shown in Figure 2b, the digestion kinetics data based on this assay obey the Michaelis–Menten equation. It is worth noting that the four kinetic parameters obtained in our experiments need to be compared and correlated on the understanding that they only concern the first cutting event in DNA digestion. Vmax represents only the velocity of the first binding and cutting event and should thus be smaller than the value in which subsequent cutting is also considered. This situation should be similar for kcat and kcat/Km. However, Km remains constant regardless of the number of cutting events on the substrate.
The molecular beacon-based assay can be used to study the effects of a variety of experimental parameters. As is well known, enzyme activity and kinetic parameters may change significantly with different cleavage reaction conditions. Thus, an assay with easy and adequate characterization of an enzyme and its catalytic reactions will enable a better understanding of the enzymatic reactions performed under various conditions. The method developed here is convenient and accurate in detecting the influence of various catalytic conditions on DNA cleavage reactions. As one example, Figure 2d shows the effect of deoxynucleotides on molecular beacon cleavage by S1 nuclease. It can be seen that deoxynucleotides can apparently inhibit S1 nuclease activity. The inhibitory effect increases with an increase in the concentration of deoxynucleotides. This inhibitory effect is consistent with previously reported results (29). Since the method has a high sensitivity of fluorescence detection, it allows us to monitor minor inhibitory effects, as shown in Figure 2d.
Binding between DNA and the nuclease has been considered to be the initial step in DNA cleavage reactions (30,31). Further study is necessary to determine whether restoration of the fluorescence of the molecular beacon occurs at the binding step (path I in Fig. 1) or at the cleavage/release step (path II in Fig. 1) in this assay. If binding is an intrinsic process of the DNA cleavage reaction, this ambiguity does not prevent us from studying the steady-state kinetics of cleavage of the molecular beacons, since the two fragments of the cleaved molecular are completely separated. On the other hand, mere protein binding, which does not result in DNA cleavage, could also disturb the original conformation of the molecular beacon, opening the molecular beacon for fluorescence enhancement (24). Therefore, it is necessary to address whether the fluorescence enhancement in this assay is caused by mere binding or by binding/cleavage. We have four reasons to support the hypothesis that the fluorescence enhancement observed in this report is mainly due to the enzymatic DNA cleavage reaction. First, the protein–DNA interaction rapidly restores molecular beacon fluorescence, taking only a few seconds (24), while the cleavage reaction takes minutes to reach a plateau, even when relatively high enzyme concentrations are used. Second, protein binding does not result in an enhancement of fluorescence intensity greater than that due to DNA hybridization (24), while molecular beacon cleavage does, as stated above. Third, the experimental data fit well with the Michaelis–Menten equation, which indicates that the reaction is an enzymatic cleavage reaction. Fourth, the molar ratio of nuclease to molecular beacon is so small that only an extremely small portion of the molecular beacon would be bound by the nuclease enzyme. Even if protein binding restores molecular beacon fluorescence, the fluorescence enhancement should be small. For example, the molar ratio of nuclease to molecular beacon in Figure 2c is 10–4 or less.
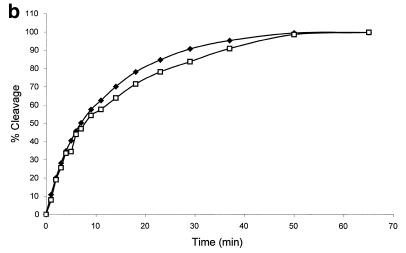
We also obtained direct evidence to show that the fluorescence enhancement in this report is due to the binding/cleavage reaction instead of mere binding. We carried out comparison experiments on cleavage of the molecular beacons by S1 nuclease using fluorescence assay and gel electrophoresis assay. As shown in Figure 3a, the amount of intact molecular beacon decreases with increasing digestion time, indicating cleavage of the molecular beacon. The smeared bands in Figure 3a reveal that DNA fragments of different lengths are produced during digestion, suggesting random cutting of the molecular beacons by S1 nuclease. To further correlate the fluorescence assay results with those from gel electrophoresis, the percentage cleavage values obtained using both methods were plotted against digestion time. As shown in Figure 3b, the two results fit well with each other. This clearly demonstrates that the fluorescence signal enhancement does reflect the cleavage reaction. The decrease in fluorescence intensity of the top bands in the gel electrophoresis image reveals only the first cutting event (any single cut will be enough to shorten the molecular beacon and decrease the amount of intact molecular beacon in the upper band). The fact that this data matches the fluorescence spectrometer data clearly supports the presumption presented in Figure 1: the fluorescence signal increase reflects only the first cut.
Figure 3.
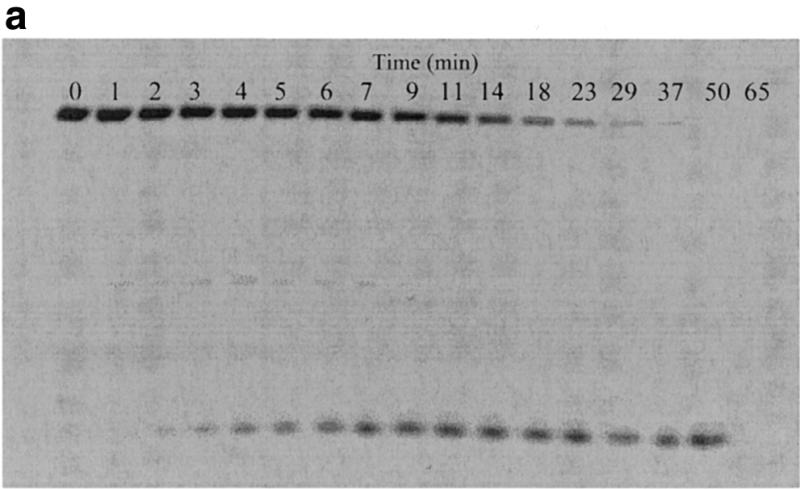
Correlation of fluorescence assay and gel electrophoresis assay for the cleavage of the molecular beacons by S1 nuclease. The reactions were performed as described in Figure 2 with the following changes: 6 µM molecular beacon, 20 U/ml S1, 400 µl reaction volume. The time driving curve was recorded after the addition of 0.8 µl of S1 into the molecular beacon solution. For the gel electrophoresis assay, 10 µl samples of the reaction mixture were removed at specific time points from the fluorescence cuvette and added to 4 µl of 1 M Tris–HCl buffer (pH 7.8) on ice to quench the reaction. (a) Polyacrylamide gel assay for cleavage of the molecular beacon by S1 nuclease. The samples were run on a 15% denaturing polyacrylamide gel to separate the cleaved products from the substrate. Fluorescence image was taken by exciting the fluorophore in the molecular beacon or in the cleaved fragments. The upper band represents the uncleaved molecular beacon and the reaction time points (min) are presented above the bands. (b) Comparison of percentage of molecular beacon cleavage between the fluorescence assay (closed diamonds) and the gel electrophoresis assay (open squares). The fluorescence assay curve was extracted from the time driving curve, while the percentage of substrate cleavage at each time point for the gel electrophoresis assay was determined by quantifying the fluorescence decrease of the intact substrate relative to the total fluorescence using Bio-Rad Gel Doc 1000®.
In summary, we have for the first time developed a novel method to monitor the cleavage of single-stranded DNA by single-strand-specific nucleases. This assay uses molecular beacon DNA probes for signal transduction. It has high sensitivity and convenience. This represents the first fluorescence assay for probing single-standed DNA nuclease activity. Both natural and artificial DNA/RNA nucleases are being discovered and developed. They are providing new tools for molecular biology and biotechnology, as well as new insights into the structure–function relationships of DNA/RNA molecules (32–37). This simple assay with extremely high sensitivity will make it widely and highly useful for convenient characterization for these new nucleases and their cleavage reactions.
Acknowledgments
ACKNOWLEDGEMENTS
We thank Dr Steve Benner for helpful discussions. This work was partially supported by the Office of Naval Research Young Investigator Award N00014-98-1-0621, NSF Career Award 9733650 and by NSF Nanotechnology Initiative BIO-9871880.
REFERENCES
- 1.Linn S.M. and Roberts,R.J. (1982) Nucleases. Cold Spring Harbor Laboratory Press, Cold Spring Harbor, NY.
- 2.Linn S.M., Lloyd,R.S. and Roberts,R.J. (1993) Nucleases, 2nd Edn. Cold Spring Harbor Laboratory Press, Cold Spring Harbor, NY.
- 3.Sambrook J., Fritsch,E.F. and Maniatis,T. (1989) Molecular Cloning: A Laboratory Mannual, 2nd Edn. Cold Spring Harbor Laboratory Press, Cold Spring Harbor, NY.
- 4.McLaughlin L.W., Benseler,F., Graeser,E., Piel,N. and Scholtissek,S. (1987) Biochemistry, 26, 7238–7245. [DOI] [PubMed]
- 5.Alves J., Ruter,T., Geiger,R., Fliess,A., Maass,G. and Pingoud,A. (1989) Biochemistry, 28, 2678–2684. [DOI] [PubMed]
- 6.Waters T.R. and Connolly,B.A. (1992) Anal. Biochem., 204, 204–209. [DOI] [PubMed]
- 7.Jeltsch A., Fritz,A., Alves,J., Wolfes,H and Pingoud,A. (1993) Anal. Biochem., 213, 234–240. [DOI] [PubMed]
- 8.Lee S.P. and Han,M.K. (1997) Methods Enzymol., 278, 343–363. [DOI] [PubMed]
- 9.Ghosh S.S., Eis,P.S., Blumeyer,K., Fearon,K. and Millar,D.P. (1994) Nucleic Acids Res., 22, 3155–3159. [DOI] [PMC free article] [PubMed]
- 10.Lee S.P., Gensullo,M.L., Kim,H.G., Knutson,J.R. and Han,M.K. (1995) Anal. Biochem., 227, 295–301. [DOI] [PubMed]
- 11.Lee S.P., Porter,D., Chirikjian,J.G., Knutson,J.R. and Han,M.K. (1994) Anal. Biochem., 220, 377–383. [DOI] [PubMed]
- 12.Gite S.U. and Shankar,V. (1995) Crit. Rev. Microbiol., 21, 101–122. [DOI] [PubMed]
- 13.Ma M., Benimetskaya,L., Ebedeva,I., Dignam,J., Takle,G. and Stein,C.A. (2000) Nature Biotechnol., 18, 58–61. [DOI] [PubMed]
- 14.Wang J., Chen,R. and Julin,D.A. (2000) J. Biol. Chem., 275, 507–513. [DOI] [PubMed]
- 15.Cassler M.R., Grimwade,J.E., McGarry,K.C., Mott,R.T. and Leonard,A.C. (1999) Nucleic Acids Res., 27, 4570–4576. [DOI] [PMC free article] [PubMed]
- 16.Trang P. and Hsu,A.W. and Liu,F. (1999) Nucleic Acids Res., 27, 4590–4597. [DOI] [PMC free article] [PubMed]
- 17.Judice J.K., Gamble,T.R., Murphy,E.C., de Vos,A.M. and Schultz,P.G. (1993) Science, 261, 1578–1581. [DOI] [PubMed]
- 18.Natsoulis G. and Boeke,J.D. (1991) Nature, 352, 632–635 [DOI] [PubMed]
- 19.Tyagi S. and Kramer,F.R. (1996) Nature Biotechnol., 14, 303–308. [DOI] [PubMed]
- 20.Piatek A.S., Tyagi,S., Pol,A.C., Telenti,A., Miller,L.P., Kramer,F.R. and Alland,D. (1998) Nature Biotechnol., 16, 359–363. [DOI] [PubMed]
- 21.Fang X., Liu,X., Schuster,S. and Tan,W. (1999) J. Am. Chem. Soc., 121, 2921.
- 22.Sokol D.L., Zhang,X., Lu,P. and Gewirtz,A.M. (1998) Proc. Natl Acad. Sci. USA, 95, 11538–11543. [DOI] [PMC free article] [PubMed]
- 23.Vet J.A., Majithia,A.R., Marras,S.A., Taygi,S., Dube,S., Poiesz,B.J. and Kramer,F.R. (1999) Proc. Natl Acad. Sci. USA, 96, 6394–6399. [DOI] [PMC free article] [PubMed]
- 24.Li J.J., Fang,X., Schuster,S. and Tan,W. (2000) Angew. Chem. Int. Edn English, 39, 1049–1052. [DOI] [PubMed]
- 25.Lehninger A.L., Nelson,D.L. and Cox,M.M. (1993) Principles of Biochemistry. Worth Publishers, New York, NY.
- 26.Shoyab M. (1979) Cancer Lett., 7, 155–162. [DOI] [PubMed]
- 27.Gonikberg E.M. (1979) Mol. Biol. (Mosk.), 13, 1064–1069. [PubMed]
- 28.Butour J.L., Mazard,A.M., Vieussens,C. and Johnson,N.P. (1990) Chem. Biol. Interact., 73, 195–205. [DOI] [PubMed]
- 29.Wiegand R.C., Godson,G.N. and Radding,C.M. (1975) J. Biol. Chem., 250, 8848–8855. [PubMed]
- 30.Alves J., Urbanke,C., Fliess,A., Maass,G. and Pingoud,A. (1989) Biochemistry, 28, 7879–7888. [DOI] [PubMed]
- 31.Wu Z. and Chaconas,G. (1995) EMBO J., 14, 3835–3843. [DOI] [PMC free article] [PubMed]
- 32.Chen C.H. and Sigman,D.S. (1987) Science, 237, 1197–1201. [DOI] [PubMed]
- 33.Sigman D.S., Chen,C.H. and Gorin,M.B. (1993) Nature, 363, 474–475. [DOI] [PubMed]
- 34.Gasmi G., Pasdeloup,M., Pratviel,G., Pitie,M., Bernadou,J. and Meunier,B. (1991) Nucleic Acids Res., 19, 2835–2839. [DOI] [PMC free article] [PubMed]
- 35.Komiyama M., Inokawa,T., Shiiha,T., Takeda,N., Yoshinari,K. and Yashiro,M. (1993) Nucleic Acids Symp. Ser., 29, 197–198. [PubMed]
- 36.Perrin D.M., Mazumder,A. and Sigman,D.S. (1996) Prog. Nucleic Acid Res. Mol. Biol., 52, 123–151. [DOI] [PubMed]
- 37.Chen C.H., Landgraf,R., Walts,A.D., Chan,L., Schlonk,P.M., Terwilliger,T.C. and Sigman,D.S. (1998) Chem. Biol., 5, 283–292. [DOI] [PubMed]


