Abstract
The anterior auditory field (AAF) is a core region of the auditory cortex and plays a vital role in discrimination tasks. However, the role of the AAF corticostriatal neurons in frequency discrimination remains unclear. Here, we used c-Fos staining, fiber photometry recording, and pharmacogenetic manipulation to investigate the function of the AAF corticostriatal neurons in a frequency discrimination task. c-Fos staining and fiber photometry recording revealed that the activity of AAF pyramidal neurons was significantly elevated during the frequency discrimination task. Pharmacogenetic inhibition of AAF pyramidal neurons significantly impaired frequency discrimination. In addition, histological results revealed that AAF pyramidal neurons send strong projections to the striatum. Moreover, pharmacogenetic suppression of the striatal projections from pyramidal neurons in the AAF significantly disrupted the frequency discrimination. Collectively, our findings show that AAF pyramidal neurons, particularly the AAF–striatum projections, play a crucial role in frequency discrimination behavior.
Keywords: Anterior auditory field, Corticostriatal neuron, Frequency discrimination, AAF–striatum projection
Introduction
The anterior auditory field (AAF) and primary auditory cortex (A1) are the major cortical fields in the rodent auditory system [1–4]. Extensive studies have been conducted on the cortical topology, plasticity, cellular response properties, and functional role of A1 [1–5]. Optogenetic manipulations of A1 activity modulate frequency discrimination performance requiring temporal integration [6, 7]. However, little is known about the role of the AAF in auditory information processing, especially in discriminative behavior.
Recently, we found that the AAF plays a key role in the categorization of sound frequency in rats [8]. The results of behavioral experiments also suggested that injecting the γ-aminobutyric acid (GABA) receptor agonist muscimol into the AAF disrupts the frequency discrimination of rats. Moreover, pharmacological inhibition of the AAF activity significantly affects the acquisition of auditory fear behavior [8]. Lomber et al. found that inhibition of the bilateral AAF impairs auditory temporal discrimination, whereas inhibition of the posterior auditory cortex area affects the recognition of the sound source’s location [9]. These results suggest that the AAF plays an important role in frequency discrimination.
Previous studies on the AAF mainly focused on its projection relationships within the auditory system. The AAF and A1 receive large inputs from different thalamic divisions. For example, the AAF mainly receives projections from the posterior thalamus complex, while A1 mainly receives projections from the ventral medial geniculate body [1, 10]. In addition, anatomical and physiological studies have demonstrated that the auditory cortex sends excitatory glutamate projections to the striatum [11], which is involved in the regulation of reward, emotion, motivation, and other higher cognitive functions [12–14]. Thus, the different inputs and projections between AAF and A1 suggest that AAF neurons differ from A1 neurons in physiological properties. Importantly, Song et al. also found that there is a strong projection from the AAF to the striatum [13, 15]. Although corticostriatal neurons in A1 are involved in modulating frequency discrimination [16, 17], whether AAF pyramidal neurons and the AAF–striatum pathway are involved in auditory-related discrimination behaviors is unknown.
Thus, in the present study, we used c-Fos staining, fiber photometry recording, and pharmacogenetic manipulation to investigate the function of AAF corticostriatal neurons in a sound discrimination task.
Materials and Methods
Animals
Adult C57BL/6J mice (male, 6–8 weeks, 25–28 g) were provided by the Laboratory Animal Center at the Army Medical University. All experimental procedures were performed in accordance with institutional animal welfare guidelines and were approved by the Army Military Medical University Animal Care and Use Committee. Animals were maintained on a 12-h light/dark cycle with free access to food and water. All efforts were made to minimize animal suffering.
Auditory Frequency Discrimination Behavior
A SuperFcs system (XinRuan, Shanghai, China) was used to generate sound and electricity. Freezing was assessed when no movement (besides respiratory movements) lasted for 0.5 s or more, and the total freezing time during a sound presentation was assessed based on the SuperFcs system.
Training
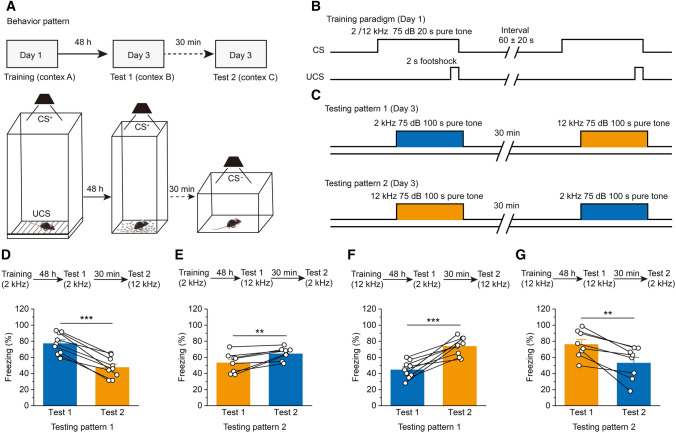
Mice were placed in a training chamber (28.5 cm × 32 cm × 52.5 cm) and allowed to explore for 100 s for habituation (Fig. 1A, B). After the 100 s baseline period, mice were exposed to 5 pairings composed of a 20-s pure tone (75 dB) and a 2-s footshock (0.6 mA). The tone and the footshock ended at the same time. The tone that was associated with the footshock was the conditioned stimulus (CS). The footshock was the unconditioned stimulus (UCS). The inter-trial interval was 60 ± 20 s at random. Mice were trained to remember one of the two different sound frequencies (a 2- or 12-kHz pure tone) alone. After five trials, animals were transported to their home cage using a transfer cage.
Fig. 1.
Mice can differentiate between different tone frequencies in the fear conditioning task. A Experimental scheme for the training and fear conditioning tests. B Experimental timeline for the training paradigm. C Experimental timeline for the testing paradigm. D, E Freezing levels of the mice in the testing pattern 1 (D; n = 9) and testing pattern 2 (E; n = 8) during the 2-kHz training paradigm. F, G Freezing levels of the testing pattern 1 (F; n = 9) and testing pattern 2 (G; n = 8) during the 12-kHz training paradigm. For D–G: all data are shown as the mean ± SEM; **P <0.01, ***P <0.001, Paired Student’s t-test. CS+, conditioned stimulus (the pure tone paired with the footshock); CS−, the pure tone not paired with the footshock; UCS, unconditioned stimulus (the footshock).
Behavior Test
During paired training, mice were taught to associate a sound with a footshock (Fig. 1C). On the third day, a different cage was used to transfer the testing animals to the testing chamber, which now had a different size (25 cm × 25 cm × 40 cm). To eliminate the effect of sound order on the test results, we established two different testing patterns: 12 kHz or 2 kHz were first used to test the freezing level, then the other frequency was subsequently used to test the mice’s freezing level. The mice were allowed to explore the testing chamber for 100 s (baseline), after which the pure tone cue (CS+, 75 dB), the same as that used in the training session. was delivered continuously for 100 s. After 30 min, a 100-s pure tone (75 dB) that was not the conditioned stimulus (CS−) was delivered in a different, custom-made chamber (30 cm × 20 cm × 40 cm). The other testing pattern used the opposite sound order. Moreover, filter paper or crushed corncob was placed in the bottom of the two testing chambers to increase contextual diversity.
Freezing time was measured when a lack of movement (except respiratory movements) lasted for 0.5 s or more based on detections by the SuperFcs system. The percentage of freezing time was calculated as the ratio between the total freezing time during the sound presentation and the duration of the entire sound presentation. The percentage was assessed based on the behavior of each animal, and the total percentage of freezing time was compared between groups.
Virus and CTB488 Injection
Mice were anesthetized with isoflurane (1%–1.5% isoflurane/oxygen,) and fixed in a stereotaxic apparatus (RWD Life Science, Shenzhen, China) as described previously [11–13]. The viruses or cholera toxin subunit B488 (CTB488, C34775, Invitrogen, Carlsbad, USA) was injected using glass micropipettes (tip diameter, 10–20 μm) at a specific speed (15 nL/min) and volume, controlled by a nanoliter injector (Nanoject III, Drummond Scientific, USA). The micropipette tip was left in place for an additional 5 min after injection, then slowly withdrawn.
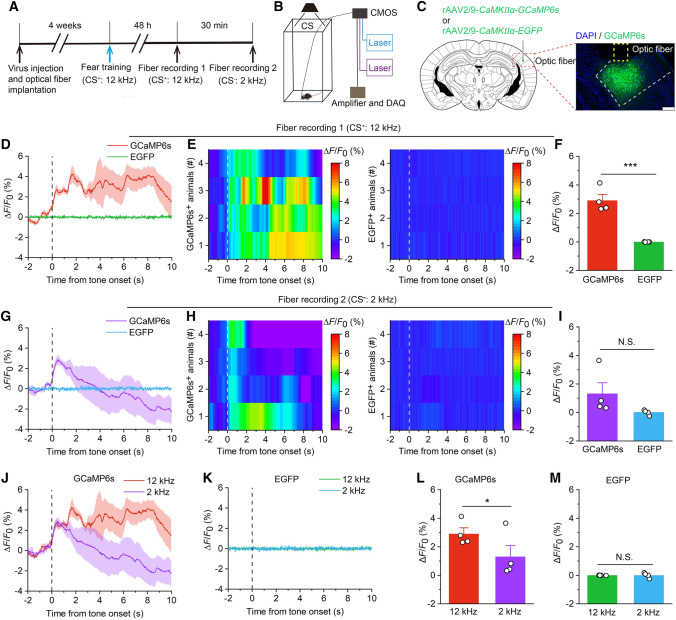
To facilitate fiber photometry recording of AAF excitatory neuronal activity during auditory frequency discrimination behavior, mice were microinjected with 50 nL of rAAV2/9-CaMKIIα-GCaMP6s [titer: 5.90 × 10¹² genome copies (GC)/mL] or rAAV2/9-CaMKIIα-EGFP (titer: 4.05 × 10¹² GC/mL; Fig. 3B) into the right AAF.
Fig. 3.
Activation of pyramidal neurons in the AAF during auditory frequency discrimination. A Experimental scheme for virus injection followed by fiber recording. B Schematic of synchronized recordings of the fluorescence signal and tone frequency dynamics in animals. CMOS, complementary metal oxide semiconductor; DAQ, data acquisition. C Schematic showing virus injection and optical implantation into the right AAF. Scale bar, 200 μm. D Average fluorescence change induced by 12-kHz tone (CS+) in the GCaMP6s and EGFP groups. E Heatmaps showing the average fluorescence change induced by 12-kHz tone in the GCaMP6s and EGFP groups. F Mean ΔF/F0 (0–6 s) induced by 12-kHz tone in the GCaMP6s and EGFP groups (n = 4 per group). G Average fluorescence change induced by 2-kHz tone (CS−) in the GCaMP6s and EGFP groups. H Heatmaps showing the average fluorescence change induced by 2-kHz tone in the GCaMP6s and EGFP groups. I Mean ΔF/F0 (0–6 s) induced by 2-kHz tone in the GCaMP6s and EGFP groups (n = 4 per group). J Average fluorescence change of GCaMP6s induced by 12-kHz and 2-kHz. K Average fluorescence change of EGFP induced by 12-kHz and 2-kHz. L Mean ΔF/F0 (0–6 s) of GCaMP6s induced by 12-kHz and 2-kHz. M Mean ΔF/F0 (0–6 s) of EGFP induced by 12-kHz and 2-kHz. For D, G, J, and K, thick lines indicate mean and shaded areas indicate SEM, and the dashed lines indicate the beginning of tone. For E and H, each row represents one animal. All data are shown as the mean ± SEM; N.S., no significant difference, *P <0.05, ***P <0.001, unpaired Student’s t-test.
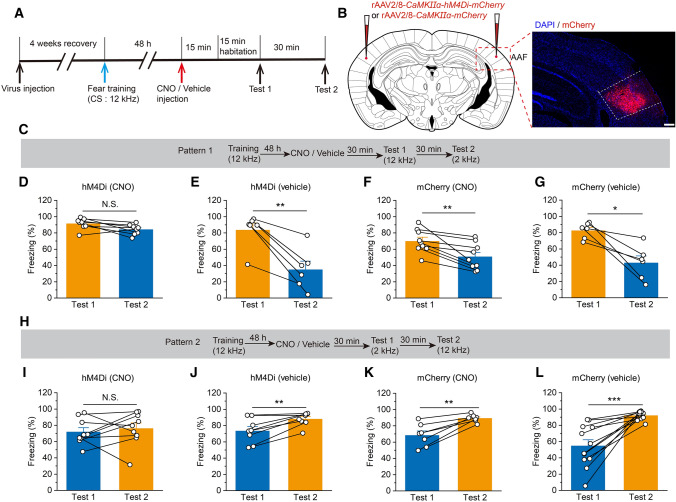
For pharmacogenetic inhibition of AAF pyramidal neuronal activity during auditory frequency discrimination behavior, mice were microinjected with either 50 nL of rAAV2/8-CaMKIIα-hM4Di-mCherry (titer: 5.89 × 10¹² GC/mL) or rAAV2/8-CaMKIIα-mCherry (titer: 5.04 × 10¹² GC/mL) as a control into the bilateral AAF (Fig. 4B).
Fig. 4.
Significant reduction in auditory frequency discrimination due to pharmacogenetic inhibition of AAF pyramidal neurons. A Experimental timeline for virus injection and behavior testing. B Schematic showing bilateral injection of virus into the AAF. Scale bar, 200 μm. C Experimental scheme for the training and fear conditioning test of pattern 1. D Pharmacogenetic inhibition of hM4Di+ pyramidal neurons in the AAF (injected with CNO) significantly disrupts the auditory frequency discrimination behavior (n = 8). E Vehicle injection does not influence the auditory frequency discrimination behavior of hM4Di-infected animals (n = 6). F, G The mCherry-infected mice (injected with CNO or vehicle) significantly differentiate the two frequency tones (F: n = 9; G: n = 6). H Experimental scheme for the training and fear conditioning test of pattern 2. I Pharmacogenetic inhibition of pyramidal neurons expressed hM4Di (injected with CNO) significantly disrupts the auditory frequency discrimination behavior (n = 9). J Vehicle injection does not influence the auditory frequency discrimination behavior of hM4Di-infected animals (n = 8). K, L The mCherry-infected mice (injected with CNO or vehicle) significantly discriminate the two frequency tones (K: n = 7; L: n = 12). All data are shown as the mean ± SEM, N.S., no significant difference; **P <0.01, ***P <0.001, paired Student’s t-test.
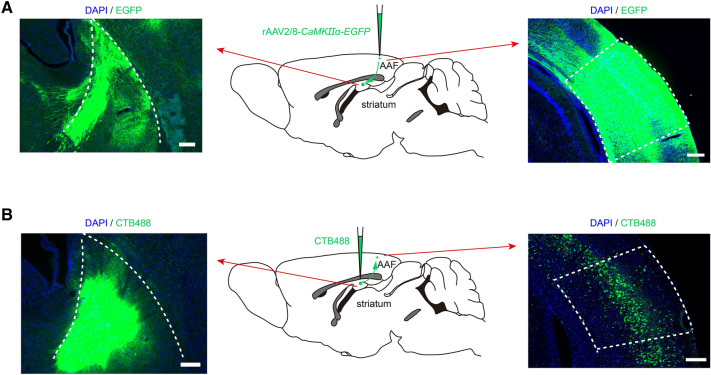
For anterograde tracing of the AAF–striatum projections, mice were microinjected with 50 nL of rAAV2/8-CaMKIIα-EGFP-P2A-MCS-3FLAG (titer: 8.21 × 10¹² GC/mL) into the right AAF (Fig. 5A).
Fig. 5.
Neuronal projection from the AAF to the striatum. A Neuronal projection from the AAF to the striatum was revealed using EGFP. Middle, EGFP diagram tracing from the AAF to the striatum. Left, EGFP in the striatum. Right, The virus is microinjected into the AAF. Scale bars, 200 μm. B Neuronal projection from the striatum to the AAF revealed using CTB488. Middle, CTB488 diagram tracing from the striatum to the AAF. Left, CTB488 is microinjected into the striatum. Right, CTB488 signals in the AAF retrogradely filled from the striatum. Scale bars, 200 μm.
Mice were microinjected with 150 nL of CTB488 (0.1%, w/v) into the right striatum to allow retrograde tracing of the AAF–striatum projections, and 14 days were allowed for retrograde tracer transport (Fig. 5B).
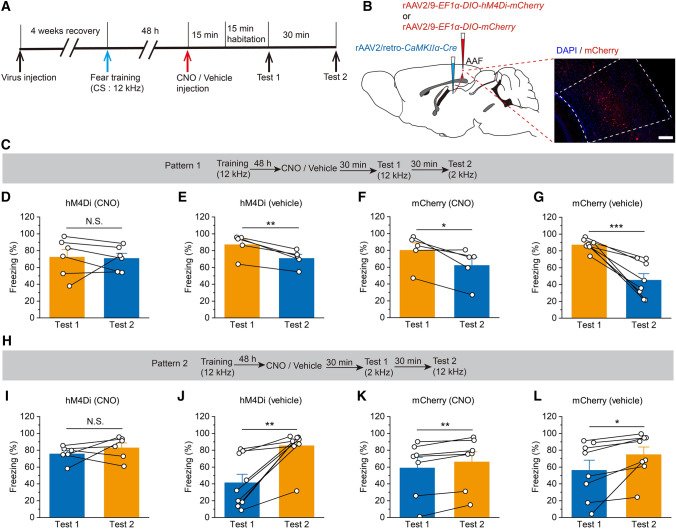
Mice were microinjected with 50 nL rAAV2/9-EF1α-DIO-hM4Di-mCherry (titer: 2.42 × 10¹² GC/mL) to pharmacogenetically inhibit AAF excitatory neuron activity during auditory frequency discrimination behavior or 50 nL rAAV2/9-EF1α-DIO-mCherry (titer: 2.71 × 10¹² GC/mL) as a control into the bilateral AAF. The mice were also bilaterally microinjected with 150 nL rAAV2/retro-CamkIIα-Cre (titer: 6.62 × 10¹² GC/mL) into each side of the striatum (Fig. 6B).
Fig. 6.
Pharmacogenetic inhibition of the AAF pyramidal neuron projections to the striatum significantly suppresses the auditory frequency discrimination behavior. A Experimental timeline for virus injection and behavior testing. B Schematic for viral injection to prevent pyramidal neurons in the AAF from interacting with the striatum and a sample image showing the expression of hM4Di-mCherry in the AAF. Scale bar, 200 μm. C Experimental scheme for the training and fear conditioning test of pattern 1. D Pharmacogenetic inhibition of pyramidal neurons expressing hM4Di (injected with CNO) significantly impairs the auditory frequency discrimination behavior (n = 6). E Vehicle injection does not influence the auditory frequency discrimination behavior of hM4Di-infected animals (n = 5). F, G The mCherry-infected mice (injected with CNO or vehicle) significantly discriminate the two frequency tones (F: n = 5; G: n = 8). H Experimental scheme for the training and fear conditioning test of pattern 2. I Pharmacogenetic inhibition of pyramidal neurons expressed hM4Di (injected with CNO) significantly impairs auditory frequency discrimination behavior (n = 6). J Vehicle injection does not influence the auditory frequency discrimination behavior of hM4Di-infected animals (n = 9). K, L The mCherry-infected mice (injected with CNO or vehicle) significantly discriminate the two frequency tones (K: n = 7; L: n = 8). All data are shown as the mean ± SEM, N.S., no significant difference, *P <0.05, **P <0.01, ***P <0.001, paired Student’s t-test.
All coordinates for viral injection sites are listed as measurements from bregma (in mm). AAF: –2.30 anterior, ±3.80 lateral, –1.0 ventral; striatum: –1.06 anterior, ±2.93 lateral, –2.5 ventral.
Pharmacogenetic Manipulations
To attain pharmacogenetic inhibition, mice expressing hM4Di-mCherry or mCherry (control) were injected intraperitoneally with 2 mg/kg clozapine N-oxide (CNO, HY-17366, MedChemExpress, New Jersey, USA) [diluted with 5% DMSO (D5879, Sigma–Aldrich, Saint Louis, USA) and saline], and the behavioral test was implemented 30 min after CNO injection.
Optical Fiber Implantation
Mice were fixed in a stereotaxic apparatus after being anesthetized with isoflurane (1%–1.5% isoflurane/oxygen). Then, for fiber photometry recording, the optical fibers (ceramic ferrule: diameter 2.50 mm; optical fiber: 200 μm core diameter, 0.37 NA) were implanted 20 μm above the viral injection site in the right AAF, and two cranial screws were fixed to the skull, while the skull surface was milled with a cranial drill for dental cement fixation. The optical fibers were fixed to the skull with dental cement immediately after the virus injection. The animals were allowed 4 weeks of recovery from the surgery and expression of the virus.
Fiber Photometry
The mice were first trained in a conditioned fear experiment and subjected to an electric shock and a pure tone of 12 kHz (75 dB) using the SuperFcs system (XinRuan, Shanghai, China). Then a fiber photometry recording system (Thinkerbiotech, Nanjing, China) was used to record the fluorescence signals of the AAF. Fluorescence emission was recorded and fluorescence signal excitation was induced using a 470-nm laser. The reference channel used 405-nm excitation light. Moreover, a 405-nm laser was used to exclude movement noise and test the data validity of the Ca2+ signal channel.
The mice were placed in a testing chamber and allowed to acclimatize for 5 min after a fiber optic jumper was connected to the ceramic insert on top of the skull. Then the fluorescence signal was recorded during which the mice were exposed to a pure tone (CS+: 12 kHz, 75 dB, 200 s). Then, another pure tone (CS−: 2 kHz, 75 dB, 200 s) was delivered at an interval of ~30 min to record the changes in Ca2+ signals during the process.
The fiber photometry statistics were analyzed using MatLab 2017b (The MathWorks, Inc., Natick, USA). The change in the fluorescence values (△F/F0) was calculated using (F – F0)/F0, in which F refers to the fluorescence value at each time point (−2 s to 10 s relative to the pure tone) and F0 refers to the median of the fluorescence values during the baseline period (−2 s to 0 s relative to the pure tone onset). The ΔF/F0 values are presented as heatmaps and plots with shaded areas that indicated the SEM to visualize the change in fluorescence. To statistically quantify the change in fluorescence values across the sound testing results, the average amplitude of ΔF/F0 was defined as the average fluorescence amplitude change from baseline during the peak period (0–4 s relative to the sound test onset) (Fig. 3).
Immunofluorescence
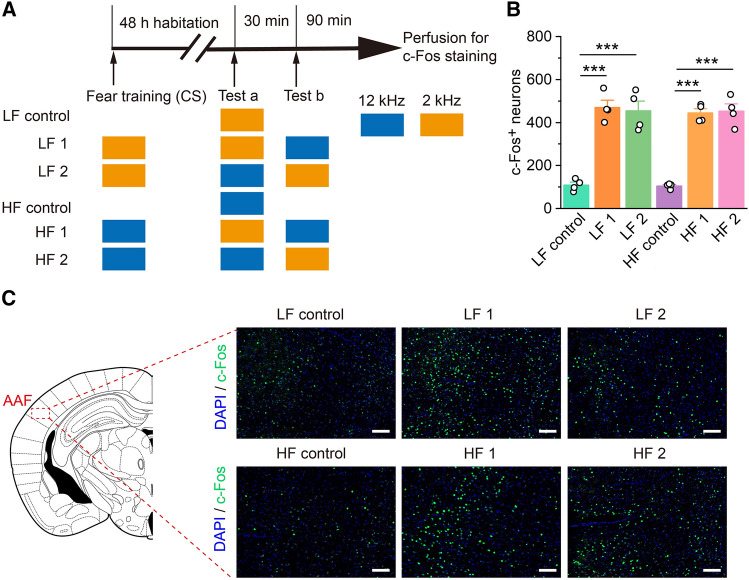
For the assessment of endogenous c-Fos expression induced by auditory frequency discrimination behavior in the AAF, 6 groups of mice received different training and test patterns, and their brains were collected 90 min after testing (Fig. 2A).
Fig. 2.
c-Fos-positive cell numbers are significantly elevated in the AAF after auditory frequency discrimination. A Experimental timeline for c-Fos immunofluorescence staining. LF (low frequency), HF (high frequency). B c-Fos-positive cell numbers in the AAF are significantly higher after frequency discrimination in the sound training groups (n = 4 per group). C Representative immunofluorescence images for c-Fos immunofluorescence staining (scale bars, 100 μm). All data are shown as the mean ± SEM; ***P <0.001, unpaired Student’s t-test.
The immunofluorescence staining protocol was designed as described below. First, the mice were deeply anesthetized with isoflurane and transcardially perfused with phosphate-buffered saline (PBS, 0.01 mol/L, pH 7.4) followed by 4% paraformaldehyde (PFA). The brains were stored in 4% PFA at 4°C for 24 h and then transferred to a 15% sucrose solution in which they were stored at 4°C for 48 h. The brains were then cut into 30 μm frozen sections (CM1900, Leica, Wetzlar, Germany) that were collected in PBS and rinsed three times in PBS for 15 min at room temperature, incubated in PBST (PBS + 0.1% Triton X-100) with 3% normal bovine serum albumin for 1 h, and then incubated with primary antibody for 24 h at 4°C (rabbit anti-c-Fos, 1:500, 226003, Synaptic Systems, Goettingen, Germany). The sections then underwent three washing steps for 10 min each in PBS and were incubated with a secondary antibody for 1 h (goat anti-rabbit conjugated to Alexa Fluor 488, 1:500, Invitrogen, Carlsbad, USA). The sections were washed with PBS (thrice, 10 min) at room temperature, incubated with DAPI (1:2,000, D9542, Sigma–Aldrich, Saint Louis, USA) for 15 min, then subjected to three more washing steps of 10 min each in PBS, followed by mounting and coverslipping on microscope slides. c-Fos expression was verified using a scanning laser microscope (SpinSR, Olympus, Tokyo, Japan). The number of c-Fos-positive neurons was analyzed by ImageJ (1.52a, Bethesda, USA).
Histology
After the behavioral and fiber photometry experiments, brain sections were collected using the methods described above. Sections 30 μm thick were washed with PBS (thrice, 10 min), incubated with DAPI (1:2,000, D9542, Sigma–Aldrich, Saint Louis, USA) for 15 min, and then subjected to an additional 3 wash steps of 10 min each in PBS. Histological verification of virus expression and CTB488 tracing were obtained using a full slide scanning system (VS200, Olympus).
Statistical Analysis
All data are expressed as the mean ± SEM. Statistical significance was determined using the paired Student’s t-test, unpaired Student’s test, or two-way analysis of variance (ANOVA) with repeated measures, followed by Tukey’s post hoc test using SPSS software for Windows (v. 25.0; IBM Corp., Armonk, USA). P <0.05 was considered statistically significant.
Results
Mice Differentiate Between Different Tone Frequencies in the Fear Conditioning Task
First, a frequency discrimination behavioral protocol was modified from the classic fear conditioning paradigm (Fig. 1A). When mice were trained with a 2-kHz pure tone at 75 dB (Fig. 1B, C), they showed much more marked freezing to the 2-kHz pure tone than 12-kHz pure tone (Fig. 1D, E). Similarly, when animals were trained with a 12-kHz pure tone at 75 dB (Fig. 1B, C), they showed much more freezing to the 12-kHz pure tone than the 2-kHz pure tone (Fig. 1F, G). Together, these results indicate that mice successfully established frequency discrimination fear conditioning tasks.
The AAF is Activated During the Discrimination of Different Frequencies
Next, to assess the function of the AAF during different tone frequency discrimination behaviors, immunofluorescence was used to investigate the numbers of c-Fos-positive cells (c-Fos+) in the AAF of the experimental group, which included the 12- and 2-kHz training groups (Fig. 2A). The results showed that the c-Fos+ cell numbers in the AAF increased significantly after the tone test compared with those of the control group (Fig. 2B, C). However, there were no significant differences in c-Fos+ cell numbers in the AAF of the 2-kHz and 12-kHz training groups. Therefore, we used a 12-kHz pure tone to train animals in subsequent experiments.
To further confirm AAF neuronal activity during auditory frequency discrimination, we used a fiber photometer to record the intracellular Ca2+ signal of these neurons in different tone environments [18, 19] (Fig. 3A, B). Ca2+/calmodulin protein kinase IIα (CaMKIIα) is selectively expressed in numerous pyramidal neurons in the cortex and thalamus [20].
We microinjected recombinant adeno-associated virus (rAAV) expressing a Ca2+ indicator (GCaMP6s) or EGFP under the control of the CaMKIIα promoter (rAAV2/9-CaMKIIα-GCaMP6s, rAAV2/9-CaMKIIα-EGFP) into the right AAF and implanted an optical fiber above the injection site (Fig. 3C). Four weeks after virus injection, a photometry recording was made to detect GCaMP6s or EGFP fluorescence changes aligned to frequency discrimination behavior (Fig. 3A). Two different frequency tones (CS+: 12 kHz and CS−: 2 kHz) that evoked frequency discrimination were delivered to the mice. By aligning the fluorescence signal to the onset of the individual tone test, we found that the fluorescence signal began to increase after the tone test onset in the GCaMP6s group (Fig. 3D, E, G, H). The increase in fluorescence signal was reliably accompanied by tone discrimination behavior and lasted for a few seconds. However, we did not detect a significant increase in the fluorescence signal in the EGFP group (Fig. 3D, E, G, H). Statistical analysis revealed significant differences in the mean ΔF/F0 induced by 12-kHz tone between the GCaMP6s and EGFP groups (Fig. 3F), whereas the mean ΔF/F0 induced by 2-kHz tone did not differ significantly (Fig. 3I). Furthermore, the fluorescent signal of GCaMP6s also differed significantly between the 12 kHz and 2 kHz, but not of EGFP (Fig. 3J–M). Mice identified the two different pure tones accurately. Thus, the activity of AAF pyramidal neurons is correlated with auditory frequency discrimination.
Pharmacogenetic Inhibition of the AAF Attenuates Frequency Discrimination
The results of c-Fos staining and fiber photometry showed that AAF pyramidal neurons were activated during auditory frequency discrimination. To further investigate the role of AAF pyramidal neurons in tone processing, a pharmacogenetic approach of designer receptors that are exclusively activated by designer drugs (DREADDs) [21, 22] was applied to evaluate their function. We then microinjected into the AAF recombined AAV, which encoded the inhibitory DREADD receptor hM4Di (rAAV2/8-CaMKIIα-hM4Di-mCherry), while the control group was microinjected bilaterally with rAAV2/8-CaMKIIα-mCherry.
Four weeks later, the frequency discrimination behavioral tests were applied to identify the role of these excitatory neurons (Fig. 4A). In mice expressing the inhibitory hM4Di-mCherry in the AAF pyramidal neurons, CNO injection (2 mg/kg, i.p.) significantly affected the ability of the mice to differentiate between the two frequencies (Fig. 4D, I), while vehicle-injected mice exhibited clear differences in fear behavior associated with auditory frequency discrimination (Fig. 4E, J). Meanwhile, the mice expressing the control mCherry in the pyramidal neurons injected with CNO (2 mg/kg, i.p.) or vehicle were able to differentiate between the two frequencies significantly (Fig. 4F, G, K, L). These results suggest that AAF pyramidal neurons play an important role in modulating auditory frequency discrimination.
The AAF–striatum Projections Regulate Auditory Frequency Discrimination
The projections from the auditory cortex to the striatum play an important role in processing sound identity, animal choice, and expected reward size [13, 16, 17, 23]. We found abundant axon terminals labeled with EGFP in the AAF pyramidal neurons present in the striatum of mice microinjected with rAAV2/8-CaMKIIα-EGFP into the AAF (Fig. 5A). To further determine whether neural projections from the AAF to the striatum are present, the retrograding tracer CTB488 was microinjected into the right striatum. After two weeks, there were many CTB488-labeled neurons in the AAF (Fig. 5B). These results suggested that AAF pyramidal neurons project to the striatum.
We further examined the role of AAF–striatum projections in auditory frequency discrimination by microinjecting a Cre-dependent AAV (rAAV2/9-EF1α-DIO-hM4Di-mCherry) bilaterally into the AAF and a retrograde AAV expressing Cre recombinase (rAAV2/retro-CaMKIIα-Cre) bilaterally into the striatum (Fig. 6B). hM4Di was expressed selectively in AAF pyramidal neurons projecting to the striatum. Behavioral testing was implemented after 4 weeks (Fig. 6A), when hM4Di was expressed (Fig. 6B), to verify the function of these neurons in auditory frequency discrimination. The results demonstrated that pharmacogenetic inhibition of pyramidal AAF–stratum projections significantly attenuated auditory frequency discrimination, as indicated by a significant reduction in the freezing level between the two groups (Fig. 6D–G, I–L). Based on these results, we conclude that AAF pyramidal neurons modulate tone frequency discrimination through a descending pathway mediated by the striatum.
Discussion
The AAF is an important area in the auditory cortex, whereas previous studies almost always focused on the role of A1 in auditory-related behaviors. For example, A1 has been reported to be involved in sound-induced freezing [24] and speech discrimination [25]. However, the role of the AAF in sound discrimination remained unclear. Here, we investigated the role of the AAF and AAF–striatum projections in auditory frequency discrimination by using c-Fos staining, fiber photometry, and pharmacogenetics. Our findings established that the AAF pyramidal neurons and the AAF–striatum projection are involved in the regulation of auditory frequency discrimination behavior.
The discrimination of complex sounds is a fundamental function of the auditory system [7, 26]. Based on previous studies [8, 10, 25, 27–31], we developed a frequency discrimination model in which mice recognized one pure tone frequency by measuring freezing (Fig. 1). In fact, frequency discrimination of fear behavior is not inconsistent with fear generalization, in which fear-generalized mice are unable to discriminate between two stimuli [32]. Notably, c-Fos immunofluorescence staining showed that AAF neuronal activity was associated with auditory frequency discrimination (Fig. 2). Moreover, fiber photometry showed that AAF pyramidal neurons were correlated with auditory frequency discrimination. We found that fluorescent signals began to increase after tone onset (Fig. 3), but they were faint and only lasted for a short time. The reasons for this might be attributable to auditory desensitization due to prolonged sound stimulation [33, 34]. Therefore, we chose a relatively short period (0–6 s after tone onset) for statistical analysis. In addition, pharmacogenetic inhibition of AAF pyramidal neurons significantly impaired frequency discrimination (Fig. 4). These results suggest that AAF pyramidal neurons play a key role in the modulation of frequency discrimination behavior.
The striatum is known to receive projections from the auditory cortex [24]. The projections from A1 to the striatum have been shown to be prominently involved in reward-motivated auditory discrimination tasks [13, 16, 17]. However, whether there are direct AAF–striatum projections and whether these projections regulate auditory frequency discrimination has remained unclear. In the present study, the existence of direct AAF–striatum projections was confirmed by using both anterograde and retrograde tracing methods (Fig. 5). Moreover, in the present study, pharmacogenetic inhibition of striatum-projecting pyramidal neurons in the AAF resulted in significant attenuation of tone frequency discrimination behavior (Fig. 6), indicating that AAF–striatum projections play a critical role in modulating auditory frequency discrimination.
In addition, other types of projections are also present in the corticostriatal pathway. Anatomical and physiological studies have demonstrated that dorsal striatal neurons receive excitatory glutamate inputs from the auditory cortex, but also receive GABAergic projections from the auditory cortex in mice [12, 13]. However, the role of these GABAergic projections in auditory frequency discrimination is also unclear. Therefore, further studies will be required to uncover whether the GABAergic projections from the auditory cortex to the striatum play a critical role in auditory frequency discrimination.
In conclusion, the results of the present study reveal that the activity of AAF pyramidal neurons is associated with auditory frequency discrimination and AAF–striatum projections are identified as corticostriatal neural pathways involved in the process of auditory frequency discrimination. Our study may help to understand the precise neuronal circuits behind discrimination behavior.
Acknowledgements
This work was supported by grants from the National Natural Science Foundation of China (31871075 and 32071015), the Open Project of Chongqing Key Laboratory of Neurobiology (cqsjsw202103 and cqsjsw202101), and the Natural Science Foundation of Chongqing (cstc2020jcyj-msxmX0391).
Conflict of interest
The authors claim that there are no conflicts of interest.
Footnotes
Zhao-Qun Wang and Hui-Zhong Wen contributed equally to this work.
Contributor Information
Guang-Yan Wu, Email: wgy009@163.com.
Ying Xiong, Email: xiongying2001@163.com.
References
- 1.Carrasco A, Kok MA, Lomber SG. Effects of core auditory cortex deactivation on neuronal response to simple and complex acoustic signals in the contralateral anterior auditory field. Cereb Cortex. 2015;25:84–96. doi: 10.1093/cercor/bht205. [DOI] [PubMed] [Google Scholar]
- 2.Bizley JK, Cohen YE. The what, where and how of auditory-object perception. Nat Rev Neurosci. 2013;14:693–707. doi: 10.1038/nrn3565. [DOI] [PMC free article] [PubMed] [Google Scholar]
- 3.Romero S, Hight AE, Clayton KK, Resnik J, Williamson RS, Hancock KE, et al. Cellular and widefield imaging of sound frequency organization in primary and higher order fields of the mouse auditory cortex. Cereb Cortex. 2020;30:1603–1622. doi: 10.1093/cercor/bhz190. [DOI] [PMC free article] [PubMed] [Google Scholar]
- 4.Sołyga M, Barkat TR. Distinct processing of tone offset in two primary auditory cortices. Sci Rep. 2019;9:9581. doi: 10.1038/s41598-019-45952-z. [DOI] [PMC free article] [PubMed] [Google Scholar]
- 5.Kim G, Kandler K. Elimination and strengthening of glycinergic/GABAergic connections during tonotopic map formation. Nat Neurosci. 2003;6:282–290. doi: 10.1038/nn1015. [DOI] [PubMed] [Google Scholar]
- 6.Aizenberg M, Mwilambwe-Tshilobo L, Briguglio JJ, Natan RG, Geffen MN. Bidirectional regulation of innate and learned behaviors that rely on frequency discrimination by cortical inhibitory neurons. PLoS Biol. 2015;13:e1002308. doi: 10.1371/journal.pbio.1002308. [DOI] [PMC free article] [PubMed] [Google Scholar]
- 7.Ceballo S, Piwkowska Z, Bourg J, Daret A, Bathellier B. Targeted cortical manipulation of auditory perception. Neuron. 2019;104:1168–1179.e5. doi: 10.1016/j.neuron.2019.09.043. [DOI] [PMC free article] [PubMed] [Google Scholar]
- 8.Shi Z, Yan S, Ding Y, Zhou C, Qian S, Wang Z, et al. Anterior auditory field is needed for sound categorization in fear conditioning task of adult rat. Front Neurosci. 2019;13:1374. doi: 10.3389/fnins.2019.01374. [DOI] [PMC free article] [PubMed] [Google Scholar]
- 9.Lomber SG, Malhotra S. Double dissociation of ‘what’ and ‘where’ processing in auditory cortex. Nat Neurosci. 2008;11:609–616. doi: 10.1038/nn.2108. [DOI] [PubMed] [Google Scholar]
- 10.Zhang G, Tao C, Zhou C, Yan S, Wang Z, Zhou Y, et al. Excitatory effects of the primary auditory cortex on the sound-evoked responses in the ipsilateral anterior auditory field in rat. Neuroscience. 2017;361:157–166. doi: 10.1016/j.neuroscience.2017.08.019. [DOI] [PubMed] [Google Scholar]
- 11.Cox J, Witten IB. Striatal circuits for reward learning and decision-making. Nat Rev Neurosci. 2019;20:482–494. doi: 10.1038/s41583-019-0189-2. [DOI] [PMC free article] [PubMed] [Google Scholar]
- 12.Ponvert ND, Jaramillo S. Auditory thalamostriatal and corticostriatal pathways convey complementary information about sound features. J Neurosci. 2019;39:271–280. doi: 10.1523/JNEUROSCI.1188-18.2018. [DOI] [PMC free article] [PubMed] [Google Scholar]
- 13.Guo L, Weems JT, Walker WI, Levichev A, Jaramillo S. Choice-selective neurons in the auditory cortex and in its striatal target encode reward expectation. J Neurosci. 2019;39:3687–3697. doi: 10.1523/JNEUROSCI.2585-18.2019. [DOI] [PMC free article] [PubMed] [Google Scholar]
- 14.Guo L, Walker WI, Ponvert ND, Penix PL, Jaramillo S. Stable representation of sounds in the posterior striatum during flexible auditory decisions. Nat Commun. 2018;9:1534. doi: 10.1038/s41467-018-03994-3. [DOI] [PMC free article] [PubMed] [Google Scholar]
- 15.Nakata S, Takemoto M, Song WJ. Differential cortical and subcortical projection targets of subfields in the core region of mouse auditory cortex. Hear Res. 2020;386:107876. doi: 10.1016/j.heares.2019.107876. [DOI] [PubMed] [Google Scholar]
- 16.Xiong Q, Znamenskiy P, Zador AM. Selective corticostriatal plasticity during acquisition of an auditory discrimination task. Nature. 2015;521:348–351. doi: 10.1038/nature14225. [DOI] [PMC free article] [PubMed] [Google Scholar]
- 17.Znamenskiy P, Zador AM. Corticostriatal neurons in auditory cortex drive decisions during auditory discrimination. Nature. 2013;497:482–485. doi: 10.1038/nature12077. [DOI] [PMC free article] [PubMed] [Google Scholar]
- 18.Martianova E, Aronson S, Proulx CD. Multi-fiber photometry to record neural activity in freely-moving animals. J Vis Exp 2019: e60278. [DOI] [PubMed]
- 19.Miyamoto D, Murayama M. The fiber-optic imaging and manipulation of neural activity during animal behavior. Neurosci Res. 2016;103:1–9. doi: 10.1016/j.neures.2015.09.004. [DOI] [PubMed] [Google Scholar]
- 20.Liu XB, Jones EG. Localization of alpha type II calcium calmodulin-dependent protein kinase at glutamatergic but not gamma-aminobutyric acid (GABAergic) synapses in thalamus and cerebral cortex. Proc Natl Acad Sci U S A. 1996;93:7332–7336. doi: 10.1073/pnas.93.14.7332. [DOI] [PMC free article] [PubMed] [Google Scholar]
- 21.Roth BL. DREADDs for neuroscientists. Neuron. 2016;89:683–694. doi: 10.1016/j.neuron.2016.01.040. [DOI] [PMC free article] [PubMed] [Google Scholar]
- 22.Smith KS, Bucci DJ, Luikart BW, Mahler SV. DREADDS: Use and application in behavioral neuroscience. Behav Neurosci. 2016;130:137–155. doi: 10.1037/bne0000135. [DOI] [PMC free article] [PubMed] [Google Scholar]
- 23.Deutch AY. Extending corticostriatal systems. JAMA. Psychiatry. 2016;73:871–872. doi: 10.1001/jamapsychiatry.2016.0242. [DOI] [PubMed] [Google Scholar]
- 24.Li Z, Wei JX, Zhang GW, Huang JJ, Zingg B, Wang X, et al. Corticostriatal control of defense behavior in mice induced by auditory looming cues. Nat Commun. 2021;12:1040. doi: 10.1038/s41467-021-21248-7. [DOI] [PMC free article] [PubMed] [Google Scholar]
- 25.O’Sullivan C, Weible AP, Wehr M. Disruption of early or late epochs of auditory cortical activity impairs speech discrimination in mice. Front Neurosci. 2020;13:1394. doi: 10.3389/fnins.2019.01394. [DOI] [PMC free article] [PubMed] [Google Scholar]
- 26.Allen KM, Salles A, Park S, Elhilali M, Moss CF. Effect of background clutter on neural discrimination in the bat auditory midbrain. J Neurophysiol. 2021;126:1772–1782. doi: 10.1152/jn.00109.2021. [DOI] [PMC free article] [PubMed] [Google Scholar]
- 27.Tao C, Zhang G, Zhou C, Wang L, Yan S, Tao HW, et al. Diversity in excitation-inhibition mismatch underlies local functional heterogeneity in the rat auditory cortex. Cell Rep. 2017;19:521–531. doi: 10.1016/j.celrep.2017.03.061. [DOI] [PMC free article] [PubMed] [Google Scholar]
- 28.Kurt S, Ehret G. Auditory discrimination learning and knowledge transfer in mice depends on task difficulty. Proc Natl Acad Sci U S A. 2010;107:8481–8485. doi: 10.1073/pnas.0912357107. [DOI] [PMC free article] [PubMed] [Google Scholar]
- 29.Wang WJ, Wu XH, Li L. The dual-pathway model of auditory signal processing. Neurosci Bull. 2008;24:173–182. doi: 10.1007/s12264-008-1226-8. [DOI] [PMC free article] [PubMed] [Google Scholar]
- 30.He Q, Wang J, Hu H. Illuminating the activated brain: Emerging activity-dependent tools to capture and control functional neural circuits. Neurosci Bull. 2019;35:369–377. doi: 10.1007/s12264-018-0291-x. [DOI] [PMC free article] [PubMed] [Google Scholar]
- 31.O’Sullivan C, Weible AP, Wehr M. Auditory cortex contributes to discrimination of pure tones. eNeuro 2019, 6: ENEURO.0340-19.2019. [DOI] [PMC free article] [PubMed]
- 32.Asim M, Hao B, Yang YH, Fan BF, Xue L, Shi YW, et al. Ketamine alleviates fear generalization through GluN2B-BDNF signaling in mice. Neurosci Bull. 2020;36:153–164. doi: 10.1007/s12264-019-00422-4. [DOI] [PMC free article] [PubMed] [Google Scholar]
- 33.Sanjuán Juaristi J, Sanjuán Martínez-Conde M. Auditory fatigue. Acta Otorrinolaringol Esp. 2015;66:36–42. doi: 10.1016/j.otorri.2014.05.004. [DOI] [PubMed] [Google Scholar]
- 34.Russell IJ, Kössl M. Sensory transduction and frequency selectivity in the basal turn of the Guinea-pig cochlea. Philos Trans R Soc Lond B Biol Sci. 1992;336:317–324. doi: 10.1098/rstb.1992.0064. [DOI] [PubMed] [Google Scholar]


