

Abstract
Background:
The public health problem of undernutrition is common in Ethiopia, particularly among children aged 6–59 months. However, determinants of undernutrition among children in this age group are not well investigated particularly within the context of COVID-19 pandemic. This study was, therefore, designed to assess the magnitude and determinants of undernutrition among children aged 6–59 months at Tirunesh Beijing general hospital, Ethiopia.
Methods and materials:
An institutional-based cross-sectional study was conducted involving 283 children aged 6–59 months in March 2022. The data were collected using structured questionnaire and anthropometric measurements. Undernutrition was defined as a Z-score value of weight for height (WFH), height-for-age (HFA), and weight-for-age (WFA) <2SD as calculated by the world health organization plus software. A multivariable logistic regression model was used to identify the independent factors associated with undernutrition. p-values less than 0.05 were considered statistically significant.
Results:
The response rate in this study was 97.9%. The overall magnitude of undernutrition was 34.3%, of which 21.2%, 12.7%, and 9.5% were stunted, underweight, and wasted, respectively. Occupation of mothers [AOR = 13.64, 95% CI (4.21–14.77)], amount of meal [AOR = 14.68, 95% CI (4.09–52.81)], feeding by caregivers [AOR = 8.96, 95% CI (2.81–18.60)], and breastfeeding [AOR = 0.06, 95% CI (0.02–0.22)] were significant predictors of undernutrition.
Conclusions:
The prevalence of undernutrition among children under the age of five remains high. Therefore, promoting breastfeeding and motivating children to feed adequate amount of meal are recommended. Besides, counseling and/or guiding caregivers on how to feed children shall be suggested. The findings could help inform the design and prioritization of effective intervention strategies at early life stage.
Keywords: Undernutrition, stunting, wasting, underweight, under-five children, Ethiopia
Introduction
Undernutrition is defined as the lack of essential nutrients to meet an individual’s needs to maintain good health. 1 It is among the leading public health problems, primarily affecting children aged 6–59 months.2,3 According to the World Health Organization (WHO) report, there were millions of undernourished children in this age group including 47 million wasted, 14.3 million severely wasted, and 144 million stunted in 2020. 1 As a consequence, undernutrition is responsible for more than one-third of all deaths in children under the age of five worldwide, 4 which is nearly equivalent to 400,000 childhood mortality every year. 5
Mainly owing to socioeconomic status, undernutrition is prevalent in developing countries including Asia and Sub-Saharan Africa. 6 Infant and under-five deaths are on a rising trend, particularly in Sub-Saharan Africa, where under-five mortality is 15 times higher than that in developed nations. 7 Before the onset of COVID-19 pandemic, an estimated 47 million children younger than 5 years, most living in sub-Saharan Africa and south Asia, were moderately or severely wasted.8,9 Indeed, the status of nutrition in Sub-Saharan Africa seemed to have improved slowly and unevenly across different countries. 10 For instance, Niger (40%) and Burundi (58%) had the highest percentages of underweight and stunting, respectively, while Swaziland (7%) and Gabon (21%) showed the lowest rates of underweight and stunting, respectively. 11 However, the magnitude of undernutrition remains a huge public health concern particularly among children under-5 years of age in developing countries due to COVID-19 pandemic. 12
Nowadays, the COVID-19 pandemic is affecting the socioeconomic status of people which could further exacerbate undernutrition and food insecurity issues in different developing countries.13,14 A study conducted in low-and middle-income countries reported that the prevalence of moderate or severe wasting would increase by 14.3% among under-five children due to the socioeconomic effects of COVID-19. 15 One in 10 deaths among under-five children in low and middle income countries is attributable to severe wasting because wasted children are at increased risk of mortality from infectious diseases. 16 According to the Lancet projection, for instance, the number of wasted under-five children in Bangladesh increased from 1.7 million in 2019 to 1.9 million in 2020 17 and the magnitude of undernutrition increased by 51.7% during the COVID-19 lockdown periods. This is linked with the economic impact of social distancing, full or partial lockdowns, and quarantining. 18
Various findings have identified socioeconomic factors, feeding practices, and maternal and child health conditions as common risk factors for undernutrition.19–21 In addition, malnutrition involves a wide range of factors, such as personal and environmental hygiene, infection disease, household’s financial condition, income, residence, occupation, education, maternal age, and family size. 22 For instance, in Bangladesh during the COVID-19 pandemic, there was a decline in household food security and dietary diversity. 23
Undernutrition places a heavy burden on the Ethiopian economy while also affecting societal health. 24 Approximately half of the Ethiopian children had been suffering from severe undernutrition. 25 As per the 2016 Ethiopia Demographic and Health Survey (EDHS), 38% of Ethiopian children under the age of five were stunted, 10% were wasted, and 24% were underweight. 26 It is of high concern as malnutrition could pose numerous short and long-term consequences27–29 including physical and psychological disorders, mortality, morbidity, and economic loss due to treatment cost and reduced productivity. 30 Indeed, the magnitude of undernutrition in Ethiopia varies from place to place. For instance, in West Arsi zone (Oromia), stunting, underweight, and wasting were found to be 44.1%, 39.6%, and 12.5%, respectively. 31 Similarly, in the capital city (Addis Ababa), the burden of undernutrition was reported to be 31%, where stunting and underweight were significant public health problems among children aged 6–59 months. 19
However, there is no evidence about the determinants of undernutrition among children aged 6–59 months during the period of COVID-19 pandemic. Therefore, this study seeks to identify the determinants of undernutrition among children aged 6–59 months in the Ethiopian capital city, Addis Ababa. The findings from this study could help provide insights into possible intervention approaches.
Methods and materials
Study area, design, and period
An institutional-based cross-sectional study was conducted to identify the magnitude and determinants of undernutrition among children aged 6–59 months who visited Tirunesh Beijing general hospital between the 1st and the 20th of March 2022. Tirunesh Beijing hospital is one of public hospitals located in Addis Ababa, Ethiopia. The hospital was established in February, 2019. It has more than 536 health professionals and 239 supportive staff. The hospital provides variety of services including maternal and child health, inpatient and outpatient surgical and medical services. According to the hospital records, over 18,000 under-five children visit the hospital every year.
Study participants
The study participants were sampled from all children aged 6–59 months and their mothers/fathers/caregivers who visited Tirunesh Beijing general hospital for different health care services during the study period. Children aged 6–59 months who had severe illness, such as physical deformities and chronic illnesses (TB, HIV, renal disease, and cardiac diseases), were excluded from the study.
Sample size determination
The sample size was calculated by using a single population proportion formula. The assumptions of 95% confidence level (Zα/2 = 1.96), proportion (p) of undernutrition among children aged 6–59 months (21.8%), which was taken from a study conducted in Jimma, 32 and margin of error (d = 5.0%) were considered. By adding a 10% non-response rate, the final sample size becomes 289.
Sampling technique
According to the data obtained from Tirunesh Beijing hospital, annually, 18,124 children under-5 years of age visit the hospital for different health services. On average, 50 under-five children are being treated from different wards per day. The determined sample size was proportionally allocated per wards (immunization, inpatients, and other outpatient pediatrics departments) (Figure 1). Then, simple random sampling technique was used to select participants.
Figure 1.
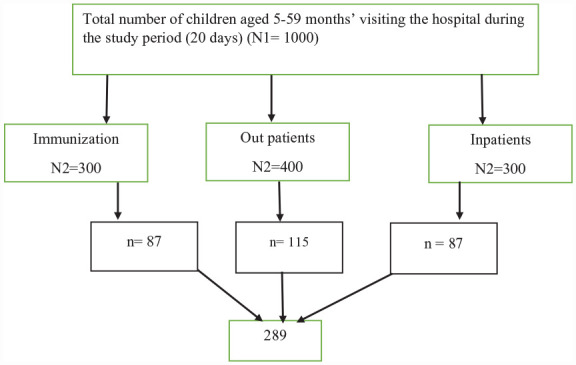
Sampling procedure to assess undernutrition status among children 6–59 months, Ethiopia, 2022. Hint: N1 and N2 = number of children aged 5–59 months visiting the hospital and different wards, respectively, for 20 days, n = sample size.
Data collection and quality control
The data were collected using pre-tested structured questionnaire. The questionnaire was prepared in English, translated to the local language (Amharic) and then translated back to English to ensure consistency. Face to face interview and anthropometric measurements were used. The children’s dietary status was assessed using a method adapted from food and agriculture organization. 33 The length of children between the ages of 6 and 24 months old who couldn’t even stand upright was measured using a horizontal wooden length board in recumbent position and read to the nearest 0.1 cm, whereas the height of children over 2 years old who could stand upright was measured using a stadiometer scale without shoes. The child’s weight was calculated to the nearest 0.1 kg using a beam balance. Weight was taken while wearing only light clothing and no shoes. Before weighing each child, the instrument was calibrated. The weighing scale’s accuracy was checked daily against a standard weight. Normal thumb pressure was applied to both feet for 3 s to check for edema. When the thumb was lifted, the data collectors checked if a shallow print remained on both feet. Individual anthropometric measurements were calculated using standardized WHO Anthro software version 3.2.2. The data were collected by three trained clinical nurses and supervised by one senior public health officer. All the required data were collected for 20 consecutive days.
Study variables
The outcome variable in this study was undernutrition and the independent variables were socio-demographic characteristics, feeding practice of children, family health service of children, and hygiene and environmental factors.
Operational definitions
Undernutrition
Children who had at least one or more Anthroplus software measurements with z-scores of less than 2 standard deviations (SDs) of weight for height (WFH), height-for-age (HFA), and weight-for-age (WFA). 34
Stunting
Children with HFA z-scores of less than 2 standard deviations (SDs) as measured by the Anthroplus software. 34
Wasting
Children with z-scores for WFH of less than 2 standard deviations (SDs) as measured by the Anthroplus software. 34
Underweight
Children with Anthroplus software measurement z-scores of less than 2 standard deviations (SDs) for WFA. 34
Low dietary diversity
When consuming no more than three of the seven types of food. 35
Minimum dietary diversity
When at least four out of seven types of food are consumed. 35
Standardized latrine
Latrine had adequate ceilings and walls, and were graded as good. 36
Unstandardized latrine
Latrines without covers or walls and being used by household though they were graded as bad latrines. 36
Data processing and analysis
The collected data were checked, coded, and entered into Epi data 3.1 and analyzed using SPSS version 26. Data cleaning and assumption checking were performed prior to the analysis. Descriptive statistical analysis was conducted to describe the characteristics of the study participants. Individual anthropometric measurements were entered into WHO Anthro Plus to calculate the Z-value (HFA, WFH, and WFA). Logistic regression model was fitted to identify the association between the independent variables and the outcome variable. Both bivariable and multivariable logistic regression analyses were computed with their 95% confidence interval. From the bivariable analysis, the independent variables that show strong association with the dependent variable at p-value less than 0.25 were included into the multivariable logistic regression model. In the multivariable logistic regression, p-values less than 0.05 were used for statistical significance. Model fitness was checked using Hosmer and Lemeshow test and multicollinearity was tested using collinearity diagnostic statistics (correlation matrix, variance inflation factor, and tolerance test).
Ethical consideration
This study was conducted in accordance with the Declaration of Helsinki. Rift Valley University Ethical review committee provided ethical clearance (192/RVU/2021). Addis Ababa City Public Health Institute as well as Tirunesh Beijing Hospital’s emergence control and management office provided permission letters. The study objectives, benefit, and risks were explained to the participants before data collection, and informed consent was obtained from mothers or caregivers of participating children. The mothers/fathers/caregivers of the children were also informed that the privacy and confidentiality of the information will be protected by instructing data collectors not to record any identifying information found on the card and that the information they give us will not be used for any purpose other than the study. The right to refuse or withdraw was upheld and the information was kept private.
Results
Socio-economic and demographic characteristics of study participants
In this study, a total of 283 study participants have participated giving a response rate of 97.9%. The average age of the children and mothers was 20.78 ± 12.21 months and 27.47 ± 3.75 years, respectively. In terms of educational status, 171 (61.4%) of mothers attended primary and/or secondary school whereas, less than half of the fathers (122, 43.1%) attended higher education. One hundred sixty-two (57.2%) of the respondents had information about child nutrition primarily from mass media (81, 50%) (Table 1).
Table 1.
Socio-economic and demographic characteristics of children/family, Tirunesh Beijing hospital, Addis Ababa, Ethiopia, 2022.
| Variables | Category | Number | Percent (%) |
|---|---|---|---|
| Age of children | 6-11 months | 89 | 31.4 |
| 12-23 months | 97 | 34.3 | |
| Above 23 months | 97 | 34.3 | |
| Sex | Male | 142 | 50.2 |
| Female | 141 | 49.8 | |
| Family size | Below 3 | 167 | 59 |
| 3 and above | 116 | 41 | |
| Education of mother | No formal education | 82 | 29 |
| Primary and/or secondary education | 171 | 61.4 | |
| Certificate and Above | 30 | 10.6 | |
| Education of father | No formal education | 45 | 15.9 |
| Primary and/or secondary | 116 | 41 | |
| Certificate and Above | 122 | 43.1 | |
| Father occupation father | Job seeker | 22 | 7.8 |
| Government | 139 | 49.1 | |
| Private | 122 | 43.1 | |
| Mother occupation | House wife | 150 | 53 |
| Other | 133 | 47 | |
| Marital status | Married | 267 | 94.3 |
| Divorced | 16 | 5.7 | |
| Information | Yes | 162 | 57.2 |
| No | 121 | 42.8 | |
| Source of information | School | 27 | 16.7 |
| Mass media | 81 | 50 | |
| Health care providers | 54 | 33.3 |
Feeding practice and dietary diversity
Nearly two-thirds (63.6%) of the children had a higher dietary diversity score, while more than half (54.4%) of the children aged 6–59 months were not fed with adequate food. Similarly, 157 (55.5%) of the children were currently breast-fed, while 65.4% of the children over the age of 2 years had achieved optimum breastfeeding (Table 2).
Table 2.
Feeding practice of children aged 6–59 months attending health service at Tirunesh Beijing hospital, Addis Ababa, Ethiopia, 2022.
| Variables | Category | Number | Percent (%) |
|---|---|---|---|
| Dietary diversity | Lower | 103 | 36.4 |
| Higher | 180 | 63.6 | |
| Meal amount | Not appropriate | 154 | 54.4 |
| Appropriate | 129 | 45.6 | |
| Complementary feeding | Not appropriate | 190 | 67.1 |
| Appropriate | 93 | 32.9 | |
| Who feeds the child | Mother | 129 | 45.6 |
| Caregiver | 154 | 54.4 | |
| Currently on breast feeding | Yes | 157 | 55.5 |
| No | 126 | 44.5 | |
| Optimum breast feeding | Yes | 51 | 65.4 |
| No | 27 | 34.6 | |
| Meal frequency (per day) | Two or less | 2 | 0.7 |
| Three times | 243 | 85.9 | |
| Four and above | 38 | 13.4 |
Children and family health service-related factors
The current study indicated that about one-fourth (26.5%) of the children were sick at the time of data collection; diarrhea being the most frequently reported disease with 44 (58.7%) mentions. About 175 (61.8%) of the children had received vitamin-A supplementation in the previous 6 months, but the majority were not enrolled in the growth monitoring program (173, 61.3%). Once more, more than half (52.3%) of the children aged 6–59 months were not immunized as per the schedule (Table 3).
Table 3.
Children and family health service among children aged 6–59 months attending at Tirunesh Beijing Hospital, Addis Ababa, Ethiopia, 2022.
| Variables | Category | Frequency | Percent (%) |
|---|---|---|---|
| Sick | Yes | 75 | 26.5 |
| No | 208 | 73.5 | |
| Disease (n = 75) | Diarrhea | 44 | 58.7 |
| Fever | 22 | 29.3 | |
| Cough | 9 | 12 | |
| Family infected by COVID-19 | Yes | 32 | 11.3 |
| No | 251 | 88.7 | |
| Vitamin A | Yes | 175 | 61.8 |
| No | 108 | 38.2 | |
| Growth monitoring | Yes | 110 | 38.9 |
| No | 173 | 61.1 | |
| Immunization | Immunized as per schedule | 135 | 47.7 |
| Not immunized as per schedule | 148 | 52.3 |
Hygiene and environmental factors
Only 150 (53%) children aged 6–59 months washed their hands with soap. A good proportion of the study participants (92.9%) used standardized latrines (Table 4).
Table 4.
Hygiene and environmental factors likely to affect children aged 6–59 months attending health service at Tirunesh Beijing hospital, Addis Ababa, Ethiopia, 2022.
| Variables | Category | Number | Percent (%) |
|---|---|---|---|
| Food prepared at home | Yes | 219 | 77.4 |
| No | 64 | 22.6 | |
| Using soap for hand washing | Yes | 150 | 53 |
| No | 133 | 47 | |
| Type of latrine | Standardized | 263 | 92.9 |
| Unstandardized | 20 | 7.1 |
Magnitude of undernutrition
The overall proportion of undernutrition was 34.3% (95% CI: 29–40), with stunting being 21.2% (95% CI: 16.8–26.4), underweight 12.7% (95% CI: 9.3–17.2), and wasting 9.5% (95% CI: 6.6–13.6).
Factors associated with undernutrition
Occupation of mothers, amount of meal, children feeders, and breast-feeding had statistically significant association with the outcome variable (Table 5). The odds of undernutrition were 13 times higher among children who had non-housewife mothers as compared to those who had housewife mothers [AOR = 13.6, 95% CI (4.2–14.8)]. Children who did not eat enough food for their age were 14 times more likely to become malnourished than others [AOR = 14.68, 95% CI (4.09–52.81)]. Similarly, the odds of undernutrition were almost nine times higher among children who were fed by caregivers or fathers than children who were fed by their mothers [AOR = 8.9, 95% CI (2.8–18.6)]. Once more, children who were being breast-fed or met optimum breast-feeding requirements were less likely to develop undernutrition than those who never breast-fed or stopped breast-feeding early [AOR = 0.06, 95% CI (0.02–0.22)].
Table 5.
Factors associated with undernutrition among children aged 6–59 months attending health services at Tirunesh Beijing Hospital, Addis Ababa, Ethiopia, 2022.
| Variables | Category | Undernutrition | COR at 95% CI | AOR at 95% CI | |
|---|---|---|---|---|---|
| Yes (%) | No (%) | ||||
| Occupation of mothers | Housewife | 75 (56.4) | 58 (43.6) | 1 | 1 |
| Other | 22 (14.7) | 128 (85.3) | 6.53 (3.73–11.43) | 13.64 (4.21–14.77)* | |
| Amount of meal | Appropriate | 17 (13.2) | 112 (86.6) | 1 | 1 |
| Not appropriate | 80 (51.9) | 74 (48.1) | 7.12 (3.91–12.99) | 14.68 (4.09–12.8*) | |
| Who feed | Mother | 12 (9.3) | 117 (90.7) | 1 | 1 |
| Caregiver/father | 85 (55.2) | 69 (44.8) | 12.01 (6.12–23.56) | 8.96 (2.81–18.60)* | |
| Breast feeding | Optimum/current feeding | 28 (17.8) | 129 (82.2) | 0.18 (0.11–0.31) | 0.06 (0.02–0.22)* |
| Ever breast feed/early-stop breast feeding | 69 (54.8) | 57 (45.2) | 1 | 1 | |
p-value <0.005.
Discussion
This study was conducted with the aim of assessing determinants of undernutrition among children aged 6–59 months during the COVID-19 pandemic in Addis Ababa (Ethiopia). In this study, the overall magnitude of undernutrition was found to be 34.3% (95% CI: 29–40), of which 21.2%, 12.7%, and 9.5% were stunted, underweight, and wasted, respectively. According to the WHO category, the magnitude of stunting and underweight were categorized as “medium prevalence” and wasting was categorized as “poor.” Wasting was particularly a critical public health problem according to the WHO’s child growth standards classification cut-off value. 37
Our finding on the magnitude of undernutrition was consistent with the previous studies conducted before the pandemic in Bure (35.5%) 6 and Addis Ababa (31%). 19 On the other hand, this figure was lower than the reports from Bishoftu (46.1%). 38 that were conducted before the pandemic as well. The disparities might be due to the types of interventions, feeding practices (dietary diversity), meal frequency, and differences in socio-economic status.
The present study indicates that the proportion of stunting was 21.2%. This figure was comparable with the study findings in Jimma (21.8%), 32 Sodo Zuria district (24.9%), 39 and global report of 2016 (22.9%). 6 However, our finding was lower than these conducted in Mozambique (44%), 40 Bule Hora district (47.6%), 41 Gondar Town (42.3%), 25 western Uganda (30.5%), 42 and other study conducted in Ethiopia (37%). 43 On the other hand, our finding was slightly greater than the report from Bishoftu (16%), 38 which was conducted before the COVID-19 pandemic. This discrepancy might be associated with sociodemographic variation, access to formal education, awareness creation activities by health care providers, and information accessibility. For instance, in our study, 162 (76.3%) mothers were getting access to information from different source, of which 54 (33.3%) of them get from health care providers and more than 238 (84.1%) mothers have access to formal education and all of them were urban dwellers.
The prevalence of underweight in our study was in agreement with that reported in Addis Ababa (12.3%). 44 Indeed it was slightly lower than the reports in Jimma town pre-school children (36–59 months) (15.2%). 32 Similarly, this figure was lower than the study findings in India (37%), 45 Burundi (40%), 11 and Bishoftu Town (22%). 38 The discrepancy might be due to socio-cultural difference, such as child feeding practice and health care seeking practices. Higher underweight in relatively higher age children could be associated with the fact that children at this age start feeding out of the family pot and enjoy common family food, and hence they are likely to be exposed to inappropriate feeding behaviors. These children also often receive less attention from mothers or caregivers.
In the current study, the magnitude of wasting (9.5%) was consistent with studies conducted in Tanzania (11.5%), 46 Damot, South Ethiopia (9%), 47 Hawassa town (10%), 48 and Shashamane (10%) 31 that were conducted before the COVID-19 pandemic. Nevertheless, it was lower than these reported in India (24.5%) 45 and Kenya (57.1%). 49 The variation might be due to differences in study setting and educational status of the family. For example, our study was conducted in urban area and more than half of the mothers were educated. This probably enabled our study participants to have access for increased dietary diversity, and hence become food secured even during the pandemic period.
Our finding was, however, slightly higher than that found in Gondar town (6.8%) 47 and western Uganda (7.4%) 42 that were conducted before the pandemic. Indeed, considering the WHO’s child growth standards classification, 37 the magnitude of wasting is a huge concern.
Evidences from a previous study indicated the significant direct effect of COVID-19 on children’s undernutrition in developing countries. 50 As our study was conducted during the COVID-19 lockdown period, the nutritional status of the study population was expected to be worse. On top of that, in our study, 32 (11.3%) of children’s family were infected with COVID-19. Despite that, as more than half of the mothers were housewives and educated, they took care of their children, easily understand and apply recommended procedures to feed them. Therefore, exceptionally large figures of stunting and underweight were not recorded in this study.
Mothers’ occupation was also identified as an important determinant factor for undernutrition. The odds of undernutrition were almost 13 times higher among children who had non-housewife mothers than others. This finding was consistent with studies conducted in Ethiopia. 43 The possible justification is that when mothers and fathers stay at home, they could have time to prepare and feed their children with diversified food. On the other hand, non-housewife mothers, particularly those with fewer resources and a history of vulnerability, are more likely food insecure and their children could be affected with undernutrition. 38
Our finding indicated breastfeeding had protective effect on undernutrition. Children who are ever breast feed or early-stop breast feed were more likely to experience undernutrition as compared with currently on breastfeeding or meet optimum breastfeeding. Breastfeeding has an important role in the prevention of different forms of childhood malnutrition problems including stunting, wasting, over- and underweight, and micronutrient deficiencies. Children who could get adequate breastfeeding required for their growth and development will not be exposed for undernutrition and associated childhood morbidity and mortality.
The other statistically significant factor associated with undernutrition was the amount of food. The present study indicated that the odds of undernutrition were 14 times higher among children who did not eat enough food than those who ate enough food. It is widely known that lack of adequate amount of food, economy, and feeding frequency increase the risk of malnutrition.
Moreover, the odds of undernutrition were almost nine times higher among children who were fed by caregivers than children fed by their mothers. The concern is alarming in this study as more than half (54.4%) of the children were fed by caregivers. Most of the time, caregivers might not be aware of the importance of nutrition and its effects on children’s growth. Our finding was consistent with studies conducted in other parts of Ethiopia. 51
Limitations of the study
There might be a potential recall bias on the feeding practices. In addition, as the finding was limited to one local area (Tirunesh Beijing Hospital), the outcome variable is liable to over or under estimation.
Conclusions
In this study, the overall proportion of undernutrition among children aged 6–59 months was 34.3%. Of this, the magnitudes of stunting, underweight, and wasting were 21.2%, 12.7%, and 9.5%, respectively. Occupation of mothers, breastfeeding, feeding by caregivers, and amount of meal were significant factors associated with undernutrition during the COVID-pandemic period. Therefore, in order to reduce the burden of undernutrition, healthcare workers should promote breastfeeding. Counseling and/or guidance on how to feed children should be given for caregivers. It is also suggested to motivate children to feed adequate amount of meal.
Footnotes
The author(s) declared no potential conflicts of interest with respect to the research, authorship, and/or publication of this article.
Funding: The author(s) received no financial support for the research, authorship, and/or publication of this article.
ORCID iD: Sisay Abebe Debela  https://orcid.org/0000-0001-7824-7562
References
- 1.WHO. Malnutrition, www.who.org (Accessed 22 June, 2021).
- 2.Mishra S, Pandey S. Modelling under nutrition among underfive children in uttar pradesh: a multilevel approach. Int J Agric Stat Sci 2018; 14(2): 483–490. [Google Scholar]
- 3.Workie SB, Mekonen T, Fekadu W, et al. Level of undernutrition and its determinants among children aged 12-59 months in Wolaita District, Ethiopia. Pediatric Health Med Ther 2020; 11: 109–117. [DOI] [PMC free article] [PubMed] [Google Scholar]
- 4.Kebede D, Merkeb Y, Worku E, et al. Prevalence of undernutrition and potential risk factors among children under 5 years of age in Amhara Region, Ethiopia: evidence from 2016 Ethiopian Demographic and Health Survey. J Nutr Sci 2021; 10: e22. [DOI] [PMC free article] [PubMed] [Google Scholar]
- 5.WHO. Guideline: Management of severe acute malnutrition in children 6–59 months of age with oedema. World Health Organization, 2020. [Google Scholar]
- 6.Amare D, Negesse A, Tsegaye B, et al. Prevalence of undernutrition and its associated factors among children below five years of age in Bure Town, West Gojjam Zone, Amhara National Regional State, Northwest Ethiopia. Adv Public Health 2016; 2016: 1–8. [Google Scholar]
- 7.Mosimah CI. Impact of the global strategy for infant and young child feeding on nutrition and child survival indicators as illustrated by the world breastfeeding trends initiative tool. 2015. [Google Scholar]
- 8.Omilola B, Sanogo NA. Health, nutrition, and economic development in Africa. Public Health Open J 2020; 5(1): 14–16. [Google Scholar]
- 9.WHO. The UNICEF/WHO/WB Joint Child Malnutrition Estimates (JME) group released new data for 2021, 2021. [Google Scholar]
- 10.Harttgen K, Klasen S, Vollmer S. Economic growth and child undernutrition in sub-Saharan Africa. Popul Dev Rev 2013; 39(3): 397–412. [Google Scholar]
- 11.Ricci C, Asare H, Carboo J, et al. Determinants of undernutrition prevalence in children aged 0–59 months in sub-Saharan Africa between 2000 and 2015. A report from the World Bank database. Public Health Nutr 2019; 22(09): 1597–1605. [DOI] [PMC free article] [PubMed] [Google Scholar]
- 12.Global Report on Food Crises. World Food Programme, Rome, 2022. [Google Scholar]
- 13.Akseer N, Kandru G, Keats EC, et al. COVID-19 pandemic and mitigation strategies: implications for maternal and child health and nutrition. Am J Clin Nutr 2020; 112(2): 251–256. [DOI] [PMC free article] [PubMed] [Google Scholar]
- 14.Osendarp S, Akuoku J, Black R, et al. The potential impacts of the COVID-19 crisis on maternal and child undernutrition in low and middle income countries, 2020. [DOI] [PubMed] [Google Scholar]
- 15.Headey D, Heidkamp R, Osendarp S, et al. Impacts of COVID-19 on childhood malnutrition and nutrition-related mortality. Lancet 2020; 396(10250): 519–521. [DOI] [PMC free article] [PubMed] [Google Scholar]
- 16.Black RE, Victora CG, Walker SP, et al. Maternal and child undernutrition and overweight in low-income and middle-income countries. Lancet 2013; 382(9890): 427–451. [DOI] [PubMed] [Google Scholar]
- 17.UNICEF. An additional 3.9 million children under 5 could suffer from wasting in South Asia this year due to COVID-19 - UNICEF, 2020. [Google Scholar]
- 18.Morales DX, Morales SA, Beltran TF. Food insecurity in households with children amid the COVID-19 pandemic: evidence from the household pulse survey. Soc Curr 2021; 8(4): 314–325. [Google Scholar]
- 19.Degarege D, Degarege A, Animut A. Undernutrition and associated risk factors among school age children in Addis Ababa, Ethiopia. BMC Public Health 2015; 15(1): 375–379. [DOI] [PMC free article] [PubMed] [Google Scholar]
- 20.Wie GT, Tsegaye D. Determinants of acute malnutrition among children aged 6–59 months visiting public health facilities in Gambella town, southwest Ethiopia: unmatched case–control study. Nutr Diet Suppl 2020; 12: 147–156. [Google Scholar]
- 21.Mekonen J, Addisu S, Mekonnen H. Prevalence and associated factors of chronic undernutrition among under five children in Adama town, Central Ethiopia: a cross-sectional study design. BMC Res Notes 2019; 12(1): 532–536. [DOI] [PMC free article] [PubMed] [Google Scholar]
- 22.Hong R, Banta JE, Betancourt JA. Relationship between household wealth inequality and chronic childhood under-nutrition in Bangladesh. Int J Equity Health 2006; 5(1): 15–10. [DOI] [PMC free article] [PubMed] [Google Scholar]
- 23.Kundu S, Banna MHA, Sayeed A, et al. Determinants of household food security and dietary diversity during the COVID-19 pandemic in Bangladesh. Public Health Nutr 2021; 24(5): 1079–1087. [DOI] [PMC free article] [PubMed] [Google Scholar]
- 24.Ayana AB, Hailemariam TW, Melke AS. Determinants of acute malnutrition among children aged 6–59 months in public hospitals, Oromia region, West Ethiopia: a case–control study. BMC Nutr 2015; 1(1): 1–11. [Google Scholar]
- 25.Gelu A, Edris M, Derso T, et al. Undernutrition and associated factors among children aged 6–59 months living in slum areas of Gondar city, northwest Ethiopia: a cross-sectional study. Pediatric Health Med Ther 2018; 9: 81–88. [DOI] [PMC free article] [PubMed] [Google Scholar]
- 26.Muche A, Gezie LD, Baraki AG, et al. Predictors of stunting among children age 6-59 months in Ethiopia using Bayesian multi-level analysis. Sci Rep 2021; 11(1): 3759–3812. [DOI] [PMC free article] [PubMed] [Google Scholar]
- 27.Abera SF, Kantelhardt EJ, Bezabih AM, et al. Nutrition-specific and sensitive drivers of poor child nutrition in Kilte Awlaelo-health and demographic surveillance site, Tigray, northern Ethiopia: implications for public health nutrition in resource-poor settings. Glob Health Action 2019; 12(1): 1556572. [DOI] [PMC free article] [PubMed] [Google Scholar]
- 28.Hickson M, Julian A. Consequences of undernutrition. In: Hickson M, Sara Smith S, Whelan K. (eds) Advanced nutrition and dietetics in nutrition support. Hoboken, NJ: John Wiley & Sons, Ltd, 2018, pp.33–41. [Google Scholar]
- 29.Victora CG, Adair L, Fall C, et al. Maternal and child undernutrition: consequences for adult health and human capital. Lancet 2008; 371(9609): 340–357. [DOI] [PMC free article] [PubMed] [Google Scholar]
- 30.Girma A, Woldie H, Mekonnen FA, et al. Undernutrition and associated factors among urban children aged 24–59 months in northwest Ethiopia: a community based cross sectional study. BMC Pediatr 2019; 19(1): 214–311. [DOI] [PMC free article] [PubMed] [Google Scholar]
- 31.Kassa ZY, Behailu T, Mekonnen A, et al. Malnutrition and associated factors among under five children (6-59 months) at Shashemene Referral Hospital, West Arsi Zone. Oromia, Ethiopia: Current Pediatric Research, 2017. [Google Scholar]
- 32.Melese ST, Bedatu G, Kalkidan H. Prevalence of undernutrition and associated factors among preschool children in Jimma town, South West Ethiopia. Afr J Food Agric Nutr Dev 2020; 20(03): 15954–15977. [Google Scholar]
- 33.Food and Agriculture Organization of the United Nations. Compendium of indicators for nutrition-sensitive agriculture. Food and Agriculture Organization of the United Nations, Rome, 2016. [Google Scholar]
- 34.Beyene S, Willis MS, Mamo M, et al. Nutritional status of children aged 0–60 months in two drought-prone areas of Ethiopia. South Afr J Clin Nutrition 2020; 33(4): 152–157. [Google Scholar]
- 35.Woldegebriel AG, Desta AA, Gebreegziabiher G, et al. Dietary diversity and associated factors among children aged 6-59 months in Ethiopia: analysis of Ethiopian Demographic and Health Survey 2016 (EDHS 2016). Int J Pediatr 2020; 2020: 3040845. [DOI] [PMC free article] [PubMed] [Google Scholar]
- 36.Zeleke DA, Gelaye KA, Mekonnen FA. Community-Led total sanitation and the rate of latrine ownership. BMC Res Notes 2019; 12(1): 14–15. [DOI] [PMC free article] [PubMed] [Google Scholar]
- 37.World Health Organization. WHO child growth standards: length/height-for-age, weight-for-age, weight-for-length, weight-for-height and body mass index-for-age: methods and development 10 May, 2022, 2006. [Google Scholar]
- 38.Abebe H, Melaku A. Prevalence of undernutrition and associated factors among children aged 6- 59 months in Bishoftu Town, Oromia Region, Ethiopia. Food Proc Nutr Sci 2020; 1(1): 8–24. [Google Scholar]
- 39.Dake SK, Solomon FB, Bobe TM, et al. Predictors of stunting among children 6–59 months of age in Sodo Zuria District, South Ethiopia: a community based cross-sectional study. BMC Nutr 2019; 5(1): 23–27. [DOI] [PMC free article] [PubMed] [Google Scholar]
- 40.Rose ES, Blevins M, González-Calvo L, et al. Determinants of undernutrition among children aged 6 to 59 months in rural Zambézia Province, Mozambique: results of two population-based serial cross-sectional surveys. BMC Nutr 2015; 1(1): 1–11. [DOI] [PMC free article] [PubMed] [Google Scholar]
- 41.Asfaw M, Wondaferash M, Taha M, et al. Prevalence of undernutrition and associated factors among children aged between six to fifty nine months in Bule Hora district, South Ethiopia. BMC Public Health 2015; 15(1): 41–49. [DOI] [PMC free article] [PubMed] [Google Scholar]
- 42.Isingoma BE, Mbugua SK, Karuri EG. Nutritional status of children 7-36 months old from millet consuming communities of Masindi District, Western Uganda. BMC Nutr 2019; 5(1): 11–18. [DOI] [PMC free article] [PubMed] [Google Scholar]
- 43.Amaha ND, Woldeamanuel BT. Maternal factors associated with moderate and severe stunting in Ethiopian children: analysis of some environmental factors based on 2016 demographic health survey. Nutr J 2021; 20(1): 18–19. [DOI] [PMC free article] [PubMed] [Google Scholar]
- 44.Teferi H, Teshome T. Magnitude and associated factors of undernutrition among children aged 6-59 months in Ethiopian orphanage centres. Pediatr Health Med Ther 2021; 12: 141–150. [DOI] [PMC free article] [PubMed] [Google Scholar]
- 45.Rehan A, Kishore S, Singh M, et al. Undernutrition and associated common comorbidities among 6 -59 months old children. Indian J Community Health 2020; 32(2): 461–463. [Google Scholar]
- 46.Mrema JD, Elisaria E, Mwanri AW, et al. Prevalence and determinants of undernutrition among 6- to 59-months-old children in lowland and highland areas in Kilosa district, Tanzania: a cross-sectional study. J Nutr Metab 2021; 2021: 6627557. [DOI] [PMC free article] [PubMed] [Google Scholar]
- 47.Abera L, Dejene T, Laelago T. Prevalence of malnutrition and associated factors in children aged 6-59 months among rural dwellers of damot gale district, south Ethiopia: community based cross sectional study. Int J Equity Health 2017; 16(1): 111–118. [DOI] [PMC free article] [PubMed] [Google Scholar]
- 48.Darsene H, Geleto A, Gebeyehu A, et al. Magnitude and predictors of undernutrition among children aged six to fifty nine months in Ethiopia: a cross sectional study. Arch Public Health 2017; 75(1): 29–11. [DOI] [PMC free article] [PubMed] [Google Scholar]
- 49.Mutua N, Onyango D, Wakoli A, et al. Factors associated with increase in undernutrition among children aged 6–59 months in kamoriongo village, nandi county, kenya. Int J Acad Res Reflect 2015; 3(2): 30–56. [Google Scholar]
- 50.Zemrani B, Gehri M, Masserey E, et al. A hidden side of the COVID-19 pandemic in children: the double burden of undernutrition and overnutrition. Int J Equity Health 2021; 20(1): 44–4. [DOI] [PMC free article] [PubMed] [Google Scholar]
- 51.Shaka MF, Woldie YB, Lola HM, et al. Determinants of undernutrition among children under-five years old in southern Ethiopia: does pregnancy intention matter? A community-based unmatched case-control study. BMC Pediatr 2020; 20(1): 1–10. [DOI] [PMC free article] [PubMed] [Google Scholar]