

SUMMARY
While the importance of genome organization for transcriptional regulation of cell-fate decisions and function is clear, the changes in chromatin architecture and how these impact effector and memory CD8+ T cell differentiation remain unknown. Using Hi-C, we studied how genome configuration is integrated with CD8+ T cell differentiation during infection and investigated the role of CTCF, a key chromatin remodeler, in modulating CD8+ T cell fates through CTCF knockdown approaches and perturbation of specific CTCF binding sites. We observed subset-specific changes in chromatin organization and CTCF binding and revealed that weak-affinity CTCF binding promotes terminal differentiation of CD8+ T cells through regulation of transcriptional programs. Further, patients with de novo CTCF mutations had reduced expression of the terminal-effector genes in peripheral blood lymphocytes. Therefore, in addition to establishing genome architecture, CTCF regulates effector CD8+ T cell heterogeneity through altering interactions that regulate the transcription factor landscape and transcriptome.
Keywords: CTCF, CD8+ T cell, genome organization, enhancer, promoter, epigenetics, Hi-C
IN BRIEF
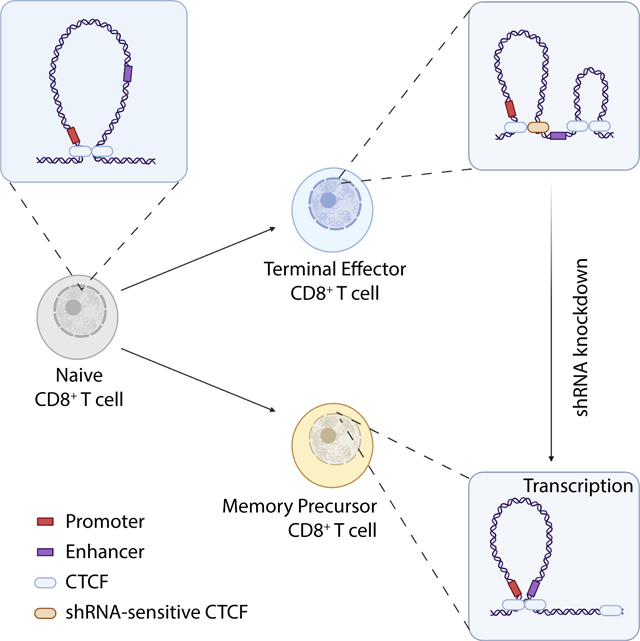
How changes in spatial chromatin organization are integrated into the network of molecular mechanisms mediating CD8+ T cell effector functions and memory formation is not well understood. Quon et al. characterize genome interactions accompanying the CD8+ T cell response to infection and find that the DNA architectural protein, CTCF, regulates the balance of terminally differentiated-effector cells and memory-fated cells.
Graphical Abstract
INTRODUCTION
In response to TCR-mediated recognition of antigens, naive CD8+ T cells rapidly proliferate and acquire cytotoxic and cytokine-producing effector functions to provide protection from infections and tumor growth. While the majority of effector CD8+ T cells become terminally differentiated and die following antigen clearance, a small proportion of pathogen-specific cells persist, giving rise to long-lived memory T cells that respond upon reinfection. Effector and memory T cell populations display a spectrum of functional, proliferative, trafficking, and re-differentiation potentials1,2. Terminally-differentiated effector T cells (TE) express high levels of killer cell lectin-like receptor G1 (KLRG1) and low levels of interleukin-7-receptor-α (CD127), which marks KLRG1lo memory-precursor cells (MP) that give rise to long-lived memory T cell subsets3. Recirculating CD8+ T cell memory subsets include central memory (Tcm), effector memory (Tem), and terminal-effector memory (t-Tem) cells (CD127hiCD62Lhi, CD127hiCD62Ulo, and CD127loCD62Llo, respectively), and show descending potential for proliferation and ascending cytolytic capacity in the case of reinfection4. Further, a non-recirculating tissue-resident memory T cell population is also generated5. In chronic infection and persistent exposure to antigens, such as in tumors, CD8+ T cells display an alternate form of terminal differentiation with blunted effector functions, which can mediate immunopathology and allow persistence of pathogens or malignant cells6. The balance of terminal differentiation, effector function, and retention of the ability to give rise to new effector and memory T cells in subsequent infections is key for determining the functional capacity and persistence of protective immunity14,7–9.
Many studies highlight the role of transcription factor activity and activation of subset-specific enhancers in the regulation of heterogenous differentiation of T cells in both infections and tumors10–12. However, transcription factor activity and gene expression are also regulated through chromatin organization and epigenetic mechanisms13–15. While epigenetic modifications and changes in genome accessibility over the course of in vivo CD8+ T cell differentiation have been described14,16, the role of specific chromatin architecture in CD8+ T cell differentiation in response to infection has not been comprehensively studied.
The genome is partitioned into multiple levels of organizational units. Chromosome territories are separated into active and inactive compartments, with active regions having a permissive transcriptional environment and inactive regions having a repressive transcriptional environment17,18. These compartments contain chromatin organized into topologically associated domains (TADs), which are self-interacting regions insulated by CTCF and cohesin binding17,18. Intra-TAD interactions are composed of smaller DNA loops that can facilitate enhancer-promoter interactions and thus influence gene expression17,18. In vitro activation of human T cells leads to partitioning of TADs into smaller domains and changes in contacts between open chromatin and promoters with only a subset affecting gene expression, while active/inactive compartments remain largely unchanged19.
CTCF, which regulates chromatin architecture, was first identified as an insulator protein that prevents gene expression by blocking enhancer-promoter interactions, and subsequent studies revealed the ability of CTCF to facilitate the formation of TADs and intra-TAD loops20,21. CTCF expression is vital for cell survival, and CTCF-dependent, long-distance chromatin interactions are key for TCR rearrangements, differentiation, and proliferation of thymocytes22–24. Moreover, CTCF interacts with Batf and Ets1 to regulate chromatin organization, which is key for the transcriptional programming of effector CD4+ T cells 25. In T cells, CTCF binding is regulated by IL-2 and α-ketoglutarate signals necessary for the effector T cell phenotype26. Further, CTCF depletion disrupts TAD boundaries, impairing the upregulation of the acute inflammatory response in macrophages27 or CD4+ T cells in vitro28. Recently it was found that CTCF cooperates with the lineage defining factor, TCF1 to regulate T cell development and homeostasis by facilitating chromatin interactions associated with key gene programs29,30. Despite these studies highlighting the cell-state-specific role of CTCF in regulating transcription, its function in genome organization and differentiation in CD8+ T cells responding to infections or tumors has yet to be specifically addressed.
Here, we report genome-wide mapping of chromatin interactions in antigen-specific naive, TE, and MP cells generated in response to an acute bacterial infection. Genome organization and global CTCF binding patterns demonstrated that both were closely linked with the lineage proximity of CD8+ T cell subsets. CTCF knockdown prevented terminal differentiation of CD8+ T cells in both infection and tumor settings. Furthermore, loss of CTCF demonstrated its regulation of transcriptional programs, chromatin accessibility, the transcription factor landscape, and control of CD8+ T cell differentiation.
RESULTS
The response to infection leads to changes in chromatin interactions at sites near subset-specific genes
To capture differences in chromatin interactions as T cells responded to infection, we characterized the 3D genome organization of effector CD8+ T cell subsets. CD45 congenically distinct naive OT-I TCR transgenic CD8+ T cells that recognize a peptide fragment of ovalbumin (OVA257–264) presented by H-2Kb were adoptively transferred into host mice followed by infection with Listeria monocytogenes expressing ovalbumin (Lm-OVA). OT-I CD8+ T cell subsets were sort purified for in situ Hi-C31: naive32 (CD44loCD62Lhi), TE (KLRG1hiCD127lo, day 8), and MP (KLRG1loCD127hi, day 8) (Figure 1A). Hi-C experiments were performed in biological replicates with ~2.3 billion contacts mapped across the 3 cell states (Table S1).
Figure 1. Genome organization changes upon effector cell differentiation and occurs at subset- specific gene loci.

(A) Experimental set-up. CD45 congenically distinct OT-I CD8+ T cells were transferred into hosts followed by infection with Lm-OVA. Naive (CD44loCD62Lhi) OT-I CD8+ splenocytes and day 8 post-infection TE (CD127loKLRG1hi) and MP (CD127hiKLRGfo) cells were sort purified from spleens. Hi-C, ChIP-Seq, and Cut&Run were performed on nuclei (2 biological replicates pooling 3–5 mice). (B) Heatmaps of log10 transformed normalized chromatin interaction scores for chromosome 1. (C) Interaction scores between two samples; Pearson correlation analysis on multiHiCcompare normalized Hi-C samples using HiCExplorer and visualized as a heatmap with rows and columns hierarchically clustered. (D) Multihiccompare quantification of differential chromatin interactions among subsets; P.adj cutoff of 0.05, logfc cutoff of .667, and logcpm cutoff of 1. (E) Interaction score enrichment for TE-specific enhancers and promoters normalized to expected interactions based on distance between regions using HOMER annotateInteractions. (F) GSEA of genes in areas of differential interactions for indicated comparisons. (G-H) Quantification of the overlap between chromosomal coordinates of subset gene signatures and regions with higher interactions in naive compared to TE cells (G) or TE cells compared to MP cells (H). (I) RNA expression of Tbx21 from RNA-Seq data. (J) RNA expression of Prdml or Tcf7 (K) from RNA-Seq data. (L) Heatmaps portraying chromosomal interactions for indicated subsets at indicated loci. Arcs represent enriched interactions in that relevant subset with a p.adj cutoff of 0.05, logfc cutoff of .667, and logcpm cutoff of 1 as measured by multhihiccompare. See also Figure S1.
We found that overall chromatin structure did not have large-scale changes among the different T cell subsets (Figure 1B). However, terminal differentiation involved substantial changes in the interaction landscape at a finer resolution with a gradual loss of correlation in overall interactions (Figure 1C) as well as differential interactions (Figure 1D, Table S2). Similarly, differentiation-induced changes in chromatin compartmentalization revealed a number of regions undergoing compartment switching in the transition from naive T cells to the TE or MP cells, while few changes were detected upon comparison of the two effector populations (Figure S1A). These data suggest that T cell activation and differentiation are linked to stage-specific changes in chromosome organization.
To investigate changes in the interactions between promoters and stage-specific enhancers14, we determined the enrichment of interaction scores for each T cell subset. As expected, TE-unique enhancers and promoters had the highest enrichment of interactions in the terminally-differentiated cells (Figure 1E). However, we also detected enrichment in interactions of elements assigned to the other differentiation stages in TE cells (Figures S1B–E) consistent with the idea that terminal differentiation is associated with gains in chromatin looping33. We next performed gene-set enrichment analysis (GSEA) comparing the expression of genes in regions of subset-specific interactions revealing the link between altered chromatin interactions and gene expression (Figure 1F, Table S3). Genes located in regions with higher chromatin interactions in naive T cells displayed elevated gene expression in the naive population, while genes located in regions with higher interactions in the effector T cell subsets displayed expression enriched in the effector T cell populations. This relationship was also confirmed through the Jaccard similarity index, which quantifies the overlap between differential interactions and the chromosomal locations of genes associated with naive, TE, and MP gene-expression signatures defined previously by RNA-Seq34 (Figures 1G–H). As shown by the higher Jaccard index score, chromosome interactions that were lost upon TE differentiation overlapped the most with genes in the naive T cell gene-expression signature. Related, interactions that were specific to TE cells compared to MP cells overlapped the most with genes that were upregulated in TE cells compared to genes specifically expressed by naive or MP cells (Figure 1H). Thus, changes in chromosomal interactions correlated with the transcriptional programs that distinguished T cell subsets.
For additional insight into the relationship between chromosomal organization and transcriptional programs that direct effector CD8+ T cell differentiation, we examined the Tbx21 and Prdm1 gene loci, encoding transcription factors that drive effector T cell differentiation35. Both factors are upregulated by effector CD8+ T cells, with the greatest induction in TE cells (Figure 1I–J). Inversely, Tcf7, downregulated in TE cells and maintained in a portion of MP cells, encodes for Tcf1 and supports Tcm fate by maintaining high differentiation potential36 (Figure 1K). As reflected by the changes in interaction scores and numbers of uniquely interacting regions (denoted by connecting arcs), effector cell differentiation was accompanied by increased chromatin interactions around Tbx21 and Prdm1, mirroring the pattern of gene expression (Figures 1I–J, 1L). MP cell differentiation was accompanied by MP-specific gains in chromatin interactions at the Tcf7 locus, reflecting the pattern of expression (Figures 1K–L). Altogether, these data provide specific examples of the general observations shown in Figures 1F–H, where effector CD8+ T cell differentiation remodels DNA looping to increase interactions at gene loci that are expressed in effector T cells and diminish interactions at gene loci associated with expression in naive T cells.
Subset-specific CTCF binding correlates with increased interactions
As we observed changes in chromatin interactions that accompanied CD8+ T cell differentiation, we hypothesized that CTCF, a regulator of chromatin looping21, may regulate genome organization associated with subset-specific gene expression. CTCF expression was upregulated with effector T cell differentiation, with greater induction observed in the Klrg1hi population by scRNA-Seq at day 7 (Figure 2A) 37. To compare CTCF binding among CD8+ T cell subsets, we performed CTCF ChIP-Seq and Cut&Run on sort purified naive, TE, and MP OT-I CD8+ T cell populations (Figures 1A, S1F). Similar to the genome organization profiles, CTCF-binding patterns reflected lineage proximity of the subsets, with higher overlap of CTCF peaks for the MP and TE subsets versus naive cells (Figures 2B, S1G–I). Naive T cell-associated CTCF binding was diminished upon effector cell differentiation (Figures 2C, S1H–I).
Figure 2. CTCF binding changes with effector cell differentiation and is linked to changes in chromatin interaction and subset-specific genes.

(A) Ctcf expression from scRNA-Seq data in Klrg1hi (black) and Klrg1lo (gray) cells on indicated days of infection; statistical significance determined using Wilcoxon rank sum test. (B) Quantification of overlap between CTCF binding in different T cell subsets using MSPC-filtered peak sets from ChIP-Seq and Cut&Run against CTCF for the indicated samples. (C) Quantification of differential CTCF peaks (p-value<0.0001; FC>4) between subsets on a logarithmic scale. </P/> (D-F) Heatmaps portraying averaged chromosomal interactions around differential CTCF peaks as measured by HOMER analyzeHiC. Boxplots summarize interaction scores within the interaction patches. (D-E) Statistical significance calculated using the one-sided paired Wilcoxon text. (G) GSEA of genes in areas of differential CTCF peaks for indicated comparisons. (H-I) Quantification of overlap between chromosomal coordinates of the indicated subset gene signatures with CTCF peaks enriched in TE compared to naive cells (H) or TE compared to MP cells (I). (J) Heatmaps portraying chromosomal interactions in naive, MP, and TE cells at indicated loci. Arcs represent enriched interactions in that relevant subset with a p.adj cutoff of 0.05, logfc cutoff of .667, and logcpm cutoff of 1 as measured by multihiccompare. See also Figures S1 and S2.
We characterized the averaged interaction scores +/−250 kb around sites with subset-specific CTCF binding (Figures 2D–F). CTCF binding enriched in TE cells compared to MP or naive cells occurred at locations that had the highest interaction scores in TE cells at and around the CTCF binding sites (Figure 2D). In contrast, as denoted by the decreased interaction scores in the effector subsets, CTCF-binding profiles that were enriched in MP cells compared to TE cells were strongest in the naive and then the MP subsets, suggesting that these sites may be important for the retained ability to further differentiate (Figure 2E). Analysis of CTCF-binding data separated by technique (Cut&Run and ChIP), showed similar trends for most comparisons, however a few differences were observed, reflective of technique- dependent detection of CTCF binding (Figure S1J–O), and the combined analysis more completely reflects the full pattern in CTCF binding. CTCF binding that was lost in TE or MP compared to naive cells occurred on average at TAD borders as denoted by low interaction scores (blue) at the binding site surrounded by high interaction scores (red) (Figure 2F). However, CTCF-binding sites that were shared among all three subsets were also located at TAD borders, consistent with the well-known role of CTCF at TAD boundaries (Figure 2F). Bach2 a key transcription factor important for restraining effector differentiation through transcriptional repression38, regulation of AP-1 factor binding39, and facilitating key chromatin interactions32. Notably, deletion of Bach2 remodeled the chromatin architecture to resemble the genome organization of effector and memory cells, with a distinct overlap with MP-specific chromatin interactions and secondarily memory-specific chromatin interactions (Figure S1P). Further, chromatin regions with altered interactions upon Bach2 deletion contained an upstream enrichment of CTCF binding, suggesting that CTCF may be important for chromatin interactions regulated by other transcription factors (Figure S2A).
We performed GSEA analysis to gain insight into the relationship between changes in CTCF binding and transcriptional programs and found that genes with a nearby gains in CTCF binding often showed accompanying increased expression in the corresponding T cell subset (Figure 2G, Table S3). However, quantification of the physical overlap between sites with altered CTCF binding and genes with changes in expression with differentiation using the Jaccard similarity index showed CTCF binding gained with TE differentiation had the greatest overlap with the naive gene signature (Figure 2H). As the Jaccard index takes into account the actual number of binding sites, this difference suggests multiple binding sites per gene in the naive gene list. Tandem CTCF sites have been characterized as topological insulators40, and in conjunction with Figure 2H, suggests that multiple CTCF binding sites at naive genes may be insulating expression within the TE subset. The opposite trend was observed when focusing on TE-enriched CTCF binding versus MP cells (Figure 2I). These TE-specific CTCF binding events had the greatest overlap with genes upregulated in TE cells, suggesting that more of these CTCF sites may facilitate interactions that accompany increased gene expression (Figure 2I). CTCF and T-bet have been shown to cooperate to regulate Ifng expression by CD4+ Th1 cells28; thus, we examined CTCF and T-bet binding at effector gene loci using previously published T-bet ChIP-Seq in CD8+ effector T cells41 (Figures 2J). The loci encoding the effector-associated KLRG1, the effector molecules Gzma and Gzmk, and IFN-y showed effector-specific interactions around altered T-bet and CTCF binding in effector T cells (Figures 2J). Taken together, these data emphasize the diversity of CTCF function, reveal subset- specific differences in CTCF function, and suggest CTCF cooperation with T-bet and other chromatin remodeling transcription factors. Thus, effector cell differentiation appears to lead to a loss of CTCF binding at TAD borders and a gain in CTCF binding associated with increased intra-TAD interactions that accompany changes in gene expression.
Graded loss of CTCF expression reveals differential impact on CD8+ T cell differentiation
Altering CTCF expression has been used to study the role of genome organization in various settings, however CTCF acts in a dose-dependent manner, and complete ablation of CTCF expression is lethal23,42,43. Further, CTCF can regulate the expression of cell-cycle and cell-death genes, leading to developmental arrest with deletion23,44. We diminished CTCF expression in mature CD8+ T cells by transducing with retrovirus encoding shRNA to knockdown, retaining enough CTCF to permit proliferation and differentiation34. We compared two shRNAs: shCTCF1 yielded approximately 50% mRNA and protein reduction, and shCTCF2 yielded approximately 75% reduction in CTCF mRNA and protein expression compared to shCD19-transduced control cells (shCtrl) (Figures S2B–C). To measure the impact of shRNA knockdown, a 1:1 mixed transfer of OT-I cells transduced with shCtrl or shCTCF1/2 was co-transferred into mice followed by infection with Lm-OVA. On day 5 of infection, neither of the CTCF targeting shRNA constructs affected Annexin V staining (Figure S2D), while only shCTCF2 significantly impaired proliferation as measured by the loss of BrdU+ cells (Figure S2E). Hence, we chose shCTCF1 for subsequent studies of CTCF-mediated regulation of genome organization in CD8+ T cell subset differentiation.
Loss of CTCF impairs terminal differentiation and favors MP, Tem, and Trm cell subsets
To investigate the role of CTCF in regulating the CD8+ T cell response to pathogen infection, we followed the response of shCTCF- or shCtrl-transduced OT-I cells to infection (Figure 3A). At the peak of infection, CTCF knockdown (50%) led to a significant loss of the TE subset of effector T cells, with a small impact on overall accumulation compared to control cells (Figures 3B, 3C). A corresponding gain in frequency of MP cells and CD127+KLRG1+ (DP) CD8+ T cells was observed with CTCF knockdown compared to shCtrl cells (Figures 3B–C). A similar phenotype was observed with a single transfer system (Figure S2G). A greater reduction of CTCF expression (75%), led to further impairment of the TE subset (Figures 3D–E). Notably, after re-stimulation, CTCF-knockdown cells produced more IFNγ and TNFα than control-transduced cells (Figure S2H). At a memory timepoint, CTCF knockdown led to a reduction in the frequency of t-Tem and an increase in frequency of Tem without affecting the overall accumulation of circulating memory cells or Tcm (Figures S3A 3F–I). Thus, at both the effector and memory timepoints, loss of CTCF expression impaired the more terminally-differentiated cell populations (TE and t-Tem), while favoring the differentiation of MP and Tem populations.
Figure 3. CTCF deficiency represses terminal differentiation and promotes the formation of the memory subsets in infection.

(A) Experimental set-up. OT-I CD8+ T cells transduced with shCtrl or shCTCF and were cotransferred into wildtype hosts followed by infection. (B, D, F, H) Frequency of shCtrl- and shCTCF-transduced OT-I splenocytes indicated day of infection for shCTCFI (B, F) or shCTCF2 (D, H). (C) KLRG1 and CD127 expression with quantification (right) of cells in (B), (n=8 from 2 experiments). (E) KLRG1 and CD127 expression from (D) with quantification (right) (n=7 from 2 experiments). (G) CD62L and CD127 expression from (F) with quantification (right) (n=15 from 3 experiments). (I) CD62L and CD127 expression from (H) with quantification (right). (n=6 from 2 experiments) (J) Frequency of transduced P14 cells isolated from spleens and IEL on day 14 of infection with LCMV-Armstrong. (n=15 from 3 experiments) (K) Expression of CD69 and CD103 from J with quantification (right), (n=15 from 3 experiments). (C-K) Bars and error bars represent mean ± SEM. Statistical significance determined by 2-tailed paired Student’s t-test. See also Figures S2 and S3.
In parallel, an unbiased in vivo shRNA screen to identify regulatory transcription factors of memory CD8+ T cell differentiation further confirmed the role of CTCF in CD8+ T cell differentiation (Figures S3B–C, Table S4–5). shRNA constructs targeting CTCF were enriched in the Tem and Tcm populations corresponding to a loss of t-Tem cells (Figures S3B–C), further demonstrating that CTCF was necessary for the more terminally-differentiated CD8+ effector and memory T cell subsets while restraining the more memory-like subsets.
We next measured the impact of CTCF knockdown on secondary responses. OT-I cells transduced with shCtrl or shCTCF were co-transferred to hosts that were then infected with Lm-OVA; at a memory timepoint mice were challenged with recombinant vesicular stomatitis virus expressing ovalbumin (VSV-OVA) 45 (Figure S3D). Prior to reinfection, mice had a similar number of shCtrl- and shCTCF-transduced OT-I cells (Figure S3E). CTCF knockdown led to a defect in accumulation of secondary effector CD8+ T cells, of which there were fewer KLRG1hi cells, while the KLRG1lo cells were unaffected (Figure S3F). Thus, at effector, memory, and recall timepoints, CTCF expression was necessary to develop terminally-differentiated subsets, while the less differentiated subsets were unaffected.
To characterize the role of CTCF expression in the differentiation of tissue-resident memory T cells (Trm), P14 TCR transgenic CD8+ T cells that recognize the LCMV glycoprotein peptide fragment 33–41 presented by H-2Db were monitored. At day 14, loss of CTCF increased the proportion of IEL CD8+ T cells and the expression of the tissue-residency markers CD69 and CD103 in the small intestine in comparison to shCtrl cells, consistent with the observed increase in KLRG1l0 effector T cells in the spleen that preferentially form Trm at the day-7 time point46 (Figures 3J–K). These data show that loss of CTCF expression promotes the formation of resident IEL CD8+ T cells.
CTCF knockdown impairs terminal differentiation and accumulation of CD8+ TIL
To investigate if CTCF depletion similarly impacts differentiation of CD8+ TIL, we co-transferred P14 cells transduced with control or CTCF shRNA (Figure S3G) to BI6-GP33–41 melanoma-bearing mice. Eleven days post transfer, CTCF knockdown preferentially decreased the frequency of TIL and decreased expression of the exhaustion markers PD-1, Tim-3, CD38, CD39, and TOX (Figures S3H–K). These data emphasize the necessity of CTCF expression for terminal differentiation of CD8+ T cells in multiple settings, in conjunction with the infection data,
De novo CTCF mutations reduce expression of the TE gene-expression signature in human PBL
To investigate the impact of impaired CTCF in human peripheral blood lymphocytes (PBL), we analyzed two published RNA-Seq data sets from patients with de novo mutations of CTCF47,48 that either reduce CTCF expression or affect its binding, leading to developmental disorders47,48. Healthy control cells were enriched in the TE and exhausted gene-expression signatures, while cells from patients with CTCF mutations were enriched with Tem and MP gene-expression signatures, mirroring the phenotype observed in our mouse studies (Figures S4A–D). Relative expression of specific transcription factors, cytokines, and chemokines provided a similar pattern to that seen in mice, with the expression of memory-associated molecules enriched in the PBL of patients with CTCF mutations and effector-associated molecules enriched in the PBL of the healthy controls (Figures S4E–J). Although the patients have altered CTCF function in multiple cell types, this finding may result from altered frequencies of terminally-differentiated CD8+ T cell populations or changes in gene expression by CD8+ T cell subsets in PBL. This analysis is consistent with the idea that diminished CTCF expression impairs effector and terminal phenotypes in human lymphocytes as we observed for mouse T cells.
Loss of CTCF perturbs weak binding sites near TE-specific chromatin interactions
To identify which CTCF-binding sites were affected by shRNA knockdown, we performed Cut&Run on the TE subset of OT-I CD8+ T cells transduced with shCtrl or shCTCF (Figure 4A, S1F). CTCF-binding sites sensitive to CTCF knockdown were enriched in lower tag scores (Figure 4B), suggesting that lower occupancy CTCF sites were more affected by shRNA knockdown (Figure 4C). We next calculated the motif scores of each CTCF binding site for TE cells that were transduced with shCtrl (black) or shCTCF (blue); when the subset of binding sites that lost CTCF occupancy upon CTCF knockdown were graphed (red), these sites displayed lower motif scores with more sites with a motif score between 16 and 19 and fewer sites with a motif score above 19 (Figure 4D). The lower motif score corresponds to weaker affinity CTCF binding sites that tend to associate with active histone marks and higher gene expression49.
Figure 4. Loss of CTCF perturbs weak affinity binding sites at areas of TE-specific interactions.

(A) Experimental setup. shCtrl or shCTCF transduced OT-I CD8+ T cells were mixed 1:1, transferred into recipient mice that were then infected with Lm-OVA. On day 8 of infection shCtrl- and shCTCF-transduced TE cells (KLRG1hiCD127lo) were sort purified and used for Cut&Run, RNA-Seq, and ATAC-Seq. (B) Quantification of number of differential CTCF peaks between shCtrl- or shCTCF-transduced TE cells. (C) Scatterplot showing log transformed tags per million of CTCF peaks for Cut&Run. Differential peaks shCtrl (blue)- and shCTCF (black)-enriched peaks. (D) Density plot of CTCF M1 motif scores for shCtrl, shCTCF, and CTCF peaks lost with knockdown. (E) Metascape analysis showing the pathways enriched in the list of genes that showed loss of CTCF binding upon shRNA knockdown. (F) Heatmaps showing average chromosome interactions around CTCF peaks that were lost with knockdown in TE cells. Boxplots summarized interaction scores within the interaction patches. Statistical significance calculated using the one-sided paired Wilcoxon text.
To identify the effect of CTCF knockdown on transcriptional programs, pathway analysis was performed for genes located near CTCF sites that had reduced occupancy upon knockdown (Figure 4E). These nearby genes were important for T cell activation and signaling pathways consistent with the impact of the loss of CTCF expression on CD8+ T cell differentiation. We quantified the average chromatin interactions around sites that lost CTCF binding with knockdown (Figure 4F), which showed increased interaction scores for the TE subsets consistent with knockdown of CTCF expression impacting binding sites with TE-specific interactions (Figure 4F). The analysis of specific CTCF binding sites whose occupancies were impacted by knockdown showed that higher expression of CTCF preferentially allowed for binding at weak CTCF binding sites that were enriched at TE-specific chromatin interactions near genes important for T cell activation and signaling. Thus, the 50% knockdown of CTCF impaired lower affinity CTCF binding at TE-specific chromatin interaction sites directing CD8+ T cell differentiation towards a more memory-like state.
CTCF supports expression of the terminal-effector T cell transcriptional program
To examine how CTCF depletion impacts the effector T cell transcriptional program, we performed RNA-Seq on sorted TE and MP OT-I cells transduced with either control or CTCF shRNA on day 8 of infection with Lm-OVA (Figure 4A, S5A). Diminished CTCF expression by the TE subset resulted in an enrichment of MP-signature genes and loss of the TE gene-expression signature (Figures 5A–B). Although some TE cells still differentiated with CTCF knockdown (i.e. displayed expression of KLRG1 and lost CD127), the transcriptome more closely resembled the MP-associated transcriptional program than TE cells (Figure 5B). No significant enrichment for the naive gene signatures was observed. Further analysis of key transcription showed that CTCF knockdown resulted in upregulation of Tcf7 and Zfp683, encoding transcription factors that promote MP and Trm differentiation, respectively50,51, consistent with the in vivo phenotypes (Figure 5C). Reduction of CTCF in MP cells similarly led to enrichment of memory-associated genes and loss of TE-associated genes (Figures S5B–E).
Figure 5. CTCF knockdown alters the effector and long-term hematopoietic stem cell transcriptional programs.

(A) Quantification of genes differentially expressed between TE cells shCtrl- or shCTCF-transduced cells analyzed with DESeq278 1.5-fold change cutoff, adjusted p-value cutoff of 0.05. (B) GSEA of published gene-expression signatures for shCtrl- or shCTCF-transduced TE cells. (C) Fold-change of RNA expression with CTCF knockdown for key transcription factors, or (D) genes that are upregulated (left) or downregulated (right) in long-term hematopoietic stem cells. Metascape analysis of pathways enriched among genes that decrease (E) or increase (F) in expression with CTCF knockdown. (G) GSEA of genes with nearby CTCF binding sites disrupted by shRNA knockdown in TE cells. (H-J) Quantification of the overlap between CTCF peaks that were lost upon shRNA knockdown and chromosomal coordinates of subset gene signatures (H), active enhancers in naive, TE, or MP cells. (I), and active promoters in naive, TE, or MP cells (J). See also Figures S4 and S5.
A previous study showed that memory T cells were enriched for a transcriptional program of self-renewal52. In agreement with the in vivo phenotype where CTCF depletion repressed terminal differentiation and promoted the differentiation of the more “stem-like” subsets, CTCF knockdown led to altered gene expression in a pattern associated with long-term hematopoietic stem cells and diminished expression of genes downregulated with hematopoietic stem cell differentiation (Figure 5D). Furthermore, diminished CTCF expression led to a loss in expression of cell-cycle genes, consistent with previous studies of CTCF-deficiency23,44 (Figure 5E, S5F). Genes upregulated upon CTCF knockdown were important for immunity (Figure 5F, S5G). Together, these analyses suggest that the role of CTCF in promoting or insulating gene expression influences a range of cell functions. Further, the reduction of CTCF expression shifts the transcriptional program towards the MP phenotype at the expense of the TE phenotype.
As CTCF can regulate gene expression through facilitation of enhancer-promoter interactions, we examined whether binding was perturbed at previously published subset-specific genes, enhancers, or promoters14. CTCF binding in TE cells was disrupted near genes enriched in the effector cell transcriptional program (Figure 5G, Table S3). CTCF-binding sites that were lost with knockdown overlapped the most with genes that were upregulated in the TE cell subset as indicated by a higher Jaccard index score (Figure 5H, Table S3). Furthermore, loss of CTCF binding with knockdown occurred more at subset-specific enhancers than promoters and was enriched for effector-specific enhancers (Figure 5I–J). These data suggest that knockdown of CTCF may regulate gene expression by disrupting CTCF binding at enhancers active in the TE and MP subsets but not the naive subset.
CTCF knockdown reduces chromatin accessibility and alters transcription factor activity
CTCF has been shown to decrease chromatin accessibility in a B cell lymphoblastic leukemia cell line53. To measure the effect of CTCF knockdown on chromatin accessibility in CD8+ T cells, we performed ATAC-Seq on sort purified TE cells transduced with shCtrl or shCTCF shRNA (Figure 4A, S5H). CTCF knockdown led to an overall loss in chromatin accessibility, as shown by the enrichment of ATAC peaks in the control cells (Figures 6A). To link chromatin accessibility with changes in CTCF binding, we measured the ATAC-Seq tag enrichment at sites that lose CTCF binding upon knockdown (Figure 6B). Loss of CTCF binding (blue) reduced chromatin accessibility compared to the control (black) consistent with CTCF binding maintaining chromatin accessibility (Figure 6B).
Figure 6. CTCF knockdown alters the chromatin accessibility landscape.

(A) Quantification of differential ATAC-Seq peaks between TE cells transduced with shCtrl or shCTCF. (B) ATAC-Seq tag enrichment around CTCF peaks lost with knockdown in TE cells. (C-D) Transcription factor motifs enriched in ATAC peaks(C) and CTCF peaks (D) lost with knockdown in TE cells. (E-G) Signal tracks of ATAC-Seq and Cut&Run against CTCF in TE cells transduced with shCtrl or shCTCF. (H-I) Quantification of differentially expressed genes (H) and ATAC-Seq peaks (I) between in vitro cultured CD8+ T cells transduced with shCtrl or shCTCF. (J) Scatterplot showing log2-transformed changes in gene rank scores from Taiji and changes in RNA expression between shCtrl- and shCTCF-transduced cells, log2-fold-change cutoff of 0.4 was used. See also Figure S6.
To identify the impact of decreased chromatin accessibility on transcription factor activity, we performed motif enrichment in the ATAC peaks lost upon knockdown of CTCF (Figure 6C). Conversely, we interrogated motif enrichment in the CTCF peaks that were lost upon knockdown of CTCF to identify potential protein partners that may be impacted by disrupted CTCF binding (Figure 6D). Both analyses identified Hic1, Bach2, and T-bet (Figures 6F–G). Hic1 is a transcriptional repressor that supports T cell accumulation in the IEL and supports Trm residency in the small intestine54,55. Our results suggest loss of CTCF expression may coordinate Hic1 binding, perhaps explaining the increase in Trm formation that we observed (Figures 3J–K). The identification of Bach2, a transcription factor that restrains effector differentiation38,39, suggests a competition between CTCF and Bach2 (Figures 6C–D). T-bet promotes TE differentiation and inhibits Trm differentiation3,56,57. Therefore, the enrichment of the T-bet motifs in lost ATAC-Seq and CTCF peaks may explain why there were fewer terminally-differentiated effector cells and more Trm cells with CTCF knockdown (Figures 6C–D). Less CTCF binding was also accompanied by a loss of chromatin accessibility around transcription factor motifs was observed near genes such as Havcr2, Il7r, and Cell, which are differentially expressed by TE and MP subsets (Figure 6E–G).
To predict transcription factors with CTCF-knockdown-sensitive activity, we performed PageRank analysis14 using in vitro ATAC-Seq and RNA-Seq data that mirrored the changes in expression and accessibility observed for the in vivo samples (Figures 5A, 6A, 6H–I). PageRank integrates RNA-Seq and ATAC-Seq data to construct a genetic network to capture the global impact of transcription factors on the network14. Transcription factors are ranked based on the number and importance of genes that may be regulated, where a PageRank score with a higher number suggests a more important role for impacting gene expression in a network14. PageRank predicted transcription factors, including Blimp1, Eomes, and T-bet, that could mediate the transcriptional program for the control cells, suggesting that CTCF knockdown may disrupt access to binding sites to alter nearby gene expression (Figure 6J). Blimp1, Eomes, and T-bet are known to regulate differentiation of effector and memory T cells in infection and TIL3,46,51,57–59; loss of CTCF expression may prevent Blimp1, Eomes, and T-bet from binding to regulate their target genes, again highlighting a mechanism where CTCF contributes to the regulation of terminal differentiation (Figure 3). PageRank predicted that transcription factors Bach2, Tcf1, and Lef1 as important mediators of the transcription program for cells with CTCF knockdown (Figure 6J) consistent with their important roles in memory-precursor and memory T cell differentiation39,60,61. Loss of CTCF expression may promote their activity to facilitate the enrichment of memory cell differentiation seen in vivo (Figure 3). Altogether these data identify potential partnerships between CTCF and key transcription factors to cooperatively regulate T cell function and differentiation. Notably, it was recently reported that CTCF can collaborate with Tcf1 to regulate chromatin interactions that control gene sets key for T cell development in the thymus and naive homeostasis29,30; we observed that genes near sites co-bound with CTCF and Tcf1 in naive CD8+ T cells did not show significant enrichment in gene signatures regulated by the response to infection (Figures S5I–K).
Previous studies showed that CTCF and T-bet cooperate to promote the expression of IFNγ in CD4+ T cells 28, and our analysis identified T-bet as a potential target of CTCF knockdown (Figures 6C–D, 6J). RNA-Seq showed a trend of lower expression of Tbx21, which encodes for T-bet, in TE cells with CTCF knockdown, and T-bet expression was reduced with CTCF knockdown by day 14 of infection with Lm-OVA (Figures S6A–B). T-bet deficiency results in fewer TE cells3,57, so we explored if elevated T-bet expression could overcome the loss of TE cells from CTCF knockdown. P14 cells were transduced with Ctrl (pMIG-GFP) or an overexpression construct for T-bet (T-bet-GFP) (Figure S6C). We then co-transferred the shCtrl and shCTCF with pMIG-GFP or the shCtrl and shCTCF with T-bet-GFP into recipient mice that were subsequently infected with LCMV Armstrong (Figure SCD). T cells from the spleen were isolated at the peak of infection for phenotyping (Figure S6C). T-bet overexpression rescued the differences in subset frequency between shCtrl and shCTCF in KLRG1hi cells (Figure S6D–E). Considered with the previous finding that T-bet regulates Th1-specific CTCF binding28, overexpression of T-bet may recruit the available CTCF left after knockdown to the more effector-specific CTCF binding sites to drive CD8+ T cell terminal differentiation, and altogether, these analyses suggest that CTCF knockdown may alter the transcription factor landscape to regulate CD8+ T cell differentiation.
Perturbation of specific CTCF binding sites enhances expression of target genes
We next examined the impact of CTCF binding on the expression of specific genes. The ll7r, Bcl6, and Ccl3 loci each have nearby CTCF binding sites that were sensitive to shRNA knockdown (Figure 7A). Analysis of Hi-C interactions for the regions around the gene loci showed noticeable gains in DNA interactions upon effector differentiation at the ll7r and Ccl3 loci but not the Bcl6 locus, as indicated by the increased interaction scores and number of arcs for the TE and MP tracks (Figure 7A). Characterization of histone marks from previous studies14 showed that the knockdown-sensitive CTCF site near ll7r was at an active enhancer in MP cells, as indicated by the H3K4me1 and H3K27ac peaks present in the MP subset, but not in the TE subset (Figure S6F). The knockdown-sensitive CTCF site near Ccl3, however, was at an enhancer that was active in effector cells, as indicated by the H3K4me1 and H3K27ac marks present in the effector subsets (Figure S6G). In contrast, the Bcl6 locus did not have any clear changes in chromatin interactions, and the knockdown-sensitive CTCF site near Bcl6 did not overlap with any promoters or enhancers (Figures 7A, S6H). Expression of Il7r and Bcl6 is important for the formation of memory CD8+ T cells 7, and both display higher expression in the MP subset, whereas Ccl3 is expressed by effector cells and has been shown to be important for effector function of memory T cells62 (Figures S7A, S7B, S7C). mRNA expression of all three of these genes, however, increased upon CTCF knockdown (Figures S7D, S7E, S7F), suggesting that CTCF binding actually acts to restrain their expression.
Figure 7. Specific perturbation of CTCF binding sites promotes gene expression.

(A) Heatmaps showing chromosomal interactions in naive, MP, and TE cells around indicated loci. Arcs represent differential interactions in that relevant subset with a p.adj cutoff of 0.05, logfc cutoff of .667, and logcpm cutoff of 1. Tracks show CTCF-binding signal from Cut&Run samples for TE cells transduced with shCtrl or shCTCF. (B) Experimental setup. (C, E, G) Genome browser tracks showing signal tracks for CTCF binding in TE cells transduced with shCtrl or shCTCF and the targeted CTCF binding site that is lost with knockdown is highlighted in red. (D) Expression of CD127 by electroporated cells (right) (n=4 representative of 2 experiments). (F) Expression of Bcl6 by electroporated cells (right) (n=3 representative of 2 experiments). (H) Expression of Ccl3 after restimulation with GP33–41 peptide by electroporated cells with MFI (right) (n=4 representative of 2 experiments). (D, F, and H) Bars and error bars represent mean ± SEM. Statistical significance was calculated using the 2-tailed paired Student’s t-test; representative of 3 independent experiments. See also Figures S6 and S7.
To directly link the change in CTCF binding with regulation of gene expression, we used CRISPR/Cas9 to target insertions/deletions at CTCF binding sites through mutagenic nonhomologous end joining63 (Figure 7B). The targeting of the CTCF binding motif largely resulted in single nucleotide deletions or additions as determined by DNA sequencing of targeted cells (Figure S7G–I). Perturbation of CTCF binding at the MP-specific enhancer upstream of Il7r increased CD127 protein expression by P14 T cells isolated from the spleen at both effector and memory time points (Figure 7C–D, S7J). Disruption of CTCF binding near the Bcl6 locus did not show differential expression as expression is so low in effector cells of Bcl6 expression, but showed increased Bcl6 expression at the memory time point (Figure 7E–F, S7K). Ccl3 protein expression was measured after splenocytes isolated at an effector time point were re-stimulated, and disruption of CTCF binding at the enhancer active in effector cells increased Ccl3 production by approximately three-fold (Figure 7G–H). Together, these data show that these specific CTCF binding sites are important for restraining the expression of their neighboring genes whose functions are key for memory T cell differentiation or function, while also highlighting the variety of different mechanistic roles behind CTCF function.
DISCUSSION
Immune cell function and differentiation are regulated through transcriptional changes that are controlled at multiple levels, including transcription factor binding and epigenetic modifications10,14. While chromatin architecture changes during T cell activation in vitro19, the genome architecture for T cells in vivo has not been comprehensively characterized. Here, we profiled the 3D genome organization of CD8+ T cell subsets responding in vivo to acute infection and found that effector CD8+ T cell differentiation was accompanied by changes in chromatin interactions with magnitudes proportional to the lineage proximity of the subsets. We found that these altered chromatin interactions occurred around genes expressed in a subset-specific manner, and that enhancer-promoter interactions were specifically enriched in TE cells compared to other T cell subsets. Further, subset-specific chromatin remodeling correlated with transcriptional rewiring, highlighting that alterations in chromatin looping contribute to the regulation of CD8+ T cell fates generated in response to infection. Optimal CD8+ T cell differentiation was dependent on CTCF remodeling of chromatin structures that simultaneously served to augment effector or limit memory transcriptional programs. Hence, CTCF-dependent chromatin reorganization upon T cell activation is a critical step in determining CD8+ T cell fate decisions.
Consistent with the established role for CTCF in regulating chromatin interactions64 and our characterization of genome organization in CD8+ T cells, the pattern of CTCF binding reflected the lineage proximity of the subsets. CTCF binding in TE cells was particularly enriched in intra-TAD chromatin interactions. Changes in CTCF expression impacted the differentiation of effector CD8+ T cells, with diminished CTCF leading to loss of binding at low affinity CTCF sites and TE-specific enhancers, culminating in impaired numbers of TE, t-Tem, and terminally-exhausted cells from tumors, but unaffected memory T cell differentiation. Thus, CTCF was key for promoting terminal differentiation in both infection and tumor contexts by preventing the expression of genes important for memory T cell differentiation. Coupled with our observation that TE cells have enrichment of enhancer-promoter interactions, we hypothesized that terminal differentiation of CD8+ T cells involves the establishment of CTCF-mediated intra-TAD chromatin interactions, with weaker affinity CTCF binding insulating the memory program. This hypothesis is partially supported by a recent study that reported CTCF sites form insulating neighborhoods around MP genes65 and by our data where CTCF knockdown and mutation of specific CTCF binding sites promote expression of memory-associated genes.
A key feature of memory cells is their ability to respond upon antigen re-exposure. The maintenance of the potential for further differentiation is not well understood. However, CTCF impairs expression of genes associated with “sternness” in hematopoietic stem cells and the liver cancer cell line HepG252,66,67. We concordantly observed a loss of terminally-differentiated subsets and a gain in subsets with greater differentiation potential in both infection and tumor settings upon CTCF knockdown. Studies have shown that “sternness” is reinforced through epigenetic modifications and disruptions in regulators lead to the accumulation of more-memory-like cells at the expense of more-effector-like cells68–71. Also, genome organization has been linked to the maintenance of the “sternness” program through changes in the nuclear positioning, chromatin compaction, and enhancer-promoter interactions72.
Transcription factors important for CD8+ T cell differentiation also regulate chromatin interactions. Recent studies in naive and Tcm CD8+ T cells revealed that deletion of Tcf1/Lef1 in naive cells or Tcf1 alone in Tcm cells altered genome organization, reducing expression of T cell lineage-enriched genes and preventing expression of genes associated with glycolysis60,73. In addition, CTCF and Tcf1 were shown to cooperate in regulating chromatin interactions that impact expression of key gene programs during T cell development and homeostasis29,30. Our previous research showed that depletion of YY1, a chromatin remodeler known to directly interact with CTCF and also facilitate chromatin interactions within CTCF-mediated loops74,75, led to a loss of TE cells14. YY1 depletion and CTCF depletion both led to a loss of TE cells, which further suggests that the formation or reinforcement of genome organization may be key for the terminal-effector phenotype. Thus, numerous transcription factors regulate genome organization important for T cell fate, and linking the roles of these chromatin remodelers may provide further insight into the genome-organization-mediated influence on CD8+ T cell differentiation.
Multiple possible mechanisms underly CTCF regulation of gene expression and may be affected by the number of proximal CTCF sites, the location of the binding site, and the protein partners21,76,77. In our study, motif enrichment and PageRank analyses identified potential CTCF-regulated transcription factors, such as T-bet, Tcf1, and Bach2. T-bet is known to inhibit CD8+ Trm formation and promote terminal-effector differentiation3,57. We identified T-bet as a potential transcription factor with binding and activity regulated by CTCF knockdown, and T-bet overexpression rescued the CTCF knockdown phenotype. Therefore, in conjunction with previous studies in CD4+ T cells, where T-bet collaborates with CTCF to regulate chromatin interactions needed for IFNγ expression28, this suggests that T-bet may be important for chromatin interactions that drive CD8+ T cell terminal differentiation.
Our data has also revealed several instances where CTCF was linked to Bach2: CTCF binding was enriched upstream of Bach2-mediated interactions, Bach2 binding motifs were identified in CTCF sites and accessible chromatin regions lost with CTCF knockdown, and Bach2 was predicted to regulate expression of genes that increased with CTCF knockdown. These observations suggest the potential competition between Bach2 and CTCF in mediating chromatin interactions in CD8+ T cells may regulate memory CD8+ T cell differentiation. The collaboration of CTCF and lineage-determining factors highlights a key role for CTCF in facilitating genome remodeling necessary for transcription-factor mediated regulation of T cell differentiation.
Here, we provided evidence that CD8+ T cell genome organization is linked to the lineage proximity of T cell differentiation and that CTCF insulates the expression of key memory genes that reside in areas of high chromatin interaction; our future studies will aim to further refine the link between genome organization, transcriptional networks, and CD8+ T cell differentiation.
Limitations of the study
A caveat to this study is that it is limited to correlative observations characterizing the role of genome organization in effector CD8+ T cell differentiation. Further studies are needed to study genome organization with CTCF knockdown or disruption of specific chromatin interactions. Also, analysis of data from patients with CTCF mutations from whole PBMC and not sorted T cell populations suggests human relevance, but further study is needed on isolated T cell populations from humans.
STAR Methods
RESOURCE AVAILABILITY
Lead Contact
Further information and requests for resources and reagents should be directed and will be fulfilled by the Lead Contact, Ananda W. Goldrath (agoldrath@ucsd.edu)
Materials Availability
This study did not generate new unique reagents
Data and Code Availability
All Hi-C, bulk RNA-Seq, ATAC-Seq, ChIP-Seq, and Cut&Run datasets are available for download on the GEO data repository and are publicly available as of the date of publication. Accession numbers are listed in the Key Resources Table. This paper analyzes existing, publicly available data. Accession numbers are listed in the key resources table.
This paper does not report original code
Any additional information required to reanalyze the data reported in this paper is available from the lead contact upon request.
KEY RESOURCE TABLE
| REAGENT or RESOURCE | SOURCE | IDENTIFIER |
|---|---|---|
| Antibodies | ||
| Anti-CTCF | Millipore Sigma | Cat#07–729 |
| Goat anti-hamster IgG (H+L) Secondary Antibody | Thermo Fisher Scientific | Cat# 31115 RRID: AB_228247 |
| Cd3e Armenian Hamster anti Mouse (145 2C11) | eBioscience | Cat# 16–0031-82 RRID: AB_468847 |
| Cd28 Golden Syrian Hamster anti Mouse (37.51) | eBioscience | Cat# 16–0281-86 RRID: AB_468921 |
| Biotin anti-B220 (RA3–6B2) | BioLegend | Cat# 103204, RRID:AB_312989 |
| Biotin anti-MHCII (M5/114.15.2) | Thermo Fisher Scientific | Cat# 13–5321-82, RRID:AB_466662 |
| Biotin anti-CD4 (GK1.5) | BioLegend | Cat# 100404, RRID:AB_312689 |
| Biotin anti-CDNK1.1 (PK136) | Thermo Fisher Scientific | Cat#13–5941-85, RRID: AB_466805 |
| Biotin anti-Ter-199 (TER-119) | BioLegend | Cat# 116204, RRID:AB_313705 |
| Biotin anti-GR-1 (RB6–8C5) | BioLegend | Cat# 108404, RRID:AB_313369 |
| APC-eFluor 780 anti-CD45.1 (A20) | Invitrogen | Cat#:47–0453-83 RRID:AB_1582228 |
| Efluor 450 anti-CD45.1 (A20) | Invitrogen | Cat#:48–0453-82 RRID:AB_1272189 |
| FITC anti-CD45.1 (A20) | Invitrogen | Cat#:11–0453-85 RRID: AB_465059 |
| PerCP-Cyanine5.5 anti-CD45.1 (A20) | Invitrogen | Cat#: 45–0453-82 RRID: AB_1107003 |
| APC-Cyanine7 anti-CD45.2 (104) | Biolegend | Cat#109823 RRID:AB_830788 |
| eFluor 450 anti-CD45.2 (104) | Invitrogen | Cat#48–0454-82 RRID:AB_11042125 |
| FITC anti-CD45.2 (104) | Invitrogen | Cat#11–0454-85 RRID: AB_465061 |
| PE-Cyanine7 anti-CD45.2 (104) | Invitrogen | Cat#25–0454-82 RRID: AB_2573350 |
| APC anti-KLRG1 (2F1) | Invitrogen | Cat#17–5893-82 RRID:AB_469469 |
| APC-eFluor780 anti-CD8 (53–6.7) | Invitrogen | Cat#47–0081-82 RRID: AB_1272185 |
| Brilliant Violet 510 anti-CD8a (53–6.7) | BioLegend | Cat#100752 RRID: AB_2563057 |
| Brilliant Violet 711 anti-CD8a (53–6.7) | BioLegend | Cat#100748 RRID: AB_2562100 |
| Pacific Blue anti-CD8a (53–6.7) | BioLegend | Cat#100725 RRID: AB_493425 |
| APC anti-TNF alpha (MP6-XT22) | Invitrogen | Cat#17–7321-82 RRID: AB_469508 |
| APC anti-IFNγ (XMG1.2) | BioLegend | Cat#505810 RRID: AB_315404 |
| PE anti-IFN gamma (XMG1.2) | eBioscience | Cat#12–7311-81 RRID: AB_466193 |
| PE anti-IL2 (JES6–5H4) | eBioscience | Cat#12–7021-82 RRID: AB_466150 |
| PE-Cyanine7 anti-CD127 (A7R34) | Invitrogen | Cat#25–1271-82 RRID: AB_469649 |
| eFluor 450 anti-Ki-67 (SolA15) | Invitrogen | Cat#48–5698-82 RRID:AB_11149124 |
| APC anti-BrdU | BD Pharmingen | Cat#51–23619L RRID:AB_2861367 |
| PE anti-Tbet (4B10) | BioLegend | Cat#644809 RRID: AB_2028583 |
| APC anti-CD62L (MEL-14) | BioLegend | Cat#104412 RRID: AB_313099 |
| Percp-Cyanine5.5 anti-CD69 (H1.2F3) | eBiosience | Cat#45–0691-80 RRID: AB_1210703 |
| PE anti-CD103 (2E7) | Invitrogen | Cat#12–1031-82 RRID: AB_465799 |
| APC anti-CD90.2 (53–2.1) | Invitrogen | Cat#12–0902-82 RRID: AB_465776 |
| Alex Fluor 647 anti-CD90.1 (OX7) | Biolegend | Cat#202508 RRID: AB_492884 |
| PE anti-Ccl3 (MIP-1 alpha) | R&D Systems | Cat#IC450P |
| PE anti-Bcl6 (K112–91) | BD Pharmingen | Cat#561522 RRID:AB_10717126 |
| β-actin | Cell Signaling Technology | Cat# 3700S RRID:AB_2242334 |
| Goat anti-mouse HRP | Santa Cruz Biotechnology | Cat# sc2005 RRID:AB_631736 |
| Goat anti-rabbit HRP | Santa Cruz Biotechnology | Cat# sc2004 RRID:AB_631746 |
| Bacterial and virus strains | ||
| Lymphocytic choriomeningitis virus-Armstrong strain | Milner et al.(34) | N/A |
| Listeria monocytogenes-GP33 | Milner et al.(34) | NA |
| Vesicular stomatitis virus-OVA | Rubinstein et al.(45) | NA |
| Chemicals, peptides, and recombinant proteins | ||
| Collagenase Type I | Worthington Biochemicals | Cat#LS004197 |
| Dithioerythritol | EMD Millipore | Cat#233152 |
| Percoll | Sigma | Cat#P1644 |
| Protein Transport Inhibitor Cocktail | eBioscience | Cat#00–4980-93 |
| H-2Db-restricted peptide GP33–41 | Anaspec | Cat#AS-61296 |
| MACS Streptavidin MicroBeads | Miltenyi Biotec | Cat#130–048-101 |
| DMEM | GIBCO | Cat#11965–092 |
| RPMI 1640 | Corning | Cat310–040-CV |
| 2-Mercaptoethanol | GIBCO | Cat321985–023 |
| HEPES | GIBCO | Cat#15630–080 |
| H-2Kb-restricted OVA257–264 | Invivogen | Cat#vac-sin |
| Hank’s Balanced Salt Solution | Corning | Cat# 20–021-CV |
| Sodium Azide | Sigma | Cat#S8032–100G |
| Opti-MEM | Thermo Fisher Scientific | Cat# 31985070 |
| Polybrene | Thermo Fisher Scientific | Cat#TR1003G |
| Trizol | Ambion | Cat15596026 |
| Isopropanol | Acros Organics | Cat#327270010 |
| Chloroform | Fisher Scientific | Cat#BP1145–1 |
| AMPure XP beads | Beckman Coulter | Cat#A63880 |
| Brilliant II Sybr Green | Agilent Technologies | Cat#600828 |
| Phenol-Chloroform | Invitrogen | Cat#15593049 |
| DPBS | Gibco | Cat#14190250 |
| Concanavalin A beads | Bangs Laboratories | Cat#BP531 |
| CaCl2 | Fisher Scientific | Cat# BP510–500 |
| RNase A | Qiagen | Cat#19101 |
| Glycogen | Millipore Sigma | Cat#10901393001 |
| SDS | Fisher Scientific | Cat#BP166–100 |
| Proteinase K | Fisher Scientific | Cat#BP1700–50 |
| Ethanol | Sigma-Aldrich | Cat#E7023–500ML |
| Maxtract High-density tubes | Qiagen | Cat#129046 |
| KCl | Sigma-Aldrich | Cat#P3911–25G |
| Spermidine | Sigma-Aldrich | Cat#S2501–5G |
| PEG 8000 | Sigma-Aldrich | Cat#202452–500G |
| NaCl | Thermo Fisher Scientific | Cat# S271–500 |
| EDTA | Thermo Fisher Scientific | Cat#17892 |
| EGTA | Sigma Aldrich | Cat#E3889 |
| Triton X-100 | Sigma Aldrich | Cat#X100–5ML |
| cOmplete™, EDTA-free Protease Inhibitor Cocktail | Millipore Sigma | Cat#5056489001 |
| Formaldehyde | Sigma-Aldrich | Cat# FP8775 |
| Glycine | Thermo Fisher Scientific | Cat# BP381–5 |
| Agarose | Thermo Fisher Scientific | Cat# BP1356–500 |
| Benzamidine | Sigma-Aldrich | Cat#B6506–5G |
| Proteinase Inhibitor Cocktail | Calbiochem | Cat#539137–10VL |
| Dynabeads Protein G | Invitrogen | Cat#10003D |
| Tris base | Thermo Fisher Scientific | Cat# BP152–5 |
| NP-40 | Sigma-Aldrich | Cat# 11332473001 |
| NaDOC | Sigma-Aldrich | Cat# D6750–25G |
| Ultrapure Water | Fisher Scientific | Cat# 10–977-015 |
| Quick Ligation Kit | New England Bioscience | Cat# M2200S |
| Quick Ligase | New England Bioscience | Cat#E7337A |
| Nanosep MF Filter Tube | VWR | Cat#29300–642 |
| Sybr Gold | Invitrogen | Cat#S11494 |
| 40% Polyacrylamide | Biorad | Cat# 161–0146 |
| Ammonium Persulfate | VWR | Cat# EM-2300 |
| TEMED | VWR | Cat# PAV3161 |
| 6x loading dye | Thermo Fisher Scientific | Cat# R0631 |
| NaOAC | Thermo Fisher Scientific | Cat# S25531 |
| Glycoblue | Invitrogen | Cat# AM9515 |
| NEBNext High Fidelity 2X PCR Master Mix | New England Bioscience | Cat# M0541L |
| MboI-HF enzyme | New England Bioscience | Cat#R0147 |
| Biotin-14-dATP | Life Technologies | Cat#19523–016 |
| DNA Polymerase (Klenow) | New England Bioscience | Cat#M0210 |
| 10x NEB buffer | New England Bioscience | Cat#B0202 |
| T4 DNA Ligase | New England Bioscience | Cat#M0202 |
| Dynabeads Streptavidin | Life Technologies | Cat#65602 |
| Klenow exo minus | New England Bioscience | Cat#M0212 |
| NEBNext Ultra II Q5 Master Mix | New England Bioscience | Cat#M0544S |
| Critical commercial assays | ||
| BD Cytofix/Cytoperm solution Kit | BD Biosciences | Cat#554714 |
| Foxp3/Transcription Factor Staining Buffer Set | eBiosciences | Cat#00–5523-00 |
| TransIT-LT1 Transfection Reagent | Mirus | Cat#MIR 2300 |
| LS Columns | Miltenyi Biotec | Cat#130–042 |
| APC BrdU Kit | BD Biosciences | Cat#557892 RRID:AB_2861367 |
| FlexiGene Kit | Qiagen | Cat#51206 |
| Superscript II | Thermo Fisher Scientific | Cat#18–064-014 |
| Zymo DNA Clean&Concentrator | Zymo Research | Cat#D4030 |
| End-it DNA End-repair Kit | Lucigen | Cat#ER81050 |
| NEB Library Index | New England Biosciences | Cat#E7600S |
| Qubit dsDNA HS Assay | Thermo Fisher Scientific | Cat#Q32851 |
| Deposited data | ||
| CD8+ T cell histone modifications ChIP | Yu et al. (14) | GSE89036 |
| Patient RNA Seq | Gregor et al.(47); Konrad et al.(48) | GSE46833 |
| Tbet ChIP-Seq | Dominguez et al.(41) | PRJNA287664 |
| Hi-C Sequencing | This paper | GSE205081 |
| Naive and Memory Hi-C Sequencing | Russ et al.(32) | GSE225885 |
| CTCF knockdown RNA Sequencing | This paper | GSE205079 |
| CTCF ChIP-Seq | This paper | GSE205077 |
| Input ChIP-Seq | Yu et al.14 | GSE89036 |
| CTCF Cut&Run | This paper | GSE205077 |
| CTCF knockdown Cut&Run | This paper | GSE205077 |
| CTCF knockdown ATAC | This paper | GSE205076 |
| Experimental models: Cell lines | ||
| B16-GP33–41 | Dr. A. Lamarre, INRS-institut Armand-Frappier | N/A |
| PLAT-E | Cell Biolabs | Cat#RV-101; RRID: CCL_B488 |
| Experimental models: Organisms/strains | ||
| P14 (B6.Cg-Tcratm1MomTg(TcrLCMV)327Sdz/TacMmjax) | The Jackson Laboratory | Cat#037394-JAX; RRID: MMRRC_037394-JAX |
| OT-1 (C57BL/6-Tg(TcraTcrb)1100Mjb/J | The Jackson Laboratory | Cat#003831; RRID: IMRS_JAX:003831 |
| CD45.2 (C57BL/6J) | The Jackson Laboratory | Cat#000664; RRID: IMSR_JAX:000664 |
| CD45.1 (B6.SJL-PtprcaPepcb/BoyJ) | The Jackson Laboratory | Cat#002014; RRID: IMSR_JAX:002014 |
| CD45.1.2 | Bred in-house | NA |
| Oligonucleotides | ||
| CTCF- forward for qPCR: 5’-AGTGAAAATGCTGAGCCGGA-3’ | IDT | NA |
| CTCF-reverse for qPCR: 5’-ATGATGGCTGTTGGCTGGTT-3’ | IDT | NA |
| Hprt-forward for qPCR: 5’-GGCCAGACTTTGTTGGATTT-3’ | IDT | NA |
| Hprt-reverse for qPCR: 5’-CAACTTGCGCTCATCT-3’. | IDT | NA |
| Gapdh-forward for qPCR:5’-AGGTCGGTGTGAACGGATTTG-3’ | IDT | NA |
| Gapdh-reverse for qPCR: 5’-TGTAGACCATGTAGTTGAGGTCA-3’ | IDT | NA |
| CD4 crRNA: 5’- CGGGTACCAGCCTGTTGCAA −3’ |
IDT | NA |
| Thy crRNA: 5’ CGTGTGCTCGGGTATCCCAA −3’ |
IDT | NA |
| Il7r crRNA: 5’-TCCTCCCTGGTTCCCTCCTG-3’ | IDT | NA |
| Ccl3 crRNA: 5’-CGATCCTGTTGGCCACCACG-3’ | IDT | NA |
| Bcl6 crRNA: 5’-ACACTTGCCCAGACACTAGA-3’ | IDT | NA |
| Recombinant DNA | ||
| shCTCF1: TGCTGTTGACAGTGAGCGCCCAGATGAAGACTGAAGTCATTAGTGAAGCCACAGATGTAATGACTTCAGTCTTCATCTGGATGCCTACTGCCTCGGA | Designed in-house | NA |
| shCTCF2: TGCTGTTGACAGTGAGCGAGCAGAGCATTCAGAACAGTGATAGTGAAGCCACAGATGTATCACTGTTCTGAATGCTCTGCCTGCCTACTGCCTCGGA | Designed in-house | NA |
| Screen shRNA (See Table) | Chen et al.(79) | NA |
| pAG-MNase | Meers et al.(80) | RRID:Addgene_123461 |
| Software and algorithms | ||
| FlowJo v10 | Treestar Inc | RRID:SCR_008520 |
| Prism 9 | Graphpad Inc | RRID: SCR_002798 |
| Gene Pattern | Reich et al.(81) | RRID: SCR_003201 |
| GSEA v4.2.2 | Broad Institute | RRID: SCR_003199 |
| HOMER v4.11 | Heinz et al.(82) | RRID: SCR_010881 |
| R v4.1.2 | Team(83) | RRID: SCR_01905 |
| HiCExplorer v3.6 | Ramirez et al.(84); Wolff et al.(85;)Wolff et al.(86) | RRID:SCR_022111 |
| multiHicCompare v1.3.2 | Stansfield et al.(87) | RRID:SCR_022368 |
| Bowtie2 v2.2.6 | Langmead and Salzberg(88) | RRID:SCR_016368 |
| DESeq2 v1.34.0 | Love et al.(79) | RRID:SCR_015687 |
| Bedtools v.2.29.2 | Quinlan(89) | RRID:SCR_006646 |
| featureCounts v2.0.1 | Liao et al.(90) | RRID:SCR_012919 |
| Integrative Genomics Viewer v2.10.0 | Thorvadsdottir et al.(91) | RRID:SCR_011793 |
| MACS2 v2.2.6 | Zhang et al.(92) | RRID:SCR_013291 |
| 10x Genomics Cell Ranger v4.0.0 | Zheng et al.(93) | RRID:SCR_017344 |
| Seurat v3.1.1 | Stuart et al.(94) | RRID:SCR_007322 |
| MAGIC-Impute v3.0.0 | Van Dijk et al.(95) | RRID: SCR_022369 |
| Encode ATAC-Seq Pipeline v2.1.3 | Consortium(96) | RRID:SCR_023100 |
| Encode ChIP-Seq Pipeline v2.1.5 | Consortium(96) | RRID:SCR_021323 |
| Juicer v1.6 | Durand et al.(97) | RRID:SCR_017226 |
EXPERIMENTAL MODEL AND SUBJECT DETAILS
Mice
All mice were bred on the C57BL6/J background and housed in specific pathogen-free conditions in accordance with the Institutional Animal Care and Use Committees of the University of California, San Diego. Both male and female mice were used throughout the study, with sex matched T cell donors and recipients (or female donor cells transferred into male recipients) and between 1.5 and 4 months old. C57BL/6J mice (stock #000664; The Jackson Laboratory), OT-I mice (with transgenic expression of H-2Kd-restricted TCR specific for ovalbumin peptide 257–264; stock #003831; The Jackson Laboratory), P14 mice (with transgenic expression of H-2Db-restricted TCR specific for LCMV glycoprotein GP33–41; stock #037394-JAX; The Jackson Laboratory), CD45.1+, and CD45.1.2+ congenic mice were bred in house.
Cell culture
For OT-I and P14 CD8+ T cell transductions, spleens and lymph nodes were negatively enriched, activated, and spinfected as previously described 34. Male B16 melanoma cells expressing the LCMV glycoprotein epitope amino acid 33–41 (BI6-GP33–41) and female PLAT-E cells were maintained in DMEM containing 5% bovine growth serum, 1% HEPES and 0.1% 2-Mercaptoethanol. Both cell lines have been confirmed to be free of mycoplasma through qPCR. Retroviral particles were generated in PLAT-E cells as previously described 34.
METHOD DETAILS
Infection Studies
Activated T cells were transduced with control construct (CD19 shRNA) or CTCF shRNA, mixed at a 1:1 ratio, and adoptively transferred at 1 × 10⁵ T cells per recipient mouse. Mice were then infected with 5 × 10³ CFU Lm-OVA by intravenous injection or 2×10⁵ PFU LCMV-Armstrong by intraperitoneal injection. For secondary infection, mice were re-challenged by intravenous injection of 1 × 10⁶ PFU VSV-OVA. T cells from OT-I mice were used for studies with Lm-OVA and T cells from P14 mice were used for studies with LCMV. CD45.1, CD45.1.2, and C57BL/6J mice were used in combination for all co-transfer studies.
Tumor Studies
B16-GP33–41 cells (5×10⁵) were transplanted subcutaneously into the right flank of wild-type mice. After tumors became palpable, 7–8 days post transplantation, 2.5×10⁶ P14 cells that were transduced with shCtrl or shCTCF and expanded in vitro with 100 U/ml IL-2 for 2 days, were mixed 1:1 and transferred intravenously. Tumors were monitored daily and mice with ulcerated tumors or tumors exceeding 1500 mm3 in size were euthanized in accordance with UCSD IACUC. TILs were isolated as previously described 34 one week following adoptive transfer. CD45.1, CD45.1.2, and C57BL/6J mice were used in combination for all co-transfer studies.
Preparation of Single Cell Suspension
Single-cell suspensions were prepared from spleen or lymph node by mechanical disruption with frosted microscope slides. For isolation of lymphocytes from the small intestine IEL compartment, Peyer’s patches and luminal contents were removed and the intestine was cut longitudinally and subsequently cut laterally into 0.5–1 cm2 pieces that were then incubated with 15.4 mg/100 μl dithioerythritol (EMD Millipore) in 10% HBSS/HEPES bicarbonate for 30 minutes at 37°C while stirring. Tumors were cut into pieces and digested for 30 minutes with 100U/ml type I collagenase (Worthington) in RPMI 1640, 5% FBS, 2 mM MgCl2, 2 mM CaCl2 at 37 °C while shaking. The tissue was further dissociated over a 70 μm nylon cell strainer (Falcon). For isolation of lymphocytes from the IEL and tumor, single-cell suspensions were purified using a 44/67% Percoll density gradient.
Flow cytometry and cell sorting
Cells were incubated for 30 minutes at 4°C in PBS supplemented with 2% bovine growth serum and 0.01% sodium azide. For intracellular cytokine staining, splenocytes were re-stimulated with OVA257–264 (InvivGen vac-sin) or GP33–41 peptide (Anaspec) for 4 hours at 37°C with Protein Transport Inhibitor Cocktail (eBioscience) added after 1 hour of incubation. CD107a (1D4B, BD Biosciences) antibody was included in the media for the entirety of the stimulation to detect surface expression as a surrogate of degranulation. To better preserve the ametrine reporter signal in transduced populations, samples were fixed and permeabilized using the Cytofix/Cytoperm Fixation/Permeabilization kit (BD). Non-transduced populations were fixed and permeabilized using the Foxp3/Transcription Factor Staining Buffer Set (eBioscience). Stained cells were analyzed using LSRFortessa X-20 or LSRFortessa cytometers (BD) and FlowJo software (TreeStar). Cell sorting was performed on FACSAria or FACSAria Fusion instruments (BD).
shRNA knockdown.
shRNA’s targeting CTCF were produced by cloning shRNAmir sequences (CTCF#1: CCAGATGAAGACTGAAGTCAT; CTCF#2: GCAGAGCATTCAGAACAGTGA into our pLMPd-Amt vector 79. For transfections, 3×10⁶ PLAT-E cells were seeded in a 10 cm dish 1 day before transfection. Each plate was transfected 10 μg of DNA from each pLMPd-Amt clone and 5 μg of pCL-Eco using TransIT-LT1 (Mirus) in Opti-MEM medium. The medium was replaced by T cell medium after 16h and the retroviral supernatant were collected 48 hours later.
For CD8+ T cell activation, naive CD8+ T cells from spleens and lymph nodes were negatively enriched with MACS columns using biotin anti-CD4, anti-Ter119, anti-GR-1, anti-MHCII, anti-B220, and anti-NK1.1. 2 × 10⁶ OT-I or P14 cells were plated in a well of a 6-well plate that was pre-coated with 100 μg/ml goat anti-hamster IgG (H+L, Thermo Fisher Scientific). The activation medium contained 1 μg/ml anti-CD3 (145–2C11) and 1 μg/ml anti-CD28 (37.51) (eBioscience). Culture medium was replaced after 18h of activation with retroviral supernatant mixed with 50 μM BME and 8 μg/ml polybrene (Millipore) followed by spin-infection (1-hour centrifugation at 2000 RPM, 37°C). The plate was incubated at 37°C for 3 hours after spin-infection, and then the retroviral supernatant was replaced by T cell medium and incubated for 24 hours.
RNAi screening approach
As described previously, the targeted shRNA library was generated on the basis of key genes identified from the computational screening approach as well as genes with known roles in regulating circulating memory CD8+ T cells from literature 34,79. The library was produced by cloning shERWOOD-designed shRNA sequences, after PCR of synthetic 97-mer oligonucleotides, into our pLMPd-Amt vector. Purified DNA from sequence-verified clones was used to package retroviral particles in PLAT-E cells. The PLAT-E cell line was obtained from Cell Biolabs. For transfections, PLAT-E cells were seeded in the middle 60 wells of a 96-well flat-bottom plate at a density of 4 × 10⁴−6 ×10⁴ cells per well 1 day before transfection. Next, each well was individually transfected with 0.2 μg of DNA from each pLMPd-Amt clone and 0.2 μg of pCL-Eco using TransIT-LT1 (Mirus). Retroviral supernatant was collected 36, 48 and 60 hours after transfection, and retroviral supernatant from each well was used to individually transduce in vitro activated P14 cells in 96-well round-bottom plates.
For CD8+ T cell activation in vitro, naive CD8+ T cells from spleen and lymph nodes were negatively enriched and 2 ×10⁵ P14 cells were plated in the middle 60 wells of 96-well round-bottom plates pre-coated with 100 μg/ml goat anti-hamster IgG (H+L, Thermo Fisher Scientific) and 1 μg/ml anti-CD3 (145–2C11) and 1 μg/ml anti-CD28 (37.51) (both from eBioscience). Culture medium was removed 18 hours after activation and replaced with retroviral supernatant supplemented with 50 μM BME and 8 μg/ml polybrene (Millipore) followed by spinfection (1-hour centrifugation at 805 g, 37°C). Two hours after the spin-infection, the P14 cells were washed 3 times with cold PBS and 90% of each well of cells (individually transduced with distinct retroviral constructs) was collected, pooled and 5 ×10⁵ pooled P14 cells were transferred into recipient mice, which were then infected 1 hour later with 1.5 × 10⁵ PFU of LCMV Armstrong intraperitoneally, resulting in an acute infection. The remaining cells in vitro were cultured for an additional 24 hour and either pooled for ‘input’ sequencing (6×10⁵ P14 cells) or were used to test transduction efficiency of each construct using flow cytometry to detect the percentage of Ametrine+ cells in each well.
Tcm, Tem, t-Tem cells were sorted from the spleen (2 × 10⁵−6 × 10⁵ cells total). Genomic DNA was then collected from sorted cells using the FlexiGene kit (Qiagen). The integrated proviral passenger strand shRNA sequences in each cell subset were amplified from 20–100 ng total genomic DNA per reaction, with 23–28 cycles of PCR using Ion Proton-compatible barcoded primers that anneal to the common 5’ mir30 and shRNA loop sequences. Between two and three replicate reactions were performed for each genomic DNA sample and the replicates were pooled after amplification. The pooled reactions were purified using AMPure XP beads, the amplicons in each sample were quantified using a Bioanalyzer, and then pooled in a 1:1 molar ratio for sequencing. In each replicate of the screen, a minimum of 2.5 million reads per sample were generated and retained, after filtering low-quality reads. Reads assigned to each barcode were aligned to a reference database of all shRNA in the library using BLAST and a custom script to count the top alignment of each read and summarize the number of reads aligned to each shRNA.
For analysis of shRNA representation, the total number of reads in each of the samples was normalized, and the number of reads for each shRNA was scaled proportionally. Subsequently, the normalized number of reads in the Tem or t-Tem cells for a given shRNAmir was divided by the normalized number of reads for the same shRNAmir in the Tcm or Tem sample and then log2 transformed. The mean and s.d. of the ratios of each of the 25 negative-control shRNAmir constructs (targeting Cd19, Cd4, Cd14, Ms4a1, Cd22, Hes1, Klf12, Mafb, Plagl 1, Pou2af1 and Smarca1) were used to calculate the Z-score for each shRNAmir construct.
RT-qPCR.
50,000 cells were sorted directly into Trizol, and RNA was extracted by chloroform and isopropanol precipitation. cDNA was synthesized using Superscript II (Life Technologies) following manufacturer’s instructions, and quantitative PCR (qPCR) was performed using the Stratagene Brilliant II Syber Green master mix (Agilent Technologies).
Western Blotting
CD8+ T cells transduced with shCtrl or shCTCF were cultured for 48h with 100 U/ml IL-2. 2 × 10⁶ Ametrine+ cells were sorted, and proteins were extracted in lysis buffer (1% NP-40, 120 mM NaCl, 50 mM Tris-HCl [pH 7.4], and 1 mM EDTA) containing protease inhibitor mixture (Sigma). Then, 10 mg of protein per sample was resolved on NuPage 4–12% Bis-Tris precast gels in MES buffer (Invitrogen), transferred to 0.45 mm PVDF membrane, and then blocked with 5% BSA in TBS supplemented with 0.1% Tween-20. CTCF (07–729, Millipore) and β-actin (Cell Signaling Technology) primary Abs were incubated overnight at 4°C followed by HRP-conjugated secondary Abs for 1 hour at room temperature (1:10000, Jackson ImmunoResearch Laboratories). Proteins were visualized with chemiluminescent ECL Prime Western Blotting Detection Reagent (Amersham Biosciences) or ECL Western Blotting Substrate (Pierce) and imaged on a Bio-Rad Laboratories ChemiDoc. ImageJ software was used to quantify protein bands.
RNA Sequencing
1 × 10³ transduced KLRG1hi CD127lo CD8+ T cells on day 8 after Lm-OVA infection and 1 × 10³ transduced OT-I cells that were cultured in 100 U/mL IL-2 for 2 days were sorted into TCL buffer (QIAGEN) with 1% 2-Mercaptoethanol. Isolation of polyA+ RNA, RNA-Seq library preparation and RNA-seq analysis were performed as described (Immgen) using an anchored oligo(dT) primer (5’-AAGCAGTGGTATCAACGCAGAGTACT30VN-3’), Tn5-transposon-based fragmentation, and PCR amplification. Smart-seq paired-end sequencing was performed on an Illumina NextSeq500 (two full NextSeq runs per batch of 96 samples, for 10M raw reads/sample on average) using 2 × 38bp reads with no further trimming. Reads were aligned to the mouse genome (GENCODE GRCm38/mm10 primary assembly and gene annotations vM25; https://www.gencodegenes.org/mouse/release_M25.html) with STAR 2.7.3a. The ribosomal RNA gene annotations were removed from GTF (General Transfer Format) file. The gene-expression quantification was calculated by featureCounts90. Raw reads counts tables were normalized by median of ratios method and differential gene lists were created using a FC cutoff of 1.5 and a q-value cutoff of 0.05 through the DESeq2 package78 using R83.
For the overlap of subset gene signatures in Figure 1F, 1G, 1H, 2G, 2H, 2I, 5G, gene signatures from Yu et al. 2017 were used. The naive gene signature was made of genes upregulated in naive cells compared to TE cells. The TE gene signature included genes upregulated in TE cells versus MP cells. The MP gene signature contained genes upregulated in MP cells and not TE cells.
For human PBL RNA-seq analysis, the normalized gene expression data was downloaded from GSE46833 and obtained from the authors. In Figure S5A and S5B, Volcano plots were generated by GenePattern81 multiplot studio module. For Figure S5C and S5D, GSEA was performed using Terminal and Progenitor Exhausted gene lists8 and CD8+ T cell effector and memory gene lists14.
For the plot in Figure 5B, GSEA was performed using gene signatures from Yu et al, 2017. For the transcription factor heatmap in Figure 5C, transcription factors were picked based on known roles in regulating CD8+ T cell differentiation. Heatmaps in Figure 5D used gene lists from Luckey et al. 2006. Metascape98 was used to annotate the gene lists for Figure 5E and 5F.
Hi-C and computation analysis
2.5–4×10⁶ OT-I cells were sorted per sample. Naive cells were sorted as CD44loCD62Lhi. The effector subsets were sorted 7 days post infection with Lm-OVA with TE cells as CD127loKLRG1hi, and MP cells as CD127hiKLRG1to. The cells were fixed in 1.48% formaldehyde for 1 minute at RT and subsequently quenched with 0.125M glycine. Nuclei were isolated and then permeabilized. The nuclei were incubated with MboI-HF enzyme (NEB) overnight at 37°C. The enzyme was inactivated at 62°C for 20 minutes, and the overhangs were marked with biotin. Proximal regions were ligated with T4 DNA ligase (NEB), proteins were degraded with proteinase K, and then the crosslinks were reversed by incubating at 68°C overnight. The DNA was sheared to the size of 300–500bp using a Covaris LE220. The biotinylated DNA were pulled down using Dynabeads MyOne Streptavidin T1 beads (Life technologies). The ends of the DNA were repaired, and biotin was removed from unligated ends. Illumina indexed adaptors were ligated to the DNA samples, and the library was amplified with 4–12 cycles of PCR. The library was size selected with AMPure XP beads (Beckman Coulter) to retain 300–500bp.
Raw Hi-C FASTQ files were aligned to the mouse genome (mm10 build), and binned Hi-C matrices generated using Juicer97. Multihiccompare87 fastlo function was used to normalize the Hi-C matrices and hic_glm was used to determine differential interactions using the QLF test and fdr arguments with a log2FC cutoff of .667, logCPM cutoff of 1, and a p.adj cutoff of 0.05. HiCExplorer84–86 was used to measure correlation, call compartments with H3K27ac ChIP peaks marking the active compartments, and visualize interactions. Compartment switching was determined by a change in sign of the PC1 value. pyGenomeTracks was used to visualize interactions in Figure 1L and 2J. GSEA was used with T cell subset gene lists and genes located within areas with differential interactions. HOMER analyzeHiC82 was used to quantify average interactions around CTCF binding site with distNorm normalization and heatmaps were plotted with heatmap.2. Interaction enrichment for lists of subset- specific promoters and enhancers obtained from Yu et al. 2017 was measured using HOMER annotateInteractions82 and were normalized to the number of expected interactions based on the distance between regions. Control bed files for random regions were made using bedtools89 shuffle.
ChIP-seq and computational analysis.
Naive cells were sorted as CD44loCD62Lhi. The effector cell subsets were sorted 8 days post infection with Lm-OVA with TE cells as CD127loKLRG1hi, and MP cells as CD127hiKLRG1to. 5 × 10⁶ CD8+ T cells were sorted from spleens and lymph nodes, fixed in 1% formaldehyde for 10 min, and subsequently quenched with 0.125 M glycine. Cells were lysed and sonicated to generate 250–500 bp fragments using a Bioruptor. 30 μl of magnetic dynabeads (Life Technologies) were mixed with 5μg CTCF antibody (07–729, Millipore) in 500μl blocking buffer, rotated for at least 4 hours, and then mixed with diluted lysate and rotated overnight at 4°C. Beads were washed, eluted and reverse-crosslinked at 65°C overnight and then treated with RNAse for 30 min at 37°C and Proteinase K at 55°C for 1 hour. DNA was purified by Zymo DNA Clean & Concentrator kit (Zymo Research). The ChIPed DNA was end-repaired using End-it End-repair kit (Lucigen) and then added an A base to the 3’ end of DNA fragments using Klenow (NEB). Then DNA was ligated with adaptors using quick DNA ligase (NEB) at 25°C for 15 min followed by size selection of 200–400 bp using AMPure XP beads (Beckman Coulter). The adaptor ligated DNA was amplified using NEBNext High-Fidelity 2X PCR master mix (NEB). Then the amplified library was sized selected as 200–400bp using Ampure beads and quantified by Qubit dsDNA HS assay kit (ThermoFisher). Finally, the library was sequenced using Hiseq 2500 for single-end 50bp sequencing to get around 10 million reads for each sample. ChIP-seq sequencing files were processed using the ENCODE pipeline96 with default settings (https://github.com/ENCODE-DCC/chip-seq-pipeline2). The ENCODE pipeline for ChIP-Seq maps reads using bowtie288f , creates signal tracks and called peaks using Macs2.
CUT&RUN and computational analysis
1×10⁶ OT-I cells were sorted for the naive, TE, and MP cell subsets. 1.5×10⁵ transduced OT-I cells were sorted 7 days post infection with Lm-OVA. Cut&Run was performed as previously described99. The library was prepared as previously described100,101 (https://dx.doi.org/10.17504/protocols.io.wvgfe3w). Samples were sequenced on the NovaSeq S4 with a PE100 run. Sequencing file quality was checked with fastqc. Reads were aligned with bowtie2 and normalized to reads that aligned to the e. coli genome as previously described80. Peaks were called using MACS92.
CTCF binding analysis
CTCF peak sets were made using MSPC102 to call consensus peaks among ChIP-Seq and Cut&Run samples. HOMER82 was used on these peak sets to call differential peaks with a fold-change cutoff of 4 and p-value cutoff of 0.0001. HOMER82 was used to determine the overlap of peak sets. Binding was visualized with IGV91.
ATAC-Seq and computational analysis
5×10⁴ transduced OT-I cells were for the TE cell subset and in vitro activated cells were sort purified. ATAC-Seq and library prep was performed as previously described103. In vivo samples were sequenced on the NovaSeq S4 with a PE100 run. In vitro samples were sequenced on the HiSeq 4000 with a SE100 run. Fastq files were using the ENCODE pipeline96 with default settings (https://github.com/ENCODE-DCC/atac-seq-pipeline). The ENCODE pipeline for ATAC-Seq96 maps reads using bowtie2, creates signal tracks and called peaks using Macs292. HOMER82 was used to identify differential peaks with a fold-change cutoff of 4 and p-value cutoff of 0.001 and quantify tag enrichment.
Jaccard Index
Gene lists from Milner et al, 2017 were made into BED files containing the chromosomal coordinates of the genes. Bedtools89 was used to quantify the jaccard index between bed files, which describes the overlap between the lists of regions. The analysis was used as a descriptive tool and does not have statistical testing.
CRISPR Cas9 targeting
One day post activation, T cells were electroporated with complexed tracrRNA (IDT), Cas9 (UC Berkeley), and crRNA (IDT). crRNA targeting Thy1 or CD4 was used alone as a control and was mixed with the conditional crRNA to be used as a marker of electroporated cells. Electroporated cells were cultured in 100 U/ml of IL-2 for 24 or 48 hours. 24 hours after electroporation, control and experimental samples were mixed 1:1 and transferred into recipients. 48 hours post-electroporation, cells were collected for DNA sequencing. DNA modifications were quantified using TIDE104.
scRNA-Seq Reanalysis
Fastq files were downloaded from GeneOmnibus (GSE131847). Reads were aligned to the mm10 genome using cellranger93 count. The resulting counts matrix was then processed using Seurat94 and cells with < 500 reads or a mitochondrial read % greater than 7 were discarded. Data was normalized using sctransform in Seurat with vars.to.regress = “percent.mt”. PCA calculation was performed using RunPCA using the 3000 most variable features from sctransform. The top 30 principal components were used to calculate a UMAP dimensional reduction using the RunUMAP function. Louvain clustering was performed with Seurat’s FindClusters based on the top 30 principal components with default parameters. Additionally, data imputation was performed using MAGIC95 with the sctransform expression values and the default settings and the exact solver. Cells were assigned to KLRG1 high / low based on a manually chosen cutoff of 0.25 in the MAGIC imputed data. Expression of indicated markers was then plotted using the MAGIC imputed expression values. Statistics were calculated using the FindMarkers function in Seurat using the SCT assay with ident.1 = “KLRG1_low” and ident.2 = “KLRG1_high” for each timepoint separately.
Summary diagrams
The graphical abstract was designed using BioRender.
QUANTIFICATION AND STATISTICAL ANALYSIS
Statistical parameters are reported in the Figures and Figure Legends. Asterisks in figures denote statistical significance (*p < 0.05, **p < 0.01, ***p < 0.001, ****p < 0.0001), and data is judged to be statistically significant when p < 0.05. All sequencing was performed and analyzed independently in at least two biological replicates, and gene expression signatures were compared by Fisher’s exact tests. Statistical significance for re-analyzed scRNA-Seq data was calculated using the Wilcoxon Rank Sum test. Statistical significance for Hi-C data was calculated using the one-sided paired Wilcoxon test. In all other data analysis, statistical significance was calculated by paired two-tailed Student’s t test. Statistical analysis was performed in GraphPad Prism software and R.
ADDITIONAL RESOURCES
Supplementary Material
Supplemental table 1 related to figure 1. Hi-C library information.
Supplemental table 2 related to figure 1. Differential interactions between CD8+ T cell subsets.
Supplemental table 3 related to figure 1, 2, and 5. Chromosomal coordinates of CD8+ T cell subset specific gene lists.
Supplemental table 4 related to figure 3. RNAi screen results.
Supplemental table 5 related to figure 3. shRNA sequences for RNAi screen.
Highlights:
Genome organization changes with effector CD8+ T cell differentiation.
CTCF binding patterns are altered with effector CD8+ T cell differentiation.
CTCF regulates subset-specific transcriptional programs and chromatin accessibility.
CTCF controls optimal CD8+ T cell-fate decisions in the response to infection.
ACKNOWLEDGEMENTS
We thank the Flow Cytometry Core at the La Jolla Institute for Immunology for their assistance with cell sorting, ImmGen for processing RNA-sequencing samples, the Stem Cell Genomics and Microscopy Core for their assistance with cell sorting, and the Turner and Goldrath laboratories for technical advice, helpful discussions, and critical reading of the manuscript. ChIP sequencing, Cut&Run sequencing, and ATAC sequencing were conducted at the IGM Genomics Center, University of California, San Diego, CA. Hi-C sequencing was conducted at Monash University. This study was supported by NIH P01AI132122 (A.W.G.), NIH U19AI109976 (A.W.G.), NIH 5R01AI067545 (A.W.G.), NIH T32GM13335 (S.Q.), National and Health Medical Research project grant APP1003131 (S.J.T), an Australian Research Council Discovery Grant DP170102020 (S.J.T), and a joint Monash University-University of California, San Diego Seed Development grant (A.W.G. and S.J.T.).
Footnotes
DECLARATION OF INTERESTS
A.W.G. is a member of the scientific advisory board of ArsenalBio. S.J.T is a member of the scientific advisory board for Medicago, Inc., QC, Canada. No funding from Medicago or ArsenalBio was provided for this work.
Publisher's Disclaimer: This is a PDF file of an unedited manuscript that has been accepted for publication. As a service to our customers we are providing this early version of the manuscript. The manuscript will undergo copyediting, typesetting, and review of the resulting proof before it is published in its final form. Please note that during the production process errors may be discovered which could affect the content, and all legal disclaimers that apply to the journal pertain.
REFERENCES
- 1.Joshi NS, and Kaech SM (2008). Effector CD8 T cell development: a balancing act between memory cell potential and terminal differentiation. J Immunol 180, 1309–1315. 10.4049/jimmunol.180.3.1309. [DOI] [PubMed] [Google Scholar]
- 2.Cui W, and Kaech SM (2010). Generation of effector CD8+ T cells and their conversion to memory T cells. Immunol Rev 236, 151–166. 10.1111/j.1600-065X.2010.00926.x. [DOI] [PMC free article] [PubMed] [Google Scholar]
- 3.Joshi NS, Cui W, Chandele A, Lee HK, Urso DR, Hagman J, Gapin L, and Kaech SM (2007). Inflammation directs memory precursor and short-lived effector CD8(+) T cell fates via the graded expression of T-bet transcription factor. Immunity 27, 281–295. 10.1016/j.immuni.2007.07.010. [DOI] [PMC free article] [PubMed] [Google Scholar]
- 4.Milner JJ, Nguyen H, Omilusik K, Reina-Campos M, Tsai M, Toma C, Delpoux A, Boland BS, Hedrick SM, Chang JT, and Goldrath AW (2020). Delineation of a molecularly distinct terminally differentiated memory CD8 T cell population. Proc Natl Acad Sci U S A 117, 25667–25678. 10.1073/pnas.2008571117. [DOI] [PMC free article] [PubMed] [Google Scholar]
- 5.Topham DJ, and Reilly EC (2018). Tissue-Resident Memory CD8(+) T Cells: From Phenotype to Function. Front Immunol 9, 515. 10.3389/fimmu.2018.00515. [DOI] [PMC free article] [PubMed] [Google Scholar]
- 6.Wherry EJ (2011). T cell exhaustion. Nat Immunol 12, 492–499. 10.1038/ni.2035. [DOI] [PubMed] [Google Scholar]
- 7.Martin MD, and Badovinac VP (2018). Defining Memory CD8 T Cell. Front Immunol 9, 2692. 10.3389/fimmu.2018.02692. [DOI] [PMC free article] [PubMed] [Google Scholar]
- 8.Miller BC, Sen DR, Al Abosy R, Bi K, Virkud YV, LaFleur MW, Yates KB, Lako A, Felt K, Naik GS, et al. (2019). Subsets of exhausted CD8(+) T cells differentially mediate tumor control and respond to checkpoint blockade. Nat Immunol 20, 326–336. 10.1038/s41590-019-0312-6. [DOI] [PMC free article] [PubMed] [Google Scholar]
- 9.Paley MA, Kroy DC, Odorizzi PM, Johnnidis JB, Dolfi DV, Barnett BE, Bikoff EK, Robertson EJ, Lauer GM, Reiner SL, and Wherry EJ (2012). Progenitor and terminal subsets of CD8+ T cells cooperate to contain chronic viral infection. Science 338, 1220–1225. 10.1126/science.1229620. [DOI] [PMC free article] [PubMed] [Google Scholar]
- 10.Kaech SM, and Cui W. (2012). Transcriptional control of effector and memory CD8+ T cell differentiation. Nat Rev Immunol 12, 749–761. 10.1038/nri3307. [DOI] [PMC free article] [PubMed] [Google Scholar]
- 11.Chang JT, Wherry EJ, and Goldrath AW (2014). Molecular regulation of effector and memory T cell differentiation. Nat Immunol 15, 1104–1115. 10.1038/ni.3031. [DOI] [PMC free article] [PubMed] [Google Scholar]
- 12.He B, Xing S, Chen C, Gao P, Teng L, Shan Q, Gullicksrud JA, Martin MD, Yu S, Harty JT, et al. (2016). CD8(+) T Cells Utilize Highly Dynamic Enhancer Repertoires and Regulatory Circuitry in Response to Infections. Immunity 45, 1341–1354. 10.1016/j.immuni.2016.11.009. [DOI] [PMC free article] [PubMed] [Google Scholar]
- 13.Russ BE, Olshanksy M, Smallwood HS, Li J, Denton AE, Prier JE, Stock AT, Croom HA, Cullen JG, Nguyen ML, et al. (2014). Distinct epigenetic signatures delineate transcriptional programs during virus-specific CD8(+) T cell differentiation. Immunity 41, 853–865. 10.1016/j.immuni.2014.11.001. [DOI] [PMC free article] [PubMed] [Google Scholar]
- 14.Yu B, Zhang K, Milner JJ, Toma C, Chen R, Scott-Browne JP, Pereira RM, Crotty S, Chang JT, Pipkin ME, et al. (2017). Epigenetic landscapes reveal transcription factors that regulate CD8(+) T cell differentiation. Nat Immunol 18, 573–582. 10.1038/ni.3706. [DOI] [PMC free article] [PubMed] [Google Scholar]
- 15.Andrey G, and Mundlos S. (2017). The three-dimensional genome: regulating gene expression during pluripotency and development. Development 144, 3646–3658. 10.1242/dev.148304. [DOI] [PubMed] [Google Scholar]
- 16.Chen Y, Zander R, Khatun A, Schauder DM, and Cui W. (2018). Transcriptional and Epigenetic Regulation of Effector and Memory CD8 T Cell Differentiation. Front Immunol 9, 2826. 10.3389/fimmu.2018.02826. [DOI] [PMC free article] [PubMed] [Google Scholar]
- 17.Sivakumar A, de Las Heras JI, and Schirmer EC (2019). Spatial Genome Organization: From Development to Disease. Front Cell Dev Biol 7, 18. 10.3389/fcell.2019.00018. [DOI] [PMC free article] [PubMed] [Google Scholar]
- 18.Magana-Acosta M, and Valadez-Graham V. (2020). Chromatin Remodelers in the 3D Nuclear Compartment. Front Genet 11, 600615. 10.3389/fgene.2020.600615. [DOI] [PMC free article] [PubMed] [Google Scholar]
- 19.Bediaga NG, Coughlan HD, Johanson TM, Garnham AL, Naselli G, Schroder J, Fearnley LG, Bandala-Sanchez E, Allan RS, Smyth GK, and Harrison LC (2021). Multi-level remodelling of chromatin underlying activation of human T cells. Sci Rep 11, 528. 10.1038/s41598-020-80165-9. [DOI] [PMC free article] [PubMed] [Google Scholar]
- 20.Bell AC, West AG, and Felsenfeld G. (1999). The protein CTCF is required for the enhancer blocking activity of vertebrate insulators. Cell 98, 387–396. 10.1016/s0092-8674(00)81967-4. [DOI] [PubMed] [Google Scholar]
- 21.Ong CT, and Corces VG (2014). CTCF: an architectural protein bridging genome topology and function. Nat Rev Genet 15, 234–246. 10.1038/nrg3663. [DOI] [PMC free article] [PubMed] [Google Scholar]
- 22.Moore JM, Rabaia NA, Smith LE, Fagerlie S, Gurley K, Loukinov D, Disteche CM, Collins SJ, Kemp CJ, Lobanenkov VV, and Filippova GN (2012). Loss of maternal CTCF is associated with peri-implantation lethality of Ctcf null embryos. PLoS One 7, e34915. 10.1371/journal.pone.0034915. [DOI] [PMC free article] [PubMed] [Google Scholar]
- 23.Heath H, Ribeiro de Almeida C, Sleutels F, Dingjan G, van de Nobelen S, Jonkers I, Ling KW, Gribnau J, Renkawitz R, Grosveld F, et al. (2008). CTCF regulates cell cycle progression of alphabeta T cells in the thymus. EMBO J 27, 2839–2850. 10.1038/emboj.2008.214. [DOI] [PMC free article] [PubMed] [Google Scholar]
- 24.Shih HY, and Krangel MS (2013). Chromatin architecture, CCCTC-binding factor, and V(D)J recombination: managing long-distance relationships at antigen receptor loci. J Immunol 190, 4915–4921. 10.4049/jimmunol.1300218. [DOI] [PMC free article] [PubMed] [Google Scholar]
- 25.Pham D, Moseley CE, Gao M, Savic D, Winstead CJ, Sun M, Kee BL, Myers RM, Weaver CT, and Hatton RD (2019). Batf Pioneers the Reorganization of Chromatin in Developing Effector T Cells via Ets1-Dependent Recruitment of Ctcf. Cell Rep 29, 1203–1220 e1207. 10.1016/j.celrep.2019.09.064. [DOI] [PMC free article] [PubMed] [Google Scholar]
- 26.Chisolm DA, Savic D, Moore AJ, Ballesteros-Tato A, Leon B, Crossman DK, Murre C, Myers RM, and Weinmann AS (2017). CCCTC-Binding Factor Translates Interleukin 2- and alpha-Ketoglutarate-Sensitive Metabolic Changes in T Cells into Context-Dependent Gene Programs. Immunity 47, 251–267 e257. 10.1016/j.immuni.2017.07.015. [DOI] [PMC free article] [PubMed] [Google Scholar]
- 27.Stik G, Vidal E, Barrero M, Cuartero S, Vila-Casadesus M, Mendieta-Esteban J, Tian TV, Choi J, Berenguer C, Abad A, et al. (2020). CTCF is dispensable for immune cell transdifferentiation but facilitates an acute inflammatory response. Nat Genet 52, 655–661. 10.1038/s41588-020-0643-0. [DOI] [PubMed] [Google Scholar]
- 28.Sekimata M, Perez-Melgosa M, Miller SA, Weinmann AS, Sabo PJ, Sandstrom R, Dorschner MO, Stamatoyannopoulos JA, and Wilson CB (2009). CCCTC-binding factor and the transcription factor T-bet orchestrate T helper 1 cell-specific structure and function at the interferon-gamma locus. Immunity 31, 551–564. 10.1016/j.immuni.2009.08.021. [DOI] [PMC free article] [PubMed] [Google Scholar]
- 29.Shan Q, Zhu S, Chen X, Liu J, Yuan S, Li X, Peng W, and Xue HH (2022). Tcf1-CTCF cooperativity shapes genomic architecture to promote CD8(+) T cell homeostasis. Nat Immunol 23, 1222–1235. 10.1038/s41590-022-01263-6. [DOI] [PMC free article] [PubMed] [Google Scholar]
- 30.Wang W, Chandra A, Goldman N, Yoon S, Ferrari EK, Nguyen SC, Joyce EF, and Vahedi G. (2022). TCF-1 promotes chromatin interactions across topologically associating domains in T cell progenitors. Nat Immunol. 10.1038/s41590-022-01232-z. [DOI] [PMC free article] [PubMed] [Google Scholar]
- 31.Belton JM, McCord RP, Gibcus JH, Naumova N, Zhan Y, and Dekker J. (2012). Hi-C: a comprehensive technique to capture the conformation of genomes. Methods 58, 268–276. 10.1016/j.ymeth.2012.05.001. [DOI] [PMC free article] [PubMed] [Google Scholar]
- 32.Russ BE, Tsyganov K, Quon S, Yu B, Li J, Lee JK, Olshansky M, He Z, Harrison PF, Barugahare A, et al. (2023). Active maintenance of CD8+ T cell naivety through regulation of global genome architecture. bioRxiv, 2023.2002.2026.530139. 10.1101/2023.02.26.530139. [DOI] [PMC free article] [PubMed] [Google Scholar]
- 33.Pekowska A, Klaus B, Xiang W, Severino J, Daigle N, Klein FA, Oles M, Casellas R, Ellenberg J, Steinmetz LM, et al. (2018). Gain of CTCF-Anchored Chromatin Loops Marks the Exit from Naive Pluripotency. Cell Syst 7, 482–495 e410. 10.1016/j.cels.2018.09.003. [DOI] [PMC free article] [PubMed] [Google Scholar]
- 34.Milner JJ, Toma C, Yu B, Zhang K, Omilusik K, Phan AT, Wang D, Getzler AJ, Nguyen T, Crotty S, et al. (2017). Runx3 programs CD8(+) T cell residency in non-lymphoid tissues and tumours. Nature 552, 253–257. 10.1038/nature24993. [DOI] [PMC free article] [PubMed] [Google Scholar]
- 35.Xin A, Masson F, Liao Y, Preston S, Guan T, Gloury R, Olshansky M, Lin JX, Li P, Speed TP, et al. (2016). A molecular threshold for effector CD8(+) T cell differentiation controlled by transcription factors Blimp-1 and T-bet. Nat Immunol 17, 422–432. 10.1038/ni.3410. [DOI] [PMC free article] [PubMed] [Google Scholar]
- 36.Escobar G, Mangani D, and Anderson AC (2020). T cell factor 1: A master regulator of the T cell response in disease. Sci Immunol 5. 10.1126/sciimmunol.abb9726. [DOI] [PMC free article] [PubMed] [Google Scholar]
- 37.Kurd NS, He Z, Louis TL, Milner JJ, Omilusik KD, Jin W, Tsai MS, Widjaja CE, Kanbar JN, Olvera JG, et al. (2020). Early precursors and molecular determinants of tissue-resident memory CD8(+) T lymphocytes revealed by single-cell RNA sequencing. Sci Immunol 5. 10.1126/sciimmunol.aaz6894. [DOI] [PMC free article] [PubMed] [Google Scholar]
- 38.Yao C, Lou G, Sun HW, Zhu Z, Sun Y, Chen Z, Chauss D, Moseman EA, Cheng J, D’Antonio MA, et al. (2021). BACH2 enforces the transcriptional and epigenetic programs of stem-like CD8(+) T cells. Nat Immunol 22, 370–380. 10.1038/s41590-021-00868-7. [DOI] [PMC free article] [PubMed] [Google Scholar]
- 39.Roychoudhuri R, Clever D, Li P, Wakabayashi Y, Quinn KM, Klebanoff CA, Ji Y, Sukumar M, Eil RL, Yu Z, et al. (2016). BACH2 regulates CD8(+) T cell differentiation by controlling access of AP-1 factors to enhancers. Nat Immunol 17, 851–860. 10.1038/ni.3441. [DOI] [PMC free article] [PubMed] [Google Scholar]
- 40.Jia Z, Li J, Ge X, Wu Y, Guo Y, and Wu Q. (2020). Tandem CTCF sites function as insulators to balance spatial chromatin contacts and topological enhancer-promoter selection. Genome Biol 21, 75. 10.1186/s13059-020-01984-7. [DOI] [PMC free article] [PubMed] [Google Scholar]
- 41.Dominguez CX, Amezquita RA, Guan T, Marshall HD, Joshi NS, Kleinstein SH, and Kaech SM (2015). The transcription factors ZEB2 and T-bet cooperate to program cytotoxic T cell terminal differentiation in response to LCMV viral infection. J Exp Med 212, 2041–2056. 10.1084/jem.20150186. [DOI] [PMC free article] [PubMed] [Google Scholar]
- 42.Franke M, De la Calle-Mustienes E, Neto A, Almuedo-Castillo M, Irastorza-Azcarate I, Acemel RD, Tena JJ, Santos-Pereira JM, and Gomez-Skarmeta JL (2021). CTCF knockout in zebrafish induces alterations in regulatory landscapes and developmental gene expression. Nat Commun 12, 5415. 10.1038/s41467-021-25604-5. [DOI] [PMC free article] [PubMed] [Google Scholar]
- 43.Nora EP, Goloborodko A, Valton AL, Gibcus JH, Uebersohn A, Abdennur N, Dekker J, Mirny LA, and Bruneau BG (2017). Targeted Degradation of CTCF Decouples Local Insulation of Chromosome Domains from Genomic Compartmentalization. Cell 169, 930–944 e922. 10.1016/j.cell.2017.05.004. [DOI] [PMC free article] [PubMed] [Google Scholar]
- 44.Qi CF, Martensson A, Mattioli M, Dalla-Favera R, Lobanenkov VV, and Morse HC 3rd (2003). CTCF functions as a critical regulator of cell-cycle arrest and death after ligation of the B cell receptor on immature B cells. Proc Natl Acad Sci U S A 100, 633–638. 10.1073/pnas.0237127100. [DOI] [PMC free article] [PubMed] [Google Scholar]
- 45.Rubinstein MP, Lind NA, Purton JF, Filippou P, Best JA, McGhee PA, Surh CD, and Goldrath AW (2008). IL-7 and IL-15 differentially regulate CD8+ T-cell subsets during contraction of the immune response. Blood 112, 3704–3712. 10.1182/blood-2008-06-160945. [DOI] [PMC free article] [PubMed] [Google Scholar]
- 46.Milner JJ, Toma C, He Z, Kurd NS, Nguyen QP, McDonald B, Quezada L, Widjaja CE, Witherden DA, Crowl JT, et al. (2020). Heterogenous Populations of Tissue-Resident CD8(+) T Cells Are Generated in Response to Infection and Malignancy. Immunity 52, 808–824 e807. 10.1016/j.immuni.2020.04.007. [DOI] [PMC free article] [PubMed] [Google Scholar]
- 47.Gregor A, Oti M, Kouwenhoven EN, Hoyer J, Sticht H, Ekici AB, Kjaergaard S, Rauch A, Stunnenberg HG, Uebe S, et al. (2013). De novo mutations in the genome organizer CTCF cause intellectual disability. Am J Hum Genet 93, 124–131. 10.1016/j.ajhg.2013.05.007. [DOI] [PMC free article] [PubMed] [Google Scholar]
- 48.Konrad EDH, Nardini N, Caliebe A, Nagel I, Young D, Horvath G, Santoro SL, Shuss C, Ziegler A, Bonneau D, et al. (2019). CTCF variants in 39 individuals with a variable neurodevelopmental disorder broaden the mutational and clinical spectrum. Genet Med 21, 2723–2733. 10.1038/s41436-019-0585-z. [DOI] [PMC free article] [PubMed] [Google Scholar]
- 49.Essien K, Vigneau S, Apreleva S, Singh LN, Bartolomei MS, and Hannenhalli S. (2009). CTCF binding site classes exhibit distinct evolutionary, genomic, epigenomic and transcriptomic features. Genome Biol 10, R131. 10.1186/gb-2009-10-11-r131. [DOI] [PMC free article] [PubMed] [Google Scholar]
- 50.Zhao X, Shan Q, and Xue HH (2021). TCF1 in T cell immunity: a broadened frontier. Nat Rev Immunol. 10.1038/s41577-021-00563-6. [DOI] [PubMed] [Google Scholar]
- 51.Mackay LK, Minnich M, Kragten NA, Liao Y, Nota B, Seillet C, Zaid A, Man K, Preston S, Freestone D, et al. (2016). Hobit and Blimp1 instruct a universal transcriptional program of tissue residency in lymphocytes. Science 352, 459–463. 10.1126/science.aad2035. [DOI] [PubMed] [Google Scholar]
- 52.Luckey CJ, Bhattacharya D, Goldrath AW, Weissman IL, Benoist C, and Mathis D. (2006). Memory T and memory B cells share a transcriptional program of self-renewal with long-term hematopoietic stem cells. Proc Natl Acad Sci U S A 103, 3304–3309. 10.1073/pnas.0511137103. [DOI] [PMC free article] [PubMed] [Google Scholar]
- 53.Xu B, Wang H, Wright S, Hyle J, Zhang Y, Shao Y, Niu M, Fan Y, Rosikiewicz W, Djekidel MN, et al. (2021). Acute depletion of CTCF rewires genome-wide chromatin accessibility. Genome Biol 22, 244. 10.1186/s13059-021-02466-0. [DOI] [PMC free article] [PubMed] [Google Scholar]
- 54.Burrows K, Antignano F, Bramhall M, Chenery A, Scheer S, Korinek V, Underhill TM, and Zaph C. (2017). The transcriptional repressor HIC1 regulates intestinal immune homeostasis. Mucosal Immunol 10, 1518–1528. 10.1038/mi.2017.17. [DOI] [PubMed] [Google Scholar]
- 55.Crowl JT, Heeg M, Ferry A, Milner JJ, Omilusik KD, Toma C, He Z, T. CJ, and Goldrath AW (2022). Tissue-resident memory CD8+ T cells possess unique transcriptional, epigenetic and functional adaptations to different tissue environments. Nature Immunology in press. [DOI] [PMC free article] [PubMed] [Google Scholar]
- 56.Kallies A, and Good-Jacobson KL (2017). Transcription Factor T-bet Orchestrates Lineage Development and Function in the Immune System. Trends Immunol 38, 287–297. 10.1016/j.it.2017.02.003. [DOI] [PubMed] [Google Scholar]
- 57.Mackay LK, Wynne-Jones E, Freestone D, Pellicci DG, Mielke LA, Newman DM, Braun A, Masson F, Kallies A, Belz GT, and Carbone FR (2015). T-box Transcription Factors Combine with the Cytokines TGF-beta and IL-15 to Control Tissue-Resident Memory T Cell Fate. Immunity 43, 1101–1111. 10.1016/j.immuni.2015.11.008. [DOI] [PubMed] [Google Scholar]
- 58.Intlekofer AM, Takemoto N, Wherry EJ, Longworth SA, Northrup JT, Palanivel VR, Mullen AC, Gasink CR, Kaech SM, Miller JD, et al. (2005). Effector and memory CD8+ T cell fate coupled by T-bet and eomesodermin. Nat Immunol 6, 1236–1244. 10.1038/ni1268. [DOI] [PubMed] [Google Scholar]
- 59.Li J, He Y, Hao J, Ni L, and Dong C. (2018). High Levels of Eomes Promote Exhaustion of Anti-tumor CD8(+) T Cells. Front Immunol 9, 2981. 10.3389/fimmu.2018.02981. [DOI] [PMC free article] [PubMed] [Google Scholar]
- 60.Shan Q, Li X, Chen X, Zeng Z, Zhu S, Gai K, Peng W, and Xue HH (2021). Tcf1 and Lef1 provide constant supervision to mature CD8(+) T cell identity and function by organizing genomic architecture. Nat Commun 12, 5863. 10.1038/s41467-021-26159-1. [DOI] [PMC free article] [PubMed] [Google Scholar]
- 61.Zhou X, and Xue HH (2012). Cutting edge: generation of memory precursors and functional memory CD8+ T cells depends on T cell factor-1 and lymphoid enhancer-binding factor-1. J Immunol 189, 2722–2726. 10.4049/jimmunol.1201150. [DOI] [PMC free article] [PubMed] [Google Scholar]
- 62.Narni-Mancinelli E, Campisi L, Bassand D, Cazareth J, Gounon P, Glaichenhaus N, and Lauvau G. (2007). Memory CD8+ T cells mediate antibacterial immunity via CCL3 activation of TNF/ROI+ phagocytes. J Exp Med 204, 2075–2087. 10.1084/jem.20070204. [DOI] [PMC free article] [PubMed] [Google Scholar]
- 63.Seki A, and Rutz S. (2018). Optimized RNP transfection for highly efficient CRISPR/Cas9-mediated gene knockout in primary T cells. J Exp Med 215, 985–997. 10.1084/jem.20171626. [DOI] [PMC free article] [PubMed] [Google Scholar]
- 64.Hansen AS, Pustova I, Cattoglio C, Tjian R, and Darzacq X. (2017). CTCF and cohesin regulate chromatin loop stability with distinct dynamics. Elife 6. 10.7554/eLife.25776. [DOI] [PMC free article] [PubMed] [Google Scholar]
- 65.Liu J, Zhu S, Hu W, Zhao X, Shan Q, Peng W, and Xue HH (2023). CTCF mediates CD8+ effector differentiation through dynamic redistribution and genomic reorganization. J Exp Med 220 . 10.1084/jem.20221288. [DOI] [PMC free article] [PubMed] [Google Scholar]
- 66.Chen J, Yao ZX, Chen JS, Gi YJ, Munoz NM, Kundra S, Herlong HF, Jeong YS, Goltsov A, Ohshiro K, et al. (2016). TGF-beta/beta2-spectrin/CTCF-regulated tumor suppression in human stem cell disorder Beckwith-Wiedemann syndrome. J Clin Invest 126, 527–542. 10.1172/JCI80937. [DOI] [PMC free article] [PubMed] [Google Scholar]
- 67.Takayama N, Murison A, Takayanagi SI, Arlidge C, Zhou S, Garcia-Prat L, Chan-Seng-Yue M, Zandi S, Gan OI, Boutzen H, et al. (2021). The Transition from Quiescent to Activated States in Human Hematopoietic Stem Cells Is Governed by Dynamic 3D Genome Reorganization. Cell Stem Cell 28, 488–501 e410. 10.1016/j.stem.2020.11.001. [DOI] [PubMed] [Google Scholar]
- 68.Pace L, Goudot C, Zueva E, Gueguen P, Burgdorf N, Waterfall JJ, Quivy JP, Almouzni G, and Amigorena S. (2018). The epigenetic control of stemness in CD8(+) T cell fate commitment. Science 359, 177–186. 10.1126/science.aah6499. [DOI] [PubMed] [Google Scholar]
- 69.Henning AN, Klebanoff CA, and Restifo NP (2018). Silencing stemness in T cell differentiation. Science 359, 163–164. 10.1126/science.aar5541. [DOI] [PMC free article] [PubMed] [Google Scholar]
- 70.Ladle BH, Li KP, Phillips MJ, Pucsek AB, Haile A, Powell JD, Jaffee EM, Hildeman DA, and Gamper CJ (2016). De novo DNA methylation by DNA methyltransferase 3a controls early effector CD8+ T-cell fate decisions following activation. Proc Natl Acad Sci U S A 113, 10631–10636. 10.1073/pnas.1524490113. [DOI] [PMC free article] [PubMed] [Google Scholar]
- 71.Gray SM, Amezquita RA, Guan T, Kleinstein SH, and Kaech SM (2017). Polycomb Repressive Complex 2-Mediated Chromatin Repression Guides Effector CD8(+) T Cell Terminal Differentiation and Loss of Multipotency. Immunity 46, 596–608. 10.1016/j.immuni.2017.03.012. [DOI] [PMC free article] [PubMed] [Google Scholar]
- 72.Dehghani H. (2021). Regulation of Chromatin Organization in Cell Stemness: The Emerging Role of Long Non-coding RNAs. Stem Cell Rev Rep. 10.1007/s12015-021-10209-8. [DOI] [PubMed] [Google Scholar]
- 73.Shan Q, Hu SS, Zhu S, Chen X, Badovinac VP, Peng W, Zang C, and Xue HH (2022). Tcf1 preprograms the mobilization of glycolysis in central memory CD8(+) T cells during recall responses. Nat Immunol 23, 386–398. 10.1038/s41590-022-01131-3. [DOI] [PMC free article] [PubMed] [Google Scholar]
- 74.Beagan JA, Duong MT, Titus KR, Zhou L, Cao Z, Ma J, Lachanski CV, Gillis DR, and Phillips-Cremins JE (2017). YY1 and CTCF orchestrate a 3D chromatin looping switch during early neural lineage commitment. Genome Res 27, 1139–1152. 10.1101/gr.215160.116. [DOI] [PMC free article] [PubMed] [Google Scholar]
- 75.Donohoe ME, Zhang LF, Xu N, Shi Y, and Lee JT (2007). Identification of a Ctcf cofactor, Yy1, for the X chromosome binary switch. Mol Cell 25, 43–56. 10.1016/j.molcel.2006.11.017. [DOI] [PubMed] [Google Scholar]
- 76.Zlatanova J, and Caiafa P. (2009). CTCF and its protein partners: divide and rule? J Cell Sci 122, 1275–1284. 10.1242/jcs.039990. [DOI] [PubMed] [Google Scholar]
- 77.Kentepozidou E, Aitken SJ, Feig C, Stefflova K, Ibarra-Soria X, Odom DT, Roller M, and Flicek P. (2020). Clustered CTCF binding is an evolutionary mechanism to maintain topologically associating domains. Genome Biol 21, 5. 10.1186/s13059-019-1894-x. [DOI] [PMC free article] [PubMed] [Google Scholar]
- 78.Love MI, Huber W, and Anders S. (2014). Moderated estimation of fold change and dispersion for RNA-seq data with DESeq2. Genome Biol 15, 550. 10.1186/s13059-014-0550-8. [DOI] [PMC free article] [PubMed] [Google Scholar]
- 79.Chen R, Belanger S, Frederick MA, Li B, Johnston RJ, Xiao N, Liu YC, Sharma S, Peters B, Rao A, et al. (2014). In vivo RNA interference screens identify regulators of antiviral CD4(+) and CD8(+) T cell differentiation. Immunity 41, 325–338. 10.1016/j.immuni.2014.08.002. [DOI] [PMC free article] [PubMed] [Google Scholar]
- 80.Meers MP, Bryson TD, Henikoff JG, and Henikoff S. (2019). Improved CUT&RUN chromatin profiling tools. Elife 8. 10.7554/eLife.46314. [DOI] [PMC free article] [PubMed] [Google Scholar]
- 81.Reich M, Liefeld T, Gould J, Lerner J, Tamayo P, and Mesirov JP (2006). GenePattern 2.0. Nat Genet 38, 500–501. 10.1038/ng0506-500. [DOI] [PubMed] [Google Scholar]
- 82.Heinz S, Benner C, Spann N, Bertolino E, Lin YC, Laslo P, Cheng JX, Murre C, Singh H, and Glass CK (2010). Simple combinations of lineage-determining transcription factors prime cis-regulatory elements required for macrophage and B cell identities. Mol Cell 38, 576–589. 10.1016/j.molcel.2010.05.004. [DOI] [PMC free article] [PubMed] [Google Scholar]
- 83.Team RC (2021). R: A Language and Environment for Statistical Computing (R Foundation for Statistical Computing). [Google Scholar]
- 84.Ramirez F, Bhardwaj V, Arrigoni L, Lam KC, Gruning BA, Villaveces J, Habermann B, Akhtar A, and Manke T. (2018). High-resolution TADs reveal DNA sequences underlying genome organization in flies. Nat Commun 9, 189. 10.1038/s41467-017-02525-w. [DOI] [PMC free article] [PubMed] [Google Scholar]
- 85.Wolff J, Bhardwaj V, Nothjunge S, Richard G, Renschler G, Gilsbach R, Manke T, Backofen R, Ramirez F, and Gruning BA (2018). Galaxy HiCExplorer: a web server for reproducible Hi-C data analysis, quality control and visualization. Nucleic Acids Res 46, W11–W16. 10.1093/nar/gky504. [DOI] [PMC free article] [PubMed] [Google Scholar]
- 86.Wolff J, Rabbani L, Gilsbach R, Richard G, Manke T, Backofen R, and Gruning BA (2020). Galaxy HiCExplorer 3: a web server for reproducible Hi-C, capture Hi-C and single-cell Hi-C data analysis, quality control and visualization. Nucleic Acids Res 48, W177–W184. 10.1093/nar/gkaa220. [DOI] [PMC free article] [PubMed] [Google Scholar]
- 87.Stansfield JC, Cresswell KG, and Dozmorov MG (2019). multiHiCcompare: joint normalization and comparative analysis of complex Hi-C experiments. Bioinformatics 35, 2916–2923. 10.1093/bioinformatics/btz048. [DOI] [PMC free article] [PubMed] [Google Scholar]
- 88.Langmead B, and Salzberg SL (2012). Fast gapped-read alignment with Bowtie 2. Nat Methods 9, 357–359. 10.1038/nmeth.1923. [DOI] [PMC free article] [PubMed] [Google Scholar]
- 89.Quinlan AR (2014). BEDTools: The Swiss-Army Tool for Genome Feature Analysis. Curr Protoc Bioinformatics 47, 11 12 11–34. 10.1002/0471250953.bi1112s47. [DOI] [PMC free article] [PubMed] [Google Scholar]
- 90.Liao Y, Smyth GK, and Shi W. (2014). featureCounts: an efficient general purpose program for assigning sequence reads to genomic features. Bioinformatics 30, 923–930. 10.1093/bioinformatics/btt656. [DOI] [PubMed] [Google Scholar]
- 91.Thorvaldsdottir H, Robinson JT, and Mesirov JP (2013). Integrative Genomics Viewer (IGV): high-performance genomics data visualization and exploration. Brief Bioinform 14, 178–192. 10.1093/bib/bbs017. [DOI] [PMC free article] [PubMed] [Google Scholar]
- 92.Zhang Y, Liu T, Meyer CA, Eeckhoute J, Johnson DS, Bernstein BE, Nusbaum C, Myers RM, Brown M, Li W, and Liu XS (2008). Model-based analysis of ChIP-Seq (MACS). Genome Biol 9, R137. 10.1186/gb-2008-9-9-r137. [DOI] [PMC free article] [PubMed] [Google Scholar]
- 93.Zheng GX, Terry JM, Belgrader P, Ryvkin P, Bent ZW, Wilson R, Ziraldo SB, Wheeler TD, McDermott GP, Zhu J, et al. (2017). Massively parallel digital transcriptional profiling of single cells. Nat Commun 8, 14049. 10.1038/ncomms14049. [DOI] [PMC free article] [PubMed] [Google Scholar]
- 94.Stuart T, Butler A, Hoffman P, Hafemeister C, Papalexi E, Mauck WM 3rd, Hao Y, Stoeckius M, Smibert P, and Satija R. (2019). Comprehensive Integration of Single-Cell Data. Cell 177, 1888–1902 e1821. 10.1016/j.cell.2019.05.031. [DOI] [PMC free article] [PubMed] [Google Scholar]
- 95.van Dijk D, Sharma R, Nainys J, Yim K, Kathail P, Carr AJ, Burdziak C, Moon KR, Chaffer CL, Pattabiraman D, et al. (2018). Recovering Gene Interactions from Single-Cell Data Using Data Diffusion. Cell 174, 716–729 e727. 10.1016/j.cell.2018.05.061. [DOI] [PMC free article] [PubMed] [Google Scholar]
- 96.Consortium EP (2012). An integrated encyclopedia of DNA elements in the human genome. Nature 489, 57–74. 10.1038/nature11247. [DOI] [PMC free article] [PubMed] [Google Scholar]
- 97.Durand NC, Shamim MS, Machol I, Rao SS, Huntley MH, Lander ES, and Aiden EL (2016). Juicer Provides a One-Click System for Analyzing Loop-Resolution Hi-C Experiments. Cell Syst 3, 95–98. 10.1016/j.cels.2016.07.002. [DOI] [PMC free article] [PubMed] [Google Scholar]
- 98.Zhou Y, Zhou B, Pache L, Chang M, Khodabakhshi AH, Tanaseichuk O, Benner C, and Chanda SK (2019). Metascape provides a biologist-oriented resource for the analysis of systems-level datasets. Nat Commun 10, 1523. 10.1038/s41467-019-09234-6. [DOI] [PMC free article] [PubMed] [Google Scholar]
- 99.Hainer SJ, and Fazzio TG (2019). High-Resolution Chromatin Profiling Using CUT&RUN. Curr Protoc Mol Biol 126, e85. 10.1002/cpmb.85. [DOI] [PMC free article] [PubMed] [Google Scholar]
- 100.Liu N, Hargreaves VV, Zhu Q, Kurland JV, Hong J, Kim W, Sher F, Macias-Trevino C, Rogers JM, Kurita R, et al. (2018). Direct Promoter Repression by BCL11A Controls the Fetal to Adult Hemoglobin Switch. Cell 173, 430–442 e417. 10.1016/j.cell.2018.03.016. [DOI] [PMC free article] [PubMed] [Google Scholar]
- 101.Liu N. (2019). Library Prep for CUT&RUN with NEBNext® Ultra™ II DNA Library Prep Kit for Illumina® (E7645). . [Google Scholar]
- 102.Jalili V, Matteucci M, Masseroli M, and Morelli MJ (2018). Using combined evidence from replicates to evaluate ChIP-seq peaks. Bioinformatics 34, 2338. 10.1093/bioinformatics/bty119. [DOI] [PubMed] [Google Scholar]
- 103.Corces MR, Trevino AE, Hamilton EG, Greenside PG, Sinnott-Armstrong NA, Vesuna S, Satpathy AT, Rubin AJ, Montine KS, Wu B, et al. (2017). An improved ATAC-seq protocol reduces background and enables interrogation of frozen tissues. Nat Methods 14, 959–962. 10.1038/nmeth.4396. [DOI] [PMC free article] [PubMed] [Google Scholar]
- 104.Brinkman EK, Chen T, Amendola M, and van Steensel B. (2014). Easy quantitative assessment of genome editing by sequence trace decomposition. Nucleic Acids Res 42, e168. 10.1093/nar/gku936. [DOI] [PMC free article] [PubMed] [Google Scholar]
Associated Data
This section collects any data citations, data availability statements, or supplementary materials included in this article.
Supplementary Materials
Supplemental table 1 related to figure 1. Hi-C library information.
Supplemental table 2 related to figure 1. Differential interactions between CD8+ T cell subsets.
Supplemental table 3 related to figure 1, 2, and 5. Chromosomal coordinates of CD8+ T cell subset specific gene lists.
Supplemental table 4 related to figure 3. RNAi screen results.
Supplemental table 5 related to figure 3. shRNA sequences for RNAi screen.
Data Availability Statement
All Hi-C, bulk RNA-Seq, ATAC-Seq, ChIP-Seq, and Cut&Run datasets are available for download on the GEO data repository and are publicly available as of the date of publication. Accession numbers are listed in the Key Resources Table. This paper analyzes existing, publicly available data. Accession numbers are listed in the key resources table.
This paper does not report original code
Any additional information required to reanalyze the data reported in this paper is available from the lead contact upon request.
KEY RESOURCE TABLE
| REAGENT or RESOURCE | SOURCE | IDENTIFIER |
|---|---|---|
| Antibodies | ||
| Anti-CTCF | Millipore Sigma | Cat#07–729 |
| Goat anti-hamster IgG (H+L) Secondary Antibody | Thermo Fisher Scientific | Cat# 31115 RRID: AB_228247 |
| Cd3e Armenian Hamster anti Mouse (145 2C11) | eBioscience | Cat# 16–0031-82 RRID: AB_468847 |
| Cd28 Golden Syrian Hamster anti Mouse (37.51) | eBioscience | Cat# 16–0281-86 RRID: AB_468921 |
| Biotin anti-B220 (RA3–6B2) | BioLegend | Cat# 103204, RRID:AB_312989 |
| Biotin anti-MHCII (M5/114.15.2) | Thermo Fisher Scientific | Cat# 13–5321-82, RRID:AB_466662 |
| Biotin anti-CD4 (GK1.5) | BioLegend | Cat# 100404, RRID:AB_312689 |
| Biotin anti-CDNK1.1 (PK136) | Thermo Fisher Scientific | Cat#13–5941-85, RRID: AB_466805 |
| Biotin anti-Ter-199 (TER-119) | BioLegend | Cat# 116204, RRID:AB_313705 |
| Biotin anti-GR-1 (RB6–8C5) | BioLegend | Cat# 108404, RRID:AB_313369 |
| APC-eFluor 780 anti-CD45.1 (A20) | Invitrogen | Cat#:47–0453-83 RRID:AB_1582228 |
| Efluor 450 anti-CD45.1 (A20) | Invitrogen | Cat#:48–0453-82 RRID:AB_1272189 |
| FITC anti-CD45.1 (A20) | Invitrogen | Cat#:11–0453-85 RRID: AB_465059 |
| PerCP-Cyanine5.5 anti-CD45.1 (A20) | Invitrogen | Cat#: 45–0453-82 RRID: AB_1107003 |
| APC-Cyanine7 anti-CD45.2 (104) | Biolegend | Cat#109823 RRID:AB_830788 |
| eFluor 450 anti-CD45.2 (104) | Invitrogen | Cat#48–0454-82 RRID:AB_11042125 |
| FITC anti-CD45.2 (104) | Invitrogen | Cat#11–0454-85 RRID: AB_465061 |
| PE-Cyanine7 anti-CD45.2 (104) | Invitrogen | Cat#25–0454-82 RRID: AB_2573350 |
| APC anti-KLRG1 (2F1) | Invitrogen | Cat#17–5893-82 RRID:AB_469469 |
| APC-eFluor780 anti-CD8 (53–6.7) | Invitrogen | Cat#47–0081-82 RRID: AB_1272185 |
| Brilliant Violet 510 anti-CD8a (53–6.7) | BioLegend | Cat#100752 RRID: AB_2563057 |
| Brilliant Violet 711 anti-CD8a (53–6.7) | BioLegend | Cat#100748 RRID: AB_2562100 |
| Pacific Blue anti-CD8a (53–6.7) | BioLegend | Cat#100725 RRID: AB_493425 |
| APC anti-TNF alpha (MP6-XT22) | Invitrogen | Cat#17–7321-82 RRID: AB_469508 |
| APC anti-IFNγ (XMG1.2) | BioLegend | Cat#505810 RRID: AB_315404 |
| PE anti-IFN gamma (XMG1.2) | eBioscience | Cat#12–7311-81 RRID: AB_466193 |
| PE anti-IL2 (JES6–5H4) | eBioscience | Cat#12–7021-82 RRID: AB_466150 |
| PE-Cyanine7 anti-CD127 (A7R34) | Invitrogen | Cat#25–1271-82 RRID: AB_469649 |
| eFluor 450 anti-Ki-67 (SolA15) | Invitrogen | Cat#48–5698-82 RRID:AB_11149124 |
| APC anti-BrdU | BD Pharmingen | Cat#51–23619L RRID:AB_2861367 |
| PE anti-Tbet (4B10) | BioLegend | Cat#644809 RRID: AB_2028583 |
| APC anti-CD62L (MEL-14) | BioLegend | Cat#104412 RRID: AB_313099 |
| Percp-Cyanine5.5 anti-CD69 (H1.2F3) | eBiosience | Cat#45–0691-80 RRID: AB_1210703 |
| PE anti-CD103 (2E7) | Invitrogen | Cat#12–1031-82 RRID: AB_465799 |
| APC anti-CD90.2 (53–2.1) | Invitrogen | Cat#12–0902-82 RRID: AB_465776 |
| Alex Fluor 647 anti-CD90.1 (OX7) | Biolegend | Cat#202508 RRID: AB_492884 |
| PE anti-Ccl3 (MIP-1 alpha) | R&D Systems | Cat#IC450P |
| PE anti-Bcl6 (K112–91) | BD Pharmingen | Cat#561522 RRID:AB_10717126 |
| β-actin | Cell Signaling Technology | Cat# 3700S RRID:AB_2242334 |
| Goat anti-mouse HRP | Santa Cruz Biotechnology | Cat# sc2005 RRID:AB_631736 |
| Goat anti-rabbit HRP | Santa Cruz Biotechnology | Cat# sc2004 RRID:AB_631746 |
| Bacterial and virus strains | ||
| Lymphocytic choriomeningitis virus-Armstrong strain | Milner et al.(34) | N/A |
| Listeria monocytogenes-GP33 | Milner et al.(34) | NA |
| Vesicular stomatitis virus-OVA | Rubinstein et al.(45) | NA |
| Chemicals, peptides, and recombinant proteins | ||
| Collagenase Type I | Worthington Biochemicals | Cat#LS004197 |
| Dithioerythritol | EMD Millipore | Cat#233152 |
| Percoll | Sigma | Cat#P1644 |
| Protein Transport Inhibitor Cocktail | eBioscience | Cat#00–4980-93 |
| H-2Db-restricted peptide GP33–41 | Anaspec | Cat#AS-61296 |
| MACS Streptavidin MicroBeads | Miltenyi Biotec | Cat#130–048-101 |
| DMEM | GIBCO | Cat#11965–092 |
| RPMI 1640 | Corning | Cat310–040-CV |
| 2-Mercaptoethanol | GIBCO | Cat321985–023 |
| HEPES | GIBCO | Cat#15630–080 |
| H-2Kb-restricted OVA257–264 | Invivogen | Cat#vac-sin |
| Hank’s Balanced Salt Solution | Corning | Cat# 20–021-CV |
| Sodium Azide | Sigma | Cat#S8032–100G |
| Opti-MEM | Thermo Fisher Scientific | Cat# 31985070 |
| Polybrene | Thermo Fisher Scientific | Cat#TR1003G |
| Trizol | Ambion | Cat15596026 |
| Isopropanol | Acros Organics | Cat#327270010 |
| Chloroform | Fisher Scientific | Cat#BP1145–1 |
| AMPure XP beads | Beckman Coulter | Cat#A63880 |
| Brilliant II Sybr Green | Agilent Technologies | Cat#600828 |
| Phenol-Chloroform | Invitrogen | Cat#15593049 |
| DPBS | Gibco | Cat#14190250 |
| Concanavalin A beads | Bangs Laboratories | Cat#BP531 |
| CaCl2 | Fisher Scientific | Cat# BP510–500 |
| RNase A | Qiagen | Cat#19101 |
| Glycogen | Millipore Sigma | Cat#10901393001 |
| SDS | Fisher Scientific | Cat#BP166–100 |
| Proteinase K | Fisher Scientific | Cat#BP1700–50 |
| Ethanol | Sigma-Aldrich | Cat#E7023–500ML |
| Maxtract High-density tubes | Qiagen | Cat#129046 |
| KCl | Sigma-Aldrich | Cat#P3911–25G |
| Spermidine | Sigma-Aldrich | Cat#S2501–5G |
| PEG 8000 | Sigma-Aldrich | Cat#202452–500G |
| NaCl | Thermo Fisher Scientific | Cat# S271–500 |
| EDTA | Thermo Fisher Scientific | Cat#17892 |
| EGTA | Sigma Aldrich | Cat#E3889 |
| Triton X-100 | Sigma Aldrich | Cat#X100–5ML |
| cOmplete™, EDTA-free Protease Inhibitor Cocktail | Millipore Sigma | Cat#5056489001 |
| Formaldehyde | Sigma-Aldrich | Cat# FP8775 |
| Glycine | Thermo Fisher Scientific | Cat# BP381–5 |
| Agarose | Thermo Fisher Scientific | Cat# BP1356–500 |
| Benzamidine | Sigma-Aldrich | Cat#B6506–5G |
| Proteinase Inhibitor Cocktail | Calbiochem | Cat#539137–10VL |
| Dynabeads Protein G | Invitrogen | Cat#10003D |
| Tris base | Thermo Fisher Scientific | Cat# BP152–5 |
| NP-40 | Sigma-Aldrich | Cat# 11332473001 |
| NaDOC | Sigma-Aldrich | Cat# D6750–25G |
| Ultrapure Water | Fisher Scientific | Cat# 10–977-015 |
| Quick Ligation Kit | New England Bioscience | Cat# M2200S |
| Quick Ligase | New England Bioscience | Cat#E7337A |
| Nanosep MF Filter Tube | VWR | Cat#29300–642 |
| Sybr Gold | Invitrogen | Cat#S11494 |
| 40% Polyacrylamide | Biorad | Cat# 161–0146 |
| Ammonium Persulfate | VWR | Cat# EM-2300 |
| TEMED | VWR | Cat# PAV3161 |
| 6x loading dye | Thermo Fisher Scientific | Cat# R0631 |
| NaOAC | Thermo Fisher Scientific | Cat# S25531 |
| Glycoblue | Invitrogen | Cat# AM9515 |
| NEBNext High Fidelity 2X PCR Master Mix | New England Bioscience | Cat# M0541L |
| MboI-HF enzyme | New England Bioscience | Cat#R0147 |
| Biotin-14-dATP | Life Technologies | Cat#19523–016 |
| DNA Polymerase (Klenow) | New England Bioscience | Cat#M0210 |
| 10x NEB buffer | New England Bioscience | Cat#B0202 |
| T4 DNA Ligase | New England Bioscience | Cat#M0202 |
| Dynabeads Streptavidin | Life Technologies | Cat#65602 |
| Klenow exo minus | New England Bioscience | Cat#M0212 |
| NEBNext Ultra II Q5 Master Mix | New England Bioscience | Cat#M0544S |
| Critical commercial assays | ||
| BD Cytofix/Cytoperm solution Kit | BD Biosciences | Cat#554714 |
| Foxp3/Transcription Factor Staining Buffer Set | eBiosciences | Cat#00–5523-00 |
| TransIT-LT1 Transfection Reagent | Mirus | Cat#MIR 2300 |
| LS Columns | Miltenyi Biotec | Cat#130–042 |
| APC BrdU Kit | BD Biosciences | Cat#557892 RRID:AB_2861367 |
| FlexiGene Kit | Qiagen | Cat#51206 |
| Superscript II | Thermo Fisher Scientific | Cat#18–064-014 |
| Zymo DNA Clean&Concentrator | Zymo Research | Cat#D4030 |
| End-it DNA End-repair Kit | Lucigen | Cat#ER81050 |
| NEB Library Index | New England Biosciences | Cat#E7600S |
| Qubit dsDNA HS Assay | Thermo Fisher Scientific | Cat#Q32851 |
| Deposited data | ||
| CD8+ T cell histone modifications ChIP | Yu et al. (14) | GSE89036 |
| Patient RNA Seq | Gregor et al.(47); Konrad et al.(48) | GSE46833 |
| Tbet ChIP-Seq | Dominguez et al.(41) | PRJNA287664 |
| Hi-C Sequencing | This paper | GSE205081 |
| Naive and Memory Hi-C Sequencing | Russ et al.(32) | GSE225885 |
| CTCF knockdown RNA Sequencing | This paper | GSE205079 |
| CTCF ChIP-Seq | This paper | GSE205077 |
| Input ChIP-Seq | Yu et al.14 | GSE89036 |
| CTCF Cut&Run | This paper | GSE205077 |
| CTCF knockdown Cut&Run | This paper | GSE205077 |
| CTCF knockdown ATAC | This paper | GSE205076 |
| Experimental models: Cell lines | ||
| B16-GP33–41 | Dr. A. Lamarre, INRS-institut Armand-Frappier | N/A |
| PLAT-E | Cell Biolabs | Cat#RV-101; RRID: CCL_B488 |
| Experimental models: Organisms/strains | ||
| P14 (B6.Cg-Tcratm1MomTg(TcrLCMV)327Sdz/TacMmjax) | The Jackson Laboratory | Cat#037394-JAX; RRID: MMRRC_037394-JAX |
| OT-1 (C57BL/6-Tg(TcraTcrb)1100Mjb/J | The Jackson Laboratory | Cat#003831; RRID: IMRS_JAX:003831 |
| CD45.2 (C57BL/6J) | The Jackson Laboratory | Cat#000664; RRID: IMSR_JAX:000664 |
| CD45.1 (B6.SJL-PtprcaPepcb/BoyJ) | The Jackson Laboratory | Cat#002014; RRID: IMSR_JAX:002014 |
| CD45.1.2 | Bred in-house | NA |
| Oligonucleotides | ||
| CTCF- forward for qPCR: 5’-AGTGAAAATGCTGAGCCGGA-3’ | IDT | NA |
| CTCF-reverse for qPCR: 5’-ATGATGGCTGTTGGCTGGTT-3’ | IDT | NA |
| Hprt-forward for qPCR: 5’-GGCCAGACTTTGTTGGATTT-3’ | IDT | NA |
| Hprt-reverse for qPCR: 5’-CAACTTGCGCTCATCT-3’. | IDT | NA |
| Gapdh-forward for qPCR:5’-AGGTCGGTGTGAACGGATTTG-3’ | IDT | NA |
| Gapdh-reverse for qPCR: 5’-TGTAGACCATGTAGTTGAGGTCA-3’ | IDT | NA |
| CD4 crRNA: 5’- CGGGTACCAGCCTGTTGCAA −3’ |
IDT | NA |
| Thy crRNA: 5’ CGTGTGCTCGGGTATCCCAA −3’ |
IDT | NA |
| Il7r crRNA: 5’-TCCTCCCTGGTTCCCTCCTG-3’ | IDT | NA |
| Ccl3 crRNA: 5’-CGATCCTGTTGGCCACCACG-3’ | IDT | NA |
| Bcl6 crRNA: 5’-ACACTTGCCCAGACACTAGA-3’ | IDT | NA |
| Recombinant DNA | ||
| shCTCF1: TGCTGTTGACAGTGAGCGCCCAGATGAAGACTGAAGTCATTAGTGAAGCCACAGATGTAATGACTTCAGTCTTCATCTGGATGCCTACTGCCTCGGA | Designed in-house | NA |
| shCTCF2: TGCTGTTGACAGTGAGCGAGCAGAGCATTCAGAACAGTGATAGTGAAGCCACAGATGTATCACTGTTCTGAATGCTCTGCCTGCCTACTGCCTCGGA | Designed in-house | NA |
| Screen shRNA (See Table) | Chen et al.(79) | NA |
| pAG-MNase | Meers et al.(80) | RRID:Addgene_123461 |
| Software and algorithms | ||
| FlowJo v10 | Treestar Inc | RRID:SCR_008520 |
| Prism 9 | Graphpad Inc | RRID: SCR_002798 |
| Gene Pattern | Reich et al.(81) | RRID: SCR_003201 |
| GSEA v4.2.2 | Broad Institute | RRID: SCR_003199 |
| HOMER v4.11 | Heinz et al.(82) | RRID: SCR_010881 |
| R v4.1.2 | Team(83) | RRID: SCR_01905 |
| HiCExplorer v3.6 | Ramirez et al.(84); Wolff et al.(85;)Wolff et al.(86) | RRID:SCR_022111 |
| multiHicCompare v1.3.2 | Stansfield et al.(87) | RRID:SCR_022368 |
| Bowtie2 v2.2.6 | Langmead and Salzberg(88) | RRID:SCR_016368 |
| DESeq2 v1.34.0 | Love et al.(79) | RRID:SCR_015687 |
| Bedtools v.2.29.2 | Quinlan(89) | RRID:SCR_006646 |
| featureCounts v2.0.1 | Liao et al.(90) | RRID:SCR_012919 |
| Integrative Genomics Viewer v2.10.0 | Thorvadsdottir et al.(91) | RRID:SCR_011793 |
| MACS2 v2.2.6 | Zhang et al.(92) | RRID:SCR_013291 |
| 10x Genomics Cell Ranger v4.0.0 | Zheng et al.(93) | RRID:SCR_017344 |
| Seurat v3.1.1 | Stuart et al.(94) | RRID:SCR_007322 |
| MAGIC-Impute v3.0.0 | Van Dijk et al.(95) | RRID: SCR_022369 |
| Encode ATAC-Seq Pipeline v2.1.3 | Consortium(96) | RRID:SCR_023100 |
| Encode ChIP-Seq Pipeline v2.1.5 | Consortium(96) | RRID:SCR_021323 |
| Juicer v1.6 | Durand et al.(97) | RRID:SCR_017226 |