Abstract
Glyphosate, the most heavily used herbicide world-wide, is applied to plants in complex formulations that promote absorption. The National Toxicology Program reported in 1992 that glyphosate, administered to rats and mice at doses up to 50,000 ppm in feed for 13 weeks, showed little evidence of toxicity, and no induction of micronuclei was observed in the mice in this study. Subsequently, mechanistic studies of glyphosate and glyphosate-based formulations (GBFs) that have focused on DNA damage and oxidative stress suggest that glyphosate may have genotoxic potential. However, few of these studies directly compared glyphosate to GBFs, or effects among GBFs. To address these data gaps, we tested glyphosate, glyphosate isopropylamine (IPA), and (aminomethyl)phosphonic acid (AMPA, a microbial metabolite of glyphosate), 9 high-use agricultural GBFs, 4 residential-use GBFs, and additional herbicides (metolachlor, mesotrione, and diquat dibromide) present in some of the GBFs in bacterial mutagenicity tests, and in human TK6 cells using a micronucleus assay and a multiplexed DNA damage assay. Our results showed no genotoxicity or notable cytotoxicity for glyphosate or AMPA at concentrations up to 10 mM, while all GBFs and herbicides other than glyphosate were cytotoxic, and some showed genotoxic activity. An in vitro to in vivo extrapolation of results for glyphosate suggest that it is of low toxicological concern for humans. In conclusion, these results demonstrate a lack of genotoxicity for glyphosate, consistent with observations in the NTP in vivo study, and suggest that toxicity associated with GBFs may be related to other components of these formulations.
Keywords: Micronucleus, bacterial mutagenicity assay, diquat dibromide, mesotrione, metolachlor
1 |. INTRODUCTION
N-(phosphonomethyl) glycine, known as glyphosate, was registered for use as an herbicide by the U.S. Environmental Protection Agency (USEPA) in 1974 (USEPA, 2019). Glyphosate acts as a non-selective herbicide by inhibiting enolpyruvyl shikimate-3-phosphate (EPSP) synthase. EPSP is a component of the shikimate metabolic pathway, which is required for the de novo synthesis of aromatic amino acids. This pathway is present only in plants and in some unicellular organisms (Bentley, 1990; Pollegioni et al., 2011; Richards et al., 2006; Schönbrunn et al., 2001). Glyphosate is applied to plants as a formulation with other substances, primarily surfactants and detergents, to promote adherence and absorption. According to the USEPA, herbicides such as glyphosate are considered to be the “active ingredients” of formulations whereas other components are classified as “inert ingredients” (USEPA, 2021). Over the past 30 years, use of glyphosate has risen dramatically due to development of staple crops that have been genetically modified for resistance to glyphosate, and it has become the most heavily used herbicide in the United States and throughout the world (Benbrook, 2016).
In 1981, glyphosate was nominated for study at the National Toxicology Program (NTP) by the California Regional Water Quality Control Board North Coast Region due to detection of glyphosate in water runoff. The NTP proceeded with the nomination due to the expanding use of glyphosate, the potential for human exposure, and a lack of publicly available reports with comprehensive toxicity data, or evaluation of carcinogenicity. To evaluate the potential toxicological effects of glyphosate, the NTP conducted 13-week studies in which male and female F344/N rats and B6C3F1 mice were exposed to glyphosate through feed (Chan & Mahler, 1992). In these studies, rats and mice were provided with feed containing 3125, 6250, 12500, 25000, or 50000 ppm glyphosate technical grade (CASRN 1071–83-6). It was estimated that consumption of feed containing 50,000 ppm glyphosate resulted in exposure to 3,400 mg/kg/day glyphosate for male and female rats and exposure to 10,800 or 12,000 mg/kg/day glyphosate for male and female mice, respectively. Despite ingestion of high amounts of glyphosate, there were no gross lesions in rats or mice at necropsy. Of the few adverse effects that were reported, cytoplasmic alterations in the salivary glands of rats and mice were observed. Additionally, increases in indicators of toxicity to the hepatobiliary system were observed in rats exposed to the higher doses used in the study. ADME studies using radiolabeled glyphosate in rats indicated low absorption and rapid elimination, and pre-treatment with a glyphosate-based formulation (GBF) did not influence elimination of orally administered, radiolabeled glyphosate. Regarding genetic toxicity testing, glyphosate was negative in the peripheral blood erythrocyte micronucleus assay in male and female mice in the 13-week studies, and it was not mutagenic in Salmonella typhimurium tester strains TA100, TA1535, TA97, or TA98 in the absence or presence of induced rat or hamster liver S9. Based on the findings of the 13-week feeding study, the NTP did not pursue the study of glyphosate in the 2-year rodent cancer bioassay.
In accordance with the Federal Insecticide, Fungicide, and Rodenticide Act (FIFRA), which regulates the distribution, sale, and use of pesticides in the US, the USEPA completed a Reregistration Eligibility Decision for glyphosate in 1993 and an Interim Registration Review Decision for glyphosate in 2020 (USEPA, 1993; USEPA, 2020). In these documents, the agency concluded that glyphosate is not likely to be carcinogenic to humans. The European Food Safety Authority (EFSA) came to the same conclusion when it reviewed glyphosate in 2015 (EFSA, 2015a). The Food and Agricultural Organization/World Health Organization, Health Canada, and other agencies, as summarized in the Agency for Toxic Substances and Disease Registry (ATSDR) document for glyphosate, have also concluded that glyphosate is unlikely to pose a cancer risk to humans (ATSDR, 2020). However, the International Agency for Research on Cancer (IARC) characterized glyphosate as a “probable human cancer risk (Group 2A)” in 2015 (Guyton et al., 2015). The decision by IARC to characterize glyphosate as a Group 2A hazard was based primarily on limited evidence in humans, and sufficient evidence in experimental animals, for the carcinogenicity of glyphosate (IARC, 2017). The IARC working group also concluded, based on publicly available literature, that there was strong evidence for the genotoxicity of glyphosate and that it induced oxidative stress, which are two key characteristics of carcinogens (Smith et al., 2016). IARC included GBFs in its evaluation of glyphosate and reported that exposure to GBFs tended to be more toxic than exposure to glyphosate alone. Additionally, the working group concluded that there was moderate evidence for the genotoxicity of (aminomethyl)phosphonic acid (AMPA), the major microbial metabolite of glyphosate. AMPA has been detected in the environment and in human urine, and some studies indicate that the mammalian microbiome metabolizes glyphosate to AMPA (ATSDR, 2020; IARC, 2017). Otherwise, glyphosate does not appear to undergo metabolism in mammals, has low oral absorption, it does not bioaccumulate, and it is rapidly excreted (ATSDR, 2020; USEPA, 2017).
Due to different interpretations of studies on the potential health risks of glyphosate exposure, major public concern about exposure risks, and reported differences in the toxicity of glyphosate versus GBFs, the Division of Translational Toxicology (DTT) used an in vitro screening approach to investigate the potential genotoxic effects of glyphosate, glyphosate isopropylamine (IPA) (a salt form of glyphosate typically used in formulations), AMPA, and several GBFs. Due to variation in the composition of GBFs, the DTT selected representative formulations for evaluation based on the percentage of glyphosate (ranging from 1.92% to 53.8%) as well as whether GBFs were used for agricultural or residential purposes. The DTT also tested other herbicides that were listed on the labels of some of the selected GBFs, namely diquat dibromide, metolachlor, and mesotrione. An in vitro approach was adopted to evaluate this large number of test articles and to gain insight into mode-of-action (MoA). Chromosomal damage was evaluated in human B-lymphoblastoid TK6 cells using the MultiFlow DNA Damage Assay, which uses a multiplexed biomarker system to identify whether genotoxicants exhibit signatures of clastogenic or aneugenic activity, and an assay for detection of micronuclei (MN), which can arise from chromosome breaks or changes in chromosome number. A third in vitro assay, the bacterial reverse mutation (Ames) assay, was used to assess test articles for the potential to induce gene mutations. Lastly, an in vitro to in vivo extrapolation (IVIVE) was conducted to relate the top concentration of glyphosate tested in TK6 cells to estimates of human exposure.
2 |. MATERIALS AND METHODS
2.1 |. Test articles
Chemicals (Table 1) were procured via MRIGlobal (Kansas City, MO), which also confirmed the identity of the chemicals using quantitative nuclear magnetic resonance (glyphosate acid, glyphosate IPA, AMPA, diquat dibromide monohydrate) or high-performance liquid chromatography (HPLC)/ultraviolet-mass spectroscopy (UV-MS) (mesotrione, metolachlor). Chemicals were shipped from MRIGlobal to ILS (Research Triangle Park, NC) for testing. Chemical structures in Table 1 were obtained from PubChem (https://pubchem.ncbi.nlm.nih.gov). Agricultural- and residential-use GBFs (Table 2) were procured by the NIEHS Mechanistic Toxicology Branch. All test articles were handled and stored in accordance with their MSDS and/or provided literature. Aside from the process of making stock solutions, test article names were not used, and instead, were coded with internal ID numbers for all experiments.
TABLE 1.
Chemicals
| Chemical name | Structure | CASRN | Manufacturer | Lot # | CoA Purity (%) |
|---|---|---|---|---|---|
|
| |||||
| Glyphosate acid technical |

|
1071-83-6 | Albaugh, LLC | 2016080705 | 95.18 |
| Glyphosate isopropylamine salt |
|
38641-94-0 | Chem Service, Inc. | 7429000 | 93.2a |
| (Aminomethyl)phosphonic acid |
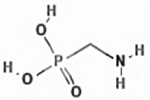
|
1066-51-9 | TCI America | PIB8L | 99.8 |
| Diquat dibromide monohydrate |
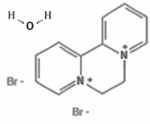
|
6385-62-2 | Chem Service, Inc. | 7419600 | 99.5 |
| Mesotrione |
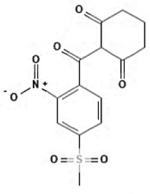
|
104206-82-8 | Toronto Research Chemicals | 5-CGS-113-1 | 98.0 |
| Metolachlor |
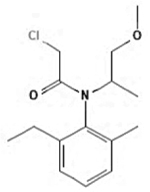
|
51218-45-2 | Toronto Research Chemicals | 1-BJM-60-1 | 98.0 |
Certificate of Analysis: chromatographic purity 98.5% minus water content of 5.3%.
TABLE 2.
Glyphosate-based formulations
| GBF | EPA registry # | Source | Lot number | Glyphosate (%) | Form | cGlyphosate (M) |
|---|---|---|---|---|---|---|
|
| ||||||
| Agricultural Use | ||||||
| Buccaneer® Plus | 55467-9 | Tenkoz, Inc. | NA | 41.0 | Isopropylamine salt | 2.11 |
| Cornerstone® Plus | 1381-192 | Winfield Solutions, LLC | NA | 41.0 | Isopropylamine salt | 2.11 |
| Durango DMA | 62719-556 | Dow AgroSciences | D516G54007 | 50.2 | Dimethylamine salt | 2.84 |
| GlyStar® Plus | 42750-61 | Albaugh, LLC | 60602253 | 41.0 | Isopropylamine salt | 2.11 |
| aHalex® GT | 100-1282 | Syngenta, USA | GBL6A30 | 20.5 | Free acid | 1.48 |
| Roundup Custom® | 524-343 | Monsanto Company | MNR01001AJ | 53.8 | Isopropylamine salt | 2.84 |
| Roundup PowerMAX® | 524-549 | Monsanto Company | MGZT0717AJ | 48.7 | Potassium salt | 3.19 |
| Roundup WeatherMAX® | 524-537 | Monsanto Company | MNKF0319AJ | 48.8 | Potassium salt | 3.19 |
| Touchdown Total® | 100-1169 | Syngenta, USA | GBL4C02 | 44.9 | Potassium salt | 2.96 |
| Residential Use | ||||||
| bRoundup® Weed & Grass Killer Concentrate Plus | 71995-29 | Monsanto Company | I14258/FI/1/5 | 18.0 | Isopropylamine salt | 0.84 |
| Roundup® Weed & Grass Killer Super Concentrate | 71995-25 | Monsanto Company | M16041/PM/2/2 | 50.2 | Isopropylamine salt | 2.55 |
| Hi-Yield® KILLZALL™ II | 42750-66-7401 | Voluntary Purchasing Groups, Inc. | NA | 1.92 | Isopropylamine salt | 0.08 |
| Remuda® Full Strength | 228-366-54705 | Monterey Lawn and Garden Products | 14US0001 | 41.0 | Isopropylamine salt | 2.11 |
Contains two additional herbicides: 20.5% S-metolachlor and 2.05% mesotrione.
Contains one additional herbicide: 0.73% diquat dibromide monohydrate.
Calculated based on the free acid form of glyphosate.
To make stock solutions, all chemicals were weighed to the nearest 0.1 mg and dissolved in distilled water, except for metolachlor, which was dissolved in dimethyl sulfoxide (DMSO) (Sigma-Aldrich, St. Louis, MO). Dosing solutions were prepared fresh each day of use at concentrations such that the final vehicle volume in the treated cultures was 10% (water vehicle) or 1% (DMSO vehicle). Dosing solutions were also pH-adjusted to 7.0–7.6 using 2.5 N sodium hydroxide (NaOH). Serial dilution was used to prepare the remaining dosing solutions for each assay.
GBFs were mixed in their containers by gentle inversion at least 10 times and samples were drawn from the center of the volume of the container using a serological pipette. Samples were diluted with sterile water, the pH of each solution was adjusted to 7.0–7.6 using 2.5 N NaOH, and this first dilution was adjusted to 1:10. Serial dilutions of the GBFs (1:2 for Ames assays; 1:1.22 to 1:1.41 for the Cleaved PARP Kit, MultiFlow DNA Damage Assay, and the in vitro micronucleus assay) were prepared using sterile water.
2.2 |. Bacterial mutagenicity assays
Using a testing strategy based on OECD Test Guideline 471 (OECD, 1997), test articles were evaluated for mutagenicity in Salmonella typhimurium tester strains TA100, TA1535, TA97a, TA98, and Escherichia coli WP2 uvrA pKM101 with or without 10% phenobarbital/benzoflavone-induced male Sprague Dawley rat liver S9 and co-factors (S9 mix) (Moltox, Boone, NC). After conducting dose-range finding studies, test articles were tested in triplicate using a preincubation protocol (Mortelmans & Zeiger, 2000; Zeiger et al., 1992). The number of revertant colonies was counted using the Sorcerer plate counter and Ames Study Manager software (InStem, Staffordshire, UK). A complete description of the DTT testing protocol for bacterial mutagenicity assays can be accessed at https://ntp.niehs.nih.gov/testing/types/genetic/index.html.
The bacterial mutagenicity assay results were concluded to be positive if a sample induced a reproducible, concentration-related increase in histidine- or tryptophan-independent (revertant) colonies. Results were concluded to be negative if no increase in revertant colonies was observed. Results that were not concentration-related, not reproducible, or lacked sufficient magnitude to support a determination of mutagenicity were classified as equivocal.
2.3 |. Cell culture
Human B-lymphoblastoid TK6 cells were obtained from the American Type Culture Collection® (ATCC®) (catalog # CRL-8015) and were determined to be free of mycoplasma contamination using the LookOut® Mycoplasma PCR Detection Kit (Sigma-Aldrich, St. Louis, MO). Cells were cultured and maintained in RPMI 1640 medium with 10% heat inactivated horse serum plus 1.0% Pluronic™ F-68, 0.5% sodium pyruvate, and antibiotics (penicillin at 20 Units/mL and streptomycin at 20 μg/mL) at 37 ± 1 °C in a humidified atmosphere with 6 ± 1% CO2 in air.
For assays using TK6 cells, the top concentration for chemical exposure was limited to 10 mM based on OECD Test Guideline No. 487 (OECD, 2016). The top concentration for GBFs was limited to a 1:100 dilution, as a 1:10 dilution was necessary for adjusting the pH of the GBFs and an additional 1:10 dilution into the culture was required to keep the final aqueous vehicle volume at 10% of the final culture volume. No changes in osmolality of the highest tested concentration were observed for any of the chemicals or GBFs after 24 h of exposure. None of the test articles caused precipitation at analyzable concentrations after 4 or 24 h of incubation in TK6 cell-based assays.
Metabolic activation was supplied by co-exposure with phenobarbital/benzoflavone-induced male Sprague Dawley rat liver S9 with co-factors (S9 mix) (Moltox, Boone, NC).
2.4 |. Concentration-range finding study
Concentration-range finding studies for the MultiFlow DNA Damage Assay were performed in the absence of S9 using the Cleaved PARP Kit (Litron Laboratories, Rochester, NY). Logarithmically growing TK6 cells were plated into 96-well plates at a density of 2.0 ± 0.25 × 10⁵ cells/mL and exposed to 20 concentrations (n = 1 well for each concentration) of each test article (concentrations are reported in Tables S1 and S2). The vehicle control was tested in quadruplicate wells. Treated cells were harvested after 24 h of exposure. A volume of 25 μL of cell culture was mixed with 50 μL/well of prepared Cleaved PARP Kit (Litron Laboratories, Rochester, NY) reagent in a new 96-well plate, then incubated at room temperature for at least 30 min. The cells were analyzed using a FACSCantoII™ flow cytometer equipped with a BD™ High Throughput Sampler (BD Biosciences, San Jose, CA). Raw data files from the flow cytometer were sent to Litron Laboratories for quality control and endpoint analysis. Inert, fluorescent polystyrene counting beads from the kit were used to derive nuclei densities of each sample. Nuclei densities were used to calculate the percent relative nuclei count (%RNC), a measure of cytotoxicity, which is the density of nuclei in a treated culture divided by the density of nuclei in the vehicle control culture multiplied by 100. Cleaved poly-ADP ribose polymerase (PARP) was detected using an antibody conjugated to FITC. The GraphPad Prism (version 8.2.1) sigmoidal nonlinear curve fitting function was applied to the cytotoxicity data for graphical representation of the data.
2.5 |. MultiFlow DNA Damage Assay
Logarithmically growing TK6 cells were plated into 96-well plates at a density of 2.0 ± 0.25 × 10⁵ cells/mL and exposed to 20 concentrations (n = 1 well for each concentration) of each test article (4 wells each for the vehicle control and each positive control). For exposures without S9, methylmethane sulfonate (MMS) and carbendazim were used as positive controls for clastogenic and aneugenic responses, respectively. For exposures with S9, 2-amino-1-methyl-6-phenylimidazo[4,5-b]pyridine (PhIP) and benzo[a]pyrene (BaP) were used as positive controls for clastogenicity. Carbonyl cyanide m-chlorophenyl hydrazone (CCCP) was used as a control for non-genotoxic cytotoxicity ±S9. Positive controls were obtained from Sigma-Aldrich (St. Louis, MO) except for PhIP, which was obtained from Toronto Research Chemicals (Toronto, Ontario). Treated cells were sampled at 4 and 24 h after initiation of exposures. Cells co-exposed with 10% S9 mix (at 5% in the culture medium for a final S9 concentration of 0.5%) were washed and resuspended in fresh culture medium prior to sampling at the 4-h time point. At each sampling time, 25 μL of cell culture was mixed with 50 μL/well of prepared MultiFlow® Kit (Litron Laboratories, Rochester, NY) reagent in a new 96-well plate, then incubated at room temperature for at least 30 min. The cells were analyzed using a BD FACSCanto™ II flow cytometer equipped with a BD™ High Throughput Sampler (BD Biosciences, San Jose, CA). Raw data files from the flow cytometer were sent to Litron Laboratories for quality control and analysis. Similar to the Cleaved PARP Kit, cytotoxicity was measured as the %RNC of cells from treated cultures compared to cells from vehicle control cultures using ratios of counted nuclei to counting beads added to each sample. For the MultiFlow assay, 24-h time point cytotoxicity data were used to decide which concentrations of test articles would be excluded from biomarker analyses. If the RNC was below 20% for a well, it was excluded from analysis due to overt cytotoxicity. Also, a well could have an RNC of 20%, but be excluded from analysis if a preceding, lower concentration of a test article had an RNC below 20%. Lastly, when more than two concentrations had %RNCs that range from 20% to 30%, only the two lowest concentrations were used for analysis. The GraphPad Prism (version 8.2.1) sigmoidal nonlinear curve fitting function was applied for graphical representation of the cytotoxicity data.
The MultiFlow assay evaluates several biomarkers – translocation of p53 to the nucleus, phosphorylation of H2AX (γH2AX), phosphorylation of histone H3 (P-H3), and polyploidy –using a machine learning (ML) approach (Bryce et al., 2016) and a global evaluation factor (GEF) approach (Bryce et al., 2017) to analyze the data. In brief, clastogenic activity is indicated by translocation of p53 to the nucleus in response to DNA damage, and by γH2AX, a marker of DNA double-strand breaks. The phosphorylation of histone H3 occurs with condensation of chromatin in mitosis, making it a marker that is unique to mitotic cells, and the accumulation of cells in mitosis and polyploidy are both indicators of aneugenic activity. The ML approach uses multinomial logistic regression, artificial neural network, and random forest models that were built by Litron Laboratories using JMP Pro software (v13, SAS Institute, Cary, NC) and trained using data generated at ILS from a reference set of 23 chemicals (clastogens, aneugens, and non-genotoxicants) to generate probability scores for clastogenic or aneugenic activity at each test concentration. Outputs from the three models were synthesized into a final ML call using the following criteria:
genotoxic, with evidence for a clastogenic MoA, required two successive concentrations to exhibit clastogen probability scores ≥ 80%, or one concentration to exhibit a clastogen probability score ≥ 90%;
genotoxic, with evidence for an aneugen MoA, required two successive concentrations to exhibit aneugen probability scores ≥ 80%, or one concentration to exhibit an aneugen probability score ≥ 90%; and
non-genotoxic was defined as the absence of two successive concentrations exhibiting clastogen or aneugen probability scores ≥ 80%, and no one concentration exhibiting a clastogen or aneugen probability score ≥ 90%.
For a test article to have a clastogenic and/or aneugenic signature in the ML approach, a majority vote ensemble (2 out of 3 models indicating the same mechanism) was used to synthesize the results of the three ML models. The polyploidy endpoint is not included in the +S9 condition as aneugens typically have been found to not require metabolic activation (Bernacki et al., 2016).
The GEF approach uses cutoff values for significant fold increases for each biomarker. The cutoff values were derived from an inter-laboratory training set generated by several laboratories (Bryce et al., 2017). This approach was used to identify responses that are robust but are not recognized as patterns by the ML models. GEFs were also used to evaluate positive control data for quality control.
Clastogenic signatures using the GEF approach were identified by fold increases in 2 consecutive concentrations that meet or exceed cutoffs for at least two of the following clastogenic responses:
≥ 1.51-fold 4 h γH2AX
≥ 2.11-fold 24 h γH2AX
≥ 1.40-fold 4 h nuclear p53
≥ 1.45-fold 24 h nuclear p53
Aneugenic signatures using the GEF approach were identified by fold increases in 2 consecutive concentrations that meet or exceed cutoffs for at least two of the following aneugenic responses:
≥ 1.71-fold 4 h P-H3
≥ 1.52-fold 24 h P-H3
≥ 5.86-fold 24 h polyploidy
≥ 1.45-fold 24 h nuclear p53
The results from the two approaches (ML models and GEFs) were evaluated separately. If either method identified a test article as having a clastogenic or aneugenic signature, the test article was considered to be genotoxic.
2.6 |. In vitro micronucleus assay
Micronuclei were evaluated using a testing strategy based on OECD Test Guideline 487 (OECD, 2016). Logarithmically growing TK6 cells were plated into 96-well plates at a density of 2.0 ± 0.25 × 10⁵ cells/mL and exposed to 12 concentrations of test articles (based on concentrations used in the MultiFlow assay) in triplicate wells (4 wells for each positive control, 20 wells for the vehicle control) for 4 ± 0.5 h (± 10% S9 mix at 10% in the culture medium for a final S9 concentration of 1%) and 24 ± 1 h (no S9 mix). Vinblastine sulfate and cyclophosphamide monohydrate, both acquired from Sigma-Aldrich (St. Louis, MO), were used as positive controls in the absence or presence of S9 mix, respectively. Following 4-h exposures, cells were washed and placed back into incubation in fresh culture medium for another 20 ± 1 h. At the end of the culture period, passage through sufficient cell divisions to ensure detection of micronuclei was confirmed using a Cellometer (Nexcelcom Bioscience, Lawrence, MA) and the cells were analyzed for micronucleus induction and cytotoxicity by flow cytometry. Typically, two test articles were evaluated per plate with shared vehicle and positive controls. The micronucleus and cytotoxicity assays were performed using the flow cytometry-based high content In Vitro MicroFlow® Kit (Litron Laboratories, Rochester, NY). Sample preparation, staining, and other methods were performed according to manufacturer’s instructions and ILS standard operating procedures. Micronuclei were identified using a combination of characteristics of size (as measured by light scatter) and fluorescence, based on differential staining steps, that differentiates debris from necrotic and apoptotic cells (ethidium monoazide (EMA)-positive events) from true micronuclei (stained with a second dye, Sytox™ green) originating from “healthy” cells. The data were collected using a Becton-Dickinson FACSCantoII™ flow cytometer equipped with a BD™ High Throughput Sampler (BD Biosciences, San Jose, CA). Unless limited by cytotoxicity, 5,000 (± 800) cells from each sample were analyzed for the frequency of micronuclei. Cytotoxicity was reported as percent relative survival (%RS), measured as nuclei-to-bead ratios comparing exposed cells to their corresponding vehicle controls. Percent apoptotic and necrotic cells, based upon EMA-positive events, was also determined. Experiments were excluded from analysis if the mean percent micronuclei (%MN) for the vehicle control was ≥ 2%. The GraphPad Prism (version 8.2.1) sigmoidal nonlinear curve fitting function was applied to the cytotoxicity data for graphical representation of the data.
For %MN, Jonckheere’s test was used to test for trend and Dunn’s test was used to test for pairwise differences from the control group. To maintain the overall significance level at 0.05, tests for trend and pairwise differences were considered statistically significant if one-sided P ≤ 0.025 (= 0.05/2). Data points for which relative cell survival was < 40% or for which there was a ≥ 4-fold increase in the measure of EMA-positive events over the vehicle control (as per the Litron In Vitro MicroFlow Kit manual) were excluded from statistical analysis. A response was considered positive if the trend test was significant and at least one concentration was significantly increased compared to the control, or if 2 or more concentrations were significantly increased compared to the control. A response was considered equivocal if only the trend test was significant, or if only a single concentration was significantly increased over the control without a significant trend test. A response was considered negative if the trend test was not significant and there were no significant pairwise comparisons.
After the data were analyzed statistically, scientific judgement was used to review the micronucleus test results based on comparison to the ILS historical vehicle control (mean ± 2 standard deviations) developed for each exposure protocol (Supporting Information Table S3), the magnitude of any observed increase in %MN, and whether significant pairwise comparisons occurred only at the higher end of the cytotoxicity range. Results were then integrated across repeat trials and the three different exposure protocols (24 h -S9, 4 h +S9, 4 h -S9) to provide a final call (negative, equivocal, weakly positive, or positive) for each test article.
2.7 |. Toxicokinetic (TK) analyses of glyphosate exposure
The likelihood of toxicity to humans from glyphosate was assessed by comparing in vivo dose limits or estimates of exposure to the equivalent administered dose (EAD) calculated from the highest concentration tested in our in vitro studies with TK6 cells. Human dose limits or estimates of exposure were gathered from USEPA, CDC, EFSA, and WHO documents (ATSDR, 2020; EFSA, 2015b; FAO & WHO, 2016; USEPA, 1989; USEPA, 2012; USEPA, 2017). Human exposure estimates ranged from 0.47 mg/kg/day for aggregated dietary and residential child exposures to a maximum potential estimated exposure of 7 mg/kg/day calculated for occupational handlers (USEPA, 2017). Human acceptable daily intake values, reference doses, and acceptable operator exposure levels ranged from 0.1 – 2 mg/kg/day (ATSDR, 2020; EFSA, 2015b; FAO & WHO, 2016; USEPA, 1989; USEPA, 2012). The maximum dose limit or exposure value, 7 mg/kg/day, was then used for comparison with the 10 mM highest concentration tested for glyphosate.
Human toxicokinetics simulations for glyphosate were performed using both proprietary and open-source platforms: the GastroPlus® software (9.8.1003 version, Simulations Plus, Inc.) or the High Throughput Toxicokinetics (HTTK) open-source R-package (2.0.2 version, R version 4.0.3), respectively. (Pearce et al., 2017). The default GastroPlus physiologically based pharmacokinetic (PBPK) model was used, which is a perfusion-limited tissue model containing 17 compartments for blood and tissues. The model was run with the default settings after input of the simplified molecular-input line-entry system (SMILES) from PubChem, simulating a 70 kg male human fed model with a liver flow rate of ~33 mL/sec, using an immediate release suspension in 250 mL, pH 7.4, and all recombinant cytochrome P450 enzymes (CYPs). The values for input parameters to populate the GastroPlus model were provided by ADMET Predictor (9.5.0.16 version, Simulation Plus, Inc.). In addition, for fraction unbound in plasma (fu) and intrinsic clearance (Clint), values provided from open-source QSAR models in OPERA (v2.7) (Mansouri et al., 2018) were also used to evaluate the impact of these parameters on in vitro to in vivo extrapolation (IVIVE) analysis. The GastroPlus PBPK model may contain non-linear kinetics, therefore, when using GastroPlus model for reverse dosimetry, a dose-maximum blood concentration (Cmax) curve was generated by simulating a series of doses ranging from 70 to 1,000,000 mg/day (the maximum dosing amount allowed in GastroPlus platform), from which regression equations were derived and used for estimated EAD that resulted in plasma Cmax equivalent to 10 mM, the highest concentration of glyphosate that was tested in vitro.
The httk.PBTK model is a generalized PBPK model provided from the HTTK R package. The httk.PBTK model is also a perfusion-limited tissue model, which includes 7 compartments (artery, vein, lung, gut, liver, kidney, and rest-of-body). The default model also simulates a 70 kg human. Most input parameters for populating the httk.PBTK are provided by HTTK package, e.g., tissue to plasma partition coefficients. However, values for a few selected parameters, i.e., octanol-water partition coefficient (logP), Henry’s law constant (HL), acid dissociation constant (pKa), fu and Clint, were provided by both OPERA (v2.7) (Mansouri et al., 2018) and ADMET Predictor (9.5.0.16 version, Simulations Plus, Inc.). When multiple pKa values were estimated, the median pKa values were used for model input. For the httk.PBTK model, a linear relationship between dose and plasma concentration is assumed. Therefore, for IVIVE, a forward dosimetry was conducted first to obtain Cmax following a dose of 1 mg/kg/day. Then the EAD corresponding to 10 mM was calculated using linear extrapolation shown as following: EAD = 10,000 (μM) x 1 (mg/kg/day)/Cmax (μM).
The same approach as described in the Supporting Information file “IVIVE-PBPK Analyses for Herbicides and AMPA.xlxs” was used to conduct human toxicokinetic analyses of glyphosate IPA, AMPA, diquat dibromide, metolachlor, and mesotrione. Similar to glyphosate, AMPA was analyzed using an in vitro concentration of 10 mM, since no cytotoxic or genotoxic effects were observed up to this top concentration that was used for testing. Activity concentration at cutoff (ACC) values based on in vitro MN data were used for glyphosate IPA and the other three herbicides.
2.8 |. Quality assurance and CEBS database
The data presented in this manuscript underwent quality assurance audits conducted by CSS Corporation, Research Triangle Park, NC, USA. The audit findings were reviewed and assessed by DTT staff, and all comments were resolved or otherwise addressed during the preparation of this manuscript. All data generated from the in vitro studies and the reverse dosimetry analyses are available in the DTT Chemical Effects in Biological Systems (CEBS) database: https://doi.org/10.22427/NTP-DATA-002-02220-0014-0000-3
3 |. RESULTS
3.1 |. Bacterial mutagenicity assays
Glyphosate, glyphosate IPA, and AMPA were not mutagenic in any of the five strains used in this assay when tested at concentrations up to 6000 μg/plate, ±S9 (Tables 3, 4, and 5, respectively). Diquat dibromide (Table 6) and metolachlor (Table 7) also were negative in all tester strains, as were the 13 GBFs, when tested to the limit of cytotoxicity, ±S9. Mesotrione, however, was mutagenic in TA100, TA1535, TA97a, and TA98 and non-mutagenic in E. coli, when tested at concentrations up to 6000 μg/plate, ±S9 (Table 8). Bacterial mutagenicity data sets for all 19 test articles can be accessed at the DTT CEBS database: https://doi.org/10.22427/NTP-DATA-002-02220-0014-0000-3
Table 3.
Mutagenicity of glyphosate in bacterial tester strains.
| Strain | Concentration (μg/plate) | Without S9 | Without S9 | With 10% rat S9 | With 10% rat S9 |
|---|---|---|---|---|---|
|
| |||||
| TA100 | 0a | 130 ± 6 | 87 ± 1 | 126 ± 9 | 81 ± 4 |
| 200 | 104 ± 3 | 78 ± 3 | 87 ± 5 | 100 ± 4 | |
| 500 | 100 ± 4 | 92 ± 7 | 103 ± 15 | 93 ± 14 | |
| 1,500 | 88 ± 3 | 75 ± 1 | 87 ± 10 | 70 ± 4 | |
| 3,000 | 92 ± 12 | 75 ± 5 | 83 ± 5 | 73 ± 5 | |
| 6,000 | 80 ± 4 | 63 ± 4 | 67 ± 4 | 52 ± 2 | |
| Trial summary | Negative | Negative | Negative | Negative | |
| Positive controlb | 536 ± 25 | 579 ± 14 | 743 ± 91 | 863 ± 15 | |
| TA1535 | 0 | 22 ± 2 | 10 ± 3 | 24 ± 4 | 9 ± 0.3 |
| 200 | 17 ± 4 | 13 ± 3 | 19 ± 0.3 | 10 ± 2 | |
| 500 | 11 ± 2 | 12 ± 3 | 13 ± 2 | 13 ± 3 | |
| 1,500 | 13 ± 2 | 15 ± 3 | 17 ± 4 | 16 ± 4 | |
| 3,000 | 11 ± 1 | 9 ± 2 | 13 ± 4 | 16 ± 3 | |
| 6,000 | 11 ± 1 | 11 ± 3 | 13 ± 2 | 9 ± 1 | |
| Trial summary | Negative | Negative | Negative | Equivocal | |
| Positive control | 590 ± 26 | 315 ± 19 | 268 ± 8 | 270 ± 3 | |
| TA97a | 0 | 133 ± 6 | 122 ± 5 | 161 ± 3 | 143 ± 3 |
| 200 | 107 ± 6 | 134 ± 5 | 148 ± 13 | 147 ± 7 | |
| 500 | 109 ± 9 | 121 ± 9 | 156 ± 8 | 188 ± 7 | |
| 1,500 | 97 ± 4 | 105 ± 11 | 157 ± 12 | 145 ± 3 | |
| 3,000 | 92 ± 9 | 105 ± 6 | 103 ± 5 | 70 ± 6 | |
| 6,000 | 74 ± 3 | 82 ± 6 | 88 ± 2 | 48 ± 8 | |
| Trial summary | Negative | Negative | Negative | Negative | |
| Positive control | 2712 ± 221 | 964 ± 89 | 2057 ± 85 | 1725 ± 20 | |
| TA98 | 0 | 23 ± 3 | 33 ± 2 | 42 ± 3 | 38 ± 2 |
| 200 | 30 ± 1 | 32 ± 8 | 29 ± 1 | 39 ± 3 | |
| 500 | 21 ± 3 | 29 ± 4 | 25 ± 3 | 37 ± 4 | |
| 1,500 | 20 ± 1 | 21 ± 3 | 33 ± 5 | 36 ± 3 | |
| 3,000 | 19 ± 1 | 26 ± 3 | 25 ± 3 | 36 ± 5 | |
| 6,000 | 23 ± 5 | 29 ± 2 | 24 ± 1 | 29 ± 4 | |
| Trial summary | Negative | Negative | Negative | Negative | |
| Positive control | 98 ± 6 | 481 ± 37 | 1429 ± 36 | 2324 ± 246 | |
| E. coli WP2 uvrA | 0 | 136 ± 2 | 178 ± 6 | 184 ± 18 | 186 ± 6 |
| pkM101 | 200 | 131 ± 6 | 137 ± 7 | 168 ± 11 | 203 ± 13 |
| 500 | 132 ± 3 | 123 ± 6 | 157 ± 11 | 190 ± 18 | |
| 1,500 | 128 ± 6 | 98 ± 1 | 146 ± 11 | 136 ± 14 | |
| 3,000 | 102 ± 15 | 92 ± 11 | 107 ± 9 | 118 ± 17 | |
| 6,000 | 66 ± 7 | 61 ± 15 | 78 ± 7 | 77 ± 10 | |
| Trial summary | Negative | Negative | Negative | Negative | |
| Positive control | 2589 ± 114 | 2327 ± 102 | 1047 ± 15 | 1161 ± 97 | |
Data are presented as revertants/plate (mean ± standard error) from three plates.
Sterile water was used for the vehicle control.
The positive controls in the absence of metabolic activation were sodium azide (TA100, TA1535), ICR191 (TA97a), 2-nitrofluorene (TA98), and 4-nitroquinoline-N-oxide (E. coli WP2). The positive control for metabolic activation for all strains was 2-aminoanthracene, except benzo[a]pyrene was used for TA100.
Table 4.
Mutagenicity of glyphosate IPA in bacterial tester strains.
| Strain | Concentration (μg/plate) | Without S9 | Without S9 | With 10% rat S9 | With 10% rat S9 |
|---|---|---|---|---|---|
|
| |||||
| TA100 | 0a | 87 ± 4 | 136 ± 4 | 81 ± 6 | 110 ± 6 |
| 200 | 86 ± 5 | 144 ± 6 | 82 ± 7 | 135 ± 4 | |
| 500 | 76 ± 4 | 137 ± 11 | 82 ± 7 | 115 ± 6 | |
| 1,500 | 95 ± 6 | 175 ± 26 | 81 ± 2 | 152 ± 20 | |
| 3,000 | 62 ± 9 | 129 ± 6 | 87 ± 7 | 156 ± 21 | |
| 6,000 | 81 ± 3 | 116 ± 4 | 89 ± 8 | 161 ± 22 | |
| Trial summary | Negative | Negative | Negative | Equivocal | |
| Positive controlb | 492 ± 75 | 480 ± 7 | 669 ± 13 | 931 ± 47 | |
| TA1535 | 0 | 15 ± 2 | 18 ± 2 | 9 ± 1 | 16 ± 4 |
| 200 | 14 ± 2 | 16 ± 2 | 11 ± 1 | 19 ± 5 | |
| 500 | 8 ± 0.3 | 18 ± 3 | 11 ± 1 | 14 ± 2 | |
| 1,500 | 14 ± 2 | 15 ± 5 | 10 ± 4 | 14 ± 4 | |
| 3,000 | 11 ± 4 | 19 ± 2 | 9 ± 0.3 | 15 ± 1 | |
| 6,000 | 14 ± 4 | 17 ± 2 | 15 ± 1 | 14 ± 2 | |
| Trial summary | Negative | Negative | Negative | Negative | |
| Positive control | 573 ± 8 | 356 ± 16 | 264 ± 2 | 323 ± 76 | |
| TA97a | 0 | 90 ± 3 | 113 ± 10 | 156 ± 3 | 58 ± 14 |
| 200 | 102 ± 13 | 116 ± 5 | 137 ± 13 | 62 ± 5 | |
| 500 | 91 ± 3 | 89 ± 9 | 140 ± 6 | 49 ± 3 | |
| 1,500 | 88 ± 2 | 93 ± 7 | 126 ± 6 | 108 ± 14 | |
| 3,000 | 98 ± 9 | 85 ± 3 | 144 ± 4 | 78 ± 7 | |
| 6,000 | 87 ± 9 | 58 ± 14 | 142 ± 8 | 50 ± 5 | |
| Trial summary | Negative | Negative | Negative | Negative | |
| Positive control | 3011 ± 44 | 2239 ± 87 | 1635 ± 39 | 975 ± 24 | |
| TA98 | 0 | 28 ± 6 | 19 ± 2 | 35 ± 7 | 22 ± 3 |
| 200 | 24 ± 3 | 20 ± 0 | 37 ± 7 | 34 ± 4 | |
| 500 | 27 ± 4 | 33 ± 9 | 26 ± 3 | 29 ± 4 | |
| 1,500 | 30 ± 4 | 21 ± 1 | 35 ± 5 | 23 ± 2 | |
| 3,000 | 32 ± 1 | 24 ± 3 | 33 ± 4 | 17 ± 4 | |
| 6,000 | 31 ± 5 | 22 ± 0.3 | 32 ± 2 | 19 ± 2 | |
| Trial summary | Negative | Negative | Negative | Negative | |
| Positive control | 107 ± 6 | 526 ± 26 | 1953 ± 166 | 2558 ± 194 | |
| E. coli WP2 uvrA | 0 | 136 ± 12 | 195 ± 2 | 158 ± 6 | 141 ± 7 |
| pkM101 | 200 | 156 ± 8 | 183 ± 4 | 193 ± 3 | 139 ± 1 |
| 500 | 145 ± 4 | 119 ± 5 | 180 ± 4 | 143 ± 12 | |
| 1,500 | 154 ± 12 | 151 ± 5 | 178 ± 12 | 143 ± 5 | |
| 3,000 | 169 ± 11 | 197 ± 19 | 189 ± 9 | 235 ± 9 | |
| 6,000 | 199 ± 10 | 275 ± 7 | 151 ± 15 | 172 ± 24 | |
| Trial summary | Negative | Negative | Negative | Negative | |
| Positive control | 2280 ± 237 | 3575 ± 71 | 1094 ± 28 | 1182 ± 35 | |
Data are presented as revertants/plate (mean ± standard error) from three plates.
Sterile water was used for the vehicle control.
The positive controls in the absence of metabolic activation were sodium azide (TA100, TA1535), ICR191 (TA97a), 2-nitrofluorene (TA98), and 4-nitroquinoline-N-oxide (E. coli WP2). The positive control for metabolic activation for all strains was 2-aminoanthracene, except benzo[a]pyrene was used for TA100.
Table 5.
Mutagenicity of AMPA in bacterial tester strains.
| Strain | Concentration (μg/plate) | Without S9 | Without S9 | With 10% rat S9 | With 10% rat S9 |
|---|---|---|---|---|---|
|
| |||||
| TA100 | 0a | 88 ± 9 | 115 ± 14 | 96 ± 11 | 134 ± 6 |
| 200 | 107 ± 12 | 145 ± 6 | 92 ± 11 | 137 ± 6 | |
| 500 | 85 ± 9 | 118 ± 3 | 82 ± 9 | 132 ± 3 | |
| 1,500 | 72 ± 5 | 155 ± 7 | 82 ± 10 | 130 ± 7 | |
| 3,000 | 71 ± 4 | 131 ± 10 | 84 ± 4 | 127 ± 8 | |
| 6,000 | 110 ± 4 | 129 ± 6 | 95 ± 8 | 153 ± 28 | |
| Trial summary | Negative | Negative | Negative | Negative | |
| Positive controlb | 575 ± 45 | 552 ± 62 | 838 ± 33 | 692 ± 20 | |
| TA1535 | 0 | 10 ± 4 | 17 ± 1 | 13 ± 4 | 17 ± 2 |
| 200 | 16 ± 3 | 27 ± 4 | 12 ± 3 | 14 ± 1 | |
| 500 | 15 ± 3 | 17 ± 1 | 20 ± 5 | 12 ± 3 | |
| 1,500 | 15 ± 5 | 20 ± 1 | 14 ± 3 | 14 ± 4 | |
| 3,000 | 12 ± 2 | 18 ± 2 | 12 ± 1 | 13 ± 3 | |
| 6,000 | 17 ± 4 | 14 ± 4 | 16 ± 2 | 19 ± 3 | |
| Trial summary | Negative | Negative | Negative | Negative | |
| Positive control | 772 ± 67 | 448 ± 10 | 255 ± 13 | 288 ± 24 | |
| TA97a | 0 | 88 ± 5 | 100 ± 15 | 156 ± 4 | 160 ± 6 |
| 200 | 85 ± 6 | 107 ± 3 | 132 ± 5 | 200 ± 5 | |
| 500 | 98 ± 7 | 63 ± 10 | 144 ± 11 | 165 ± 3 | |
| 1,500 | 104 ± 11 | 80 ± 5 | 167 ± 3 | 155 ± 8 | |
| 3,000 | 97 ± 3 | 83 ± 11 | 134 ± 11 | 152 ± 1 | |
| 6,000 | 87 ± 7 | 61 ± 11 | 132 ± 8 | 199 ± 16 | |
| Trial summary | Negative | Negative | Negative | Negative | |
| Positive control | 3183 ± 96 | 2289 ± 117 | 1875 ± 37 | 2230 ± 62 | |
| TA98 | 0 | 37 ± 6 | 27 ± 2 | 40 ± 3 | 30 ± 1 |
| 200 | 35 ± 4 | 26 ± 3 | 34 ± 4 | 27 ± 1 | |
| 500 | 32 ± 1 | 26 ± 2 | 36 ± 4 | 35 ± 4 | |
| 1,500 | 43 ± 4 | 29 ± 2 | 38 ± 5 | 22 ± 4 | |
| 3,000 | 33 ± 3 | 28 ± 2 | 39 ± 5 | 38 ± 6 | |
| 6,000 | 35 ± 2 | 27 ± 6 | 41 ± 2 | 33 ± 2 | |
| Trial summary | Negative | Negative | Negative | Negative | |
| Positive control | 126 ± 19 | 726 ± 29 | 1919 ± 123 | 1850 ± 40 | |
| E. coli WP2 uvrA | 0 | 138 ± 13 | 99 ± 11 | 159 ± 12 | 106 ± 8 |
| pkM101 | 200 | 145 ± 8 | 99 ± 4 | 162 ± 13 | 115 ± 7 |
| 500 | 124 ± 5 | 84 ± 2 | 186 ± 6 | 109 ± 9 | |
| 1,500 | 118 ± 4 | 114 ± 7 | 165 ± 4 | 121 ± 10 | |
| 3,000 | 138 ± 7 | 102 ± 3 | 175 ± 10 | 120 ± 7 | |
| 6,000 | 129 ± 5 | 91 ± 6 | 172 ± 7 | 152 ± 12 | |
| Trial summary | Negative | Negative | Negative | Negative | |
| Positive control | 2644 ± 224 | 2563 ± 77 | 1232 ± 74 | 1119 ± 66 | |
Data are presented as revertants/plate (mean ± standard error) from three plates.
Sterile water was used for the vehicle control.
The positive controls in the absence of metabolic activation were sodium azide (TA100, TA1535), ICR191 (TA97a), 2-nitrofluorene (TA98), and 4-nitroquinoline-N-oxide (E. coli WP2). The positive control for metabolic activation for all strains was 2-aminoanthracene, except benzo[a]pyrene was used for TA100.
Table 6.
Mutagenicity of diquat dibromide in bacterial tester strains.
| Strain | Concentration (μg/plate) | Without S9 | Without S9 | With 10% rat S9 | With 10% rat S9 |
|---|---|---|---|---|---|
|
| |||||
| TA100 | 0a | 101 ± 8 | 78 ± 6 | 80 ± 2 | 90 ± 2 |
| 0.63 | 74 ± 7 | ||||
| 0.70 | 109 ± 9 | 101 ± 6 | |||
| 1.25 | 83 ± 7 | 90 ± 4 | |||
| 1.40 | 125 ± 23 | 95 ± 4 | |||
| 2.50 | 90 ± 5 | 87 ± 2 | |||
| 2.79 | 102 ± 2 | 94 ± 7 | |||
| 5.0 | 76 ± 9 | 92 ± 2 | |||
| 5.58 | 105 ± 10 | 93 ± 4 | |||
| 10.0 | 85 ± 3 | 68 ± 3 | |||
| 11.17 | 89 ± 9 | 99 ± 5 | |||
| 20.0 | 62 ± 3 | 74 ± 7 | |||
| 22.3 | 11 ± 3 | 100 ± 24 | |||
| 50.0 | 31 ± 2 | ||||
| Trial summary | Negative | Negative | Negative | Negative | |
| Positive controlb | 695 ± 61 | 544 ± 18 | 766 ± 84 | 561 ± 82 | |
| TA1535 | 0 | 17 ± 4 | 12 ± 1 | 17 ± 3 | 14 ± 3 |
| 0.31 | 25 ± 3 | ||||
| 0.35 | 24 ± 7 | 11 ± 4 | |||
| 0.63 | 31 ± 5 | ||||
| 0.70 | 13 ± 3 | 15 ± 4 | |||
| 1.25 | 18 ± 1 | 17 ± 2 | |||
| 1.40 | 24 ± 2 | 12 ± 2 | |||
| 2.50 | 20 ± 5 | 16 ± 2 | |||
| 2.79 | 16 ± 3 | 11 ± 2 | |||
| 5.0 | 10 ± 4 | 16 ± 3 | |||
| 5.58 | 11 ± 1 | 11 ± 3 | |||
| 10.0 | 10 ± 1 | 14 ± 3 | |||
| 11.2 | 4 ± 0.3 | 10 ± 2 | |||
| 20.0 | 9 ± 2 | ||||
| 50.0 | 5 ± 2 | ||||
| Trial summary | Negative | Equivocal | Negative | Negative | |
| Positive control | 589 ± 25 | 343 ± 55 | 293 ± 17 | 344 ± 16 | |
| TA97a | 0 | 127 ± 10 | 103 ± 13 | 148 ± 3 | 141 ± 10 |
| 0.31 | 79 ± 10 | ||||
| 0.35 | 112 ± 4 | ||||
| 0.63 | 108 ± 6 | 94 ± 7 | |||
| 0.70 | 106 ± 8 | 182 ± 11 | |||
| 1.25 | 89 ± 8 | 122 ± 2 | |||
| 1.40 | 108 ± 6 | 187 ± 14 | |||
| 2.50 | 69 ± 1 | 129 ± 9 | |||
| 2.79 | 77 ± 5 | 161 ± 7 | |||
| 5.0 | 10 ± 2 | 110 ± 5 | |||
| 5.58 | 34 ± 5 | 120 ± 24 | |||
| 10.0 | 2 ± 1 | 42 ± 1 | |||
| 11.2 | 4 ± 1 | 53 ± 8 | |||
| 20.0 | 27 ± 6 | ||||
| 22.3 | 16 ± 4 | ||||
| Trial summary | Negative | Negative | Negative | Negative | |
| Positive control | 2707 ± 174 | 3475 ± 172 | 1990 ± 136 | 917 ± 235 | |
| TA98 | 0 | 40 ± 3 | 23 ± 2 | 33 ± 3 | 35 ± 6 |
| 0.70 | 54 ± 5 | 52 ± 8 | |||
| 1.25 | 32 ± 7 | ||||
| 1.40 | 46 ± 7 | 37 ± 2 | |||
| 2.50 | 22 ± 3 | 34 ± 3 | |||
| 2.79 | 40 ± 4 | 43 ± 5 | |||
| 5.0 | 20 ± 3 | 34 ± 4 | |||
| 5.58 | 39 ± 3 | 38 ± 2 | |||
| 10.0 | 21 ± 2 | 29 ± 4 | |||
| 11.2 | 34 ± 5 | 51 ± 4 | |||
| 20.0 | 19 ± 3 | 29 ± 4 | |||
| 22.3 | 29 ± 6 | 40 ± 1 | |||
| 50 | 10 ± 2 | 26 ± 6 | |||
| 150 | 18 ± 3 | ||||
| Trial summary | Negative | Negative | Negative | Negative | |
| Positive control | 469 ± 38 | 503 ± 51 | 2278 ± 146 | 2292 ± 130 | |
| E. coli WP2 uvrA | 0 | 136 ± 6 | 165 ± 8 | 149 ± 3 | 159 ± 14 |
| pkM101 | 0.04 | 119 ± 8 | |||
| 0.044 | 176 ± 26 | ||||
| 0.08 | 130 ± 6 | 176 ± 15 | |||
| 0.087 | 165 ± 8 | 217 ± 14 | |||
| 0.16 | 137 ± 8 | 176 ± 20 | |||
| 0.17 | 174 ± 5 | 179 ± 11 | |||
| 0.31 | 147 ± 5 | 158 ± 6 | |||
| 0.35 | 108 ± 8 | 179 ± 25 | |||
| 0.63 | 178 ± 11 | 178 ± 13 | |||
| 0.70 | 84 ± 1 | 157 ± 5 | |||
| 1.25 | 15 ± 14 | 161 ± 9 | |||
| 1.40 | 10 ± 4 | 126 ± 5 | |||
| 2.50 | 118 ± 4 | ||||
| 2.79 | 11 ± 4 | ||||
| Trial summary | Negative | Negative | Negative | Negative | |
| Positive control | 3494 ± 101 | 2414 ± 109 | 1478 ± 67 | 1347 ± 82 | |
Data are presented as revertants/plate (mean ± standard error) from three plates.
Sterile water was used for the vehicle control.
The positive controls in the absence of metabolic activation were sodium azide (TA100, TA1535), ICR191 (TA97a), 2-nitrofluorene (TA98), and 4-nitroquinoline-N-oxide (E. coli WP2). The positive control for metabolic activation for all strains was 2-aminoanthracene, except benzo[a]pyrene was used for TA100.
Table 7.
Mutagenicity of metolachlor in bacterial tester strains.
| Strain | Concentration (μg/plate) | Without S9 | Without S9 | With 10% rat S9 | With 10% rat S9 |
|---|---|---|---|---|---|
|
| |||||
| TA100 | 0a | 57 ± 9 | 64 ± 4 | 85 ± 6 | 80 ± 5 |
| 10 | 74 ± 4 | ||||
| 20 | 66 ± 2 | 84 ± 13 | |||
| 50 | 79 ± 14 | 75 ± 9 | |||
| 100 | 73 ± 11 | 80 ± 10 | 78 ± 3 | 73 ± 2 | |
| 200 | 72 ± 3 | 82 ± 2 | 84 ± 2 | 87 ± 6 | |
| 500 | 0 ± 0 | 0 ± 0 | 81 ± 4 | 81 ± 2 | |
| 1,500 | 74 ± 7 | 66 ± 4 | |||
| 3,000 | 53 ± 4 | 0 ± 0 | |||
| 6,000 | 41 ± 4 | ||||
| Trial summary | Negative | Negative | Negative | Negative | |
| Positive controlb | 590 ± 15 | 633 ± 24 | 847 ± 154 | 713 ± 78 | |
| TA1535 | 0 | 16 ± 5 | 9 ± 2 | 10 ± 2 | 9 ± 1 |
| 10 | 11 ± 3 | ||||
| 20 | 11 ± 1 | 18 ± 0 | |||
| 50 | 12 ± 3 | 10 ± 3 | |||
| 100 | 18 ± 6 | 13 ± 7 | 12 ± 1 | 8 ± 2 | |
| 200 | 8 ± 1 | 13 ± 2 | 16 ± 1 | 10 ± 2 | |
| 500 | 9 ± 3 | 7 ± 3 | 16 ± 4 | 9 ± 3 | |
| 1,500 | 0 ± 0 | 12 ± 2 | 9 ± 2 | ||
| 3,000 | 8 ± 0.3 | 9 ± 3 | |||
| 6,000 | 6 ± 2 | 3 ± 0.3 | |||
| Trial summary | Negative | Negative | Negative | Negative | |
| Positive control | 662 ± 49 | 312 ± 33 | 353 ± 7 | 219 ± 2 | |
| TA97a | 0 | 101 ± 2 | 99 ± 5 | 127 ± 9 | 126 ± 6 |
| 10 | 118 ± 3 | ||||
| 20 | 110 ± 5 | 100 ± 1 | |||
| 50 | 117 ± 5 | 101 ± 1 | |||
| 100 | 122 ± 7 | 99 ± 7 | 164 ± 6 | 152 ± 11 | |
| 200 | 119 ± 10 | 100 ± 6 | 148 ± 5 | 120 ± 5 | |
| 500 | 78 ± 9 | 58 ± 11 | 146 ± 9 | 117 ± 5 | |
| 1,500 | 0 ± 0 | 104 ± 10 | 86 ± 3 | ||
| 3,000 | 77 ± 3 | 81 ± 3 | |||
| 6,000 | 59 ± 2 | 0 ± 0 | |||
| Trial summary | Negative | Negative | Negative | Negative | |
| Positive control | 2726 ± 118 | 3787 ± 117 | 2637 ± 47 | 2142 ± 136 | |
| TA98 | 0 | 13 ± 6 | 35 ± 2 | 18 ± 2 | 32 ± 0.3 |
| 10 | 19 ± 2 | ||||
| 20 | 16 ± 2 | 37 ± 3 | |||
| 50 | 14 ± 3 | 27 ± 4 | |||
| 100 | 16 ± 2 | 31 ± 0 | 27 ± 4 | 37 ± 3 | |
| 200 | 14 ± 2 | 35 ± 5 | 20 ± 2 | 33 ± 4 | |
| 500 | 12 ± 4 | 13 ± 3 | 23 ± 3 | 34 ± 5 | |
| 1,500 | 0 ± 0 | 16 ±1 | 19 ± 0.3 | ||
| 3,000 | 15 ± 1 | 12 ± 3 | |||
| 6,000 | 14 ± 2 | 0 ± 0 | |||
| Trial summary | Negative | Negative | Negative | Negative | |
| Positive control | 102 ± 4 | 361 ± 15 | 1675 ± 86 | 2441 ± 157 | |
| E. coli WP2 uvrA | 0 | 160 ± 10 | 144 ± 3 | 155 ± 4 | 132 ± 14 |
| pkM101 | 100 | 117 ± 10 | 157 ± 17 | 206 ± 24 | 177 ± 6 |
| 200 | 133 ± 5 | 156 ± 2 | 193 ± 6 | 156 ± 12 | |
| 500 | 119 ± 3 | 146 ± 3 | 196 ± 23 | 143 ± 8 | |
| 1,500 | 133 ± 11 | 137 ± 0 | 148 ± 9 | 144 ± 8 | |
| 3,000 | 125 ± 10 | 130 ± 10 | 132 ± 5 | 120 ± 15 | |
| 6,000 | 124 ± 8 | 111 ± 14 | 127 ± 9 | 106 ± 11 | |
| Trial summary | Negative | Negative | Negative | Negative | |
| Positive control | 1840 ± 168 | 2569 ± 144 | 1285 ± 98 | 1167 ± 126 | |
Data are presented as revertants/plate (mean ± standard error) from three plates.
Dimethyl sulfoxide (DMSO) was used for the vehicle control.
The positive controls in the absence of metabolic activation were sodium azide (TA100, TA1535), ICR191 (TA97a), 2-nitrofluorene (TA98), and 4-nitroquinoline-N-oxide (E. coli WP2). The positive control for metabolic activation for all strains was 2-aminoanthracene, except benzo[a]pyrene was used for TA100.
TABLE 8.
Mutagenicity of mesotrione in bacterial tester strains
| Strain | Concentration (μg/plate) | Without S9 | Without S9 | With 10% rat S9 | With 10% rat S9 |
|---|---|---|---|---|---|
|
| |||||
| TA100 | 0a | 103 ± 7 | 104 ± 22 | 102 ± 2 | 98 ± 12 |
| 100 | 102 ± 8 | 107 ± 14 | 96 ± 6 | 97 ± 17 | |
| 200 | 119 ± 9 | 158 ± 20 | 98 ± 13 | 101 ± 3 | |
| 500 | 141 ± 10 | 135 ± 12 | 115 ± 14 | 141 ± 20 | |
| 1,500 | 254 ± 21 | 207 ± 6 | 159 ± 25 | 177 ± 7 | |
| 3,000 | 349 ± 36 | 261 ± 39 | 165 ± 15 | 172 ± 39 | |
| 6,000 | 351 ± 22 | 192 ± 14 | 214 ± 48 | 137 ± 24 | |
| Trial summary | Positive | Positive | Positive | Weak Positive | |
| Positive controlb | 828 ± 86 | 520 ± 51 | 962 ± 111 | 622 ± 29 | |
| TA1535 | 0 | 18 ± 10 | 10 ± 3 | 14 ± 4 | 13 ± 1 |
| 100 | 18 ± 10 | 13 ± 7 | 15 ± 3 | 13 ± 4 | |
| 200 | 20 ± 9 | 11 ± 4 | 16 ± 2 | 13 ± 4 | |
| 500 | 23 ± 6 | 15 ± 5 | 16 ± 3 | 15 ± 11 | |
| 1,500 | 33 ± 8 | 22 ± 8 | 22 ± 13 | 12 ± 5 | |
| 3,000 | 52 ± 5 | 33 ± 6 | 14 ± 5 | 11 ± 3 | |
| 6,000 | 118 ± 25 | 53 ± 3 | 35 ± 20 | 12 ± 5 | |
| Trial summary | Positive | Positive | Equivocal | Negative | |
| Positive control | 577 ± 28 | 362 ± 12 | 332 ± 51 | 273 ± 12 | |
| TA97a | 0 | 106 ± 4 | 102 ± 15 | 178 ± 5 | 131 ± 17 |
| 100 | 174 ± 4 | 80 ± 20 | 205 ± 23 | 161 ± 11 | |
| 200 | 201 ± 2 | 93 ± 17 | 218 ± 15 | 173 ± 32 | |
| 500 | 240 ± 22 | 112 ± 49 | 222 ± 24 | 150 ± 5 | |
| 1,500 | 493 ± 36 | 280 ± 87 | 249 ± 27 | 243 ± 20 | |
| 3,000 | 686 ± 22 | 266 ± 16 | 339 ± 16 | 330 ± 16 | |
| 6,000 | 1,117 ± 31 | 32 ± 20 | 486 ± 24 | 405 ± 58 | |
| Trial summary | Positive | Positive | Positive | Positive | |
| Positive control | 2,554 ± 131 | 2,117 ± 393 | 2,384 ± 52 | 1,958 ± 35 | |
| TA98 | 0 | 36 ± 3 | 36 ± 5 | 42 ± 6 | 46 ± 11 |
| 100 | 46 ± 4 | 45 ± 10 | 38 ± 7 | 36 ± 6 | |
| 200 | 63 ± 8 | 56 ± 8 | 54 ± 9 | 42 ± 9 | |
| 500 | 107 ± 6 | 83 ± 13 | 65 ± 8 | 50 ± 8 | |
| 1,500 | 275 ± 7 | 178 ± 17 | 72 ± 13 | 65 ± 13 | |
| 3,000 | 346 ± 28 | 270 ± 38 | 82 ± 6 | 84 ± 12 | |
| 6,000 | 583 ± 18 | 403 ± 46 | 129 ± 11 | 118 ± 3 | |
| Trial summary | Positive | Positive | Positive | Weak Positive | |
| Positive control | 130 ± 5 | 484 ± 18 | 1,561 ± 35 | 2,047 ± 160 | |
| E. coli WP2 uvrA | 0 | 203 ± 14 | 123 ± 11 | 274 ± 19 | 143 ± 13 |
| pkM101 | 100 | 196 ± 13 | 124 ± 15 | 286 ± 15 | 150 ± 19 |
| 200 | 226 ± 4 | 151 ± 13 | 290 ± 24 | 157 ± 23 | |
| 500 | 205 ± 6 | 147 ± 25 | 279 ± 13 | 146 ± 23 | |
| 1,500 | 222 ± 4 | 147 ± 15 | 250 ± 21 | 147 ± 10 | |
| 3,000 | 214 ± 20 | 164 ± 21 | 237 ± 12 | 152 ± 12 | |
| 6,000 | 231 ± 17 | 172 ± 14 | 224 ± 6 | 136 ± 23 | |
| Trial summary | Negative | Negative | Negative | Negative | |
| Positive control | 3,104 ± 147 | 2,492 ± 244 | 1,255 ± 99 | 1,280 ± 22 | |
Data are presented as revertants/plate (mean ± standard error) from three plates.
Sterile water was used for the vehicle control.
The positive controls in the absence of metabolic activation were sodium azide (TA100, TA1535), ICR191 (TA97a), 2-nitrofluorene (TA98), and 4-nitroquinoline-N-oxide (E. coli WP2). The positive control for metabolic activation for all strains was 2-aminoanthracene, except benzo[a]pyrene was used for TA100.
3.2 |. Concentration-range finding studies with TK6 cells
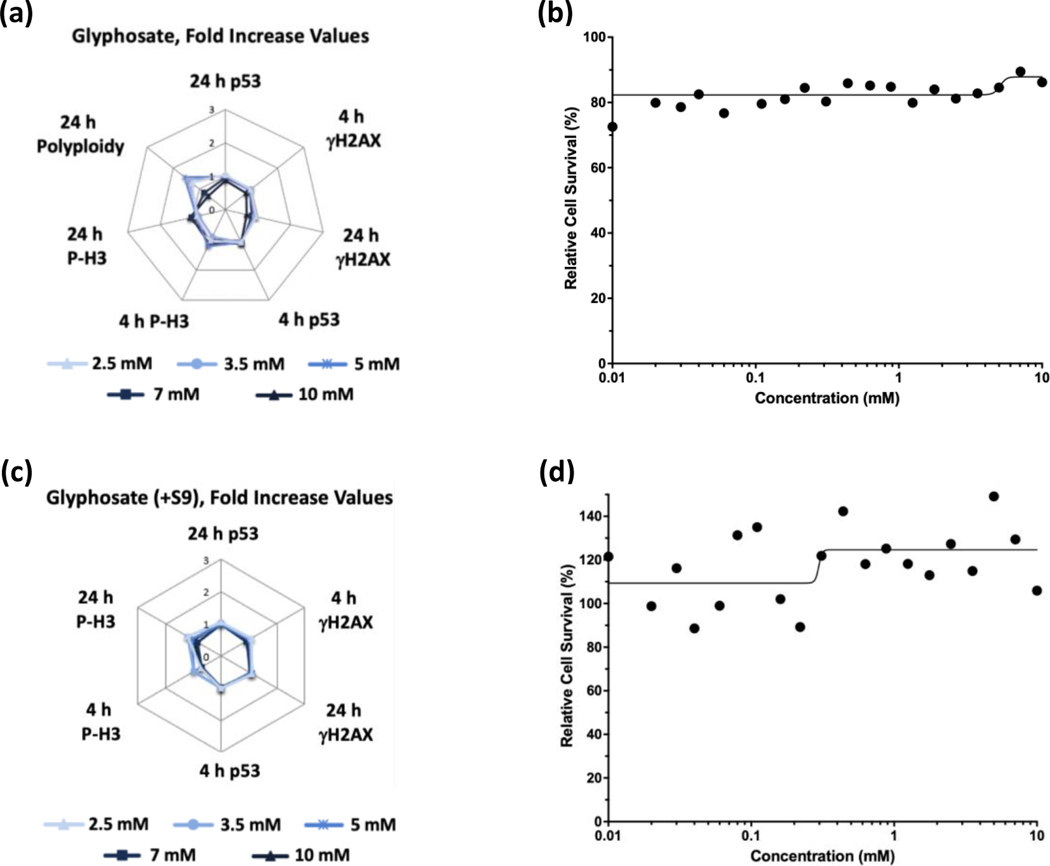
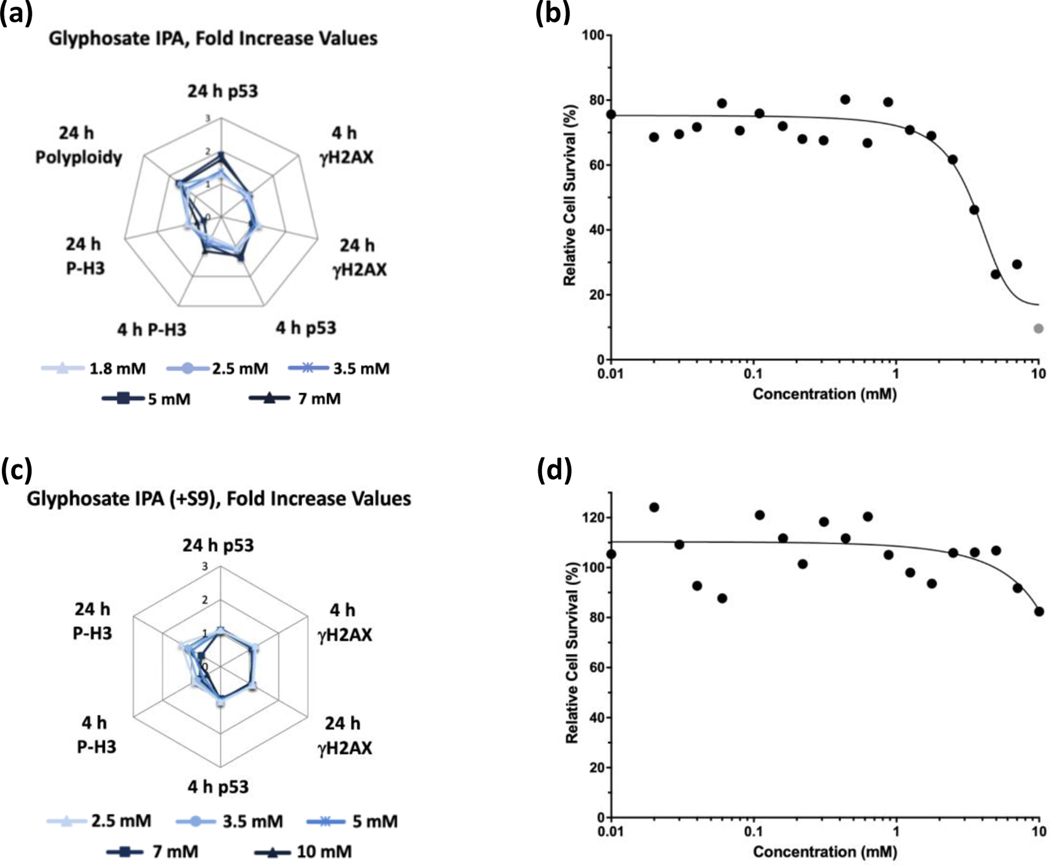
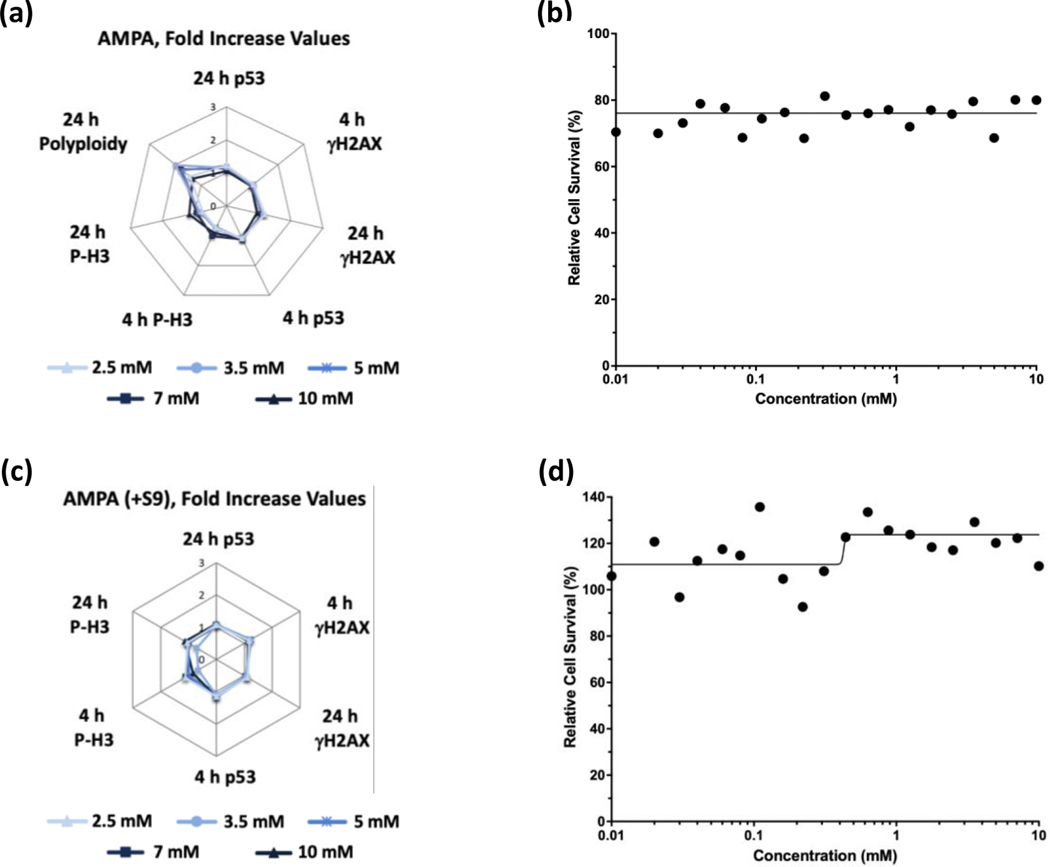
Test articles were first assessed for cytotoxicity and activation of apoptosis in TK6 cells using the Cleaved PARP Kit to identify concentrations of chemicals and dilutions of GBFs to use in the MultiFlow and micronucleus assays. Because poly (ADP-ribose) polymerase (PARP) is a target of caspases 3 and 7, the presence of cleaved PARP indicates initiation of apoptosis. Cells were exposed to chemicals for 24 h at 20 concentrations ranging from 0.01 to 10 mM. Glyphosate and AMPA were not cytotoxic and did not activate apoptosis-dependent cleavage of PARP at any concentration (Supporting Information Figure S1). Glyphosate IPA reduced cell survival by about 30% at concentrations of 7 and 10 mM, accompanied by very small increases in cleaved PARP at those concentrations (Supporting Information Figure S1). In contrast, diquat dibromide, metolachlor, and mesotrione were cytotoxic to TK6 cells, and reduced cell survival was accompanied by concentration-dependent increased cleavage of PARP for all three herbicides (Supporting Information Figure S2).
GBFs were tested using dilutions that ranged from 0.0000138 (1/72,407) to 0.01 (1/100) (Supporting Information Table S2). In general, loss of cell viability from exposure to GBFs occurred at dilutions ranging from 0.00011 (1/9051) to 0.00125 (1/800) (Supporting Information Figure S3). Loss of cell viability was accompanied by concentration-dependent cleavage of PARP for three of the thirteen GBFs: Halex GT, Roundup Custom, and Hi-Yield KILLZALL II (Supporting Information Figure S4).
3.3 |. MultiFlow DNA Damage Assay
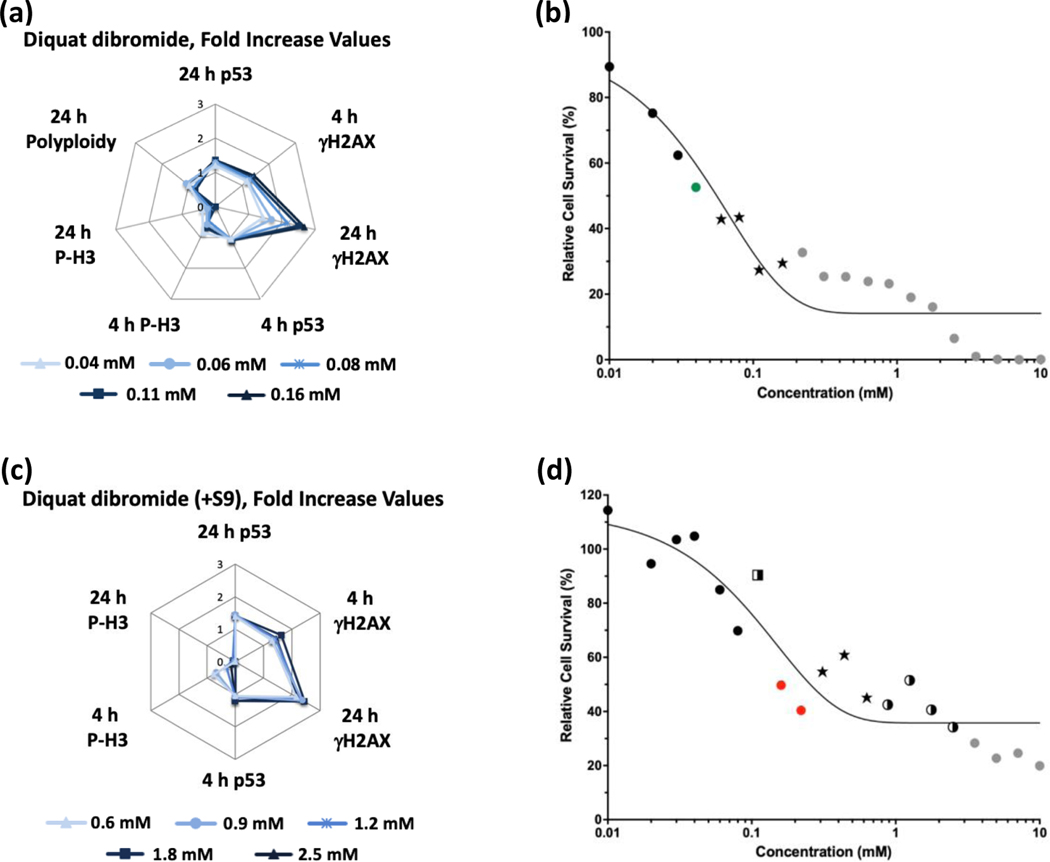
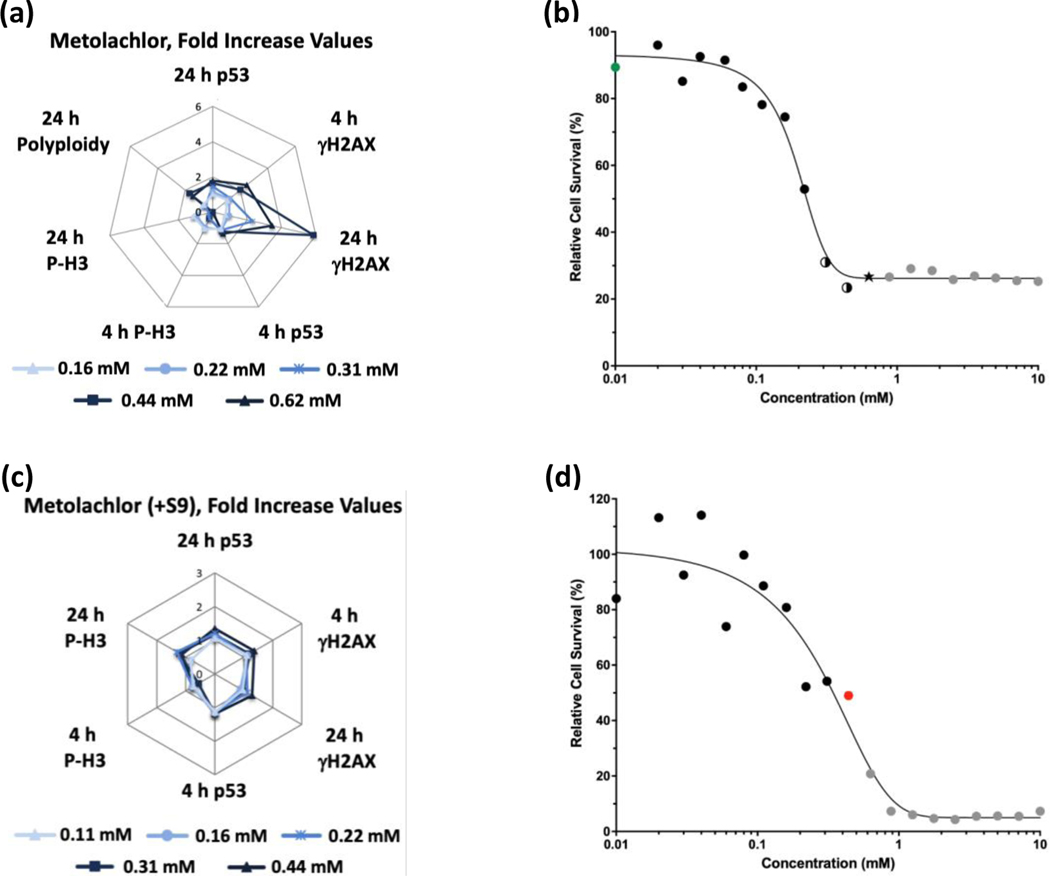
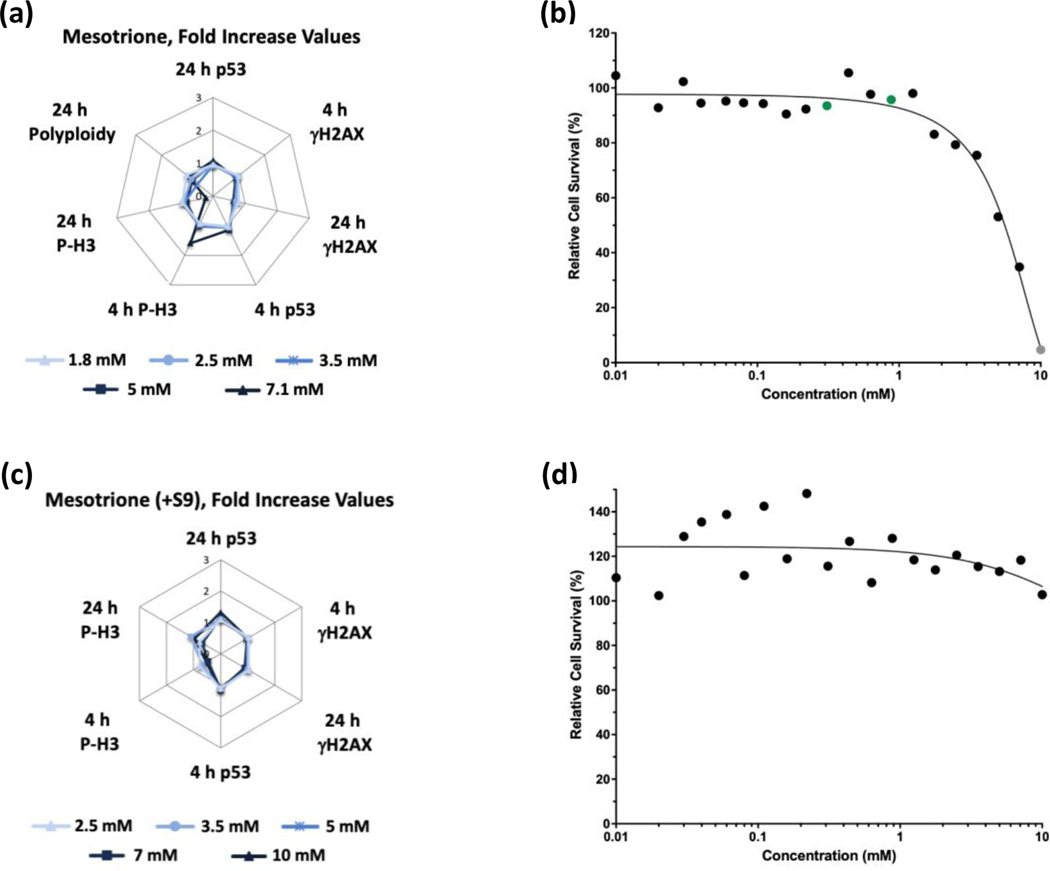
Glyphosate (Figure 1) and glyphosate IPA (Figure 2) were identified as non-genotoxic in the MultiFlow assay when tested up to 10 mM, ±S9. Glyphosate was not cytotoxic at any concentration, whereas glyphosate IPA reduced cell survival at concentrations > 2 mM, ±S9. Similar to glyphosate, AMPA was identified as non-genotoxic, and it was not cytotoxic, when tested up to 10 mM, ±S9 (Figure 3). Regarding other active ingredient herbicides listed in the GBFs that were tested, diquat dibromide (±S9) (Figure 4) and metolachlor (-S9) (Figure 5) were identified as genotoxicants with clastogenic activity. For both herbicides, the clastogenic signature was driven primarily by concentration-related increases in γH2AX at the 24-h time point. Mesotrione was identified as non-genotoxic (±S9) (Figure 6). Diquat dibromide and metolachlor were cytotoxic to TK6 cells at concentrations < 1 mM (±S9), whereas mesotrione was cytotoxic only at concentrations > 1 mM in the absence of S9, and it did not induce cytotoxicity at any concentration in the presence of S9. The summarized results of the MultiFlow assay for individual chemicals identified as genotoxicants are shown in Table 9, and the complete MultiFlow results for all individual chemicals can be accessed at the DTT Chemical Effects in Biological Systems (CEBS) database: https://doi.org/10.22427/NTP-DATA-002-02220-0014-0000-3
FIGURE 1.
MultiFlow DNA Damage assay results for glyphosate in the absence (a, b) or presence of S9 (c, d) are shown in radar charts, accompanied by relative cell survival curves. Each radar chart shows the fold increase over the vehicle control for each biomarker and time point for the five highest consecutive concentrations before meeting cytotoxicity exclusion criteria.
FIGURE 2.
MultiFlow DNA Damage assay results for glyphosate IPA in the absence (a, b) or presence of S9 (c, d) are shown in radar charts, accompanied by relative cell survival curves. Each radar chart shows the fold increase over the vehicle control for each biomarker and time point for the five highest consecutive concentrations before meeting cytotoxicity exclusion criteria. Gray circle = concentration that was excluded from analysis due to cytotoxicity (b).
FIGURE 3.
MultiFlow DNA Damage assay results for AMPA in the absence (a, b) or presence of S9 (c, d) are shown in radar charts, accompanied by relative cell survival curves. Each radar chart shows the fold increase over the vehicle control for each biomarker and time point for the five highest consecutive concentrations before meeting cytotoxicity exclusion criteria.
FIGURE 4.
MultiFlow DNA Damage assay results for diquat dibromide in the absence (a, b) or presence of S9 (c, d) are shown in radar charts, accompanied by relative cell survival curves. Each radar chart shows the fold increase over the vehicle control for each biomarker and time point for the five highest consecutive concentrations before meeting cytotoxicity exclusion criteria. Concentrations flagged for genotoxic characteristics: green circles = random forest algorithm, stars = random forest, neural network, and logistic regression algorithms; gray circles = concentrations that were excluded from analysis due to cytotoxicity (b). Concentrations flagged for genotoxic activity: red circles = neural network algorithm, two-tone squares = random forest and neural network algorithms, two-tone circles = neural network and logistic regression algorithms, stars = random forest, neural network, and logistic regression algorithms; gray circles = concentrations that were excluded from analysis due to cytotoxicity (d).
FIGURE 5.
MultiFlow DNA Damage assay results for metolachlor in the absence (a, b) or presence of S9 (c, d) are shown in radar charts, accompanied by relative cell survival curves. Each radar chart shows the fold increase over the vehicle control for each biomarker and time point for the five highest consecutive concentrations before meeting cytotoxicity exclusion criteria. Concentrations flagged for genotoxic activity: green circles = random forest algorithm, stars = random forest, neural network, and logistic regression algorithms, two-tone circles = neural network and logistic regression algorithms; gray circles indicate concentrations that were excluded from analysis due to cytotoxicity (b). Concentrations flagged for genotoxic activity: red circle = neural network algorithm; gray circles = concentrations that were excluded from analysis due to cytotoxicity (d).
FIGURE 6.
MultiFlow DNA Damage assay results for mesotrione in the absence (a, b) or presence of S9 (c, d) are shown in radar charts, accompanied by relative cell survival curves. Each radar chart shows the fold increase over the vehicle control for each biomarker and time point for the five highest consecutive concentrations before meeting cytotoxicity exclusion criteria. Concentrations flagged for genotoxic activity: green circles = random forest algorithm; gray circle = concentrations that were excluded from analysis due to cytotoxicity (b).
TABLE 9.
Summary of MultiFlow DNA Damage Assay results
| Machine Learning (ML) Ensemble | Global Evaluation Factor (GEF) Rubric | |||||||||||
|---|---|---|---|---|---|---|---|---|---|---|---|---|
| Aneugen Calls | Clastogen Calls | |||||||||||
| Chemical | +/−S9 | RFa | ANNb | LRc | RF | ANN | LR | Overall ML Genotoxicity Calls (MoAd) | Aneugen Calls | Clastogen Calls | Overall GEF Calls (MoA) | Overall ML + GEF Calls (MoA) |
|
| ||||||||||||
| Glyphosate | −S9 | - | - | - | - | - | - | Non-genotoxic | - | - | Non-genotoxic | Non-genotoxic |
| +S9 | - | - | - | - | - | - | Non-genotoxic | - | - | Non-genotoxic | Non-genotoxic | |
| Glyphosate IPA | −S9 | - | - | - | - | - | - | Non-genotoxic | - | - | Non-genotoxic | Non-genotoxic |
| +S9 | - | - | - | - | - | - | Non-genotoxic | - | - | Non-genotoxic | Non-genotoxic | |
| AMPA | −S9 | - | - | - | - | - | - | Non-genotoxic | - | - | Non-genotoxic | Non-genotoxic |
| +S9 | - | - | - | - | - | - | Non-genotoxic | - | - | Non-genotoxic | Non-genotoxic | |
| Diquat dibromide | −S9 | - | - | - | + | + | + | Clastogen | - | - | Non-genotoxic | Clastogen |
| +S9 | - | - | - | + | + | + | Clastogen | - | + | Clastogen | Clastogen | |
| Metolachlor | −S9 | - | - | - | + | + | + | Clastogen | - | + | Clastogen | Clastogen |
| +S9 | - | - | - | - | - | - | Non-genotoxic | - | - | Non-genotoxic | Non-genotoxic | |
| Mesotrione | −S9 | - | - | - | - | - | - | Non-genotoxic | - | - | Non-genotoxic | Non-genotoxic |
| +S9 | - | - | - | - | - | - | Non-genotoxic | - | - | Non-genotoxic | Non-genotoxic | |
| GBF e | ||||||||||||
| Roundup Custom | −S9 | - | - | - | + | + | + | Clastogen | - | - | Non-genotoxic | Clastogen |
| +S9 | - | - | - | - | + | - | Non-genotoxic | - | + | Equivocalf | Non-genotoxic | |
| Halex GT | −S9 | - | - | - | + | + | + | Clastogen | - | + | Equivocalf | Clastogen |
| +S9 | - | - | - | - | + | - | Non-genotoxic | - | - | Non-genotoxic | Non-genotoxic | |
RF = random forest.
ANN = artificial neural networks.
LR = linear regression.
Mode of action (MoA)
Glyphosate-based formulations (GBFs) other than Roundup Custom and Halex GT were identified as non-genotoxic by the ML ensemble and the global evaluation factor (GEF) rubric.
Although the GEF clastogen call is +, the positive result was not repeated and so the call is reported as “equivocal.”
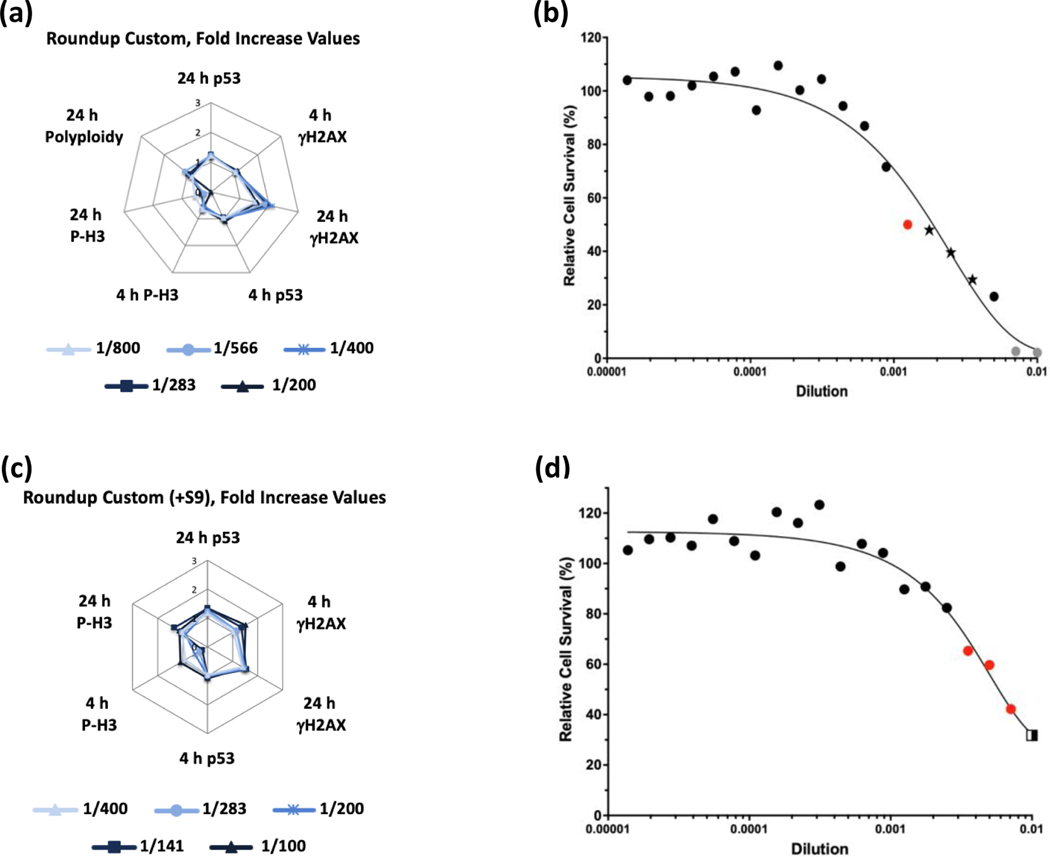
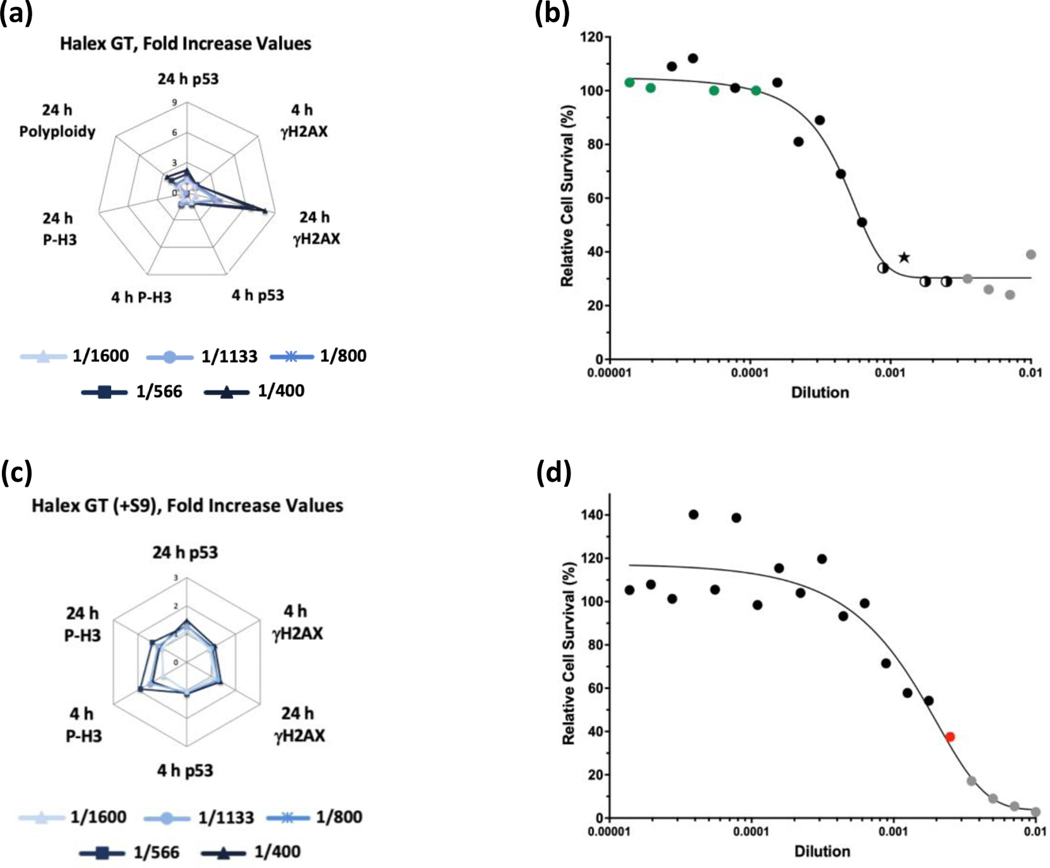
Of the GBFs, Roundup Custom (±S9) (Figure 7) and Halex GT (-S9) (Figure 8) were identified as clastogens in the MultiFlow assay. For both GBFs, in the absence of S9, the clastogenic signature was driven primarily by concentration-related increases in γH2AX at the 24-h time point. The summarized results of the MultiFlow assay for GBFs identified as genotoxicants are shown in Table 9, and the complete MultiFlow results for all GBFs can be accessed at the DTT CEBS database: https://doi.org/10.22427/NTP-DATA-002-02220-0014-0000-3
FIGURE 7.
MultiFlow DNA Damage assay results for Roundup Custom in the absence (a, b) or presence of S9 (c, d) are shown in radar charts, accompanied by relative cell survival curves. Each radar chart shows the fold increase over the vehicle control for each biomarker and time point for the five highest consecutive concentrations before meeting cytotoxicity exclusion criteria. Concentrations flagged for genotoxic activity: red circle = neural network algorithm, stars = random forest, neural network, and logistic regression algorithms; gray circles = concentrations that were excluded from analysis due to cytotoxicity (b). Concentrations flagged for genotoxic activity: red circles = neural network algorithm, two-tone square = random forest and neural network algorithms (d).
FIGURE 8.
MultiFlow DNA Damage assay results for Halex GT in the absence (a, b) or presence of S9 (c, d) are shown in radar charts, accompanied by relative cell survival curves. Each radar chart shows the fold increase over the vehicle control for each biomarker and time point for the five highest consecutive concentrations before meeting cytotoxicity exclusion criteria. Concentrations flagged for genotoxic activity: green circles = random forest algorithm, two-tone circles = neural network and logistic regression algorithms, star = random forest, neural network, and logistic regression algorithms; gray circles = concentrations that were excluded from analysis due to cytotoxicity (b). Concentrations flagged for genotoxic activity: red circle = neural network algorithm; gray circles = concentrations that were excluded from analysis due to cytotoxicity (d).
While no other GBFs were identified as having genotoxic activity in the MultiFlow assay, all GBFs were cytotoxic to TK6 cells (Supporting Information Figure S5). Although Touchdown Total produced very similar levels of cytotoxicity in the cleaved PARP assay (Supporting Information Figure S3) and in the micronucleus tests (Supporting Information Figures S9, S10, S11), it produced inconsistent cytotoxicity results in the MultiFlow assay (data not shown). Due to this issue, Touchdown Total could not be reliably tested in the MultiFlow assay.
3.4 |. In vitro micronucleus assay
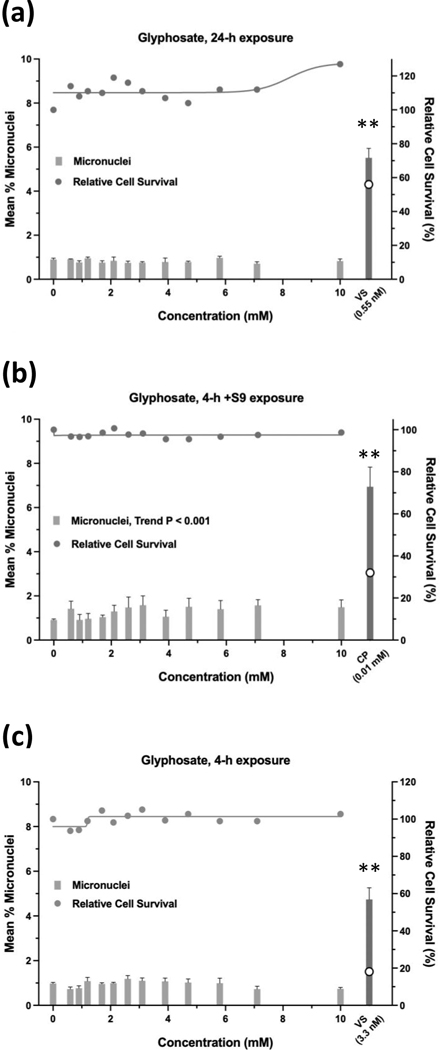
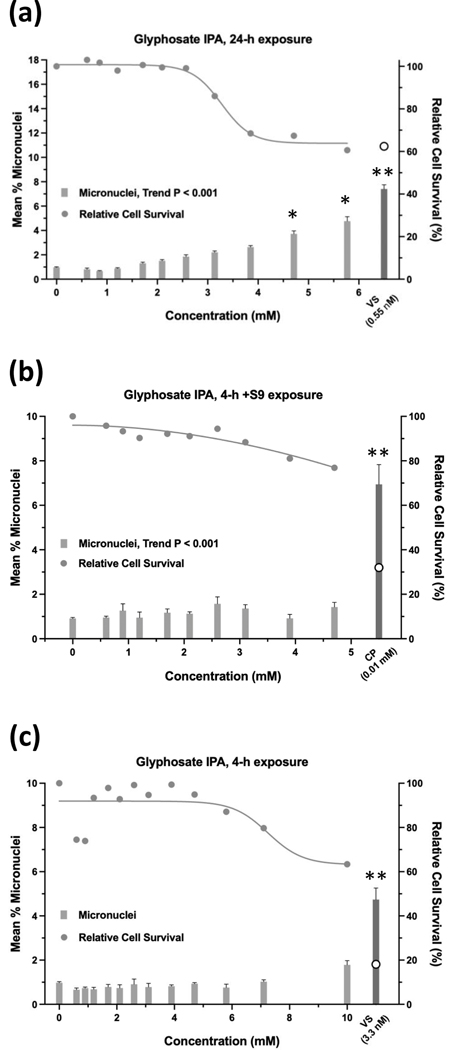
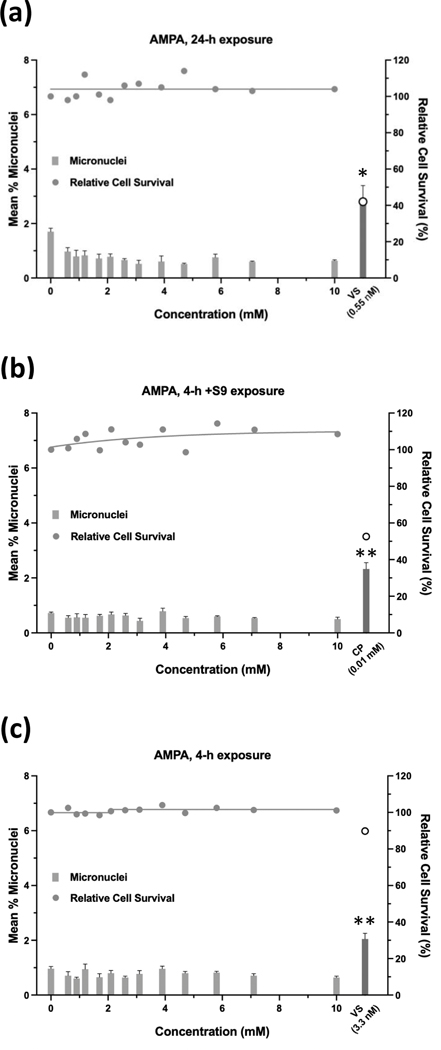
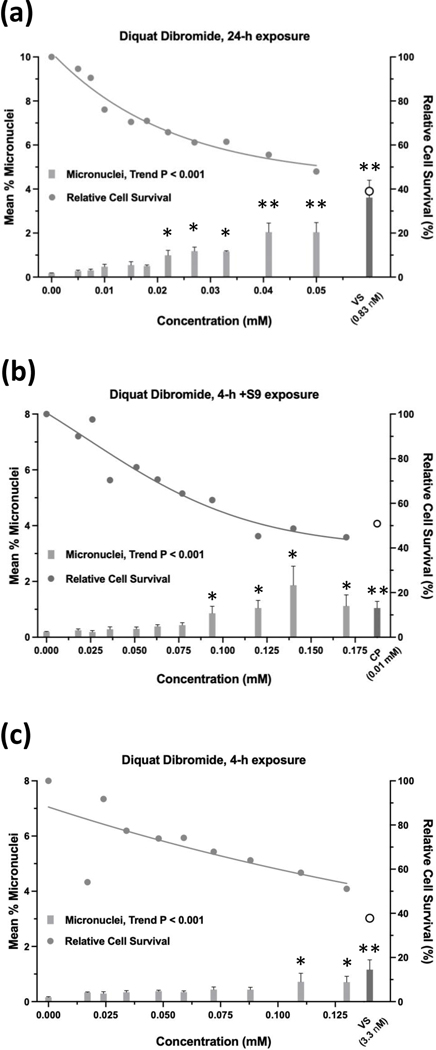
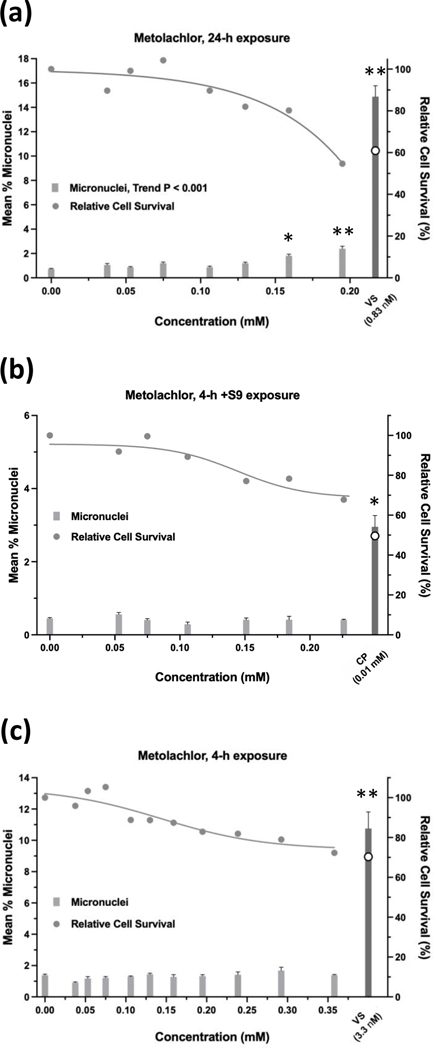
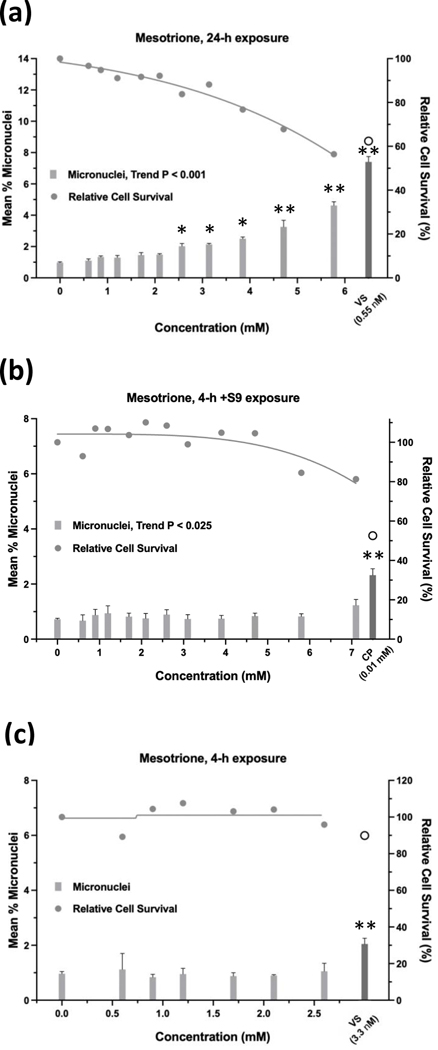
Glyphosate was judged to have an overall negative result in the micronucleus assay when tested up to 10 mM, ±S9 (Figure 9). Whereas the 24-h and 4-h exposures were negative according to statistical analysis, the 4 h +S9 exposure had a significant trend test (P < 0.001) (Figure 9b), meeting the statistical criteria for an equivocal result. However, a concentration-response was not apparent and therefore, the exposure was judged to be negative. Cell survival was not affected by glyphosate concentrations up to 10 mM, ±S9. The 24-h exposure for glyphosate IPA met statistical criteria for a positive result, with significant pairwise comparisons observed at concentrations of 4.71 mM and 5.77 mM, and a significant trend test (Figure 10). Glyphosate IPA reduced cell survival by 30 – 40% at these concentrations; 5.77 mM was the highest useable concentration for this test. The 4 h ±S9 exposures for glyphosate IPA were judged to be negative. AMPA was negative in the micronucleus assay after 24-h exposure or 4-h exposures ±S9, and it did not produce any cytotoxic effects under any of the three exposure conditions, when tested up to 10 mM (Figure 11). Diquat dibromide was positive under all three exposure conditions (Figure 12), and metolachlor (Figure 13), and mesotrione (Figure 14) were positive in the 24-h exposure condition. The cytotoxic effects of diquat dibromide, metolachlor, and mesotrione in the 24-h exposure condition were highly similar to those observed for the MultiFlow assay. Complete cytotoxicity curves obtained for glyphosate and other individual chemicals for each of the three exposure conditions are available in the Supporting Information, Figures S6, S7, and S8. The complete micronucleus data for each herbicide and AMPA can be accessed at the DTT CEBS database: https://doi.org/10.22427/NTP-DATA-002-02220-0014-0000-3
FIGURE 9.
Micronucleus assay results for glyphosate after 24 h of exposure (a), 4 h of exposure +S9 (b), or 4 h of exposure without S9 (c). VS = vinblastine sulfate, CP = cyclophosphamide; open circle indicates % relative cell survival for positive controls. Error bars indicate standard error of the mean. **P < 0.001.
FIGURE 10.
Micronucleus assay results for glyphosate IPA after 24 h of exposure (a), 4 h of exposure +S9 (b), or 4 h of exposure without S9; an outlier for %MN was omitted from the 0.6 mM concentration, statistical results were the same ± the outlier (c). VS = vinblastine sulfate, CP = cyclophosphamide; open circle indicates % relative cell survival for positive controls. Error bars indicate standard error of the mean. *P < 0.025, **P < 0.001.
FIGURE 11.
Micronucleus assay results for AMPA after 24 h of exposure (a), 4 h of exposure +S9 (b), or 4 h of exposure without S9 (c). VS = vinblastine sulfate, CP = cyclophosphamide; open circle indicates % relative cell survival for positive controls. Error bars indicate standard error of the mean. *P < 0.025, **P < 0.001.
FIGURE 12.
Micronucleus assay results for diquat dibromide after 24 h of exposure (a), 4 h of exposure +S9 (b), or 4 h of exposure without S9 (c). VS = vinblastine sulfate, CP = cyclophosphamide; open circle indicates % relative cell survival for positive controls. Error bars indicate standard error of the mean. *P < 0.025, **P < 0.001.
FIGURE 13.
Micronucleus assay results for metolachlor after 24 h of exposure (a), 4 h of exposure +S9 (b), or 4 h of exposure without S9 (c). VS = vinblastine sulfate, CP = cyclophosphamide; open circle indicates % relative cell survival for positive controls. Error bars indicate standard error of the mean. *P < 0.025, **P < 0.001.
FIGURE 14.
Micronucleus assay results for mesotrione after 24 h of exposure (a), 4 h of exposure +S9 (b), or 4 h of exposure without S9 (c). VS = vinblastine sulfate, CP = cyclophosphamide; open circle indicates % relative cell survival for positive controls. Error bars indicate standard error of the mean. *P < 0.025, **P < 0.001.
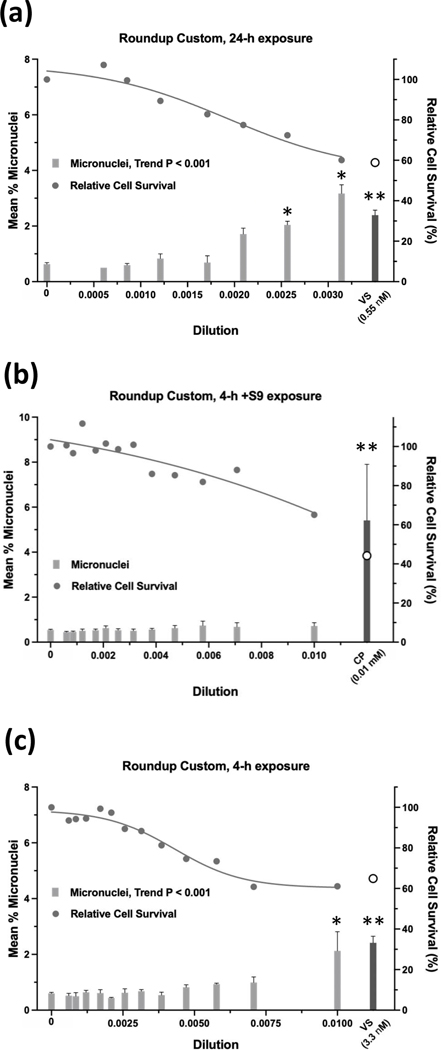
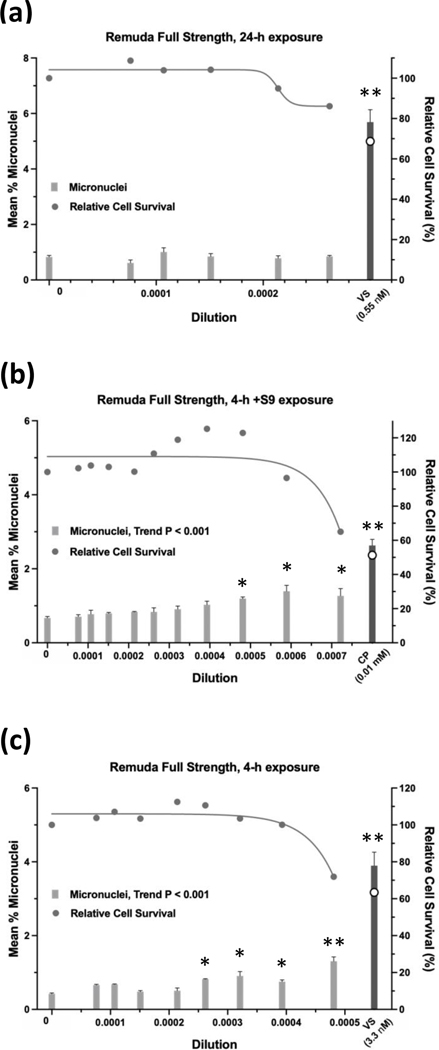
Of the 13 GBFs, Roundup Custom (Figure 15) and Remuda Full Strength (Figure 16) were judged to be weakly positive and the remaining 11 GBFs were judged to be equivocal (4), negative (6), or not determined (Halex GT) in the micronucleus assay (Table 10). Whereas the 24-h exposure data for Roundup Custom indicate a positive call due to the clear concentration-response (P < 0.001 for trend) and significant pairwise comparisons for the top two concentrations (P < 0.020 and P < 0.004 at the penultimate and top concentration, respectively), a repeat of the 24-h exposure produced an equivocal result. The 4-h exposure for Roundup Custom was also judged to be weakly positive. Although the %MN observed at the single, significant pairwise comparison was 3.5-fold greater than the vehicle control, it also occurred at the highest useable concentration of Roundup Custom before the cytotoxicity cutoff for the assay. Regarding Remuda Full Strength, although the 4-h ±S9 exposures met the criteria for a positive result, these results were judged to be weakly positive due to small absolute increases in %MN. A call was not made for Halex GT for the micronucleus assay. Halex GT was tested in two independent experiments for the 24-h and 4-h ±S9 exposures, and although all exposures had concentrations at which the relative cell survival was ≥ 40%, every concentration in all 6 experiments had levels of EMA-positive events that were ≥ 4-fold over the vehicle control. For other GBFs, usually only one concentration that did not exceed cytotoxicity limits was excluded due to excess EMA-positive events. Complete cytotoxicity curves obtained for the GBFs for the three exposure conditions used for the micronucleus assay are available in the Supporting Information, Figures S9, S10, and S11. The complete micronucleus data for all GBFs can be accessed at the DTT CEBS database: https://doi.org/10.22427/NTP-DATA-002-02220-0014-0000-3
FIGURE 15.
Micronucleus assay results for Roundup Custom after 24 h of exposure (a), 4 h of exposure +S9 (b), or 4 h of exposure without S9 (c). VS = vinblastine sulfate, CP = cyclophosphamide; open circle indicates % relative cell survival for positive controls. Error bars indicate standard error of the mean. *P < 0.025, **P < 0.001.
FIGURE 16.
Micronucleus assay results for Remuda Full Strength after 24 h of exposure (a), 4 h of exposure +S9 (b), or 4 h of exposure without S9 (c). VS = vinblastine sulfate, CP = cyclophosphamide; open circle indicates % relative cell survival for positive controls. Error bars indicate standard error of the mean. *P < 0.025, **P < 0.001.
TABLE 10.
Summary of in vitro genetic toxicity testing for glyphosate, related chemicals, and GBFs
| Test article | MultiFlow Assay | Micronucleusd Assay | Bacterial reverse mutation assays |
|---|---|---|---|
|
| |||
| Chemicals | |||
| Glyphosate | Non-genotoxic, ±S9 | Negative | Negative, ±S9 |
| Glyphosate IPA | Non-genotoxic, ±S9 | Positive | Negative, ±S9 |
| AMPA | Non-genotoxic, ±S9 | Negative | Negative, ±S9 |
| Diquat dibromide monohydrate | Clastogenic, ±S9 | Positive | Negative, ±S9 |
| Metolachlor | Clastogenic, −S9 Non-genotoxic +S9 | Positive | Negative, ±S9 |
| Mesotrione | Non-genotoxic, ±S9 | Positive | Positive, ±S9 |
| Agricultural GBFs | |||
| Buccaneer® Plus | Non-genotoxic, ±S9 | Equivocal | Negative, ±S9 |
| Cornerstone® Plus | Non-genotoxic, ±S9 | Negative | Negative, ±S9 |
| Durango DMA | Non-genotoxic, ±S9 | Equivocal | Negative, ±S9 |
| GlyStar® Plus | Non-genotoxic, ±S9 | Negative | Negative, ±S9 |
| aHalex® GT | Clastogenic, −S9 Non-genotoxic +S9 | Not Determinede | Negative, ±S9 |
| Roundup Custom® | Clastogenic, −S9 | Weakly Positive | Negative, ±S9 |
| Non-genotoxic +S9 | |||
| Roundup PowerMAX® | Non-genotoxic, ±S9 | Equivocal | Negative, ±S9 |
| Roundup WeatherMAX® | Non-genotoxic, ±S9 | Negative | Negative, ±S9 |
| Touchdown Total® | Not Determinedc | Negative | Negative, ±S9 |
| Residential GBFs | |||
| bRoundup® Weed & Grass Killer Concentrate Plus | Non-genotoxic, ±S9 | Equivocal | Negative, ±S9 |
| Roundup® Weed & Grass Killer Super Concentrate | Non-genotoxic, ±S9 | Negative | Negative, ±S9 |
| Hi-Yield® KILLZALL™ II | Non-genotoxic, ±S9 | Negative | Negative, ±S9 |
| Remuda® Full Strength | Non-genotoxic, ±S9 | Weakly positive | Negative, ±S9 |
Contains two additional herbicides: 20.5% S-metolachlor and 2.05% mesotrione.
Contains one additional herbicide: 0.73% diquat dibromide monohydrate.
Not determined due to inconsistent cytotoxicity results specifically in the MultiFlow assay compared to the cleaved PARP concentration-range finding study and the micronucleus assay.
Results from 24-h and 4-h ±S9 experiments are integrated into a single, overall call. All 6 test articles that showed activity in the micronucleus assay were active −S9, and diquat dibromide and Remuda Full Strength were also active +S9.
Two independent experiments for each of the three experimental conditions for the micronucleus assay were conducted for Halex GT. Although these experiments had concentrations that met criteria for acceptable levels of cytotoxicity, Halex GT produced excess EMA-positive events at every concentration tested for all 6 experiments.
3.5 |. Toxicokinetic analyses of glyphosate exposure
Forward and reverse dosimetry analyses for glyphosate exposure were conducted using two platforms, GastroPlus software and the U.S. EPA HTTK R package, and two sets of values for logP, HL, pKa, fu and Clint (Supporting Information “IVIVE-PBPK Analyses for Herbicides and AMPA.xlxs”). When using the GastroPlus model for forward dosimetry, a single 7 mg/kg/day daily dose was simulated over 5 days to reveal a Cmax of 0.95 μM using fu and Clint predicted from ADMET predictor, and a Cmax of 1.44 μM using fu and Clint values provided from OPERA. To estimate the EAD that would result in a plasma Cmax of 10 mM, a dose-Cmax curve was generated by simulating a series of doses ranging from 70 to 1,000,000 mg/day (1,000,000 mg is the maximum dose allowed to be used in the program) to obtain the corresponding Cmax values. The dose-Cmax curve was fit to a polynomial equation and a linear equation specifically for high doses. As the predicted EAD had exceeded the domain for the polynomial equation, the linear equation was used to estimate the EAD that would lead to plasma Cmax equivalent to 10 mM. The linear equation is Cmax = 0.1682*dose + 4907.7 (for dose >12974 mg/kg/day) when using fu and Clint values predicted from ADMET Predictor, and is Cmax = 0.2392*dose + 6,180.5 (for dose >13,228 mg/kg/day) when using fu and Clint values predicted from OPERA. The EADs are 30,276.0 and 15,967.0 mg/kg/day based on the two linear equations, respectively. There was only a ~2-fold difference in EADs between two sources for fu and Clint, indicating a limited impact of source variations in fu and Clint.
When using the httk.PBTK model for forward dosimetry, a single 7 mg/kg/day daily dose of glyphosate was simulated for 5 days (using “solve_pbtk” function) to reveal a Cmax of 42.9 μM using fu and Clint predicted from ADMET predictor, and a Cmax of 51.6 μM using fu and Clint values from OPERA. The EAD corresponding to the 10 mM concentration was calculated assuming a linear relationship between dose and Cmax. The EAD were 1,633.2 and 1,357.0 mg/kg/day, respectively. The EAD estimated using GastroPlus model were 11.8 – 18.5-fold higher than those using the httk.PBTK model for the same set of fu and Clint values, suggesting there are other factors (e.g., PBPK model structure, partition coefficients, etc.) that significantly impact the kinetics modeling between the two platforms.
Results of forward and reverse dosimetry and PBPK analyses for the other herbicides and AMPA are available in the Supporting Information file “IVIVE-PBPK Analyses for Herbicides and AMPA.xlxs.”
4 |. DISCUSSION
The DTT investigated the genotoxic potential of glyphosate and GBFs using an in vitro screening approach that covered endpoints of gene mutations and chromosomal damage to help resolve conflicting interpretations of the carcinogenic and genotoxic potential of glyphosate, and to better understand the comparative toxicities of GBFs and glyphosate alone. Overall, the results of our studies indicate that glyphosate and AMPA are not genotoxic or cytotoxic in human cells when tested up to the concentration limit of 10 mM recommended by the OECD for hazard identification (OECD, 2016) and are not mutagenic in the Ames assay when tested up to 6,000 μg/plate, ±S9, also in accordance with OECD guidance. Negative results for glyphosate in the Ames assay were consistent with testing previously conducted by the DTT (Chan & Mahler, 1992). Glyphosate was also negative in a micronucleus assay in which male and female B6C3F1 mice were exposed up to 10,800 or 12,000 mg/kg/day glyphosate, respectively, via feed for 13 weeks (Chan & Mahler, 1992). Glyphosate IPA produced a positive result in the 24-h exposure condition for the micronucleus assay but was identified as non-genotoxic in the MultiFlow assay when tested at the same concentrations. Despite reaching statistical criteria for a positive response in the micronucleus assay, increases in micronuclei occurred at concentrations (~4 to 5 mM) that approached the 10 mM testing limit recommended by the OECD (OECD, 2016). It may be possible that the positive result for glyphosate IPA in the micronucleus assay was due to IPA, which has not been tested for genotoxicity, or due to IPA improving the solubility of glyphosate, as the solubility of glyphosate IPA in water is 100-fold greater than that of glyphosate. It should be noted that several GBFs that contained glyphosate IPA were not identified as genotoxic in any of the in vitro assays used in this study. Some GBFs exhibited genotoxic activity, and herbicides other than glyphosate were active in at least one assay. A summary of the results for all of the test articles is provided in Table 10.
Estimates for human exposure to glyphosate range from 0.47 to 7 mg/kg/day (USEPA, 2017). The highest estimate, 7 mg/kg/day, was calculated for occupational handlers who mix and load GBFs without the use of personal protective equipment, and this calculation also uses the maximum application rate for high acreage agricultural crops. An exposure level of 7 mg/kg/day translates to a Cmax of 0.0067 – 0.01 mM or 0.043 – 0.052 mM for a 70 kg male human, as calculated using GastroPlus software or the EPA HTTK R-package, respectively. The estimates calculated by these approaches differ by ~8-fold due in part to a calculated absorbed fraction of 36% by the GastroPlus software, which is likely closer to the actual fraction absorbed in humans, given that absorption of glyphosate from feed is ~30 – 40% in rats (ATSDR, 2020; Chan & Mahler, 1992), whereas a more conservative assumption of 100% bioavailability is made by the HTTK R-package. Considering both estimates of Cmax, TK6 cells were exposed to a top concentration of glyphosate that was 192 – 233-fold (HTTK R-package) to 1,000 – 1,493-fold (GastroPlus) greater than what is estimated to be present in the blood of individuals experiencing the highest level of occupational exposure to glyphosate. These calculations are congruent with the conclusions of a risk assessment conducted by the Joint Food and Agriculture Organization of the United Nations/World Health Organization (FAO/WHO) Meeting on Pesticide Residues that glyphosate is unlikely to be genotoxic, and that anticipated dietary exposures to glyphosate are unlikely to cause cancer in humans (FAO & WHO, 2016).
IVIVE analyses were conducted to relate the top concentration of 10 mM glyphosate used in our assays with TK6 cells to human exposure. The EAD estimated using the httk.PBTK model was 11.8 – 18.5-fold lower than those using GastroPlus model when using the same set of fu and Clint values, suggesting IVIVE using the httk.PBTK model provides a more conservative approach for risk evaluation. Using the httk.PBTK model, an EAD of 1,357.0 – 1,633.2 mg/kg/day glyphosate was calculated for a 70 kg human to achieve a Cmax comparable to 10 mM glyphosate in cell culture. This EAD is comparable to ingestion of 95.2 – 114.6 g of glyphosate per day, or to drinking 267.3 – 321 mL of a GBF that contains 41% glyphosate (calculated based on glyphosate free acid). A significant increase in micronuclei was observed in TK6 cells exposed to 4.71 mM glyphosate IPA for 24 h. Using the httk.PBTK model, an EAD of 1,043.4 – 1,265.8 mg/kg/day glyphosate IPA was calculated for a 70 kg human to achieve a Cmax comparable to 4.71 mM glyphosate IPA in cell culture, which is comparable to ingestion of 73.0 – 88.6 g glyphosate IPA per day.
AMPA, the major microbial metabolite of glyphosate, was not genotoxic or cytotoxic to TK6 cells when tested at concentrations up to 10 mM and was not mutagenic or cytotoxic in 5 bacterial tester strains when tested up to 6,000 μg/plate, ±S9. The detection of trace amounts of AMPA in the colon and serum of rats exposed to oral administration of glyphosate (Anadón et al., 2009; Brewster et al., 1991), the conversion of glyphosate in a GBF to AMPA in a synthetic porcine microbiome (Fritz-Wallace et al., 2020), and the detection of AMPA in the serum of humans who have been poisoned by ingestion of GBFs (Han et al., 2016; Hori et al., 2003; Motojyuku et al., 2008; Zouaoui et al., 2013) all suggest that the mammalian microbiome is capable of metabolizing glyphosate to AMPA, and that AMPA can be absorbed from the gastrointestinal tract. However, when humans have been poisoned by ingesting large amounts of GBFs, the amount of AMPA detected in serum ranged from 0.2% to 2% of the amount of glyphosate detected in serum. This observation suggests that exposure to AMPA following dietary exposure to glyphosate is exceedingly low. Using the httk.PBTK model, an EAD of 871.8 – 2,816.1 mg/kg/day AMPA was calculated for a 70 kg human to achieve a Cmax comparable to 10 mM AMPA in cell culture.
Mixed results have been reported in the literature for in vitro genotoxicity studies of glyphosate and AMPA. When the existing literature is limited to quality studies with sufficient detail for independent evaluation (Eastmond, 2017), our findings of negative results for glyphosate and AMPA agree with the critical and extensive analyses of the literature conducted by others who have classified these chemicals as lacking genotoxic activity both in vitro and in vivo (ATSDR, 2020; Brusick et al., 2016; FAO & WHO, 2016; USEPA, 2020; Williams et al., 2000). Most in vitro studies of glyphosate, glyphosate salts, and AMPA in the literature were performed using the comet assay, which is a potential limitation of our study for comparison with previous findings. However, whereas the in vitro comet assay is sensitive and useful for hazard identification, it is an indicator test for DNA damage that potentially could be repaired (OECD, 2015). For this study, we tested high concentrations of these chemicals using in vitro assays (micronucleus and Ames) that detect irreversible damage to DNA and have OECD acceptance, which are factors that are given stronger consideration for regulatory decision making (Eastmond, 2017; OECD, 2015).
Three registered herbicides listed in two of the 13 GBFs that were tested showed activity in our battery of in vitro genotoxicity assays. Diquat dibromide induced significant increases in %MN (24-h and 4-h ±S9 exposures) and was identified as a clastogen in the MultiFlow assay (±S9), indicating that the increases in micronuclei are due to chromosomal damage, rather than whole chromosome loss. The genotoxic activity of diquat dibromide is likely due to an indirect effect of oxidative damage to DNA, as this chemical undergoes redox cycling in cells to produce superoxide anion and, subsequently, other reactive oxygen species (ROS). In general, chemicals that generate ROS also induce γH2AX (Bryce et al., 2016; Nikolova et al., 2014), an effect that was also observed for diquat dibromide in the MultiFlow assay. Roundup Concentrate Plus, which contains 0.73% diquat dibromide, was not genotoxic in the micronucleus or MultiFlow assays, suggesting that this concentration was insufficient to cause oxidative damage to DNA at levels detectable in either assay. These results with diquat dibromide indicate that DNA damage due to an oxidative stress MoA was detectible in our micronucleus and MultiFlow assays. The negative results for diquat dibromide (Table 6) in the Ames test battery were not unexpected, as others have reported negative results in several tester strains (Benigni et al., 1979; Levin et al., 1982). Similar to other reports, diquat dibromide was markedly cytotoxic to S. typhimurium and E. coli WP2 strains. Our findings were consistent with the USEPA’s Reregistration Eligibility Decision (RED) for diquat dibromide, which reported a positive result in a chromosomal aberration test using human blood lymphocytes and negative results in bacterial mutagenicity tests (USEPA, 1995a). Additionally, the USEPA reported that diquat dibromide was negative in a mouse bone marrow micronucleus test, indicating that the clastogenic effects observed in vitro were not observed in vivo (USEPA, 1995a). Diquat dibromide was classified as “not likely to be carcinogenic to humans” (Group E) by the USEPA due a lack of carcinogenic activity in rats and mice (USEPA, 1995a).
While metolachlor was negative in the Ames test battery, it was identified as a clastogen in the MultiFlow assay and produced a positive result in the 24-h exposure condition for the micronucleus assay at concentrations of 0.16 and 0.20 mM. Metolachlor was classified as “possibly carcinogenic to humans” (Group C) by the USEPA due to increased liver tumors in female rats. However, the USEPA RED attributed this carcinogenic response to a non-genotoxic mechanism as metolachlor was not mutagenic in several assays submitted for regulatory review, including an Ames test, the mouse lymphoma L5178Y Tk+/− assay, a micronucleus assay conducted using Chinese hamsters, and a mouse dominant lethal assay (USEPA, 1995b).
Mesotrione, which has an aromatic nitro group, was mutagenic in tester strains TA97a, TA98, TA100 (all ±S9), and TA1535 (-S9), but not in E. coli WP2 (Table 8). The mutagenicity of nitro-substituted compounds in the Ames assay is often due to activation by bacterial nitroreductases (Josephy et al., 1997; Zenno et al., 1996). It remains to be determined whether the mutagenicity of mesotrione is dependent on nitroreductase activity in S. typhimurium. Although mesotrione was clearly mutagenic in the Ames assay in this study, it was reported in a regulatory submission to the USEPA as negative in strains of S. typhimurium and in E. coli when tested up to 5,000 μg/plate (±S9). However, it was also reported as negative for gene mutations in the mouse lymphoma L5178Y Tk+/− assay when tested up to 1000 μg/ml (2.95 mM) (USEPA, 2001). Similar to glyphosate IPA, mesotrione was classified as non-genotoxic in the MultiFlow assay and positive in the 24-h exposure micronucleus test, with significant increases in %MN occurring at concentrations (2.57 mM to 5.77 mM) that were very close to the top concentration (10 mM) recommended by the OECD for in vitro testing (OECD, 2016). Considering the high concentrations at which mesotrione was active in the micronucleus assay and the negative result in the MultiFlow assay, in which mesotrione was also tested up to 10 mM, these results suggest that mesotrione has activity that could be classified as equivocal in human cells. Similar to this observation, mesotrione was judged to be equivocal in a chromosomal aberration assay when tested up to 2,000 μg/ml (5.9 mM) in human lymphocytes (USEPA, 2001). Mesotrione was negative in a mouse bone marrow micronucleus test and was classified as “not likely to be carcinogenic to humans” (Group E) by the USEPA due a lack of carcinogenic activity in rats and mice (USEPA, 2001).
Roundup Custom, Remuda Full Strength, and Halex GT, while negative in the Ames test battery, were identified as having genotoxic activity in TK6 cells. After 24 h of exposure, significant increases in %MN and signatures of clastogenic activity in the MultiFlow assay were observed over similar dilutions for Roundup Custom. Roundup Custom was also weakly positive after 4 h of exposure in the micronucleus assay (-S9). Considering that glyphosate was negative in our in vitro testing battery and that Roundup Custom does not contain herbicides other than glyphosate IPA, the genotoxic activity of this GBF is likely due to an unknown component of the formulation. Remuda Full Strength, a weak positive in the micronucleus assay, also does not contain herbicides other than glyphosate IPA. It should be noted, however, that Remuda Full Strength was identified as non-genotoxic in the MultiFlow assay. Halex GT was identified as clastogenic in the MultiFlow assay. However, Halex GT also produced excess levels of apoptosis and/or necrosis ( ≥ 4-fold over vehicle control) in the 24 h micronucleus test for every dilution tested in two independent experiments for each experimental condition, even at dilutions for which there was very little evidence of cytotoxicity as evaluated with counting beads. The same dilutions were used for the 24 h micronucleus test and the MultiFlow assay, indicating that the clastogenic activity for Halex GT in the MultiFlow assay should be interpreted with caution.
In general, evaluating the genotoxicity of GBFs was challenging due to the steep cytotoxicity curves produced by these test articles in TK6 cell cultures (e.g., Supporting Information Figures S3, S5, and S9). For the micronucleus assay in particular, despite very close spacing of dilutions, it was difficult to acquire multiple data points that ranged from low levels of cytotoxicity to the cutoff for the assay. Interpretation of results for GBFs were further complicated as many data sets showed a nearly flat concentration-response for %MN until the last, analyzable dilution for the test, which was followed by a dramatic reduction in cell survival for subsequent dilutions. A qualitative comparison of the cleaved PARP data (apoptosis) and 24-h EMA-positive events (apoptosis and necrosis) in the micronucleus assay suggests that for GBFs, cell death likely was due to necrosis arising from the cell-membrane disrupting effects of the surfactants and detergents present in formulations. However, three of the GBFs (Roundup Custom, Halex GT, and Hi-Yield KILLZALL II) also clearly induced apoptosis (cleaved PARP assay, Figure S4), suggestive of a mechanistic process for cell death, which is consistent with induction of DNA damage (increased γH2AX) by Roundup Custom (Figure 7a) and Halex GT (Figure 8a).
Components of the formulations other than glyphosate clearly contributed to the cytotoxicity of GBFs. To illustrate, the cytotoxicity curves of 8 GBFs from the MultiFlow assay were plotted by their molar concentration of glyphosate, including 4 GBFs that had the same concentration (2.11 M), the GBF that had the lowest concentration (Hi-Yield KILLZALL II, 0.08 M), the two GBFs that had the highest concentration (Roundup PowerMax and Roundup WeatherMax, 3.19 M) and Roundup Custom (2.84 M) (Supporting Information Figure S12a). Hi-Yield KILLZALL II (0.08 M glyphosate) was one of the most cytotoxic GBFs, whereas Roundup Custom (2.84 M glyphosate) was the least cytotoxic. GBFs with the same concentration of glyphosate (2.11 M) showed varying degrees of cytotoxicity. The 24-h cytotoxicity curves from the micronucleus assay are shown for the same GBFs to demonstrate that the cytotoxicity results were largely repeatable (Supporting Information Figure S12b).
5 |. CONCLUSIONS
Using an in vitro screening approach, which covered chromosomal damage in human TK6 cells with MoA information (clastogenicity versus aneugenicity), and gene mutations in bacterial mutagenicity tests, our data do not support a genotoxic mechanism of action for glyphosate or AMPA. Although some studies suggest that these chemicals may have genotoxic activity, it is not clear how these chemicals, given their lack of structural alerts associated with DNA reactivity (Brusick et al., 2016), could directly interact with or damage DNA, and mechanistic experiments have not been conducted to determine whether these chemicals are capable of interfering with, or overwhelming, DNA repair processes. Our data indicate that the genotoxic and cytotoxic effects of GBFs are not due to glyphosate and may be due to other components of formulations, such as herbicides other than glyphosate that are present in some GBFs, or one or more of the many ingredients in GBFs that are classified as inert. Notably, each of the herbicides other than glyphosate that were present in GBFs – diquat dibromide, metolachlor, and mesotrione – showed genotoxic activity in at least one of our assays, although according to regulatory submissions to the USEPA, all three were reported as negative for induction of micronuclei in vivo, and only metolachor was categorized by the USEPA to be a rodent carcinogen with a non-genotoxic MoA (USEPA, 1995a; USEPA, 1995b; USEPA, 2001). In vivo testing of GBFs that showed in vitro genotoxic activity in this study are needed to better understand risk for human exposure (Eastmond, 2017). The cytotoxicity of GBFs is likely due to the presence of surfactants and detergents, which compromise cell membranes leading to necrosis; however, three of the GBFs clearly induced apoptosis, suggesting they contain ingredients that induce controlled, programmed cell death. Lastly, an IVIVE analysis of glyphosate indicated that an adult, 70 kg human would need to ingest large amounts of glyphosate (e.g., 95 – 115 g glyphosate, or about half a liter of a formulation that is 41% glyphosate) to achieve the same amount of glyphosate in blood as the top concentration of glyphosate (10 mM) that was tested in human TK6 cells and found to be non-genotoxic. Ingesting approximately half a liter of glyphosate formulation is lethal to humans, with toxicity most likely due to the surfactants in glyphosate formulations (Roberts et al., 2010; Tominack et al., 1991). These findings suggest that glyphosate does not pose a genotoxic hazard to humans.
Supplementary Material
ACKNOWLEDGMENTS
We have many people to thank for their contributions to this manuscript: staff at ILS, including Keith Burke, Jasmine Fowler, Sarah Macris, Angela Rauer, and Kim Shepard, for their technical expertise in performing the genetic toxicity assays and preparing dosing formulations; Dr. Jeffrey C. Bemis, Dr. Stephen D. Dertinger, and Mr. Steven M. Bryce for technical discussions of results obtained using Litron assay kits; Dr. Kamel Mansouri and Dr. B. Alex Merrick at the DTT for their careful reviews of the manuscript, and we wish to express our appreciation for the insightful comments provided by the anonymous reviewers. This research was supported by the Intramural Research Program of the NIH, National Institute of Environmental Health Sciences ES103318-06 and the National Toxicology Program, National Institutes of Environmental Health Sciences, National Institutes of Health, US Department of Health and Human Services: HHSN273201300009C (Genetic Toxicity Testing Contract), HHSN273201400020C (MRIGlobal Chemistry Contract), HHSN273201600011C (Statistical Support Contract) and HHSN273201500006C (Quality Assurance Contract).
List of Abbreviations
- AMPA
(Aminomethyl)phosphonic acid
- CEBS
Chemical Effects in Biological Systems
- DTT
Division of Translational Toxicology
- EAD
Equivalent administered dose
- EMA
Ethidium monoazide
- GBF
Glyphosate-based formulation
- GEF
Global evaluation factor
- HTTK
High throughput toxicokinetics
- IARC
International Agency for Research on Cancer
- ILS
Integrated Laboratory Systems
- IPA
Isopropylamine
- IVIVE
In vitro to in vivo extrapolation
- ML
Machine learning
- MoA
Mode of Action
- OECD
Organisation for Economic Cooperation and Development
- OPERA
Open (Quantitative) Structure-activity/property Relationship App
- PARP
Poly-ADP ribose polymerase
- PBPK
Physiologically based pharmacokinetics
- RNC
Relative nuclei count
Footnotes
STATEMENT OF AUTHOR CONTRIBUTIONS
SLS and KLW designed the study and analyzed the data. SLS drafted the manuscript. SLS, CDS, XC, NSS, KRS, SFH, GJL, BJC, EM, and KLW edited the manuscript. CDS contributed to experimental design and conducted the genotoxicity tests. NCC, AR, and JES contributed to acquisition and analysis of in vitro micronucleus data and the bacterial mutagenicity data. XC and NSS conducted IVIVE and PBPK analyses. KRS, SFH, SJM, and GJL designed the statistical analyses used for the micronucleus test data. BJC and EM obtained chemicals and provided chemistry expertise.
DECLARATION OF CONFLICTS OF INTEREST
The authors declare that they have nothing to disclose.
SUPPORTING INFORMATION
Additional information may be found online in the Supporting Information section at the end of this article.
REFERENCES
- Anadón A, Martínez-Larrañaga MR, Martínez MA, Castellano VJ, Martínez M, Martin MT et al. (2009) Toxicokinetics of glyphosate and its metabolite aminomethyl phosphonic acid in rats. Toxicol Lett, 190(1), 91–95. [DOI] [PubMed] [Google Scholar]
- ATSDR (Agency for Toxic Substances and Disease Registry). (2020) Toxicological profile for glyphosate. https://www.atsdr.cdc.gov/toxprofiles/tp214.pdf [accessed 10 March 2022]. [PubMed]
- Benbrook CM (2016) Trends in glyphosate herbicide use in the United States and globally. Environ Sci Eur, 28(1), 3. [DOI] [PMC free article] [PubMed] [Google Scholar]
- Benigni R, Bignami M, Carere A, Conti G, Conti L, Crebelli R. et al. (1979) Mutational studies with diquat and paraquat in vitro. Mutat Res, 68(3), 183–193. [DOI] [PubMed] [Google Scholar]
- Bentley R. (1990) The shikimate pathway--a metabolic tree with many branches. Crit Rev Biochem Mol Biol, 25(5), 307–384. [DOI] [PubMed] [Google Scholar]
- Bernacki DT, Bryce SM, Bemis JC, Kirkland D. & Dertinger SD (2016) γH2AX and p53 responses in TK6 cells discriminate promutagens and nongenotoxicants in the presence of rat liver S9. Environ Mol Mutagen, 57(7), 546–558. [DOI] [PMC free article] [PubMed] [Google Scholar]
- Brewster DW, Warren J. & Hopkins WE, 2nd. (1991) Metabolism of glyphosate in Sprague-Dawley rats: tissue distribution, identification, and quantitation of glyphosate-derived materials following a single oral dose. Fundam Appl Toxicol, 17(1), 43–51. [DOI] [PubMed] [Google Scholar]
- Brusick D, Aardema M, Kier L, Kirkland D. & Williams G. (2016) Genotoxicity Expert Panel review: weight of evidence evaluation of the genotoxicity of glyphosate, glyphosate-based formulations, and aminomethylphosphonic acid. Crit Rev Toxicol, 46(sup1), 56–74. [DOI] [PubMed] [Google Scholar]
- Bryce SM, Bernacki DT, Bemis JC & Dertinger SD (2016) Genotoxic mode of action predictions from a multiplexed flow cytometric assay and a machine learning approach. Environ Mol Mutagen, 57(3), 171–189. [DOI] [PMC free article] [PubMed] [Google Scholar]
- Bryce SM, Bernacki DT, Bemis JC, Spellman RA, Engel ME, Schuler M. et al. (2017) Interlaboratory evaluation of a multiplexed high information content in vitro genotoxicity assay. Environ Mol Mutagen, 58(3), 146–161. [DOI] [PMC free article] [PubMed] [Google Scholar]
- Chan P. & Mahler J. (1992) NTP technical report on the toxicity studies of glyphosate (CAS No. 1071–83-6) administered in dosed feed to F344/N rats and B6C3F1 mice. Toxic Rep Ser, 16, 1–d3. [PubMed] [Google Scholar]
- Eastmond DA (2017) Recommendations for the evaluation of complex genetic toxicity data sets when assessing carcinogenic risks to humans. Environ Mol Mutagen, 58(5), 380–385. [DOI] [PubMed] [Google Scholar]
- EFSA. (2015a) Conclusion on the peer review of the pesticide risk assessment of the active substance glyphosate. EFSA J, 13(11), 4302. [Google Scholar]
- EFSA (European Food Safety Authority). (2015b) Glyphosate: EFSA updates toxicological profile. https://www.efsa.europa.eu/en/press/news/151112 [accessed 10 March 2022].
- FAO & WHO (Joint Food and Agriculture Organization, World Health Organization). (2016) Pesticide residues in food - 2016: toxicological evaluations -- Joint FAO/WHO meeting on pesticide residues. https://www.who.int/publications/i/item/9789241655323 [accessed 1 Aug 2022].
- Fritz-Wallace K, Engelmann B, Krause JL, Schäpe SS, Pöppe J, Herberth G. et al. (2020) Quantification of glyphosate and aminomethylphosphonic acid from microbiome reactor fluids. Rapid Commun Mass Spectrom, 34(7), e8668. [DOI] [PubMed] [Google Scholar]
- Guyton KZ, Loomis D, Grosse Y, El Ghissassi F, Benbrahim-Tallaa L, Guha N. et al. (2015) Carcinogenicity of tetrachlorvinphos, parathion, malathion, diazinon, and glyphosate. Lancet Oncol, 16(5), 490–491. [DOI] [PubMed] [Google Scholar]
- Han J, Moon H, Hong Y, Yang S, Jeong WJ, Lee KS et al. (2016) Determination of glyphosate and its metabolite in emergency room in Korea. Forensic Sci Int, 265, 41–46. [DOI] [PubMed] [Google Scholar]
- Hori Y, Fujisawa M, Shimada K. & Hirose Y. (2003) Determination of the herbicide glyphosate and its metabolite in biological specimens by gas chromatography-mass spectrometry. A case of poisoning by roundup herbicide. J Anal Toxicol, 27(3), 162–166. [DOI] [PubMed] [Google Scholar]
- IARC (International Agency for Research on Cancer). (2017) IARC Working Group on the Evaluation of Carcinogenic Risks to Humans. Some organophosphate insecticides and herbicides. IARC Monographs on the Evaluation of Carcinogenic Risks to Humans, Vol 112. Lyon, France: International Agency for Research on Cancer. [Google Scholar]
- Josephy PD, Gruz P. & Nohmi T. (1997) Recent advances in the construction of bacterial genotoxicity assays. Mutat Res, 386(1), 1–23. [DOI] [PubMed] [Google Scholar]
- Levin DE, Hollstein M, Christman MF, Schwiers EA & Ames BN (1982) A new Salmonella tester strain (TA102) with A X T base pairs at the site of mutation detects oxidative mutagens. Proc Natl Acad Sci U S A, 79(23), 7445–7449. [DOI] [PMC free article] [PubMed] [Google Scholar]
- Mansouri K, Grulke CM, Judson RS & Williams AJ (2018) OPERA models for predicting physicochemical properties and environmental fate endpoints. J Cheminform, 10(1), 10. [DOI] [PMC free article] [PubMed] [Google Scholar]
- Mortelmans K. & Zeiger E. (2000) The Ames Salmonella/microsome mutagenicity assay. Mutat Res, 455(1–2), 29–60. [DOI] [PubMed] [Google Scholar]
- Motojyuku M, Saito T, Akieda K, Otsuka H, Yamamoto I. & Inokuchi S. (2008) Determination of glyphosate, glyphosate metabolites, and glufosinate in human serum by gas chromatography-mass spectrometry. J Chromatogr B Analyt Technol Biomed Life Sci, 875(2), 509–514. [DOI] [PubMed] [Google Scholar]
- Nikolova T, Dvorak M, Jung F, Adam I, Krämer E, Gerhold-Ay A. et al. (2014) The γH2AX assay for genotoxic and nongenotoxic agents: comparison of H2AX phosphorylation with cell death response. Toxicol Sci, 140(1), 103–117. [DOI] [PubMed] [Google Scholar]
- OECD (Organisation for Economic Cooperation and Development). (1997) Test No. 471: Genetic toxicology: bacterial reverse mutation test. Ninth Addendum to the OECD Guidelines for the Testing of Chemicals, Section 4. Paris: OECD Publishing. [Google Scholar]
- OECD (Organisation for Economic Cooperation and Development). (2015) Guidance Document on Revisions to OECD Genetic Toxicology Test Guidelines. OECD Publishing, https://www.oecd.org/chemicalsafety/testing/Genetic%20Toxicology%20Guidance%20Document%20Aug%2031%202015.pdf [accessed 10 Oct 2022]. [Google Scholar]
- OECD (Organisation for Economic Cooperation and Development). (2016) Test No. 487: In vitro mammalian cell micronucleus test. OECD Guidelines for the Testing of Chemicals, Section 4. Paris: OECD Publishing. [Google Scholar]
- Pearce RG, Setzer RW, Strope CL, Wambaugh JF & Sipes NS (2017) httk: R package for high-throughput toxicokinetics. J Stat Softw, 79(4), 1–26. [DOI] [PMC free article] [PubMed] [Google Scholar]
- Pollegioni L, Schonbrunn E. & Siehl D. (2011) Molecular basis of glyphosate resistance-different approaches through protein engineering. FEBS J, 278(16), 2753–2766. [DOI] [PMC free article] [PubMed] [Google Scholar]
- Richards TA, Dacks JB, Campbell SA, Blanchard JL, Foster PG, McLeod R. et al. (2006) Evolutionary origins of the eukaryotic shikimate pathway: gene fusions, horizontal gene transfer, and endosymbiotic replacements. Eukaryot Cell, 5(9), 1517–1531. [DOI] [PMC free article] [PubMed] [Google Scholar]
- Roberts DM, Buckley NA, Mohamed F, Eddleston M, Goldstein DA, Mehrsheikh A. et al. (2010) A prospective observational study of the clinical toxicology of glyphosate-containing herbicides in adults with acute self-poisoning. Clin Toxicol (Phila), 48(2), 129–136. [DOI] [PMC free article] [PubMed] [Google Scholar]
- Schönbrunn E, Eschenburg S, Shuttleworth WA, Schloss JV, Amrhein N, Evans JN et al. (2001) Interaction of the herbicide glyphosate with its target enzyme 5-enolpyruvylshikimate 3-phosphate synthase in atomic detail. Proc Natl Acad Sci U S A, 98(4), 1376–1380. [DOI] [PMC free article] [PubMed] [Google Scholar]
- Smith MT, Guyton KZ, Gibbons CF, Fritz JM, Portier CJ, Rusyn I. et al. (2016) Key characteristics of carcinogens as a basis for organizing data on mechanisms of carcinogenesis. Environ Health Perspect, 124(6), 713–721. [DOI] [PMC free article] [PubMed] [Google Scholar]
- Tominack RL, Yang GY, Tsai WJ, Chung HM & Deng JF (1991) Taiwan National Poison Center survey of glyphosate--surfactant herbicide ingestions. J Toxicol Clin Toxicol, 29(1), 91–109. [DOI] [PubMed] [Google Scholar]
- USEPA (United States Environmental Protection Agency). (1989) Integrated Risk Information System (IRIS) chemical assessment summary for glyphosate; CASRN 1071–83-6. Washington, DC: National Center for Environmental Assessment, https://cfpub.epa.gov/ncea/iris/iris_documents/documents/subst/0057_summary.pdf [accessed 10 March 2022]. [Google Scholar]
- USEPA (United States Environmental Protection Agency). (1993) USEPA Reregistration Eligibility Decision (RED): Glyphosate; EPA-738-R-93–014. Washington, DC: U.S. Environmental Protection Agency, Office of Prevention, Pesticides, and Toxic Substances, Office of Pesticide Programs, U.S. Government Printing Office, https://archive.epa.gov/pesticides/reregistration/web/pdf/0178fact.pdf [accessed 10 March 2022]. [Google Scholar]
- USEPA (United States Environmental Protection Agency). (1995a) Reregistration Eligibility Decision (RED) Diquat Dibromide. https://archive.epa.gov/pesticides/reregistration/web/pdf/0288.pdf [accessed 10 March 2022].
- USEPA (United States Environmental Protection Agency). (1995b) Reregistration Eligibility Decision (RED) Metolachlor. https://archive.epa.gov/pesticides/reregistration/web/pdf/0001.pdf [accessed 10 March 2022].
- USEPA (United States Environmental Protection Agency). (2001) Mesotrione Registration Toxicology Disciplinary Chapter. https://www3.epa.gov/pesticides/chem_search/cleared_reviews/csr_PC-122990_2-Aug-01_124.pdf [accessed 10 March 2022].
- USEPA (United States Environmental Protection Agency). (2012) 2012 Edition of the Drinking Water Standards and Health Advisories. Washington, DC: Office of Water, USEPA, https://nepis.epa.gov/Exe/ZyPDF.cgi/P100N01H.PDF?Dockey=P100N01H.PDF [accessed 10 March 2022]. [Google Scholar]
- USEPA (United States Environmental Protection Agency). (2017) EPA’s evaluation of the carcinogenic potential of glyphosate. EPA’s Office of Pesticide Programs, https://nepis.epa.gov/Exe/ZyPURL.cgi?Dockey=P1011WS1.txt [accessed 10 March 2022].
- USEPA (United States Environmental Protection Agency). (2019) Glyphosate Proposed Interim Registration Review Decision Case Number 0178. https://www.regulations.gov/document?D=EPA-HQ-OPP-2009-0361-2344 [accessed 10 March 2022].
- USEPA (United States Environmental Protection Agency). (2020) Glyphosate: Interim Registration Review Decision: Case Number 0178. https://www.epa.gov/sites/production/files/2020-01/documents/glyphosate-interim-reg-review-decision-case-num-0178.pdf [accessed 10 March 2022].
- USEPA (United States Environmental Protection Agency). (2021) Pesticide Registration Manual. https://www.epa.gov/pesticide-registration/pesticide-registration-manual [accessed 10 March 2022].
- Williams GM, Kroes R. & Munro IC (2000) Safety evaluation and risk assessment of the herbicide Roundup and its active ingredient, glyphosate, for humans. Regul Toxicol Pharmacol, 31(2 Pt 1), 117–165. [DOI] [PubMed] [Google Scholar]
- Zeiger E, Anderson B, Haworth S, Lawlor T. & Mortelmans K. (1992) Salmonella mutagenicity tests: V. Results from the testing of 311 chemicals. Environ Mol Mutagen, 19 Suppl 21, 2–141. [DOI] [PubMed] [Google Scholar]
- Zenno S, Koike H, Kumar AN, Jayaraman R, Tanokura M. & Saigo K. (1996) Biochemical characterization of NfsA, the Escherichia coli major nitroreductase exhibiting a high amino acid sequence homology to Frp, a Vibrio harveyi flavin oxidoreductase. J Bacteriol, 178(15), 4508–4514. [DOI] [PMC free article] [PubMed] [Google Scholar]
- Zouaoui K, Dulaurent S, Gaulier JM, Moesch C. & Lachâtre G. (2013) Determination of glyphosate and AMPA in blood and urine from humans: about 13 cases of acute intoxication. Forensic Sci Int, 226(1–3), e20–25. [DOI] [PubMed] [Google Scholar]
Associated Data
This section collects any data citations, data availability statements, or supplementary materials included in this article.


