

Abstract
The media has been used to disseminate public information amid the Covid-19 pandemic. However, the Covid-19 news has triggered emotional responses in people that have impacted their mental well-being and led to news avoidance. To understand the emotional response to the Covid-19 news, we study user comments on the news published on Twitter by 37 media outlets in 11 countries from January 2020 to December 2022. We employ a deep-learning-based model to identify one of the 6 Ekman’s basic emotions, or the absence of emotional expression, in comments to the Covid-19 news, and an implementation of Latent Dirichlet Allocation (LDA) to identify 12 different topics in the news messages. Our analysis finds that while nearly half of the user comments show no significant emotions, negative emotions are more common. Anger is the most common emotion, particularly in the media and comments about political responses and governmental actions in the United States. Joy, on the other hand, is mainly linked to media outlets from the Philippines and news on vaccination. Over time, anger is consistently the most prevalent emotion, with fear being most prevalent at the start of the pandemic but decreasing and occasionally spiking with news of Covid-19 variants, cases, and deaths. Emotions also vary across media outlets, with Fox News having the highest level of disgust, the second-highest level of anger, and the lowest level of fear. Sadness is highest at Citizen TV, SABC, and Nation Africa, all three African media outlets. Also, fear is most evident in the comments to the news from The Times of India.
Keywords: Covid-19, News, Emotion, Twitter, Media, Topic modeling, Deep learning
Graphical abstract
1. Introduction
In response to the global outbreak of the coronavirus disease (Covid-19), a staggering 656 million cases and over 6.6 million deaths have been reported worldwide as of 2023 [1]. On March 11, 2020, the World Health Organization (WHO) declared the Covid-19 outbreak a pandemic, resulting in widespread educational, economic, and social impacts across the globe [2]. To mitigate the spread of the highly transmissible respiratory disease, the primary preventive measures include vaccination and non-pharmacological interventions (NPIs), such as wearing masks and practicing social distancing.
To ensure the success of proposed interventions, it is crucial that they are widely adopted by the public. The media’s framing of health messages plays a vital role in shaping the community’s perception of emerging public health issues [3], [4]. However, Covid-19 news often contains distressing content, such as death tolls, which can contribute to negative emotions in the audience [5], [6], [7]. This can discourage people from following the news, potentially limiting the effectiveness of crisis mitigation measures [8]. Hence, analyzing the emotional response amongst societies worldwide to Covid-19 news is crucial for authorities and the media to communicate risks and prevention advice related to public health emergencies effectively [9], [10]. Further, as highlighted in a recent review [6], understanding the emotional responses of social media users is important for informing policy and intervention strategies to enhance population mental health.
Natural language processing (NLP) techniques have been used to investigate the sentiments in the Covid-19 news headlines [11], [12], and emotions among user posts on social networks [13], [14]. NLP studies have identified correlations between emotions in news tweets and user responses, and provided valuable insights into how these patterns evolved as the pandemic unfolded [5]. Qualitative research has also been conducted on this topic [15]. Our earlier work [16] explored the emotional responses of the audience to the news by using topic modeling and emotion detection. However, we just covered the period ranging from Jan 2020 to Apr 2021 and were able to identify only four different emotions. This research aims to enhance our previous work by expanding the research period, exploiting a model for detecting a broader set of emotions, and using statistical tests to validate the strength of our findings. Hence, we formulated the following research questions:
(RQ1): What are the prevalent emotions in user responses to the Covid-19 news?
(RQ2): How does the distribution of the emotions in user responses to the Covid-19 news change over time?
(RQ3): What are the Covid-19 news topics and how are the emotions distributed across them?
(RQ4): How does the distribution of the emotions in user responses to the Covid-19 news change across different countries?
(RQ5): How does the distribution of the emotions in user responses to the Covid-19 news change over different media outlets?
To answer these questions, we utilize a Latent Dirichlet Allocation (LDA) [17] implementation to identify news topics and a pre-trained deep-learning-based model to assign an emotion to each comment based on what is communicated in its text. Emotional dominance is explored across time periods, geographic regions, media outlets, and news topics. According to the research on user comments, while half of the comments do not exhibit significant emotions, negative emotions outnumber positive ones, with anger being the most prevalent and joy being the least.
The prevalence of emotions varied based on the news topic and source. Anger is most often expressed in comments regarding political responses and government actions, while joy is primarily linked to news about vaccination. The prevalence of fear in comments is highest at the beginning of the pandemic and decreases over time, with occasional spikes around announcements of new Covid-19 variants (e.g., the Omicron variant in Dec 2021). The media outlets Pulse Nigeria, Fox News, and MSNBC are associated with the highest levels of anger, while ABS-CBN and GMA from the Philippines have the highest levels of joy. Meanwhile, Citizen TV (Kenya), SABC (South Africa), and Nation Africa (Kenya) have the highest incidence of sadness, and The Times of India elicited the most fear in user comments.
The remainder of the paper is organized as follows. Section 2 gives an overview of the related work. Section 3 describes our methodology, and Section 4 presents our findings, followed by a discussion in Section 5. Section 6 then presents the limitations of our study and threats to validity. We conclude the paper in Section 7 with some general remarks.
2. Background and related work
Sentiments and topics on social media can be a good proxy for public opinion. For instance, data from social media, such as Twitter, replicate consumer confidence and Presidential job approval polls [18]. Twitter user sentiments tend to be more predictive of the upcoming election than mainstream news media opinion polls [19]. Twitter has been used as a sentinel tool to monitor public opinion on vaccination [20], as a tool to analyze social movement [21], as an early warning and risk communication tool in a pandemic [22], for capturing public reaction to government implemented restrictions [23], and to detect themes of public concern for a disease [24].
Moreover, Twitter has previously been used in research by Weng and Lee [25] for event detection. In addition, Sinnenberg et al. [26] mapped 137 studies that used data from Twitter for health research. One way of structuring data obtained from social networks such as Twitter is through unsupervised clustering, also known in the case of textual data as topic modeling. Despite being developed 20 years ago, Churchill and Singh [27] note that Latent Dirichlet Allocation (LDA) is a useful general-purpose topic model and that many of the best models used today are LDA modifications to take into account these contemporary issues.
Qiang et al. [28] argue against using LDA to analyze short text such as tweets. They argue that LDA captures the semantic structures based on patterns of co-occurrence of words in documents, and as this occurs less frequently in short texts, its performance could degrade. Advanced Natural Language Processing (NLP) deep learning techniques are also used for topic modeling [29]. However, Chauhan and Shah [30] reinforce that LDA is still the most widely used topic modeling technique.
Another NLP task used for extracting knowledge from text data is text classification, which can be used, for example, in detecting feelings and emotions [31]. While sentiment analysis provides a general polarity (positive or negative) of sentiments in a text, emotion recognition gives a more fine-grained analysis of the emotional (i.e., affectual) state of the author of the text. A discrete model of emotions that is widely used is the Ekman model [32], which defines six universal human emotions (joy, sadness, anger, disgust, surprise, and fear).
Multiple artificial intelligence methods are trained over labeled datasets built using emotion models and can be used for emotion detection from text. For instance, recent methods include lexicon-based emotion extraction using a generative unigram mixture model [33], deep attentive RNNs with transfer learning [34], and combining a fully connected neural network architecture with a BiLSTM neural network [35]. In this work, we use a public checkpoint of a DistilRoBERTa-base architecture [36], previously fine-tuned on a combination of multiple datasets representing a diverse collection of text types, to predict Ekamn’s six basic emotions, plus a neutral class [37]. The evaluation accuracy is 66% (vs. the random-chance baseline of 1/7 = 14%).
In the context of the Covid-19 pandemic, Ghasiya and Okamura [11] investigate more than 100,000 news headlines and articles from four countries and find the UK as the country with the highest percentage of negative sentiments. They use a semantic search-based model to identify topics in the data and fine-tune the RoBERTa-Base model for sentiment analysis. Xue et al. [14], [39] examine Covid-19–related discussions and sentiments in tweets. They use LDA to identify topics and a lexicon-based method [40] for emotion classification, finding that anticipation is the dominant emotion, while fear is relevant when the tweet relates to reports of new Covid-19 cases. Kim, Cho, and Locascio [15] use a nationally representative survey of South Korean adults to discover that media exposure influences the adoption of pandemic prevention measures as well as the prevalence of negative emotions among media audiences. Differently, we aim to investigate the emotional response of the audience to the media coverage.
Our previous work [16] also investigated the prevalence of emotions in user responses to Covid-19 news posts on Twitter from English-speaking media across multiple countries. In this work, we collect data over a longer period, detect more fine-grained emotions, and use statistical tools to assess our findings further. Moreover, Overgaard and Bruun [7] presented different types of headlines to 492 subjects and observed that positive and constructive headlines led to less anger and anxiety than negative headlines. Eisele et al. [10] investigate about 40,000 news and 1.6 million user comments for those news in the first semester of the pandemic in Austria; results show increased emotionality during the lockdown against the government.
The study by Ebeling et al. [41] shows that political polarization in Brazil influences both anti and pro-vaccination attitudes. Buneviciene et al. [8] discover that an increasing number of people (37%) are losing interest in COVID-19-related news, beginning to avoid it (32%) or have stopped following COVID-19 news entirely (26%) based on a survey of 1036 participants. The Reuters Institute [38] points out that the excess of content about politics and Covid-19 is the reason for avoiding the consumption of news (Fig. 1).
Fig. 1.

News avoidance in Reuters’ Digital News Report, 2022 [38].
Though the Covid-19 pandemic has been the target of extensive research, the public’s emotional response to the media coverage has not been adequately characterized. In this work, we analyze user comments on Covid-19-related news on Twitter from users in a broad set of English-speaking countries. Then, we report the prevalence of emotions on user comments, using settings that include changes over time, country of origin, news tweets topic, and publisher. More details are presented in the following section.
3. Methodology
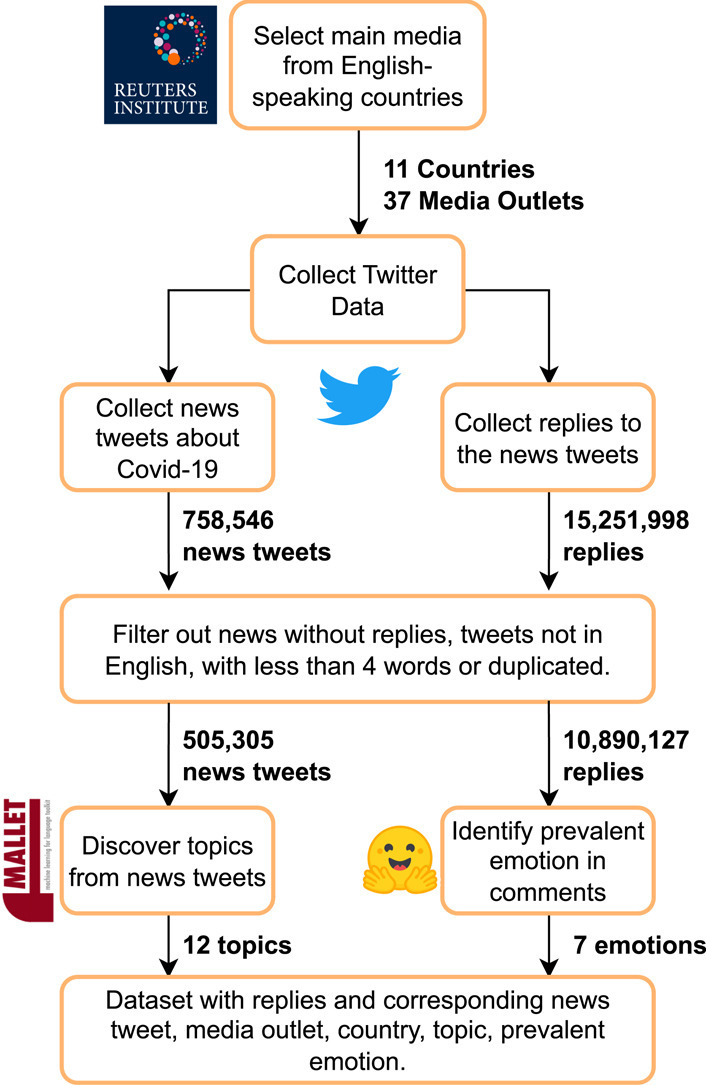
This section presents our methodology for investigating the emotional response to the Covid-19 news published by popular media. As shown in Fig. 2, we first select the main media, collect news tweets and their user comments from Twitter API, and apply emotion and topic detection. A news tweet comprises the textual content of a tweet posted by a media outlet, typically presenting a condensed version of a news article along with a hyperlink to its complete version.
Fig. 2.

The methodology used for studying the emotional responses to the Covid-19 news on Twitter.
3.1. Data acquisition
We chose the 37 most popular media outlets from 11 English-speaking countries across five continents (Table 1) based on the Reuters Digital Media Report [42]. Then, we use Twitter API context annotations [43] to collect news tweets regarding the Covid-19 pandemic from January 2020 to December 2022, and we collect all user comments (i.e., direct replies and retweets with comments). We delete all duplicate news tweets from the same media, duplicate comments from the same users, non-English tweets, and tweets with three or fewer words. Finally, all news tweets without user comments have been removed. The end result is a dataset containing 505,305 news tweets and 10,890,127 user comments from 2,761,773 distinct Twitter users.
Table 1.
The studied media outlets and their countries of origin.
| Country | Media |
|---|---|
| Australia | 9News, ABC AU, news.com.au |
| Canada | CBC, Global News, CTV |
| Ireland | RTÉ, The Journal, Independent |
| India | Times Of India, Republic, NDTV, TIMES NOW |
| Kenya | Citizen TV, NTV, Nation Africa |
| Malaysia | The Star, Malaysia Kini |
| Nigeria | Punch, Vanguard, Pulse Nigeria |
| Philippines | ABS-CBN, GMA, Inquirer |
| United Kingdom | ITV, BBC, Sky News, The Guardian, Daily Mail |
| United States | NBC, CNN, MSNBC, Fox News, ABC US |
| South Africa | SABC, News24, eNCA |
3.2. Data preprocessing
Each news tweet and user comment undergoes a preprocessing step: we eliminate punctuation, spaces, and other special characters. Web links, hashtags, or mentions to some Twitter account at the beginning or end of each tweet are also removed, and those placed elsewhere are replaced by generic terms (e.g., “user”, “http”).
3.3. Topic modeling
To identify the topics of the Covid-19 news on Twitter, we adopt an unsupervised machine learning approach known as topic modeling [30]. We use an implementation of the Latent Dirichlet Allocation (LDA) [17] by the Machine Learning for Language Toolkit (MALLET) [44]), which uses a generative probabilistic model of a corpus (i.e., a dataset of texts). LDA has been successfully used for identifying topics in a wide range of applications, including social media analysis [30].
We further pre-process news tweets by removing numbers and geographical entities (i.e., countries, cities, and state names) to avoid bias toward geographical locations in topic modeling. Then, we convert each term into its lemma (canonical forms of a word as they appear in a dictionary), form bigrams and trigrams (i.e., frequent sequences of two and three terms), and remove terms that occur in less than 0.05% or more than 33% of the documents, hence excluding rare and highly common terms to avoid bias. This leads to a dictionary of 2197 terms and a corpus indicating the terms contained in each news tweet.
We identify the appropriate number of topics – as the LDA input – by analyzing the coherence scores achieved from different numbers of the topics (Fig. 3). The points on Fig. 3 show the coherence scores achieved for different numbers of topics, ranging from 3 to 39, with a step of 3. The coherence of a topic, used as an indicator for topic quality, is based on the distributional hypothesis that words with similar meaning tend to co-occur within a similar context [45]. The coherence score of a model is the average of the coherence scores of all topics.
Fig. 3.

Coherence scores evaluated for various numbers of topics used in the training of the Latent Dirichlet Allocation (LDA) model. A coherence score of 0.41 was achieved for 12 topics.
We chose an LDA model with 12 topics that yield a coherence score of 41%, since adding more topics doesn’t significantly increase the coherence score. Each topic was specified by a set of frequent keywords and their corresponding weights. To allow for human interpretation, the topics are manually labeled based on their frequent keyword sets, news tweet examples, and the author’s understanding (Table 2).
Table 2.
The topics identified by LDA.
| Keywords | Sample tweet | Prevalence | Coherence | Label |
|---|---|---|---|---|
| people, patients, nt, hospital, testing, test, tests, hospitals, doctors, coronavirus | Nurse of Wuhans coronavirus hospital falls to death after quarrelling with a supervisor over lack of PPE | 14,5% | 43,4% | Medical care |
| children, public, schools, vaccinated, staff, workers, health, students, coronavirus, school | Ivy League schools have called off their winter sports seasons as the country deals with a record-breaking surge in COVID19 cases. | 12,3% | 37,6% | Educational impact |
| pandemic, year, work, time, years, support, economy, impact, world, nt | New Normal New payment and spending habits forced by the pandemic could be moving Canada faster to a cashless economy. | 10,9% | 41,0% | Economic impact |
| pm, watch, fight, response, president, trump, times, indias, listen, pm_modi | Trump promises 14 billion in pandemic aid to farmers ahead of US elections. | 9,5% | 33,8% | Political responses |
| virus, coronavirus, wave, spread, omicron, countries, variant, world, experts, warns | Surge testing may not be enough to curb Covid variants in UK say scientists | 8,6% | 40,6% | Variants |
| lockdown, coronavirus, latest, restrictions, live, rules, government, news, measures, national | NSW records one new case of coronavirus as restrictions for weddings community sport and schools eased | 7,6% | 36,2% | Preventive measures |
| cases, deaths, number, infections, reported, confirmed, rise, total, hours, daily | COVID19 South Africa hits 500,000 confirmed cases still not at peak | 10,2% | 59,5% | Cases & Deaths |
| vaccine, vaccines, vaccination, months, jab, free, doses, vaccinated, pfizer, received | Nigeria receives new aircraft for COVID19 vaccines distribution | 8,1% | 53,3% | Vaccination |
| country, read, coronavirus, day, week, breaking, announced, monday, time, disease | BREAKING: 618,903 people in England and Wales were told to selfisolate by the NHS COVID19 app in the week to 14 July. | 4,4% | 39,0% | Breaking news |
| government, state, govt, states, today, centre, situation, ani, minister, maharashtra | Central Government today approved a supply of 435,000 vials of Remdesivir to Maharashtra till April 30th. | 4,6% | 39,4% | Governmental actions |
| coronavirus, amid, pandemic, outbreak, crisis, surge, global, report, fears, concerns | Tourists abandon Italian capitals famous sites as country is gripped by coronavirus panic | 4,5% | 32,9% | Daily life impact |
| days, quarantine, case, police, tested_positive_covid, home, tests_positive, died, residents, city | Country folk singer John Prine dies at 73 of coronavirus complications | 4,8% | 32,1% | People stories |
3.4. Emotion classification
In this work, we use a public checkpoint of a DistilRoBERTa-base architecture [36], previously fine-tuned on a combination of multiple datasets, representing a diverse collection of text types, to predict Ekamn’s basic six emotions, plus a neutral class [37]. Each dataset used for fine-tuning contains a subset of Ekman’s emotions. However, when grouped, the result is balanced and diverse, with 2811 observations per emotion and nearly 20,000 in total. The evaluation accuracy is 66% (vs. the random-chance baseline of 1/7 = 14.3%).
We use this model to identify prevalent emotions in user comments. It makes use of DistilRoBERTa’s capacity to interpret internal English language representations of tweet text and the discernment of dataset annotators to identify the prevailing emotion in tweet content. The emotion with the highest score is chosen for each tweet to define the dominating emotion. Table 3 displays examples of user comments in which each emotion was identified as prevalent, as well as the neutral emotion.
Table 3.
Examples of emotions identified in user comments.
| Emotion | Sample user comment |
|---|---|
| Anger | If it kills Borat I’m gonna unleash fury |
| Disgust | As a health care worker I an extremely disgusted by this |
| Fear | I’m no longer scared and this is a scary thing yo. |
| Joy | I’m watching live updates regarding vaccinations and testing and I’m starting to feel hopeful |
| Neutral | One of them should just visit Buhari or others at Aso Villa |
| Sadness | I feel sorry for the reporters having to put on the pretend to be serious face |
| Surprise | As a brazilian I’m shocked about how many americans are here saying its all a lie |
4. Results
This section presents the main findings of our study, addressing research questions (RQ1)–(RQ5). Through this section, we use a few statistical hypothesis tests to verify if our assumptions are supported by our dataset.
We use the chi-square test of independence [47] to verify if a pair of categorical variables (e.g., Emotion and Country) are related (alternative hypothesis) or independent (null hypothesis). This is a non-parametric test, and we are using it because the level of measurement of some of the variables (i.e., emotion, country, topic, and media outlet) of our dataset is nominal. With both the test statistics and the number of degrees of freedom, we can determine the p-value. When that -value is greater than a significance level () we fail to reject the null hypothesis, implying the categorical variables are independent. The results for multiple pairs of variables are summarized in Table 4, along with the effect size estimated using Cohen’s [46]. Effect size represents the magnitude of the experiment; the larger the effect size, the stronger the relationship between the variables.
Table 4.
Summary of chi-square test of independence results for multiple pairs of categorical variables. The test statistics is presented in thousands. A -value lower than 5% rejects the null hypothesis that the two variables are independent. The table presents the rule of thumb over Cohen’s measure [46] as the Effect Size result.
| Variables | Test statistic | P-Value | Effect size | Test result |
|---|---|---|---|---|
| Emotion × Country | 76 | 0.0% | Small | Reject the null hypothesis |
| Emotion × Topic | 71 | 0.0% | Small | Reject the null hypothesis |
| Emotion × Media | 96 | 0.0% | Small | Reject the null hypothesis |
| Topic × Country | 1638 | 0.0% | Medium | Reject the null hypothesis |
We also adopt the Augmented Dickey–Fuller (ADF) Test [48] to verify if a time-series (e.g., the monthly prevalence of emotion in user comments) is stationary (alternative hypothesis) or not (null hypothesis). A time series that is non-stationary has some time-dependent structure (e.g., does not have constant variance over time). When the test statistic is greater than the critical value at a significance level (5%), that is reflected in the -value (), and we fail to reject the null hypothesis, implying the time series is not stationary.
4.1. Answering (RQ1): What are the prevalent emotions in user responses to the Covid-19 news?
Fig. 4 shows the prevalence of the predominant emotions in user comments to the Covid-19 news posted on Twitter from January 1, 2020 to December 31, 2022. No specific emotions have been found by our adopted emotion classifier in 48.2% of the user comments, which were labeled as neutral. The figure also shows that the negative emotions in user comments have been more prevalent than the positive emotions. We further observe that anger (13.8%) is the most prevalent emotion, while joy (4.0%) is the least prevalent emotion among the user comments.
Fig. 4.

The prevalence of emotions in user comments.
4.2. Answering (RQ2): How does the distribution of the emotions in user responses to the Covid-19 news change over time?
First, we create a time series of each emotion’s monthly prevalence in user comments. Then, we use the Augmented Dickey–Fuller test to verify which series suggest a non-stationary structure, meaning they might have time-dependent elements.
Table 5 shows that joy is the only emotion that probably is non-stationary. Meanwhile, anger, disgust, fear, sadness, surprise, and neutral emotion probably are stationary, meaning that the monthly prevalence of those emotions in user comments are not dependent on time. The more negative the test statistics are, the stronger the rejection of the null hypothesis. Thus, we can more strongly assume joy is non-stationary and fear is stationary.
Table 5.
Augmented Dickey-Fuller test for monthly prevalence of emotions in user comments. A -value higher than 5% fails to reject the null hypothesis that the time series of the daily amount of user comments with each emotion is non-stationary, thus indicating that the time series probably have time-dependent structures.
| Emotion | Test statistics | P-Value | Test result |
|---|---|---|---|
| Anger | −3.4 | 1.0% | Reject the null hypothesis |
| Disgust | −3.5 | 0.9% | Reject the null hypothesis |
| Fear | −4.7 | 0.0% | Reject the null hypothesis |
| Joy | −1.9 | 35.6% | Fails to reject the null hypothesis |
| Neutral | −3.3 | 1.7% | Reject the null hypothesis |
| Sadness | −3.6 | 0.7% | Reject the null hypothesis |
| Surprise | −2.9 | 4.6% | Reject the null hypothesis |
Additionally, Fig. 5 shows the monthly prevalence of user comments labeled with each emotion. The neutral emotion is not included in this figure because it is the most prevalent result by far (see Fig. 4), distorting the -axis scale, and also because it represents the absence of emotionality in a comment, which is the focus of this work. We can verify that anger is the leading emotion in almost all periods, except Jan 2020, when fear was the most prevalent emotion in user comments. Fear also peaks its prevalence in Nov-Dec 2021, reaching nearly 20% of user comments. Although disgust is the second most prevalent emotion overall, fear, surprise, and sadness are the second most prevalent emotion in some months.
Fig. 5.

The monthly prevalence of emotions in user comments. For instance, the dark blue line represents the monthly prevalence of user comments with anger as its prevalent emotion. User comments labeled as neutral were not included. (For interpretation of the references to colour in this figure legend, the reader is referred to the web version of this article.)
4.3. Answering (RQ3): What are the Covid-19 news topics and how are the emotions distributed across them?
Using LDA we identify 12 topics in the news tweets, as shown in Table 2. Each topic is represented by the ten words most related to it, a sample tweet, the prevalence of this topic over the news tweets, its coherence score, and its label (i.e., an expression that defines what is debated within a topic, e.g., “Cases & Deaths”). For instance, the first topic is more likely to be chosen by the LDA model for a news tweet if it contains one or more of the keywords “people”, “patients”, “hospital”, and others. That same topic has a coherence score of 43.4%, is identified as the topic of 14.5% of all news tweets, and the authors labeled it as “Medical Care”.
Applying the chi-square test of independence () we find that the topics have a significant relationship with the prevalence of emotions among user comments (Table 4), although with a small effect size. Table 6 provides the results of and the prevalence of emotions in user comments to news, according to the topic. A larger value indicates that the observed number of cases (e.g., user comments with anger as the predominant emotion in response to vaccination news) deviates more from the mean.
Table 6.
The prevalence and chi-square values (in thousands) of emotions in user comments per topic. A higher chi-square value means a more significant difference in prevalence compared with the expected (random) one. For instance, anger is found in 20.5% of the user comments on news on cases & deaths, with a chi-square value of .
| Topic | Anger | Disgust | Fear | Joy | Sadness | Surprise |
|---|---|---|---|---|---|---|
| Medical care | 25.3% (0.3) | 17.7% (0.2) | 16.4% (0.0) | 7.9% (0.0) | 16.2% (0.6) | 16.5% (0.2) |
| Educational impact | 28.7% (1.1) | 18.3% (0.3) | 15.7% (0.6) | 8.1% (0.1) | 14.4% (0.5) | 14.9% (0.8) |
| Economic impact | 26.6% (0.0) | 18.1% (0.3) | 14.9% (1.0) | 8.9% (1.0) | 16.3% (0.5) | 15.2% (0.2) |
| Political Response | 29.5% (2.8) | 20.0% (3.3) | 14.3% (2.0) | 7.1% (0.4) | 14.1% (0.5) | 15.0% (0.3) |
| Variants | 25.1% (0.9) | 16.5% (0.5) | 21.7% (6.4) | 6.3% (1.9) | 13.3% (2.1) | 17.1% (0.1) |
| Prev. Measures | 27.9% (0.7) | 17.0% (0.0) | 17.1% (0.2) | 7.5% (0.0) | 14.9% (0.0) | 15.5% (0.0) |
| Cases & Deaths | 20.5% (5.9) | 12.3% (5.8) | 22.4% (5.5) | 6.8% (0.6) | 18.0% (1.1) | 20.0% (2.5) |
| Vaccination | 25.2% (2.0) | 16.7% (1.0) | 16.1% (1.0) | 10.1% (0.9) | 14.4% (1.2) | 17.4% (0.0) |
| Breaking news | 24.5% (0.5) | 14.9% (0.9) | 17.7% (0.1) | 8.8% (0.2) | 16.9% (0.2) | 17.2% (0.1) |
| Gvt. actions | 29.6% (0.5) | 17.2% (0.0) | 16.3% (0.0) | 7.3% (0.1) | 14.8% (0.1) | 14.7% (0.3) |
| Daily life impact | 27.1% (0.2) | 17.3% (0.0) | 16.0% (0.0) | 8.1% (0.1) | 15.1% (0.0) | 16.3% (0.1) |
| People stories | 27.2% (0.6) | 16.9% (0.1) | 14.3% (0.3) | 7.4% (0.0) | 18.4% (3.3) | 15.8% (0.1) |
| Mean | 26.6% | 17.4% | 16.7% | 7.8% | 15.4% | 16.1% |
The highest value is observed in the proportion of user comments with fear of news about variants (21.7%), which is significantly higher than the mean prevalence of fear in user comments (16.7%). User comments to the news about cases & deaths have the lowest prevalence of anger (20.5%) and disgust (12.3%), while having the highest prevalence of fear (22.4%) and the second-highest prevalence of surprise (20%). News related to governmental actions and political responses observe the highest prevalence of anger (29.6% and 29.5%, respectively). Additionally, user comments to news about political responses also have the lowest prevalence of fear (14.3%). Meanwhile, joy is the least prevalent emotion in user comments to news on any topic, although it has the highest prevalence for news about vaccination (10.1%).
4.4. Answering (RQ4): How does the distribution of the emotions in user responses to the Covid-19 news change across different countries?
Country and emotion are two categorical variables that hold a significant relationship, according to the test result (Table 4), although with a small effect size. The Table 8 displays the prevalence of each emotion in user comments as well as the value for each country. The categorical variable of the country is also significantly related to the topic of the news published by its media, with a medium effect size (Table 4). Table 7 presents the prevalence of each topic in the news from a given country, besides its value.
Table 8.
The prevalence and chi-square values (in thousands) of emotions in user comments per country. A higher chi-square value means a more significant difference in prevalence compared with the expected (random) one. For instance, anger is found in 29.1% of the user comments on news from the US, with a chi-square value of .
| Country | Anger | Disgust | Fear | Joy | Sadness | Surprise |
|---|---|---|---|---|---|---|
| Australia | 27.1% (0.0) | 17.5% (0.0) | 17.3% (0.0) | 7.1% (0.2) | 14.6% (0.1) | 16.4% (0.0) |
| Canada | 28.2% (0.1) | 18.3% (0.0) | 16.7% (0.1) | 6.9% (0.8) | 13.4% (1.7) | 16.5% (0.0) |
| Ireland | 22.9% (0.8) | 16.6% (0.0) | 19.8% (1.2) | 9.6% (0.8) | 15.3% (0.0) | 15.7% (0.0) |
| India | 24.8% (0.9) | 13.8% (3.5) | 20.9% (3.3) | 9.2% (0.7) | 18.2% (1.5) | 13.2% (2.5) |
| Kenia | 22.4% (2.0) | 14.8% (1.2) | 16.7% (0.3) | 8.2% (0.1) | 21.1% (0.5) | 16.8% (0.2) |
| Malaysia | 25.7% (0.1) | 12.4% (0.6) | 18.2% (0.0) | 8.6% (0.0) | 17.9% (0.0) | 17.3% (0.0) |
| Nigeria | 26.2% (0.4) | 14.3% (1.4) | 17.2% (0.1) | 8.7% (0.0) | 18.1% (0.1) | 15.4% (0.3) |
| Philippines | 24.3% (1.2) | 12.3% (3.7) | 18.9% (0.1) | 12.1% (2.7) | 16.0% (0.0) | 16.3% (0.1) |
| UK | 24.8% (0.5) | 17.0% (0.1) | 18.4% (5.5) | 7.7% (0.1) | 15.6% (0.7) | 16.4% (0.9) |
| US | 29.1% (5.6) | 19.4% (5.6) | 13.6% (10.4) | 7.5% (0.2) | 14.3% (1.1) | 16.2% (0.1) |
| South Africa | 25.9% (0.6) | 14.9% (2.0) | 18.1% (0.0) | 6.7% (0.9) | 17.7% (0.3) | 16.9% (0.0) |
| Mean | 26.6% | 17.4% | 16.7% | 7.8% | 15.4% | 16.1% |
Table 7.
The prevalence and chi-square values (in thousands) of topics in user comments per country. A higher chi-square value means a more significant difference in prevalence compared with the expected (random) one. For instance, “variants” is the topic of 12.5% of the user comments from the United Kingdom, with a chi-square value of .
| Country | Medical care |
Educational impact |
Economic impact |
Political response |
Variants | Preventive measures |
Cases & Deaths |
Vaccination | Breaking news |
Governmental actions |
Daily life impact |
People stories |
|---|---|---|---|---|---|---|---|---|---|---|---|---|
| Australia | 14.8% (0.1) | 13.3% (0.3) | 11.0% (0.1) | 7.5% (9.5) | 9.3% (0.0) | 10.5% (1.8) | 7.7% (1.8) | 8.0% (1.0) | 1.8% (5.8) | 2.6% (1.0) | 5.4% (1.4) | 8.2% (13.2) |
| Canada | 13.2% (2.7) | 19.8% (19.2) | 13.9% (9.8) | 7.6% (15.3) | 13.2% (11.6) | 5.1% (13.2) | 5.2% (1.6) | 10.2% (14.8) | 3.6% (0.1) | 1.9% (6.3) | 2.9% (4.3) | 3.5% (2.7) |
| Ireland | 16.9% (0.5) | 15.8% (0.6) | 9.7% (0.2) | 4.8% (15.3) | 11.0% (0.7) | 10.5% (1.2) | 9.4% (5.5) | 8.6% (1.6) | 3.8% (0.0) | 3.8% (0.1) | 2.0% (4.4) | 3.6% (0.9) |
| India | 15.4% (0.0) | 6.9% (28.7) | 8.7% (2.3) | 22.0% (60.8) | 6.4% (8.5) | 4.1% (19.4) | 7.2% (1.2) | 7.3% (0.2) | 2.0% (6.6) | 10.9% (122.8) | 3.6% (0.8) | 5.5% (1.0) |
| Kenia | 19.3% (1.9) | 14.9% (0.1) | 12.2% (0.6) | 8.1% (2.6) | 7.6% (0.8) | 4.0% (5.0) | 9.3% (2.8) | 7.3% (0.1) | 3.8% (0.0) | 5.4% (2.0) | 2.3% (1.8) | 5.8% (0.5) |
| Malaysia | 13.2% (0.2) | 12.8% (0.1) | 9.2% (0.1) | 10.5% (0.1) | 8.2% (0.1) | 4.1% (1.4) | 9.4% (0.9) | 10.1% (0.9) | 3.7% (0.0) | 5.2% (0.5) | 1.9% (0.8) | 11.7% (6.0) |
| Nigeria | 14.9% (0.0) | 23.4% (14.8) | 7.9% (1.5) | 7.7% (4.1) | 6.5% (2.4) | 6.9% (1.0) | 6.8% (0.1) | 5.0% (1.2) | 5.4% (1.6) | 7.2% (10.1) | 2.8% (1.3) | 5.3% (0.2) |
| Philippines | 11.4% (3.5) | 11.0% (2.6) | 8.9% (0.8) | 7.8% (5.6) | 6.7% (3.1) | 3.2% (12.1) | 11.1% (13.0) | 8.4% (1.3) | 19.4% (220.6) | 5.1% (2.6) | 2.7% (2.0) | 4.3% (0.1) |
| United Kingdom | 16.9% (5.2) | 12.2% (9.1) | 9.0% (5.9) | 6.7% (80.7) | 12.5% (27.2) | 17.6% (289.6) | 5.8% (1.0) | 5.3% (11.2) | 3.1% (4.5) | 2.3% (13.4) | 5.1% (4.3) | 3.5% (10.4) |
| United States | 15.3% (0.0) | 16.1% (9.1) | 11.7% (6.3) | 18.1% (106.9) | 7.6% (15.4) | 2.3% (179.0) | 4.8% (12.9) | 6.9% (0.0) | 3.6% (0.3) | 3.0% (2.0) | 5.0% (4.2) | 5.5% (4.4) |
| South Africa | 11.0% (7.4) | 12.5% (1.2) | 8.4% (2.3) | 13.5% (0.8) | 8.9% (0.3) | 16.1% (36.4) | 10.8% (19.1) | 6.8% (0.0) | 3.8% (0.0) | 2.6% (1.2) | 1.7% (9.6) | 4.0% (0.6) |
| Mean | 15.4% | 14.2% | 10.4% | 12.2% | 9.6% | 8.8% | 6.3% | 6.8% | 3.8% | 3.5% | 4.3% | 4.7% |
From all the user comments to news from media outlets based in the US 29.1% () have anger as prevalent emotion, the highest prevalence for this emotion among the observed countries. In user comments, the United States has the highest prevalence of disgust (19.4%) and the lowest prevalence of fear (13.6%). Moreover, the observed US media present the lowest prevalence of user comments to news about Preventive Measures (2.3%), as shown in Table 7. On the other hand, the Indian media have the highest proportion of news about Political Responses (22.0%) and Governmental Actions (10.9%) while holding the highest prevalence of fear in user comments (20.9%). News from the Philippines shows the highest prevalence of joy in user comments (12.1%), although its media lead in the proportion of breaking news (19.4%) and news about cases & deaths (11.1%).
4.5. Answering (RQ5): How does the distribution of the emotions in user responses to the Covid-19 news change over different media outlets?
Media outlet and emotion are also two categorical variables that hold a significant relationship, according to the test result (Table 4), although with a small effect size. Table 9 displays the prevalence of each emotion in user comments as well as the value for a given media outlet. The highest prevalence of anger is observed in user comments to Pulse Nigeria (33.9%), and fear is the most prevalent emotion in user comments to the news published by The Times of India (22.0%). Fox News is the media outlet with the second-highest prevalence of anger (32.3%) and the highest of disgust (21.2%) while having the lowest prevalence of fear (11.8%) and sadness (12.7%) in the user comments to the news it publishes. All three media outlets with the highest prevalence of sadness are from Africa: Citizen TV (22.2%), SABC (20.8%), and Nation Africa (20.1%). RTÉ (Ireland) is the media outlet with the lowest prevalence of anger (21.9%), and The Star (Malaysia) has the lowest prevalence of disgust (11.2%). Meanwhile, GMA and ABS-CBN, both from the Philippines, had the highest prevalence of user comments identified with joy (13.2% and 13.1%, respectively), despite having a higher prevalence of fear among user comments than the mean (19.1% and 20.9%, respectively, vs. 16.7%). Finally, surprise is most common in comments to news from the Daily Mail and NTV (Kenya).
Table 9.
The prevalence and chi-square values (in thousands) of emotions in user comments per media outlet. A higher chi-square value means a more significant difference in prevalence compared with the expected (random) one. For instance, anger is found in 32.2% of the user comments on news from Fox News, with a chi-square value of .
| Media | Anger | Disgust | Fear | Joy | Sadness | Surprise |
|---|---|---|---|---|---|---|
| 9News | 28.1% (0.1) | 17.3% (0.0) | 17.6% (0.0) | 7.1% (0.0) | 13.6% (0.1) | 16.3% (0.0) |
| ABC (AU) | 25.7% (0.2) | 17.3% (0.0) | 17.2% (0.0) | 7.3% (0.1) | 15.5% (0.0) | 16.9% (0.0) |
| ABC (US) | 27.2% (0.1) | 18.6% (0.5) | 13.9% (1.4) | 8.8% (0.5) | 14.3% (0.2) | 17.2% (0.4) |
| ABS-CBN | 22.1% (0.9) | 10.6% (2.3) | 20.9% (0.4) | 13.1% (1.9) | 16.4% (0.0) | 16.9% (0.0) |
| BBC | 24.2% (0.4) | 15.9% (0.2) | 19.1% (2.1) | 8.3% (0.3) | 16.4% (0.6) | 16.1% (0.1) |
| CBC | 28.8% (0.1) | 18.6% (0.0) | 16.0% (0.1) | 7.1% (0.2) | 13.6% (0.4) | 15.8% (0.1) |
| CNN | 28.5% (1.4) | 18.7% (1.1) | 14.5% (2.1) | 7.5% (0.0) | 14.6% (0.2) | 16.1% (0.0) |
| CTV | 27.5% (0.0) | 18.5% (0.1) | 16.7% (0.0) | 6.7% (0.4) | 13.6% (0.6) | 17.1% (0.0) |
| Citizen TV | 22.1% (1.1) | 13.9% (0.8) | 16.7% (0.1) | 8.5% (0.0) | 22.2% (0.5) | 16.5% (0.1) |
| Daily Mail | 24.2% (0.2) | 18.8% (0.0) | 18.2% (0.0) | 6.7% (0.1) | 14.1% (0.1) | 18.0% (0.1) |
| Fox News | 32.2% (3.3) | 21.2% (2.3) | 11.8% (4.5) | 6.2% (1.1) | 12.7% (1.5) | 16.0% (0.0) |
| GMA | 23.2% (0.5) | 11.8% (1.1) | 19.1% (0.0) | 13.2% (0.9) | 15.9% (0.0) | 16.8% (0.0) |
| Global News | 28.9% (0.1) | 17.5% (0.0) | 17.7% (0.0) | 6.9% (0.2) | 12.8% (0.6) | 16.2% (0.0) |
| ITV | 23.3% (0.1) | 15.9% (0.0) | 18.9% (0.7) | 8.1% (0.1) | 17.4% (0.6) | 16.4% (0.1) |
| Independent | 24.6% (0.0) | 17.8% (0.0) | 20.0% (0.4) | 7.2% (0.0) | 14.9% (0.0) | 15.5% (0.0) |
| Inquirer | 27.4% (0.1) | 14.4% (0.7) | 16.6% (0.1) | 10.5% (0.3) | 15.6% (0.0) | 15.5% (0.2) |
| MSNBC | 30.8% (1.9) | 20.4% (1.6) | 12.8% (1.8) | 6.5% (0.4) | 14.7% (0.0) | 14.8% (0.1) |
| NBC | 28.5% (0.5) | 19.6% (0.9) | 13.0% (1.8) | 7.9% (0.0) | 14.6% (0.1) | 16.4% (0.1) |
| NDTV | 22.1% (1.6) | 14.6% (0.9) | 20.8% (1.1) | 9.7% (0.5) | 19.0% (1.0) | 13.8% (0.7) |
| NTV | 22.2% (0.7) | 14.9% (0.4) | 16.7% (0.1) | 8.5% (0.0) | 19.9% (0.1) | 17.9% (0.0) |
| Nation Africa | 23.4% (0.3) | 17.0% (0.1) | 16.8% (0.0) | 7.1% (0.1) | 20.1% (0.1) | 15.6% (0.1) |
| News24 | 26.4% (0.2) | 15.8% (0.6) | 17.5% (0.0) | 6.5% (0.6) | 16.9% (0.0) | 16.9% (0.0) |
| Pulse Nigeria | 33.9% (0.3) | 12.6% (0.1) | 20.1% (0.1) | 7.7% (0.0) | 12.7% (0.0) | 13.0% (0.0) |
| Punch | 25.4% (0.6) | 14.2% (1.2) | 17.1% (0.1) | 8.9% (0.0) | 18.8% (0.1) | 15.5% (0.3) |
| RTÉ | 21.9% (0.8) | 15.8% (0.1) | 19.9% (0.8) | 11.0% (1.5) | 15.6% (0.0) | 15.8% (0.0) |
| Republic | 27.5% (0.0) | 13.0% (0.6) | 20.2% (0.5) | 9.6% (0.3) | 17.2% (0.2) | 12.4% (0.5) |
| SABC | 24.2% (0.3) | 13.0% (0.7) | 18.6% (0.0) | 6.7% (0.1) | 20.8% (0.4) | 16.7% (0.0) |
| Sky News | 25.7% (0.0) | 17.1% (0.1) | 18.3% (3.1) | 7.3% (0.0) | 15.1% (0.1) | 16.6% (0.9) |
| TIMES NOW | 29.4% (0.3) | 14.1% (0.5) | 20.6% (0.9) | 6.8% (0.1) | 16.5% (0.1) | 12.6% (0.7) |
| The Guardian | 22.6% (1.0) | 19.4% (0.5) | 17.5% (0.1) | 9.0% (0.4) | 15.8% (0.0) | 15.8% (0.0) |
| The Star | 24.6% (0.1) | 11.2% (0.4) | 19.0% (0.0) | 9.5% (0.0) | 17.9% (0.0) | 17.7% (0.0) |
| Times Of India | 22.3% (1.1) | 12.4% (1.7) | 22.0% (0.7) | 10.5% (0.4) | 19.3% (0.4) | 13.5% (0.6) |
| The Journal | 23.7% (0.1) | 17.6% (0.0) | 19.1% (0.0) | 8.2% (0.0) | 15.4% (0.0) | 16.0% (0.0) |
| Vanguard | 25.9% (0.1) | 15.7% (0.1) | 16.1% (0.0) | 8.5% (0.0) | 17.9% (0.0) | 15.9% (0.0) |
| eNCA | 25.6% (0.2) | 13.9% (1.0) | 19.0% (0.1) | 6.9% (0.2) | 17.8% (0.1) | 16.8% (0.0) |
| malaysiakini.com | 26.9% (0.0) | 13.7% (0.2) | 17.3% (0.0) | 7.6% (0.0) | 17.8% (0.0) | 16.8% (0.0) |
| news.com.au | 28.5% (0.3) | 17.9% (0.1) | 17.2% (0.1) | 6.6% (0.1) | 13.9% (0.0) | 15.8% (0.0) |
| Mean | 26.6% | 17.4% | 16.7% | 7.8% | 15.4% | 16.1% |
5. Discussion
The media’s extensive coverage of the Covid-19 pandemic has caused many people to avoid the news, which has in turn reduced the press’s ability to influence the public’s attitudes towards this and other health and security crises [8], [38]. According to Villi et al. [49], news avoidance is influenced by contextual factors and emotional drivers at the country level. To further explore this phenomenon, our study conducted a large-scale analysis of the emotional responses of Twitter users to news articles, taking into account various factors such as the topics covered, prevailing emotions in comments, the country and media outlet of origin, and the timing of message posting. We also used statistical methods to validate our findings, which differ from previous research in their scope and depth.
This investigation is based on the analysis of the prevalence of Ekman’s six basic emotions, plus the neutral emotion, in user comments for each research question, pointing out highlights in terms of the most or least prevalent emotion in multiple scenarios. Nearly half (48%) of the user comments didn’t present a detectable emotion (i.e., the predominant emotion was neutral; see Fig. 4), either because the text of the message doesn’t contain emotionally charged words (e.g., adjectives), or because it is merely informative, such as “it is sunny today” (see Table 3). Among the user comments with a detectable emotion, anger is the most prevalent emotion, followed by disgust and fear; joy is the least prevalent emotion.
The prevalence of negative emotions might provide an explanation for the significant level of Covid-19 news avoidance reported by Reuters [38]. Furthermore, anger and disgust may be more widespread than fear and sadness because people externalize their annoyance in a more proactive manner, directing their negative feelings at the press and the subjects of news pieces, such as the government and politicians. There is no doubt that the nature of the news about unemployment, social isolation, and the loss of loved ones in the midst of Covid-19 has been the primary catalyst for the public to express negative emotions. Nonetheless, looking into the role of news framing in inciting or aggravating such negative feelings can be a fruitful research issue.
Anger is also the most prevalent emotion in almost all observed months, except Jan 2020. The second-highest prevalence varies between disgust, fear, surprise, and sadness in different months. Fear reached detectable peaks at the outbreak of the pandemic in Jan-Feb 2020 and when the omicron variant was discovered in Nov-Dec 2021. Moreover, user comments to news about cases & deaths and variants have the highest prevalence of fear (22.4% and 21.7%, respectively). These results can lead to the conclusion that periods of uncertainty, such as when the news speculates about outbreaks, variants, and the possibility of an increase in cases and deaths, result in an increment in the prevalence of fear among user comments, as suggested by related work [14].
While the emotional responses to the news varied across different news topics, comments on the news about governmental actions demonstrate the highest prevalence of anger (29.6%), and the second-lowest level of joy (6.8%) compared to other news topics. This suggests that news about governmental actions instigated a higher level of negative feelings in people. This is consistent with previous findings [5], [50]. Investigating the reasons for such a negative emotional response from society may help policymakers develop more effective methods for crisis management that can be accepted and supported by a larger part of society. Also, and importantly, anger has substantial negative consequences for psychological and physical health. From a psychological perspective, anger can be seen as attempt to assert dominance and control in situations of risk and uncertainty [51]. Thus, our finding of high anger levels in response to governmental actions could reflect a proactive emotional reaction that counteracts a sense of helplessness. However, anger triggers a physiological stress response, activating the autonomic nervous system. This has a range of physiological consequences including increases in blood pressure and heart rate; chronic activation negatively impacts cardiovascular, brain, and immune system functioning [52]. Thus, an awareness of, and strategies to mitigate the anger response observed here, would benefit the mental and physical health of societies at a time when stress levels are already heightened.
It is also worth noting that user comments about cases and deaths have the lowest prevalence of anger and disgust, with only 20.5% and 12.3%, respectively. This could be due to readers’ feelings of helplessness when they receive news about cases and deaths, and it could also represent a sense of resignation and acquiescence to the situation. Concurrently, user comments about cases and deaths show the highest levels of fear and surprise, at 22.4% and 20.0%, respectively. This might be interpreted as readers feeling overwhelmed and paralyzed by the news, reducing their ability to control the situation effectively and take the required preventative actions to ensure their safety.
Among the media outlets studied, Fox News has the second-highest prevalence of anger (32.2%) and the lowest prevalence of fear (11.8%). This is interesting from a political perspective since Fox News is a right-leaning US media outlet that is known to have questioned the impacts of the Covid-19 pandemic, and the efficiency of imposing tougher restrictions [53], [54]. The impact of that coverage may be amplified by Song’s finding [55] that news readers who are more frequently exposed to anger and less frequently exposed to fear, tend to avoid exposure to material that contradicts their beliefs. That editorial viewpoint may also have encouraged the public to be less concerned about the pandemic’s consequences. In general, US media outlets also have the highest prevalence of anger (29.1%), and the lowest prevalence of fear (13.6%).
User comments on news from different countries and media outlets reveal patterns in the prevalence of emotions, suggesting that cultural differences may influence how people react to news about the Covid-19 pandemic. For example, Filipino media outlets have the highest prevalence of joy (GMA 13.2%, ABS-CBN 13.1%), whereas the top three media outlets with the highest prevalence of sadness are from Africa (Citizen TV 22.2%, SABC 20.8%, Nation Africa 20.1%), and the top three media outlets with the highest prevalence of disgust are from the United States (Fox News 21.2%, MSNBC 20.4%, NBC 19.6%). Although this study did not investigate the underlying cultural factors that may influence emotional responses, the findings highlight the importance of understanding how those factors shape emotional responses to news, particularly during crises. Further research could help identify cultural differences and provide insight into how to successfully connect with different populations during similar occurrences.
6. Limitations and threats to validity
This section discusses the limitations of the paper as a guide for the interpretation of the findings and to inform further research.
Internal Validity. In this research, we used emotion classification to identify emotions in comments on the Covid-19 news. Although associations have been found among the news and in the presence of emotions in comments, one must avoid interpreting such associations as causal relationships. In other words, the identified emotions could have been triggered by the news content, news framing, or simply user mood when commenting on the news; our methodology, and thus our findings, are unable to differentiate between these possibilities.Nonetheless, complementary research may be able to separate the impact of the news content, news framing, and user moods on their emotional responses to the news. Moreover, although we have identified the emotions directly from the comments to the news posted on Twitter, we cannot rule out the possibility that other factors beyond the news itself, e.g., events such as elections and economic issues, might have triggered the users to express certain emotions in their comments. Identifying such factors and controlling them, however, is not trivial and goes beyond the scope of this research. Finally, we observed a high level of comments on the news with no significant detectable emotions in them. As discussed in Section 5, this could have happened for a variety of reasons, including the fact that the news did not elicit emotional responses from users. But that is hard to specify; further research is needed to investigate the relationship between news framing and emotions in the comments on the news. Also, the question can be asked if the media has consciously commensurated their news to remain neutral and not provoke emotions in their users.
Construct Validity. Some tweets may contain non-English words or phrases for countries with a multilingual population, such as India and the Philippines. We rely on identifying the language used in the tweets based on the Twitter metadata that recognizes the language a tweet is written in. This may limit the accuracy of recognizing language in multilingual tweets originating from these geolocations. This may impact the accuracy of detecting emotions in tweets from these countries, where both, the native languages and English are used to communicate on Twitter. Last, we rely on identifying a news tweet related to the Covid-19 pandemic based on the context annotation provided by Twitter; some news tweets related to the Covid-19 pandemic may not have been captured. Moreover, our study has focused on collective analysis of the emotional responses in user comments, however it has not taken into account variations in the individual behavior of the users in their comments. As such, while our research provides a comprehensive understanding of overall user emotions, it is limited in capturing the insights that relate to the specific behavioral tendencies of the users. For instance, our approach does not allow us to recognize patterns such as “users expressing anger may have made multiple comments, while those expressing fear may have contributed only one comment”.
External Validity. We have analyzed the emotional response to the Covid-19 news across different media outlets from 11 countries. However, not all users of a particular media outlet reside in the same country where the outlet is based. As such, one should avoid generalizing the results to the actual populations of the countries. Also, the results of our study are limited to the Covid-19 news posts and the replies to those posts in English only; non-English posts have not been analyzed due to the limitations of the current NLP techniques [56]. This may affect our findings, especially in countries where English is not the main language.
7. Conclusions and future work
While the popular media has helped contain the Covid-19 pandemic, distressing news has affected people and, in many cases, discouraged them from following the news. In an effort to throw some light on the emotional impacts of the Covid-19 news, we carried out a large-scale study of the comments on the news published on Twitter. Our study employs a deep learning model and Latent Dirichlet Allocation (LDA) to investigate the emotional response to Covid-19 news. We analyze user comments on news articles posted on Twitter by 37 media outlets from 11 countries, covering the period from January 2020 to December 2022. The chi-square test of independence indicates that the topic, country, and media outlet of news tweets may impact the emotions expressed by readers in their comments, albeit with a small effect size.
Our findings show that while half of the user comments exhibited no significant emotions, negative emotions were more prevalent. The most prevalent emotion is anger, which is mostly seen in comments about political responses and governmental actions published by US media. On the other hand, joy is mostly found in comments about news on vaccination and from Filipino media outlets. The longitudinal analysis reveals that anger is consistently the most prevalent emotion. Fear initially dominates but gradually declines over time, occasionally surging when news about Covid-19 variants, cases, and deaths emerge. However, the Augmented Dickey–Fuller test suggests that, except for joy, the monthly prevalence of emotions in user comments is not time-dependent.
The prevalence of emotions across media outlets also varies. Fox News has the highest level of disgust and the second-highest level of anger. The highest level of anger is observed in comments to Pulse Nigeria, while fear is most prevalent in comments to The Times of India. Joy is most evident in the comments to ABS-CBN and GMA, both from the Philippines. Sadness is highest in comments about Citizen TV, SABC, Nation Africa, and all African media, and surprise is most common in comments about news from the Daily Mail and NTV of Kenya.
This work can be extended in several directions. User comments labeled with a neutral emotion can be subjected to further analysis, such as clustering, to identify the primary reasons for receiving a neutral label. These reasons may include short text or poorly written English. NLP techniques can be used to identify the links between news framing and emotional responses to the news. This research can examine the textual structure of news tweets to determine if they are intentionally framed to evoke specific emotions among users. The objective may involve generating more engagement, increasing clicks, or preventing readers from developing a negative perception of the media outlet. Our findings can also be looked at from a psychological perspective to understand the potential impacts of the Covid-19 news on mental health. Finally, it would be interesting to study the relationship between the major events (e.g., elections) during the pandemic and the emotional response to the Covid-19 news.
CRediT authorship contribution statement
Francisco Bráulio Oliveira: Conceptualization, Software, Methodology, Writing – original draft, Writing – review & editing. Davoud Mougouei: Conceptualization, Methodology, Validation, Resources, Writing – original draft, Writing – review & editing. Amanul Haque: Conceptualization, Software, Methodology, Validation, Writing – original draft, Writing – review & editing. Jaime Simão Sichman: Conceptualization, Resources, Funding acquisition, Supervision. Hoa Khanh Dam: Conceptualization, Writing – review & editing, Supervision. Simon Evans: Conceptualization, Writing – review & editing, Supervision. Aditya Ghose: Conceptualization, Writing – review & editing, Supervision. Munindar P. Singh: Conceptualization, Writing – review & editing, Supervision.
Declaration of Competing Interest
The authors declare that they have no known competing financial interests or personal relationships that could have appeared to influence the work reported in this paper.
Acknowledgments
We pay tribute to the late Professor Aditya Ghose, whose remarkable contributions, unwavering support, and kind-hearted nature have left an indelible mark on the academic community. His legacy of generosity and expertise will continue to inspire.
This research was generously supported by the University Global Partnership Network (UGPN), the Australian Academy of Science, and the Department of Industry, Science, Energy, and Resources .
Data availability
Data will be made available on request.
References
- 1.WHO . 2023. COVID-19 weekly epidemiological update, 4 January 2023. [Google Scholar]
- 2.Hiscott J., Alexandridi M., Muscolini M., Tassone E., Palermo E., Soultsioti M., Zevini A. The global impact of the coronavirus pandemic. Cytokine Growth Factor Rev. 2020;53:1–9. doi: 10.1016/j.cytogfr.2020.05.010. [DOI] [PMC free article] [PubMed] [Google Scholar]
- 3.Sandell T., Sebar B., Harris N. Framing risk: Communication messages in the Australian and Swedish print media surrounding the 2009 H1N1 pandemic. Scand. J. Public Health. 2013;41:860–865. doi: 10.1177/1403494813498158. [DOI] [PubMed] [Google Scholar]
- 4.Mheidly N., Fares J. Leveraging media and health communication strategies to overcome the COVID-19 infodemic. J. Public Health Policy. 2020;41(4):410–420. doi: 10.1057/s41271-020-00247-w. [DOI] [PMC free article] [PubMed] [Google Scholar]
- 5.Evans S.L., Jones R., Alkan E., Sichman J.S., Haque A., de Oliveira F.B.S., Mougouei D., et al. The emotional impact of COVID-19 news reporting: A longitudinal study using natural language processing. Hum. Behav. Emerg. Technol. 2023;2023 [Google Scholar]
- 6.Jones R., Mougouei D., Evans S.L. Understanding the emotional response to COVID-19 information in news and social media: A mental health perspective. Hum. Behav. Emerg. Technol. 2021;3(5):832–842. doi: 10.1002/hbe2.304. [DOI] [PMC free article] [PubMed] [Google Scholar]
- 7.Overgaard C.S.B. Constructive Journalism in the face of a crisis: The effects of social media news updates about COVID-19. J. Stud. 2021;22:1875–1893. doi: 10.1080/1461670X.2021.1971107. [DOI] [Google Scholar]
- 8.Buneviciene I., Bunevicius R., Bagdonas S., Bunevicius A. COVID-19 media fatigue: predictors of decreasing interest and avoidance of COVID-19–related news. Public Health. 2021;196:124–128. doi: 10.1016/j.puhe.2021.05.024. [DOI] [PMC free article] [PubMed] [Google Scholar]
- 9.WHO I. World Health Organization; 2017. Communicating Risk in Public Health Emergencies: A WHO Guideline for Emergency Risk Communication (ERC) Policy and Practice. [PubMed] [Google Scholar]
- 10.Eisele O., Litvyak O., Brändle V.K., Balluff P., Fischeneder A., Sotirakou C., Ali P.S., Boomgaarden H.G. An emotional rally: Exploring commenters’ responses to online news coverage of the COVID-19 crisis in Austria. Digit. J. 2021:1–24. doi: 10.1080/21670811.2021.2004552. [DOI] [Google Scholar]
- 11.Ghasiya P., Okamura K. Investigating COVID-19 news across four nations: A topic modeling and sentiment analysis approach. IEEE Access. 2021;9:36645–36656. doi: 10.1109/ACCESS.2021.3062875. [DOI] [PMC free article] [PubMed] [Google Scholar]
- 12.Aslam F., Awan T.M., Syed J.H., Kashif A., Parveen M. Sentiments and emotions evoked by news headlines of coronavirus disease (COVID-19) outbreak. Humanit. Soc. Sci. Commun. 2020;7 doi: 10.1057/s41599-020-0523-3. [DOI] [Google Scholar]
- 13.Dyer J., Kolic B. Public risk perception and emotion on Twitter during the Covid-19 pandemic. Appl. Netw. Sci. 2020;5(1):1–32. doi: 10.1007/s41109-020-00334-7. [DOI] [PMC free article] [PubMed] [Google Scholar]
- 14.Xue J., Chen J., Hu R., Chen C., Zheng C., Su Y., Zhu T. Twitter discussions and emotions about the COVID-19 pandemic: Machine learning approach. J. Med. Internet Res. 2020;22 doi: 10.2196/20550. [DOI] [PMC free article] [PubMed] [Google Scholar]
- 15.Kim S., Cho S.K., Locascio S.P. The role of media use and emotions in risk perception and preventive behaviors related to COVID-19 in South Korea. Asian J. Public Opin. Res. 2020;8:297–323. doi: 10.15206/ajpor.2020.8.3.297. [DOI] [Google Scholar]
- 16.Oliveira F.B., Haque A., Mougouei D., Evans S., Sichman J.S., Singh M.P. Investigating the emotional response to COVID-19 news on Twitter: A topic modeling and emotion classification approach. IEEE Access. 2022;10:16883–16897. [Google Scholar]
- 17.Blei D.M., Ng A.Y., Jordan M.I. Latent Dirichlet allocation. J. Mach. Learn. Res. 2003;3:993–1022. [Google Scholar]
- 18.O’Connor B., Balasubramanyan R., Routledge B., Smith N. Proceedings of the International AAAI Conference on Web and Social Media (ICWSM), Vol. 4 (1) 2010. From Tweets to Polls: Linking Text Sentiment to Public Opinion Time Series; pp. 122–129. [DOI] [Google Scholar]
- 19.Yaqub U., Chun S.A., Atluri V., Vaidya J. Analysis of Political Discourse on Twitter in the Context of the 2016 US Presidential Elections. Gov. Inf. Q. 2017;34(4):613–626. doi: 10.1016/j.giq.2017.11.001. [DOI] [Google Scholar]
- 20.Tavoschi L., Quattrone F., D’Andrea E., Ducange P., Vabanesi M., Marcelloni F., Lopalco P.L. Twitter as a Sentinel Tool to Monitor Public Opinion on Vaccination: An Opinion Mining Analysis from September 2016 to August 2017 in Italy. Hum. Vaccines Immunother. 2020;16(5):1062–1069. doi: 10.1080/21645515.2020.1714311. doi: 10.1080/21645515.2020.1714311. [DOI] [PMC free article] [PubMed] [Google Scholar]
- 21.Li M., Turki N., Izaguirre C.R., DeMahy C., Thibodeaux B.L., Gage T. Twitter as a tool for social movement: An analysis of feminist activism on social media communities. J. Community Psychol. 2021;49(3):854–868. doi: 10.1002/jcop.22324. [DOI] [PubMed] [Google Scholar]
- 22.Kostkova P., Szomszor M., St. Louis C. # SwineFlu: The use of Twitter as an early warning and risk communication tool in the 2009 swine flu pandemic. ACM Trans. Manage. Inf. Syst. (TMIS) 2014;5(2):1–25. [Google Scholar]
- 23.Giovanni B.A., Greco F., et al. Lockdown and breakdown in Italians’ reactions on Twitter during the first phase of Covid-19. Partecip. Conflitto. 2021;14(1):261–282. [Google Scholar]
- 24.Lazard A.J., Scheinfeld E., Bernhardt J.M., Wilcox G.B., Suran M. Detecting themes of public concern: A text mining analysis of the centers for disease control and Prevention’s Ebola live Twitter chat. Am. J. Infect. Control. 2015;43(10):1109–1111. doi: 10.1016/j.ajic.2015.05.025. [DOI] [PubMed] [Google Scholar]
- 25.J. Weng, B.-S. Lee, Event detection in Twitter, in: Proceedings of the International Aaai Conference on Web and Social Media, Vol. 5, 2011, pp. 401–408.
- 26.Sinnenberg L., Buttenheim A.M., Padrez K., Mancheno C., Ungar L., Merchant R.M. Twitter as a tool for health research: a systematic review. Am J Public Health. 2017;107(1):e1–e8. doi: 10.2105/AJPH.2016.303512. [DOI] [PMC free article] [PubMed] [Google Scholar]
- 27.Churchill R., Singh L. The evolution of topic modeling. ACM Comput. Surv. 2022 doi: 10.1145/3507900. [DOI] [Google Scholar]
- 28.Qiang J., Qian Z., Li Y., Yuan Y., Wu X. Short text topic modeling techniques, applications, and performance: A survey. IEEE Trans. Knowl. Data Eng. 2020;34(3):1427–1445. [Google Scholar]
- 29.Angelov D. 2020. Top2vec: Distributed representations of topics. arXiv preprint arXiv:2008.09470. [Google Scholar]
- 30.Chauhan U., Shah A. Topic modeling using latent Dirichlet allocation: A survey. ACM Comput. Surv. 2021;54(7):1–35. [Google Scholar]
- 31.L. Canales, P. Martínez-Barco, Emotion detection from text: A survey, in: Proceedings of the Workshop on Natural Language Processing in the 5th Information Systems Research Working Days (JISIC), 2014, pp. 37–43.
- 32.Ekman P. An argument for basic emotions. Cogn. Emot. 1992;6(3–4):169–200. [Google Scholar]
- 33.Bandhakavi A., Wiratunga N., Padmanabhan D., Massie S. Lexicon based feature extraction for emotion text classification. Pattern Recognit. Lett. 2017;93:133–142. [Google Scholar]
- 34.Baziotis C., Nikolaos A., Chronopoulou A., Kolovou A., Paraskevopoulos G., Ellinas N., Narayanan S., Potamianos A. Proceedings of the 12th International Workshop on Semantic Evaluation. Association for Computational Linguistics; New Orleans, Louisiana: 2018. NTUA-SLP at SemEval-2018 task 1: Predicting affective content in tweets with deep attentive RNNs and transfer learning; pp. 245–255. [DOI] [Google Scholar]
- 35.Al-Omari H., Abdullah M.A., Shaikh S. 2020 11th International Conference on Information and Communication Systems (ICICS) IEEE; 2020. Emodet2: Emotion detection in english textual dialogue using bert and bilstm models; pp. 226–232. [Google Scholar]
- 36.Sanh V., Debut L., Chaumond J., Wolf T. 2019. DistilBERT, a distilled version of BERT: smaller, faster, cheaper and lighter. ArXiv, abs/1910.01108. [Google Scholar]
- 37.Hartmann J. 2022. Emotion english DistilRoBERTa-base. https://huggingface.co/j-hartmann/emotion-english-distilroberta-base/ [Google Scholar]
- 38.Newman N., Fletcher R., Robertson C.T., Eddy K., Nielsen R.K. 2022. Reuters institute digital news report 2022. [Google Scholar]
- 39.Xue J., Chen J., Chen C., Zheng C., Li S., Zhu T. Public discourse and sentiment during the COVID 19 pandemic: Using latent Dirichlet allocation for topic modeling on Twitter. PLoS One. 2020;15 doi: 10.1371/journal.pone.0239441. [DOI] [PMC free article] [PubMed] [Google Scholar]
- 40.Mohammad S., Turney P. Crowdsourcing a word-emotion association lexicon. Comput. Intell. 2013;29 doi: 10.1111/j.1467-8640.2012.00460.x. [DOI] [Google Scholar]
- 41.R. Ebeling, C.A.C. Sáenz, J.C. Nobre, K. Becker, Analysis of the influence of political polarization in the vaccination stance: the Brazilian COVID-19 scenario, in: Proceedings of the International AAAI Conference on Web and Social Media, Vol. 16, 2022, pp. 159–170.
- 42.Newman N., Fletcher R., Schulz A., Andi S., Robertson C.T., Nielsen R.K. Reuters institute digital news report 2021. Reuters Inst. Study J. 2021 [Google Scholar]
- 43.Twitter I. 2022. Twitter context annotations: List of entities. https://github.com/twitterdev/twitter-context-annotations. [Google Scholar]
- 44.McCallum A.K. 2002. MALLET: A machine learning for language toolkit. http://mallet.cs.umass.edu. [Google Scholar]
- 45.Syed S., Spruit M. 2017 IEEE International Conference on Data Science and Advanced Analytics (DSAA) 2017. Full-text or abstract? Examining topic coherence scores using latent Dirichlet allocation; pp. 165–174. [DOI] [Google Scholar]
- 46.Cohen J. Routledge; 2013. Statistical Power Analysis for the Behavioral Sciences. [Google Scholar]
- 47.McHugh M.L. The chi-square test of independence. Biochem. Med. 2013;23(2):143–149. doi: 10.11613/BM.2013.018. [DOI] [PMC free article] [PubMed] [Google Scholar]
- 48.MacKinnon J.G. Approximate asymptotic distribution functions for unit-root and cointegration tests. J. Bus. Econom. Statist. 1994;12(2):167–176. [Google Scholar]
- 49.Villi M., Aharoni T., Tenenboim-Weinblatt K., Boczkowski P.J., Hayashi K., Mitchelstein E., Tanaka A., Kligler-Vilenchik N. Taking a break from news: A five-nation study of news avoidance in the digital era. Digit. J. 2022;10(1):148–164. [Google Scholar]
- 50.Li D., Chaudhary H., Zhang Z. Modeling spatiotemporal pattern of depressive symptoms caused by COVID-19 using social media data mining. Int. J. Environ. Res. Public Health. 2020;17(14):4988. doi: 10.3390/ijerph17144988. [DOI] [PMC free article] [PubMed] [Google Scholar]
- 51.Lerner J.S., Keltner D. Beyond valence: Toward a model of emotion-specific influences on judgement and choice. Cogn. Emot. 2000;14(4):473–493. [Google Scholar]
- 52.Yaribeygi H., Panahi Y., Sahraei H., Johnston T.P., Sahebkar A. The impact of stress on body function: A review. EXCLI J. 2017;16:1057. doi: 10.17179/excli2017-480. [DOI] [PMC free article] [PubMed] [Google Scholar]
- 53.Flood B. ‘The View’ co-host Meghan McCain: I have a better chance of getting shot in DC than contracting COVID. Fox News. 2021 [Google Scholar]
- 54.Hein A. COVID-19 mask mandates associated with increased paranoia, study suggests. Fox News. 2021 [Google Scholar]
- 55.Song H. Why do people (sometimes) become selective about news? The role of emotions and partisan differences in selective approach and avoidance. Mass Commun. Soc. 2017;20(1):47–67. [Google Scholar]
- 56.Kaity M., Balakrishnan V. Sentiment lexicons and non-English languages: a survey. Knowl. Inf. Syst. 2020;62(12):4445–4480. doi: 10.1007/s10115-020-01497-6. [DOI] [Google Scholar]
Associated Data
This section collects any data citations, data availability statements, or supplementary materials included in this article.
Data Availability Statement
Data will be made available on request.