

Abstract
Kaposi’s sarcoma-associated herpesvirus (KSHV) is the etiologic agent of Kaposi’s sarcoma (KS), yet the viral genetic factors that lead to the development of KS in KSHV-infected individuals have not been fully elucidated. Nearly, all previous analyses of KSHV genomic evolution and diversity have excluded the three major internal repeat regions: the two origins of lytic replication, internal repeats 1 and 2 (IR1 and IR2), and the latency-associated nuclear antigen (LANA) repeat domain (LANAr). These regions encode protein domains that are essential to the KSHV infection cycle but have been rarely sequenced due to their extended repetitive nature and high guanine and cytosine (GC) content. The limited data available suggest that their sequences and repeat lengths are more heterogeneous across individuals than in the remainder of the KSHV genome. To assess their diversity, the full-length IR1, IR2, and LANAr sequences, tagged with unique molecular identifiers (UMIs), were obtained by Pacific Biosciences’ single-molecule real-time sequencing (SMRT-UMI) from twenty-four tumors and six matching oral swabs from sixteen adults in Uganda with advanced KS. Intra-host single-nucleotide variation involved an average of 0.16 per cent of base positions in the repeat regions compared to a nearly identical average of 0.17 per cent of base positions in the remainder of the genome. Tandem repeat unit (TRU) counts varied by only one from the intra-host consensus in a majority of individuals. Including the TRU indels, the average intra-host pairwise identity was 98.3 per cent for IR1, 99.6 per cent for IR2 and 98.9 per cent for LANAr. More individuals had mismatches and variable TRU counts in IR1 (twelve/sixteen) than in IR2 (two/sixteen). There were no open reading frames in the Kaposin coding sequence inside IR2 in at least fifty-five of ninety-six sequences. In summary, the KSHV major internal repeats, like the rest of the genome in individuals with KS, have low diversity. IR1 was the most variable among the repeats, and no intact Kaposin reading frames were present in IR2 of the majority of genomes sampled.
Keywords: Kaposi’s sarcoma-associated herpesvirus (KSHV), Kaposi’s sarcoma (KS), internal repeat sequences, pacific Biosciences (PacBio), unique molecular identifiers (UMIs), single-molecule real-time sequencing (SMRT)
Introduction
Kaposi’s sarcoma-associated herpesvirus (KSHV) is the etiologic agent of Kaposi’s sarcoma (KS) (Moore and Chang 2014), a multicentric, angioproliferative endothelial disease with few effective treatments available (Andrei and Snoeck 2015). KSHV is consistently found in KS lesions (Moore and Chang 2014) and is primarily transmitted by intermittent shedding in saliva (Koelle et al. 1997; Pauk et al. 2000; Casper et al. 2004, 2007). KSHV typically enters latency upon infection of cells in vitro and in vivo, during which the genome forms a covalently closed circular episome tethered to host cell chromosomes (Purushothaman et al. 2016). Expression of certain KSHV genes is associated with the maintenance of latency and enhanced host cell survival (Sin and Dittmer 2013; Purushothaman et al. 2016; Yan et al. 2019). Upon reactivation, lytic genes are expressed in a highly ordered and staged fashion (Aneja and Yuan 2017; Yan et al. 2019). Individual latent and lytic KSHV genes, or perhaps dysregulated expression thereof, are integral to the oncogenicity of KSHV (Mariggiò, Koch, and Schulz 2017).
The ∼165-kb KSHV genome has three major internal repetitive sequence regions (in addition to a terminal repeat (TR) region) (Supplementary Fig. S1A): the two origins of lytic replication (Ori-Lyt) found in internal repeats 1 and 2 (IR1 and IR2) (AuCoin et al. 2002; Lin et al. 2003), and the central repeat domain of the latency-associated nuclear antigen (LANA) gene, termed LANAr. IR1 and IR2 are 1.1-kb inverted homologs with approximately 86.5 per cent sequence identity. Each has two 0.3–1.4-kb GC-rich direct repeat families—referred to as DR1 and DR2 in IR1 and DR5 and DR6 in IR2 (Supplementary Fig. S1B). The four direct repeat families have different tandem repeat unit (TRU) sequences of length 20 bp in DR1, 31–32 bp in DR2, and 23 bp in DR5 and DR6, although the tandem repeat numbers vary widely across different KSHV strains (Gao et al. 1999; Li et al. 2002). TRUs are necessary for KSHV lytic replication since their progressive deletion eliminates KSHV Ori-Lyt–mediated transactivation (AuCoin et al. 2002; Lin et al. 2003; Wang et al. 2006).
Amino acid repeats in mammals are overrepresented in transcription factors and proteins that have numerous interaction partners (Cruz, Roux, and Robinson-Rechavi 2009; Schaefer, Wanker, and Andrade-Navarro 2012). They are thought to serve as flexible linkers between domains and stabilize protein–protein interactions (Cruz, Roux, and Robinson-Rechavi 2009; Schaefer, Wanker, and Andrade-Navarro 2012). The internal repeat regions of KSHV are transcribed and can encode proteins. The noncoding ribonucleic acid (RNA) expressed from IR1, T1.4, is comprised largely of DR1 and DR2 repeat families. T1.4 is necessary for KSHV Ori-Lyt-dependent replication (Wang et al. 2004, 2006) and for interactions of KSHV viral co-transactivator bZIP with Ori-Lyt (Liu, Wang, and Yuan 2018). Multiple transcripts through DR6 and DR5 in IR2 derived from the opposite strand are transcribed in latently infected cells and in KS tumors (Sadler et al. 1999; Rose et al. 2018) (Supplementary Fig. S1B). These encode isoforms of the Kaposin protein and are translated from cryptic cytosine/uradine/guanine (CUG) start sites immediately upstream of DR6 in some KSHV strains (Sadler et al. 1999). Kaposin B promotes the stability of mRNA with adenine/uridine-rich elements, particularly those encoding cytokines and the lymphatic differentiation transcription factor PROX1 (McCormick and Ganem 2005, 2006; Yoo et al. 2010), by Kaposin B–mediated dispersion of p-bodies (Corcoran, Johnston, and McCormick 2015). It also associates with the cell cycle regulator c-Myc to promote angiogenesis (Chang et al. 2016; Wu et al. 2011) and phosphorylates the Signal transducer and activator of transcription 3 proto-oncogene, leading to increased activation of pro-inflammatory genes (King 2013). However, there are polymorphisms in IR2 that shift reading frames through DR6 and DR5, resulting in the expression of additional Kaposin isoforms or the loss of all typical translation start sites from that region (Li et al. 2002; Rose et al. 2018).
LANAr encodes the highly acidic, repetitive central domain of LANA, the key viral protein in maintaining KSHV latency and episome propagation to daughter cells (Purushothaman et al. 2016). LANA interacts with a myriad of proteins, including transcriptional activators, cell cycle regulators, tumor suppressors, antiviral sensors, heterochromatin modifiers and deoxynucleic acid (DNA) repair proteins (Ballestas and Kaye 2011; Weidner-Glunde, Mariggiò, and Schulz 2017). Deletion of the LANAr region eliminates activation of a viral promoter and results in diffuse intranuclear distribution of LANA (Viejo-Borbolla et al. 2003). LANAr also contributes to the extraordinarily long half-life of LANA: retarding translation, inhibiting proteasomal degradation, interfering with antigen processing for major histocompatibly complex-I peptide presentation (Kwun et al. 2007, 2011; Zaldumbide et al. 2007), and inducing efficient ribosomal frameshifting to produce alternative LANA isoforms (Kwun et al. 2014). G-rich sequences within LANAr form G-quadruplex secondary mRNA structures that negatively regulate translation (Dabral et al. 2020). The LANAr region is also highly variable between strains (Gao et al. 1999), which could conceivably influence the affinities of LANA isoforms to its protein targets.
Repeat sequence heterogeneity has been shown to be consequential for infections with other DNA viruses. The IR1 of the Epstein–Barr virus (EBV) was observed to have more minor sequence variants or imperfect repeats in tumor-derived strains and long-established cell lines compared to non-tumor-derived strains (i.e. from blood or saliva) (Ba Abdullah et al. 2017). Repairing defects in IR1 of the EBV lab strain B-95 resulted in higher production of large EBNA-LP isoforms and higher transforming efficiency (Ba Abdullah et al. 2017; Szymula et al. 2018). GC-rich repeats in EBV Ori-Lyts adopt triple helical DNA structures that, when interrupted by point mutations, abrogate Ori-Lyt-dependent replication (Portes-Sentis, Sergeant, and Gruffat 1997). The John Cunniingham (JC) polyomavirus Ori-Lyt pentanucleotide repeat AGGGA, the elements of which are present in KSHV GC–rich tandem repeats (AuCoin et al. 2002), regulates DNA replication and transcription, depending on the host cell type (Chun-Fan, Hiroomi, and Khalili 1994; Liu et al. 1997). Mutations that delete or disrupt Ori-Lyt repeats in the BK and SV40 polyomaviruses result in viruses unable to fully replicate but that are highly transforming (Gluzman 1981; Watanabe and Yoshiike 1985).
Despite being sites of perceived rapid evolution (Gemayel et al. 2012), repeat regions are rarely sequenced in KSHV genomes because their long, GC-rich repeats are mostly insurmountable by short-read sequencing. Short reads also map erroneously to homologous sequences between IR1 and IR2. To overcome these constraints and accurately assess the intra-host diversity of KSHV major internal repeats, single-molecule real-time (SMRT) Pacific Biosciences long-read sequencing was performed along with UMI tags, which are applied before polymerase chain reaction (PCR) amplification (SMRT-UMI) (Dylan et al. 2023). The full-length sequences of IR1, IR2, and LANAr from one to two tumors and zero to one oral swab were obtained by SMRT-UMI from sixteen Ugandan adults with KS. This study revealed similar intra-host diversity in the KSHV repeat versus non-repeat regions at the point mutational level, distinct intra-host populations of repeats, frequent imperfect repeats in IR1, and frequent loss of the capacity to express Kaposin B from IR2.
Methods
Study cohort, specimen collection, and ethics statement
KS tumor biopsies and oral swabs were obtained from thirty-eight individuals enrolled in the ‘HIPPOS’ study, an ongoing cohort of chemotherapy- and antiretroviral therapy-naïve human immunodeficiency virus (HIV)+KS and endemic (HIV-) KS patients presenting to the Uganda Cancer Institute in Kampala, Uganda, from 2012 to present (Phipps et al. 2022). The tumor samples were derived from DNA remaining from previous whole KSHV genome sequencing studies (Rose et al. 2018; Santiago et al. 2021, 2022). CD4+ cell numbers were determined, and HIV plasma RNA levels were assayed by quantitative RT-PCR. This protocol was approved by the Fred Hutchinson Cancer Research Center Institutional Review Board, the Makerere University School of Medicine Research and Ethics Committee, and the Uganda National Council on Science and Technology. All study participants provided written informed consent.
SMRT-UMI sequencing of KSHV major internal repeat regions
UMI-tagged, single-stranded copies of IR1, IR2, and LANAr were simultaneously generated from DNA extracts of individual tumor biopsies and oral swabs in 25 µl linear extension reactions. UMI-tagged reverse primers for IR1, IR2, and LANAr were derived from conserved sequences downstream of the repeat regions, a random 8-nt UMI, and binding sites for nested PCR primers (Supplementary Table S1). All primers were synthesized by Integrated DNA Technologies (https://www.idtdna.com/pages) with ‘Hand-Mix’ for the 8-nt UMI. The PrimeSTAR GXL kit (TaKaRa Bio) was used for all PCR reactions.
An amount of DNA corresponding to a maximum of 1,500 KSHV genome copies, estimated from droplet digital PCR from four viral genomic regions (Santiago et al. 2022), was used per reaction. Sixteen microliters of oral swab DNA extracts were used per reaction, regardless of the measured copy number, which was typically less than 300. Conditions for the single-strand synthesis reaction were 98°C for 4 min; 60°C for 20 s, 68°C for 6 min, and then hold at 4°C. Unincorporated primers were removed using 0.7× volume of AMpure XP magnetic beads (Beckman Coulter Life Sciences) with three washes of 80 per cent ethanol and then eluted in 20 µl water.
Single-stranded copies of IR1, IR2, and LANAr were amplified separately by the nested PCR using three rounds of PCR with low cycle numbers to minimize the potential for PCR recombination and heteroduplex formation as reagents are depleted (Westfall et al. in review). ThermaStop (Thermagenix, Inc.) was added to all PCR reactions to increase the specificity of PCR primer binding. Primer pairs corresponded to, on the one end, a conserved sequence upstream of the repeats and, on the other end, the primer-binding sites on UMI-tagged primers. For the first-round PCR, 100–200 KSHV genome copies were added per 25 µl reaction.
Conditions for the first-round PCRs were 95°C for 4 min and then twenty-two cycles of 98°C for 20 s, 61°C for 15 s, and 68°C for 5 min, and then hold at 4°C. After the reaction, all 25-µl reactions containing the same samples were pooled together, and 30 µl of this mixture was purified by size selection on a Blue Pippin instrument (Sage Science) using a 0.75 per cent agarose cassette, with low-voltage 1–6-kb definition and marker S1 on the Tight mode setting. The size range collected was between 1 and 4 kb. Two microliters of the Blue Pippin–purified, first-round PCR products was used as a template for 25-µl second-round PCR using inner nested PCR primers. Conditions for the second-round PCRs were 95°C for 4 min and then 15 cycles of 98°C for 20 s, 63°C for 15 s, and 68°C for 4 min, and then hold at 4°C. To remove unincorporated primers, the second-round PCR products were purified using 0.7× volume AMpure XP magnetic beads and eluted in 20-µl water. Ten microliters of the eluate was used for a third hemi-nested round of PCR with a primer that appended an eight-base sample index sequence, allowing multiple samples to be combined for sequencing. Conditions for the third-round PCRs were 95°C for 4 min and then ten cycles of 98°C for 20 s, 55°C for 15 s, and 65°C for 4 min, and then hold at 4°C. The final PCR products were separated on a 0.8 per cent agarose gel to assess sizes and the DNA extracted by quick gel purification using NucleoSpin Clean-up Columns (Machery-Nagel, Inc.). If PCR products were not visible on the gel, the second- and/or third-round PCR was repeated.
The concentrations of purified PCR products were determined using the Qubit dsDNA HS Assay Kit (ThermoFisher). Purified PCR products were then pooled in equimolar amounts, purified with 0.7× volume AMpure XP magnetic beads, and quantitated with the Qubit. Library preparation was performed on each pool using the SMRTbell Express Template Prep Kit 2.0 or SMRTbell Template Prep Kit (Pacific Biosciences). Each library received a different barcoded adapter from the Barcoded Overhang Adapter Kit-8A (Pacific Biosciences). Completed libraries were sequenced on either the Sequel I or Sequel II instruments (Pacific Biosciences).
Demultiplexing and UMI template consensus processing
A custom bioinformatic pipeline was used to demultiplex SMRT-UMI-consensus reads from PacBio sequencing (https://github.com/MurrellGroup/PORPIDpipeline) (Westfall et al. in review). Briefly, each read corresponds to one circular consensus sequence (CCS) produced from one PacBio sequencing well. CCS reads were filtered for length and quality and demultiplexed using the sample index sequence in the third-round PCR primer. Next, reads with UMIs resulting from heteroduplexes and those with nonstandard length were removed. All CCS reads with the same UMI, i.e. a ‘UMI family’, were combined and those that were inferred to be likely real using the latent Dirichlet allocation of the UMI sequences and their abundance were retained. Any family with a likely real UMI comprised of at least five CCS reads were used to create a UMI-consensus sequence from all the reads using k-mer vector clustering. Taking the consensus of many CCS reads with identical UMIs removes errors that accumulate during PCR and sequencing, converging at the sequence of the original DNA template labeled by one UMI. Hence, the number of UMIs obtained from a given sample is equivalent to the number of the original DNA template molecules sequenced, hereafter referred to as ‘templates’. Taking the simple majority consensus (>50 per cent) of the base or gap at each position in an alignment of all templates within one individual is hereafter referred to as ‘intra-host consensus’. The simple majority consensus of all templates within one tissue sample is hereafter called ‘tissue-specific consensus’. Aligned sequences of all templates obtained by SMRT-UMI that were used to generate intra-host and tissue-specific consensuses are provided in Supplementary Alignment S1.
Sequences were deposited in GenBank under accession numbers MT510648.2 (U003-C, IR1, IR2, and LANAr); MT510665.2 (U004-D, IR1, IR2, and LANAr); MT510654.2 (U007-B, IR1, IR2, and LANAr); MT510656.2 (U008-B, IR1, IR2, and LANAr); MT510666.2 (U020-B, IR1, IR2, and LANAr); MZ923826.2 (U021-C, IR1, IR2, and LANAr); MT510670.2 (U030-C, IR1, IR2, and LANAr); MT510652.2 (U032-B, IR1, IR2, and LANAr); MT510659.2 (U034-B, IR1, IR2, and LANAr); MZ923810.2 (U048-D, IR1, IR2, and LANAr); MZ923822.2 (U156-B, IR1, IR2, and LANAr); MZ923816.2 (U191-B, IR1, IR2, and LANAr); MZ923817.2 (U210-B, IR1, IR2, and LANAr); MZ923819.2 (U215-D, IR1, IR2, and LANAr); MZ923820.2 (U216-D, IR1, IR2, and LANAr); OQ809976.1 (U217-D, IR1); and OQ809977.1 (U217-D, IR2).
Analysis of associations between clinical and tumor traits and viral mutations
Participant characteristics were summarized by median and range when appropriate or categorized and summarized by proportion. Repeat region polymorphisms were classified into binary categories and treated as dependent variables in logistic regression used to estimate odds ratios (ORs), with 95 per cent confidence intervals (95 per cent CIs) based on a robust estimator. Exact logistic regression was used when logistic regression failed due to categories with no participants.
The Kaplan–Meier analysis was used to estimate overall survival at 1 year from study enrollment, with log-rank tests to compare the groups. Hazard ratios (HRs) for mortality with 95 per cent CIs were estimated using Cox regression with robust standard errors. Results were considered significant with two-tailed P < 0.05, with no multiple tests corrections applied.
Results
Participant characteristics
This study included thirty-eight individuals with KS (Table 1). Eight (21 per cent) were female and most (thirty-four; 89 per cent) were HIV-infected. Based on the AIDS Clinical Trials Group (ACTG) staging system (Krown, Metroka, and Wernz 1989), thirty-two (84 per cent) of the KS cases were poor-risk (T-stage = 1), and twenty-seven (71 per cent) had systemic symptoms (S-stage = 1). Among the thirty-four HIV-infected participants, eighteen (53 per cent) had a CD4+ T-cell count of <200/µl (I-stage = 1) with a median HIV viral load of 3.16 × 10⁵ (log 5.5) copies/ml.
Table 1.
Study participant characteristics.
| N or mediana | Per cent or (IQR)a | |
|---|---|---|
| Number of participants | 38 | 100 |
| Gender: male | 30 | 78.9 |
| Age in years, median | 34 | (26, 40) |
| KS stageb | ||
| Tumor extent (T1) | 32 | 84.2 |
| Immune status (I1) (CD4 <200)c | 18 | 52.9 |
| Systemic symptoms (S1) | 27 | 71.1 |
| HIV-positive individuals | 34 | 89.5 |
| CD4 T-cell cells/mm3 | 195 | (70, 306) |
| Plasma HIV RNA (log10 copies/ml) | 5.5 | (5.1, 5.8) |
| Plasma KSHV detectedd | 35 | 94.6 |
| Plasma KSHV (log10 copies/ml)e | 4.1 | (3.6, 4.7) |
| Sites with lesions (from a total of eight sites) | 4.5 | (3, 6) |
| Any head/neck/oral lesions | 24 | 63.2 |
| Any nodular lesions | 31 | 81.6 |
The median and interquartile range (25th percentile, 75th percentile) values are shown in italics.
KS staging following AIDS Clinical Trial Group guidelines (Krown, Metroka, and Wernz 1989): T-stage = 1: tumors not limited to skin, with extensive oral, gastrointestinal, and visceral KS; I-stage = 1: CD4+ T-cell count <200/µl, NA if HIV (−); S-stage = 1: systemic illness (fever, night sweats, >10 per cent weight loss, diarrhea for >2 weeks, and opportunistic infections).
Among HIV-positive participants only.
Excludes one participant with missing information.
Among participants with detectable plasma KSHV RNA (>150 copies/ml).
SMRT-UMI sequencing results
SMRT-UMI sequencing of the three internal repeat regions (IR1, IR2, and/or LANAr) was successful for one tumor each from eight individuals and for two tumors each from eight others (Table 2). As a result of low recovery of suitable quality DNA, repeat regions from matching oral swabs were obtained from only six of these individuals. IR1 sequences were obtained from twenty-three tumor biopsies and four oral swabs from a total of sixteen study participants, IR2 sequences were obtained from twenty tumor biopsies and four oral swabs from sixteen participants, and LANAr sequences were obtained from twenty-three tumor biopsies and four oral swabs from sixteen participants. Repeat sequences from at least two samples were obtained from eleven individuals, including four tumor–oral swab pairs each for IR1, IR2, and LANAr.
Table 2.
Template counts and intra-host diversity of KSHV repeats in tumors and oral swabs from sixteen individuals.
| Number of samples | Templates | TRU counts | |||||||||||||
|---|---|---|---|---|---|---|---|---|---|---|---|---|---|---|---|
| PtIDa | Region | Tumor | Oral | Total | Intra-host consensus length (bp) | SNV | Longest poly-G | Tumor | Oral | Total | Intra-host consensus in DR1 | Fraction of templatesb | Intra-host consensus in DR2 | Fraction of templatesb | Pairwise identityd (per cent) |
| U003 | IR1 | 1 | 0 | 1 | 4 | 0 | 4 | 2,615 | 1 | 8 | 58 | 3/4 | 6 | 1 | 99.7 |
| U004 | IR1 | 2 | 0 | 2 | 34, 24 | 0 | 58 | 2,354 | 11 | 8 | 48 | 48/58 | 4c | 1 | 99.7 |
| U007 | IR1 | 1 | 1 | 2 | 8 | 2 | 10 | 2,736 | 4 | 10–11 | 62c | 8/10 | 7 | 1 | 97.2 |
| U008 | IR1 | 2 | 1 | 3 | 11, 2 | 2 | 15 | 2,364 | 2 | 10 | 47 | 1 | 5 | 1 | 100.0 |
| U020 | IR1 | 2 | 1 | 3 | 3, 13 | 1 | 17 | 2,113 | 3 | 15–20 | 34 | 14/20 | 6 | 17/20 | 98.7 |
| U021 | IR1 | 2 | 0 | 2 | 52, 67 101 | 0 | 119 | 1,876 | 10 | 11–14 | 20 | 68/119 | 6 | 1 | 98.9 |
| U030 | IR1 | 1 | 0 | 1 | 21 | 0 | 21 | 2,043 | 4 | 8 | 21 | 21/21 | 9 | 1 | 100.0 |
| U032 | IR1 | 1 | 0 | 1 | 3 | 0 | 3 | 2,279 | 1 | 8 | 45 | 1 | 4 | 1 | 100.0 |
| U034 | IR1 | 2 | 0 | 2 | 7, 9 | 0 | 16 | 2,184 | 0 | 11–13 | 38 | 15/16 | 5 | 1 | 99.9 |
| U048 | IR1 | 2 | 0 | 2 | 28, 62 | 0 | 90 | 1,897 | 4 | 16–19 | 17 | 1 | 9 | 1 | 99.9 |
| U156 | IR1 | 2 | 0 | 2 | 31, 92 | 0 | 123 | 2,215 | 11 | 8 | 38 | 95/110 | 6 | 109/110 | 97.7 |
| U191 | IR1 | 1 | 0 | 1 | 15 | 0 | 15 | 2,383 | 6 | 13–25 | 46 | 1 | 7 | 1 | 99.8 |
| U210 | IR1 | 1 | 0 | 1 | 31 | 0 | 31 | 2,521 | 3 | 8–9 | 39 | 20/32 | 16c | 26/32 | 91.1 |
| U215 | IR1 | 1 | 0 | 1 | 46 | 0 | 46 | 1,898 | 6 | 11–14 | 25 | 1 | 5 | 44/47 | 99.7 |
| U216 | IR1 | 1 | 0 | 1 | 132 | 0 | 126 | 1,754 | 4 | 9–12 | 15 | 126/127 | 7 | 126/127 | 99.9 |
| U217 | IR1 | 1 | 1 | 2 | 20 | 2 | 22 | 1,603 | 2 | 9 | 11c | 12/23 | 5 | 19/23 | 90.7 |
| (Sum), median | (23) | (4) | (27) | 21.5 | 2,200 | 98.3 | 98.3 | ||||||||
| DR5 | DR6 | ||||||||||||||
| U003 | IR2 | 1 | 1 | 2 | 1 | 1 | 2 | 2,372 | 0 | 11 | 19 | 1 | 10 | 1 | 100.0 |
| U004 | IR2 | 2 | 1 | 3 | 34, 1 | 3 | 38 | 2,355 | 7 | 10–11 | 21 | 37/40 | 13 | 30/40 | 98.4 |
| U007 | IR2 | 1 | 1 | 2 | 17 | 3 | 20 | 1,992 | 1 | 7 | 15 | 1 | 6 | 1 | 100.0 |
| U008 | IR2 | 1 | 1 | 2 | 2 | 3 | 5 | 2,224 | 0 | 8 | 18 | 1 | 8 | 1 | 100.0 |
| U020 | IR2 | 1 | 0 | 1 | 3 | 0 | 3 | 2,415 | 1 | 7 | 28 | 2/3 | 11 | 1 | 99.5 |
| U021 | IR2 | 2 | 0 | 2 | 12, 25 | 0 | 37 | 2,227 | 5 | 7 | 23 | 26/39 | 8 | 26/39 | 96.7 |
| U030 | IR2 | 1 | 0 | 1 | 74 | 0 | 74 | 1,946 | 10 | 8 | 17 | 1 | 3c | 1 | 100.0 |
| U032 | IR2 | 1 | 0 | 1 | 4 | 0 | 4 | 2,100 | 1 | 9 | 18 | 1 | 8 | 1 | 100.0 |
| U034 | IR2 | 1 | 0 | 1 | 7 | 0 | 7 | 2,252 | 0 | 9–10 | 23 | 1 | 9 | 1 | 100.0 |
| U048 | IR2 | 2 | 0 | 2 | 31, 108 | 0 | 139 | 2,224 | 10 | 8–10 | 17 | 132/139 | 13c | 1 | 99.9 |
| U156 | IR2 | 2 | 0 | 2 | 29, 9 | 0 | 38 | 2,385 | 3 | 10–12 | 33c | 33/34 | 5 | 1 | 99.8 |
| U191 | IR2 | 1 | 0 | 1 | 6 | 0 | 6 | 2,206 | 1 | 7 | 19 | 5/6 | 12 | 1 | 99.7 |
| U210 | IR2 | 1 | 0 | 1 | 56 | 0 | 56 | 1,849 | 1 | 11–13 | 3c | 1 | 12 | 59/61 | 99.9 |
| U215 | IR2 | 1 | 0 | 1 | 19 | 0 | 19 | 1,896 | 2 | 6–8 | 8 | 1 | 9 | 1 | 99.3 |
| U216 | IR2 | 1 | 0 | 1 | 88 | 0 | 88 | 2,252 | 11 | 7 | 22 | 72/84 | 10 | 1 | 99.7 |
| U217 | IR2 | 1 | 0 | 1 | 33 | 0 | 33 | 2,084 | 1 | 7 | 13 | 31/32 | 8 | 1 | 99.9 |
| (Sum), median | (20) | (4) | (24) | 27 | 2,226 | 99.6 | |||||||||
| U003 | LANAr | 1 | 0 | 1 | 1 | 0 | 1 | 1,693 | – | – | – | ||||
| U004 | LANAr | 2 | 1 | 3 | 30, 40 | 6 | 76 | 1,492 | 9 | N/A | 99.9 | ||||
| U007 | LANAr | 1 | 1 | 2 | 17 | 12 | 29 | 1,489 | 1 | N/A | 100.0 | ||||
| U008 | LANAr | 2 | 1 | 3 | 27, 6 | 13 | 46 | 1,183 | 3 | N/A | 99.8 | ||||
| U020 | LANAr | 2 | 1 | 3 | 2, 13 | 1 | 16 | 1,741 | 2 | N/A | 100.0 | ||||
| U021 | LANAr | 2 | 0 | 2 | 46, 67 | 0 | 113 | 1,522 | 6 | N/A | 100.0 | ||||
| U030 | LANAr | 1 | 0 | 1 | 91 | 0 | 91 | 1,567 | 6 | N/A | 99.9 | ||||
| U032 | LANAr | 1 | 0 | 1 | 8 | 0 | 8 | 1,807 | 1 | N/A | 99.9 | ||||
| U034 | LANAr | 2 | 0 | 2 | 5, 12 | 0 | 17 | 1,456 | 1 | N/A | 100.0 | ||||
| U048 | LANAr | 2 | 0 | 2 | 37, 131 | 0 | 168 | 1,909 | 24 | N/A | 99.8 | ||||
| U156 | LANAr | 2 | 0 | 2 | 86, 36 | 0 | 122 | 1,624 | 9 | N/A | 100.0 | ||||
| U191 | LANAr | 2 | 0 | 2 | 5, 1 | 0 | 6 | 1,735 | 1 | N/A | 100.0 | ||||
| U210 | LANAr | 1 | 0 | 1 | 59 | 0 | 59 | 1,636 | 4 | N/A | 100.0 | ||||
| U215 | LANAr | 1 | 0 | 1 | 21 | 0 | 21 | 1,741 | 2 | N/A | 94.1 | ||||
| U216 | LANAr | 1 | 0 | 1 | 76 | 0 | 76 | 1,909 | 6 | N/A | 94.3 | ||||
| U217 | LANAr | 0 | 0 | 0 | 0 | 0 | 0 | – | – | – | – | ||||
| (Sum), median | (23) | (4) | (27) | 38.5 | 1,636 | 99.1 | |||||||||
| Total (medians) | 21.5 | 2.5 | 26.5 | ||||||||||||
PtID—participant identifier.
The fraction of templates with the intra-host consensus TRU count divided by the total number of sequenced templates obtained.
Includes mismatches and gap versus non-gap sites but excluding gap versus gap sites; the bolded values indicate ≥99.9 per cent pairwise identity.
The most or least number of TRU counts.
The efficiency of SMRT-UMI varied between the sample types and between the target repeat regions. A median of 21.5 templates, range 1–171, were obtained from tumors, while a median of 2.5 templates, range 1–13, were obtained from oral swabs (Table 2). The median number of template sequences obtained for IR1 was 21.5, for IR2 was 26.5, and for LANAr was 38.5 (Table 2). The median read depth per template in all samples was 25.8 CCS reads (Supplementary Table S2). In general, the yield of template sequences was correlated with a viral load (measured as viral genome copies/µl) with oral swabs having the lowest viral load (Supplementary Table S3; Supplementary Fig. S2).
Conserved primer-binding sites were used (Supplementary Table S1), and all amplicons generated for this study correspond to the following positions in the GK18 reference genome (GenBank Accession No. NC_009333): 23,026–25,072 for IR1; 116,208–120,321 for IR2; and 124,746–126,519 for LANAr. Upon sequencing participant samples, the median length of templates was found to be 2,200 bp (range 1,603–2,736 bp) for IR1; 2,226 bp (range 1,849–2,455 bp) for IR2; and 1,636 bp (range 1,183–1,909 bp) for LANAr (Table 2). The variation of KSHV internal repeat lengths between individuals was largely due to changes in exact counts of TRUs, leading to the overall length variation.
LANAr can be divided into three subdomains of imperfectly repeating codons (Fig. 1). All observed polymorphisms of LANAr maintained the reading frame at the intra-host consensus level. Meanwhile IR1 and IR2 both contain two direct repeat families or TRU families—DR1, DR2, DR5, and DR6 (Supplementary Fig. S1B). Each TRU family has regular TRU lengths of 20–32 bp, differing from the disorganized trinucleotide repeats of LANAr. However, some imperfect TRUs were still observed in the intra-host consensus sequences of IR1 and IR2. Hence, we systematically assessed the fidelity of repeats in IR1 and IR2 in all intra-host consensus sequences.
Figure 1.
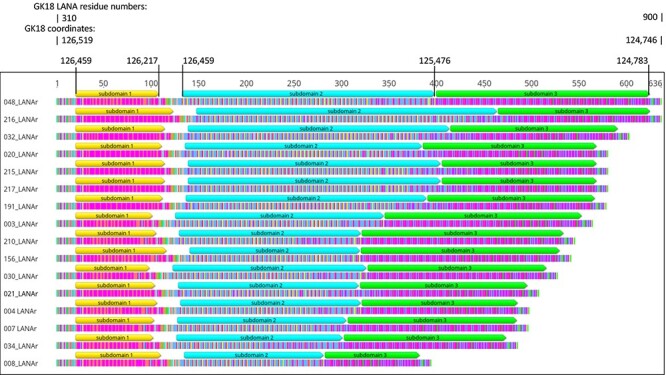
Repeat patterns in LANAr. Intra-host consensus LANAr amino acid sequences from each participant, sorted in descending length. U048 and U216 LANAr, and U020 and U215 LANAr, have identical lengths but not sequences. Color-coded translations of the codons are shown (most common amino acids: Glu—magenta, Asp—orange, Gln—blue, Pro—yellow, Val—green). The sequences shown correspond to Positions 124,746 to 126,519 in the GK18 genome (GenBank No. NC_009333) in reverse or Residues 310–900 of LANA in GK18. Coordinates of three LANAr subdomains relative to the GK18 genome are also shown.
The most common repeat motifs 20 bp and above were determined in IR1 and IR2 using RepeatFinder in Geneious (Fig. 2A and B). With few exceptions, the TRU sequences corresponding to DR1, DR2, DR5, and DR6 were identical across individuals (Supplementary Table S4). Three individuals had DR1 TRU sequences that differ from the common DR1 TRU sequence by 1–2-base substitutions. In eight of sixteen individuals, a 1-bp C insertion occurred withinDR2 TRU, plus U004 also had a C→A substitution. Moreover, in some individuals, to avoid having imperfect repeats at the ends of the TRU families, shifting the start of the TRU sequence relative to the common TRU sequence was necessary.
Figure 2.

Repeat patterns in IR1 and IR2. (A) Variation in IR1 TRU sequences. DR1 and DR2 TRUs are indicated by small purple and larger blue arrowheads, respectively. Black ticks, joined by horizontal lines when within one TRU, correspond to mismatches to the master TRU sequence in the TRU family. (B) Variation in IR2 TRU sequences. DR5 and DR6 TRUs are indicated by gold arrowheads on the left side of the figure and red arrowheads on the right side of the figure, respectively. Black ticks, joined by horizontal lines when within one TRU, correspond to mismatches to the master TRU sequence. ‘CUG’ translation start sites for Kaposins are indicated by blue arrows. (C) Colored arrowheads illustrate IR1 TRU families in Participants U003 and U007, with unique sequences differentiated by color. The master DR1 TRUs are in purple, while DR2 TRUs are larger and in blue. TRUs that are 27 bp long (pink and orange) are denoted with an asterisk. Nucleotides above the arrowheads are colored: A—red, C—blue, G—yellow, and T—green. Below each sequence is a graph of the GC content, with a sliding window size of eight.
The unit of sequence that maintained the TRU counts with the least number of imperfect repeats was designated as the ‘master’ TRU sequence. A TRU was considered an imperfect copy if the unit had less than 20 per cent nucleotide mismatches relative to the master. Defining TRU families with ≥2 imperfect repeats as ‘degraded’, IR1 had degraded TRU families in twelve of sixteen individuals (Fig. 2A) versus in only two of sixteen individuals in IR2 (Fig. 2B). Furthermore, mismatched TRUs were often found at irregular intervals in IR1, in contrast to IR2. For example, in U003 and U007, some DR1 TRUs were 27 bp in length instead of the normal 20 bp (denoted with asterisks in Fig. 2C). DR1 TRU counts also had the widest length range among the four TRU families, ranging from eleven to sixty-two between hosts (Table 2; Fig. 2A and B). In comparison, TRU counts ranged from four to sixteen in DR2, three to thirty-three in DR5, and three to thirteen in DR6. Another observation is that variable numbers of DR6 TRU elements were found downstream of the DR6 region, prior to the Kaposin translation start sites (Fig. 2B; Supplementary Fig. S1B).
Within individuals, the sequences of the KSHV internal repeats were largely conserved. Nearly, all imperfect IR1 and IR2 TRUs were conserved across a given individual’s tumor and oral swab samples (Fig. 3A and B; Supplementary Fig. S3A–AH). Most intra-host variation was derived from single-nucleotide variants (SNVs), the longest homopolymer G run in the complex repeat of IR1 (Fig. 3C) or IR2, and indels impacting TRU counts (Fig. 3A–C). On average, 0.16 per cent of base positions within the entire ∼6 kb of internal repeats had SNVs (Supplementary Table S5), comparable to an average of 0.17 per cent of base positions in the rest of the 131-kb non-repeat regions of the KSHV genome (Santiago et al. 2021). The number of SNVs detected was positively correlated with the total number of templates sequenced (r2 = 0.80) (Table 2; Supplementary Fig. S4A), but nearly all were present in only one template (Fig. 3A–E; Supplementary Fig. S3A–AH; Supplementary Alignment S1). The length of the longest homopolymer G run in IR1 and IR2 (including GK18 positions 23,946 and 118,861, respectively) tends to be variable within a host when its total length was nine or more nucleotides (Table 2); variation in runs below 8-bp length was rare. The TRU counts within a repeat region were the largest contributor to inter-host and intra-host diversity. When variable intra-host, the non-consensus TRU counts typically varied by only one or two TRUs from the intra-host consensus (Fig. 3A).
Figure 3.

Representative SMRT-UMI sequence alignments. Single-molecule sequences covering IR1, IR2, or LANAr were derived from tumor biopsies and oral swabs sequenced from four individuals and aligned to their respective intra-host consensus (topmost horizontal bar at each panel). Each TRU is indicated by colored arrowheads, and the black ticks below the arrowheads represent mismatches to the master TRU. Individual sequences are represented by light gray bars. Templates with what appear to be black bars represent a large cluster of nucleotides not found in the consensus. The intra-host variation displayed includes homopolymer G runs (hollow green arrow), SNVs (black ticks on gray bars), and TRU count differences (gaps/indels) in the alignments. Sample IDs are labeled on the left. Sequences are named by participant ID (three-digit number), sample identifier (capital letter for tumors, ‘o’ for oral swabs), internal repeat region (‘1’ for IR1, ‘2’ for IR2, and ‘L’ for LANAr), and its eight-nuclotide template UMI (boxed in red in (A)). (A) IR2 templates sequenced from Participant U191. (B) Alignment of IR1 showing distinct variants in the tumor versus the oral swab in Participant U007. Only the DR1 and DR2 region of IR1 is shown. (C) IR1 templates in Participant U020. (D) Alignments of DR1 and DR2, and DR3 and DR4 showing the variation distinguishing two tumors, 021C and 021E, from the same individual. Sequences, including at the consensus, are colored by nucleotide (A—red, C—blue, G—yellow, and T—green) and the shifts in these color patterns contrast the junctions between DR1 and DR2, and DR5 and DR6. (E) LANAr templates showing an SNV distinguishing two tumors from the same individual. (F) Alignment of IR1 showing distinct SNV and indel variants within one tumor of Participant U210.
Figure 3.

(continued)
Repeat sequence populations, defined as being composed of at least two templates sharing the same intra-host SNV or non-consensus TRU count (Fig. 3B), were detected in twelve of sixteen individuals (Table 3, part A; Supplementary Fig. S3A–AH). Among the ten individuals with at least five templates sequenced from two or more samples (Table 3, part B; Supplementary Fig. S3A–AH), seven had different tissue-specific consensus sequences in one or more repeat regions. There was an SNV or a TRU count difference in IR1 between the tumor–oral swab pairs from Participant U007 to Participant U217 (Table 3, part B; Fig. 3B; Supplementary S3AG) and an SNV plus a TRU count difference in IR2 from the tumor–oral swab pair of Participant U004 (Table 3, part B; Supplementary Fig. S3C). TRU count differences between tissue-specific consensuses from the same individual were ≤2 in all cases except for the tumor–oral swab pairs from U007 IR1 (seven TRUs) (Fig. 3B) to U217 IR1 (nineteen TRUs) (Supplementary Fig. S3AG) and between two tumors from U021, which had distinct TRU counts in both IR1 and IR2 (nineteen DR1 TRU in U021-C versus twenty-one DR1 TRU in U021-E; twenty-three DR5 and eight DR6 TRUs in U021E versus twenty-six DR5 and eleven DR6 TRUs in U021-C; Fig. 3D). Intra-host variation was also found in LANAr (Table 3, part A), including between tissue-specific consensuses (Table 3, part B). For instance, there was a shared SNV in LANAr distinguishing two tumors of Participant U020 (Table 3, part B; Fig. 3E). Distinct sequence populations were also detected within a given sample; for example, in IR1 TRU counts in tumor U210-B (Fig. 3F). In only three individuals with ≥5 templates sequenced was there no intra-host variation found in any repeat region (Table 3, part A).
Table 3.
A summary of distinct populations of repeat sequences.
| A. Difference(s) found in repeat regions within individuals (see Supplementary Fig. S3) | |||||||||
| IR1 | IR2 | LANAr | |||||||
| PtIDa | Templates | Differencesb | Supplementary Fig. S3 c | Templates | Differencesb | Supplementary Fig. S3 c | Templates | Differencesb | Supplementary Fig. S3 c |
| U003 | 4 | None | S3A | 2 | None | S3A | 1 | N/Ad | S3A |
| U004 | 58 | TRU | S3B | 39 | SNV, TRU | S3C | 76 | None | S3D |
| U007 | 10 | SNV, TRU | S3E | 21 | SNV | S3F | 31 | None | S3G |
| U008e | 15 | None | S3G | 5 | None | S3G | 46 | None | S3H |
| U020 | 20 | None | S3I | 3 | None | S3I | 16 | SNV | S3I |
| U021 | 119 | TRU | S3J | 39 | TRU | S3K | 113 | SNV | S3L |
| U030 | 21 | None | S3M | 75 | SNV | S3N | 93 | SNV | S3O |
| U032 | 3 | None | S3P | 4 | None | S3P | 8 | SNV | S3P |
| U034 | 16 | None | S3Q | 7 | None | S3Q | 17 | None | S3Q |
| U048 | 90 | None | S3R | 139 | TRU | S3S | 171 | SNV | S3T |
| U156 | 110 | None | S3U | 34 | None | S3V | 122 | None | S3W |
| U191 | 15 | None | S3X | 6 | None | S3X | 6 | SNV | S3X |
| U210 | 31 | TRU | S3Y | 61 | None | S3Z | 59 | none | S3AA |
| U215 | 48 | TRU | S3AB | 19 | TRU | S3AC | 22 | none | S3AC |
| U216 | 127 | None | S3AD | 84 | TRU | S3AE | 96 | TRU, SNV | S3AF |
| U217 | 22 | TRU | S3AG | 32 | TRU | S3AH | 0 | N/A | N/A |
| B. Difference(s) between tissue-specific consensuses within individuals (see Supplementary Fig. S3) | |||||||||
| PtID | Tumor | Oral swab | IR1f | No. g | IR2f | No.g | LANArf | No.g | |
| U004 | 2 | 1 | None | 58 | SNV (U004o), TRU (U004C); Supplementary Fig. S3C | 38 | None | 7 | |
| U007 | 1 | 1 | SNV + TRU (U007o); Supplementary Fig. S3E | 10 | None | 20 | None | 29 | |
| U008 | 2 | 1 | None | 15 | None | 5 | None | 46 | |
| U020 | 2 | 1 | None | 17 | N/A | 3 | SNV (U020C); Supplementary Fig. S3I | 16 | |
| U021 | 2 | 0 | TRU (U021C); Supplementary Fig. S3J | 117 | TRU (U021C); Supplementary Fig. S3K | 39 | None | 110 | |
| U034 | 2 | 0 | None | 14 | N/A | 7 | None | 17 | |
| U048 | 2 | 0 | None | 90 | None | 140 | None | 168 | |
| U156 | 2 | 0 | None | 123 | None | 38 | None | 122 | |
| U191 | 2 | 0 | N/A | 15 | N/A | 6 | None | 6 | |
| U217 | 1 | 1 | TRU (U217o); Supplementary Fig. S3AG | 22 | N/A | 33 | N/A | 0 | |
PtID—participant identifier.
SNV and TRU count variants were only counted when they were shared by at least two templates. Refer to Supplementary Fig. S3.
Location within Supplementary Fig. S3, where alignment is shown.
N/A—not enough template sequences available for comparison.
The bolded rows indicate individuals in which no differences were detected in any of the three repeat regions.
The tissue in which tissue-specific consensus changes were found is indicated within parentheses. N/A indicates that no template sequences from other tissues were available for comparison.
Number of templates.
Conservation at the point mutational level was high in each of the internal repeat regions—with >99.9 per cent pairwise identity within IR1, IR2, and LANAr within hosts. However, not captured by this value is the variation arising from differences in TRU numbers and other indels when assessing within or between individuals. As a measure of total intra-host sequence conservation, the percentage of all pairwise sites that were identical in a multi-sequence alignment was calculated, counting each gap versus non-gap site as a variation. Counted in this way (in Geneious Prime), the median % intra-host pairwise identity across all participants (Table 2) was 98.3 per cent for IR1 interquartile, range (IQR): 98.7 per cent, 99.9 per cent), 99.6 per cent for IR2 (IQR: 99.7 per cent, 100 per cent), and 99.1 per cent for LANAr (IQR: 99.8 per cent, 100 per cent). The least conservation found in any one individual was 90.6 per cent for IR1, 96.7 per cent for IR2, and 94.1 per cent for LANAr. IR1, IR2, and LANAr sequences had 100 per cent intra-host pairwise identity in three/sixteen, five/sixteen, and seven/fourteen individuals, respectively (Table 2). High intra-host pairwise identity was maintained even with the increasing number of templates recovered (Supplementary Fig. S4B). The consistently lower pairwise identity for IR1 reflected its higher rate of intra-host TRU count variation observed.
Kaposin protein reading frames are disrupted in the majority of IR2 sequences from Africa
Polymorphisms in IR2 sequences result in different pairs of Kaposin family ORFs that initiate transcription upstream of DR6: Kaposins B and C (termed KapB-C here), Kaposins D and E (KapD-E), Kaposins B and E (KapB-E), or no full-length open reading frame (ORF) (Kap-none) (Sadler et al. 1999; Li et al. 2002; Rose et al. 2018). The Kaposin A coding sequence starts at a highly conserved region outside IR2 and was not part of the SMRT-UMI templates generated here. The Kaposin ORFs in IR2, when present, all start from the same cryptic start ‘CTG’ codons, but in Kap-none, one CTG codon had been replaced by a ‘GCG’ (GK18: 118,927–118,925), while the other CTGs were immediately followed by an in-frame TAG stop codon (GK18: 118,878–118,876) (Fig. 4). The KapB-E genotype was found in seven individuals in this study, while Kap-none was found in the remaining nine (Supplementary Table S6). Upon examining the intra-host diversity at these CTG positions using SMRT-UMI, no SNVs were detected at the ‘CTG’, ‘GCG’, or ‘TAG’ positions where the Kaposin ORFs start. Hence, the Kaposin genotypes were found 100 per cent conserved intra-host.
Figure 4.

Translation start sites of Kaposin isoforms. Kaposin translation start sequences of genotype-representative strains BCBL-1 (GenBank No. MT936340), GK18, U215-D, and U210-B, encoding different pairs of Kaposin ORFs (KapB-C, KapD-E, KapB-E, and Kap-none), are shown. Coordinate numbering is for BCBL-1, and the encoded amino acid is shown below the nucleotide sequence. Cryptic ‘CUG’ translation start sites are shown with green arrows, and the putative products are highlighted in yellow and blue stripes. The open reading frames encode the different Kaposin isoforms indicated on the right. Sequences boxed in red show the codons that result in the loss of full-length products. Above is the genomic context of this segment, showing the complex repeat, DR6, and DR5 portions of IR2. Kaposin A is conserved and not included in the SMRT-UMI templates generated for this study.
Clinical phenotypes of IR1 and IR2 diversity
Loss of Kaposin B translation potential and IR1 repeat degradation were assessed for discernible clinical phenotype associations. Since Kaposin genotypes were found conserved intra-host, thirty-eight intra-host consensus KSHV sequences from this and previous studies (Supplementary Table S6) (Rose et al. 2018; Santiago et al. 2021, 2022) were classified based on the presence or absence of Kaposin ORFs and examined with their recorded clinical data. Clinical traits considered were HIV status; CD4+ cell count; plasma KSHV load; number of anatomic areas of tumors; KS lesions on the head, neck, or oral cavity; presence of nodular lesions; ACTG stage; survival rates; and treatment response. No statistically significant associations were observed. However, trends noted included that no perfect IR1 repeats were found in HIV-seropositive participants (P = 0.13, Table 4), and Kaposin B ORFs may be more common in participants with head, neck, or oral lesions (OR (95 per cent CI): 4.33 (0.94, 19.98), P = 0.06, Table 4). There was no significant correlation observed between Kaposin or IR1 genotypes with survival rates or treatment responses using the Kaplan–Meier (Supplementary Fig. S5) or Cox regression (Supplementary Table S7) analyses.
Table 4.
Clinical associations of repeat polymorphisms.
| IR1 perfect repeats versus degraded | Kaposin B/C open reading frames versus loss | |||||
|---|---|---|---|---|---|---|
| n = 16 | n = 38a | |||||
| OR | (95 per cent CI) | P | OR | (95 per centCI) | P | |
| Age, per 5 years | 1.17 | (0.86, 1.60) | 0.31 | 1.12 | (0.84, 1.48) | 0.44 |
| Female versus male | 0.47 | (0.03, 6.41) | 0.57 | 2.88 | (0.56, 14.75) | 0.21 |
| HIV-positive versus HIV-negative | 0.22 | (0, 3.0) | 0.13d | 2.37 | (0.22, 25.95) | 0.48 |
| CD4+ cell count, per 100/ul | 0.99 | (0.34, 2.94) | 0.99 | 0.85 | (0.66, 1.09) | 0.20 |
| HIV viral load (log10 copies/ml), per unitb | 0.50 | (0.01, 23.66) | 0.72 | 0.79 | (0.15, 4.12) | 0.78 |
| Plasma KSHV (log10 copies/ml), per unitc | 0.98 | (0.16, 6.07) | 0.98 | 1.20 | (0.44, 3.31) | 0.72 |
| No. of body sites w/lesions, per site | 0.98 | (0.59, 1.63) | 0.93 | 1.19 | (0.87, 1.62) | 0.28 |
| Any head, neck, or oral lesions | 0.67 | (0.08, 5.48) | 0.71 | 4.33 | (0.94, 19.98) | 0.06 |
| Any nodular lesions | 2.14 | (0.16, 29.46) | 0.57 | 0.96 | (0.18, 5.17) | 0.97 |
| KS T-stage 1 | 1.25 | (0.08, 19.25) | 0.87 | 0.68 | (0.12, 4.03) | 0.68 |
| KS S-stage 1 | 7.50 | (0.57, 98.37) | 0.13 | 0.82 | (0.20, 3.46) | 0.79 |
| KS I-stage 1 b | 0.67 | (0.06, 7.50) | 0.74 | 0.64 | (0.16, 2.54) | 0.52 |
Includes six individuals in a concurrent whole-genome sequencing study and sixteen from an earlier study (Rose et al. 2018), all from the HIPPOS cohort.
HIV+ only.
Among those with measured plasma KSHV RNA.
Exact logistic regression.
Discussion
The three KSHV major internal repeats, IR1, IR2, and LANAr, play important roles throughout the KSHV infection cycle (Ballestas and Kaye 2011; Wu et al. 2011; Aneja and Yuan 2017), yet their sequence diversity is rarely analyzed because of their long repetitive nature and >60 per cent GC content. Additionally, PCR amplification, which is an obligate step when sequencing low viral load clinical samples, is inherently error-prone. These challenges were overcome with SMRT-UMI. PacBio SMRT sequencing is relatively insensitive to GC content (Höijer et al. 2018). UMIs allow the detection and removal of most misincorporation errors and indels, with the consensus of reads with identical UMI converging on the original template DNA sequence pre-amplification at a single template resolution.
Single-molecule sequences of the three KSHV internal repeats were successfully obtained from one or two KS tumor biopsies and oral swabs of sixteen individuals, including four tumor–oral swab pairs each of IR1, IR2, and LANAr. A median of only 21.5 templates was obtained per sample, but the sequencing accuracy allowed for definitive observations on intra-host sequence diversity. Nearly, all SNVs were found in only one template sequence. An average of 0.16 per cent of base positions in the repeat regions had a detectable SNV intra-host, similar to the 0.17 per cent found for the rest of the KSHV genome (Santiago et al. 2021).
A heterogeneous mix of tumor and non-tumor cells is to be expected from punch biopsies used to acquire the tumor samples here and in our previous studies, detailed in Santiago et al. (2021). The minor variant populations of internal repeats were detected within more than half the individuals examined, with minor populations defined as at least two templates sharing a non-consensus SNV or TRU count. Nevertheless, the KSHV repeats described found here were highly conserved at the nucleotide level within and between the samples of a given individual, even in oral swabs. Where there are variations in TRU counts, they differed typically by only one or two units. We consider PCR artifacts to be an unlikely source of TRU count variations, given that the often identical changes are found in different viral templates. Differences between tissue-specific consensus sequences as large as seven and nineteen TRUs were found in only two tumor–oral swab pairs, in their IR1. Variation in TRU counts can be explained by replication slippage, with larger changes potentially attributed also to recombination and repair mechanisms (Gemayel et al. 2012; Khristich and Mirkin 2020). Indels in repeat sequences typically change at rates much higher than nucleotide substitutions (Gemayel et al. 2012). It has been reported that tumor genomes have increased repeat number instability early during malignant transformation, while point mutations accumulate later in their transformation (Persi et al. 2019).
The LANAr region varied from 1.2 to 1.9 kb in our cohort, with identical lengths but no sequences in two pairs of individuals. All observed polymorphisms of LANAr sequences were in-frame at the tissue-specific consensus level, and their repeat lengths were the most stable within hosts among the three KSHV internal repeat regions.
In KSHV typified by strains infecting Body Cavity Based Lymphoma (BCBL-1), Kaposins B and C are translated from CTG start sites ∼70 bp downstream of IR2 DR6 (KapB-C genotype) (Sadler et al. 1999). In strains typified by GK18 (Rezaee et al. 2006), the Kaposin ORFs shift due to a 2-bp insertion between DR5 and DR6, resulting in Kaposins D and E instead (KapD-E) (Li et al. 2002; Rose et al. 2018). In all African KSHV isolates that have IR2 sequences published to date, including those reported here, polymorphisms at the Kaposin translation start sites result in either Kaposins B and E (KapB-E) or no open reading frames (Kap-none) (Rose et al. 2018), with Kap-none being more common. In fact, when considering all ninety-six KSHV genomes sequenced to date, a majority of at least fifty-five, all from Africa (Supplementary Alignment S2), had the ‘GCG’ instead of CTG and an in-frame TAG stop codon after other CTGs, which are characteristic of the Kap-none genotype. The Kaposin genotypes were stable within hosts; in the sixteen individuals examined here, there were no intra-host polymorphisms detected by SMRT-UMI at the CTG, CGC, and TAG positions that influence the Kaposin ORFs in IR2.
It is noteworthy that the loss of Kaposin ORFs, as is the case in Kap-none, did not show any observable clinical phenotype, nor association with survival or other clinical traits evaluated in thirty-eight individuals. There was a CTG codon within every DR5 TRU that could potentially initiate translation (Sadler et al. 1999; Li et al. 2002), but the preceding DR6 sequence encodes an important protein-binding domain of Kaposin B (McCormick and Ganem 2005). Recently, it has been found that KSHV expressing Kaposin A only, without the Kaposins from IR2, establishes fewer episome copies during latency (Kleer et al. 2022). This effect may be attributed to the alteration of the GC-rich repeats in IR2, to be discussed later. Nevertheless, viruses lacking Kaposins retain the ability to reactivate and produce infectious virions (Kleer et al. 2022). Additionally, the expression of Kaposin B was unnecessary for KSHV-infected endothelial cells to assume spindle morphology (Kleer et al. 2022).
Gamma-herpesviruses have evolved two functional Ori-Lyts, with either one preferentially employed depending on the host cell type and bound by different cell type–specific proteins (Sattler, Steer, and Adler 2016). Both IR1 and IR2 have the Ori-Lyt activity in a plasmid transient–transfection replication assay (AuCoin et al. 2002; Lin et al. 2003), whereas IR1 alone in a KSHV whole-genome BAC is sufficient for propagation in Vero cells, but not IR2 (Xu, Rodriguez-Huete, and Pari 2006). IR1 and IR2 GC–rich tandem repeats contain GRGGC motifs. Similar elements are found in the polyomavirus noncoding control region, and these repeats serve as transcription factor binding motifs regulating polyomavirus gene expression (Moens, Prezioso, and Pietropaolo 2020). In JC polyomavirus, the enhancer and promoter activities are cell-specific, exerting their effects by secondary structures that impede and facilitate transcription of early and late genes, respectively (Ferenczy et al. 2012). If the KSHV GC–rich tandem repeats function analogously, mutations in them may alter transactivation regulation and binding of cell-specific nuclear factors.
Repeat regions within the KSHV genome were found to have equivalent or slightly higher conservation relative to the rest of the genome. Even imperfect repeats were highly conserved throughout tumors and oral swabs from the same individuals. Nonetheless, mismatches between TRUs of a tandem repeat family added another level of diversity beyond TRU counts. Among the TRU families, the DR1 family in IR1 had the widest range and frequent occurrence of imperfect repeats. Mismatched and unique TRUs at DR1 were often found at irregular periodicities, and some TRUs were 27 bp instead of 20 bp. Defining degraded repeats as having at least two TRUs with any mismatch to the ‘master’ TRU sequence, IR1 was degraded more often (twelve/sixteen individuals) than IR2 (two/sixteen individuals). The presence or absence of perfect IR1 repeats was not associated with any of the clinical traits examined, and no perfect IR1 repeats were found in any of the HIV-positive participants, although the number of individuals studied is too few to suggest a relationship. To note, among the KSHV internal repeats sequenced in the past by the Sanger method, a few degraded TRU families were also present (Supplementary Fig S6A and B). However, degraded repeats may not have been efficiently captured by the shorter read and the de novo or reference-guided alignment methods used in the previous studies.
The significance of degraded IR1 repeats is speculative. While a noncoding RNA transcribed through the IR1 TRUs was found to be critical to K8-mediated viral DNA replication during de novo infection (Liu, Wang, and Yuan 2018), whether degraded IR1 TRUs can affect its function and allow for successful infection of a new host is uncertain. It has also been shown that DNA-RNA hybrids, or R-loops, form at IR1 and IR2 of KSHV; recoding the IR2 kaposin locus repeats to reduce their GC-rich character results in significantly fewer viral episome copies during latency (Kleer et al. 2022). GC-rich repeats are prone to forming G-quadruplex DNA secondary structures, which are mutagenic at the single-nucleotide level (Guiblet et al. 2021), and imperfect repeats dramatically increase the stability of repeats (Gemayel et al. 2012; Khristich and Mirkin 2020). Point mutations in EBV repeats have been suggested to be signatures of genetic exchange or DNA damage repair (Ba Abdullah et al. 2017). Purifying selection could be maintaining the fidelity of IR2 TRU sequences in persons with KS, while the selection pressure might be less in IR1.
There is a possibility that degraded IR1 can contribute to KS disease. IR1 is one of the KSHV transactivation initiation sites for lytic gene expression, and inefficient, leaky, or abortive lytic expression has been hypothesized to be a factor in KS pathogenesis since full reactivation leads to lysis of the host cell (Fields et al. 2013; Aneja and Yuan 2017). An inverse relationship has been observed among EBV strains between their efficiencies in lysing or immortalizing B-cells (Tsai et al. 2017). One transforming but poorly B-cell lytic EBV strain, B95-8, has among other mutations one of its two Ori-Lyts deleted (Hammerschmidt and Sugden 1988). JC virus isolates from the central nervous system of progressive multifocal leukoencephalopathy patients have an Ori-Lyt rearrangement differentiating them from urine isolates, the latter of which are thought to be the transmissible form (Moens, Prezioso, and Pietropaolo 2020).
While major internal repeats in KSHV in persons with advanced KS are highly conserved like the rest of the KSHV genome, the mutations observed may have biological effects. Follow-up work can be done to test the transactivation and Ori-Lyt activities of IR1 and IR2 separately in different cell types, identify cell-specific host proteins that associate with them, examine their secondary structures through biophysical means, and determine the impact of the degraded IR1 DR1 families observed here on the functionality of IR1. Additionally, given the characterized functions of Kaposin B, it is remarkable that there are no full-length ORFs for Kaposin B and other Kaposin ORFs in a majority of available KSHV IR2 sequences from Africa. This suggests that the missing Kaposin proteins did not contribute to disease in those individuals, or alternatively that their absence may lead to the development of the disease.
Supplementary Material
Acknowledgements
We thank the study participants who contributed the invaluable specimens that made this study possible.
Contributor Information
Jan Clement Santiago, Department of Microbiology, University of Washington, 960 Republican St, Seattle, WA 98109-4325, USA.
Dylan H Westfall, Department of Microbiology, University of Washington, 960 Republican St, Seattle, WA 98109-4325, USA.
Scott V Adams, Global Oncology and Vaccine and Infectious Diseases Division,Fred Hutchinson Cancer Center, 1100 Eastlake Ave, Seattle, 98109-4487 WA, USA.
Fred Okuku, Uganda Cancer Institute, Upper Mulago Hill Road, Kampala, Uganda.
Warren Phipps, Global Oncology and Vaccine and Infectious Diseases Division,Fred Hutchinson Cancer Center, 1100 Eastlake Ave, Seattle, 98109-4487 WA, USA; Department of Medicine, University of Washington, 1959 NE Pacific St., Seattle, WA 98195-8070, USA.
James I Mullins, Department of Microbiology, University of Washington, 960 Republican St, Seattle, WA 98109-4325, USA; Department of Medicine, University of Washington, 1959 NE Pacific St., Seattle, WA 98195-8070, USA; Department of Global Health, University of Washington, 3980 15th Ave NE, Seattle, WA 98195, USA.
Supplementary data
Supplementary data, including all sequences reported here are available at Virus Evolution online.
Funding
This work was supported by the United States National Institutes of Health grants U54 CA190146 (W.T.P.) and K23 CA150931 (W.P.) and the University of Washington Centers for AIDS Research Retroviruses and Molecular Data Sciences Core (P30 AI027757; J.I.M.). The funders had no role in the study design, data collection and analysis, decision to publish, or preparation of the manuscript.
Conflict of interest:
None declared.
References
- Andrei G., and Snoeck R. (2015) ‘Kaposi’s Sarcoma-Associated Herpesvirus: The Role of Lytic Replication in Targeted Therapy’, Current Opinion in Infectious Diseases, 28: 611–24.doi: 10.1097/QCO.0000000000000213 [DOI] [PubMed] [Google Scholar]
- Aneja K. K., and Yuan Y. (2017) ‘Reactivation and Lytic Replication of Kaposi’s Sarcoma-Associated Herpesvirus: An Update’, Frontiers in Microbiology, 8: 613.doi: 10.3389/fmicb.2017.00613 [DOI] [PMC free article] [PubMed] [Google Scholar]
- AuCoin D. P. et al. (2002) ‘Kaposi’s Sarcoma-Associated Herpesvirus (Human Herpesvirus 8) Contains Two Functional Lytic Origins of DNA Replication’, Journal of Virology, 76: 7890–6. [DOI] [PMC free article] [PubMed] [Google Scholar]
- Ba Abdullah M. M. et al. (2017) ‘Heterogeneity of the Epstein-Barr Virus (EBV) Major Internal Repeat Reveals Evolutionary Mechanisms of EBV and a Functional Defect in the Prototype EBV Strain B95-8’, Journal of Virology, 91: e00920–17.doi: 10.1128/JVI.00920-17 [DOI] [PMC free article] [PubMed] [Google Scholar]
- Ballestas M. E., and Kaye K. M. (2011) ‘The Latency-Associated Nuclear Antigen, a Multifunctional Protein Central to Kaposi’s Sarcoma-Associated Herpesvirus Latency’, Future Microbiology, 6: 1399–413.doi: 10.2217/fmb.11.137 [DOI] [PMC free article] [PubMed] [Google Scholar]
- Casper C. et al. (2004) ‘HIV Infection and Human Herpesvirus-8 Oral Shedding among Men Who Have Sex with Men’, JAIDS: Journal of Acquired Immune Deficiency Syndromes, 35: 233–8. [DOI] [PubMed] [Google Scholar]
- Casper C. et al. (2007) ‘Frequent and Asymptomatic Oropharyngeal Shedding of Human Herpesvirus 8 among Immunocompetent Men’, The Journal of Infectious Diseases, 195: 30–6. [DOI] [PMC free article] [PubMed] [Google Scholar]
- Chang H.-C. et al. (2016) ‘c-Myc and Viral Cofactor Kaposin B Co-operate to Elicit Angiogenesis through Modulating miRNome Traits of Endothelial Cells’, BMC Systems Biology, 10: S1. [DOI] [PMC free article] [PubMed] [Google Scholar]
- Chun-Fan C., Hiroomi T., and Khalili K. (1994) ‘The Role of a Pentanucleotide Repeat Sequence, AGGGAAGGGA, in the Regulation of JC Virus DNA Replication’, Gene, 148: 309–14. [DOI] [PubMed] [Google Scholar]
- Corcoran J. A., Johnston B. P., and McCormick C. (2015) ‘Viral Activation of MK2-hsp27-p115RhoGEF-RhoA Signaling Axis Causes Cytoskeletal Rearrangements, P-body Disruption and ARE-mRNA Stabilization’, PLoS Pathogens, 11: 1–23. [DOI] [PMC free article] [PubMed] [Google Scholar]
- Cruz F., Roux J., and Robinson-Rechavi M. (2009) ‘The Expansion of Amino-Acid Repeats Is Not Associated to Adaptive Evolution in Mammalian Genes’, BMC Genomics, 10: 619. [DOI] [PMC free article] [PubMed] [Google Scholar]
- Dabral P. et al. (2020) ‘LANA and hnRNP A1 Regulate the Translation of LANA mRNA through G-Quadruplexes’, Journal of Virology, 94: e01508–19. [DOI] [PMC free article] [PubMed] [Google Scholar]
- Dylan H. W. et al. (2023) ‘Optimized SMRT-UMI protocol produces highly accurate sequence datasets from diverse populations – application to HIV-1 quasispecies’, bioRxiv, 2023.02.23.529831. [DOI] [PMC free article] [PubMed] [Google Scholar]
- Ferenczy M. W. et al. (2012) ‘Molecular Biology, Epidemiology, and Pathogenesis of Progressive Multifocal Leukoencephalopathy, the JC Virus-Induced Demyelinating Disease of the Human Brain’, Clinical Microbiology Reviews, 25: 471–506. [DOI] [PMC free article] [PubMed] [Google Scholar]
- Fields B. N. et al. (2013) Fields Virology. Wolters Kluwer Health/Lippincott Williams & Wilkins. [Google Scholar]
- Gao S. et al. (1999) ‘Molecular Polymorphism of Kaposi’s Sarcoma-Associated Herpesvirus (Human Herpesvirus 8) Latent Nuclear Antigen: Evidence for a Large Repertoire of Viral Genotypes and Dual Infection with Different Viral Genotypes’, The Journal of Infectious Disease, 180: 1466–76. [DOI] [PubMed] [Google Scholar]
- Gemayel R. et al. (2012) ‘Beyond Junk-Variable Tandem Repeats as Facilitators of Rapid Evolution of Regulatory and Coding Sequences’, Genes, 3: 461–80. [DOI] [PMC free article] [PubMed] [Google Scholar]
- Gluzman Y. (1981) ‘SV40-transformed Simian Cells Support the Replication of Early SV40 Mutants’, Cell, 23: 175–82. [DOI] [PubMed] [Google Scholar]
- Guiblet W. M. et al. (2021) ‘Non-B DNA: A Major Contributor to Small-and Large-Scale Variation in Nucleotide Substitution Frequencies across the Genome’, Nucleic Acids Research, 49: 1497–516. [DOI] [PMC free article] [PubMed] [Google Scholar]
- Hammerschmidt W., and Sugden B. (1988) ‘Identification and Characterization of oriLyt, a Lytic Origin of DNA Replication of Epstein-Barr Virus’, Cell, 55: 427–33. [DOI] [PubMed] [Google Scholar]
- Höijer I. et al. (2018) ‘Detailed Analysis of HTT Repeat Elements in Human Blood Using Targeted Amplification-Free Long-Read Sequencing’, Human Mutation, 39: 1262–72. [DOI] [PMC free article] [PubMed] [Google Scholar]
- Khristich A. N., and Mirkin S. M. (2020) ‘On the Wrong DNA Track: Molecular Mechanisms of Repeat-Mediated Genome Instability’, Journal of Biological Chemistry, 295: 4134–70. [DOI] [PMC free article] [PubMed] [Google Scholar]
- King C. A. (2013) ‘Kaposi’s Sarcoma-Associated Herpesvirus Kaposin B Induces Unique Monophosphorylation of STAT3 at Serine 727 and MK2-Mediated Inactivation of the STAT3 Transcriptional Repressor TRIM28’, Journal of Virology, 87: 8779–91. [DOI] [PMC free article] [PubMed] [Google Scholar]
- Kleer M. et al. (2022) ‘A Panel of Kaposi’s Sarcoma-Associated Herpesvirus Mutants in the Polycistronic Kaposin Locus for Precise Analysis of Individual Protein Products’, Journal of Virology, 96: e0156021. [DOI] [PMC free article] [PubMed] [Google Scholar]
- Koelle D. M. et al. (1997) ‘Frequent Detection of Kaposi’s Sarcoma-Associated Herpesvirus (Human Herpesvirus 8) DNA in Saliva of Human Immunodeficiency Virus-Infected Men: Clinical and Immunologic Correlates’, The Journal of Infectious Diseases, 176: 94–102. [DOI] [PubMed] [Google Scholar]
- Krown S. E., Metroka C., and Wernz J. C. (1989) ‘Kaposi’s Sarcoma in the Acquired Immune Deficiency Syndrome: A Proposal for Uniform Evaluation, Response, and Staging Criteria. AIDS Clinical Trials Group Oncology Committee’, Journal of Clinical Oncology, 7: 1201–7. [DOI] [PubMed] [Google Scholar]
- Kwun H. J. et al. (2007) ‘Kaposi’s Sarcoma-Associated Herpesvirus Latency-Associated Nuclear Antigen 1 Mimics Epstein-Barr Virus EBNA1 Immune Evasion through Central Repeat Domain Effects on Protein Processing’, Journal of Virology, 81: 8225–35. [DOI] [PMC free article] [PubMed] [Google Scholar]
- Kwun H. J. et al. (2011) ‘The Central Repeat Domain 1 of Kaposi’s Sarcoma-Associated Herpesvirus (KSHV) Latency Associated-Nuclear Antigen 1 (LANA1) Prevents Cis MHC Class I Peptide Presentation’, Virology, 412: 357–65. [DOI] [PMC free article] [PubMed] [Google Scholar]
- Kwun H. J. et al. (2014) ‘Human DNA Tumor Viruses Generate Alternative Reading Frame Proteins through Repeat Sequence Recoding’, Proceedings of the National Academy of Sciences, 111: E4342–9. [DOI] [PMC free article] [PubMed] [Google Scholar]
- Li H. et al. (2002) ‘The Kaposi’s Sarcoma-Associated Herpesvirus K12 Transcript from a Primary Effusion Lymphoma Contains Complex Repeat Elements, Is Spliced, and Initiates from a Novel Promoter’, Journal of Virology, 76: 11880–8. [DOI] [PMC free article] [PubMed] [Google Scholar]
- Lin C. L. et al. (2003) ‘Kaposi’s Sarcoma-Associated Herpesvirus Lytic Origin (Ori-lyt)-Dependent DNA Replication: Identification of the ori-Lyt and Association of K8 bZip Protein with the Origin’, Journal of Virology, 77: 5578–88. [DOI] [PMC free article] [PubMed] [Google Scholar]
- Liu M. et al. (1997) ‘Dual NF1-Requiring Effect of Human Neurotropic JC Virus Composite Pentanucleotide Repeat Elements on Early and Late Viral Gene Expression’, Virology, 227: 7–12. [DOI] [PubMed] [Google Scholar]
- Liu D., Wang Y., and Yuan Y. (2018) ‘Kaposi’s Sarcoma-Associated Herpesvirus K8 Is an RNA Binding Protein that Regulates Viral DNA Replication in Coordination with a Noncoding RNA’, Journal of Virology, 92: e02177–17. [DOI] [PMC free article] [PubMed] [Google Scholar]
- Mariggiò G., Koch S., and Schulz T. F. (2017) ‘Kaposi Sarcoma Herpesvirus Pathogenesis’, Philosophical Transactions of the Royal Society of London Series B: Biological Sciences, 372: e1006335. [DOI] [PMC free article] [PubMed] [Google Scholar]
- McCormick C., and Ganem D. (2005) ‘The Kaposin B Protein of KSHV Activates the p38/MK2 Pathway and Stabilizes Cytokine mRNAs’, Science, 307: 739–41. [DOI] [PubMed] [Google Scholar]
- ——— (2006) ‘Phosphorylation and Function of the Kaposin B Direct Repeats of Kaposi’s Sarcoma-Associated Herpesvirus’, Journal of Virology, 80: 6165–70. [DOI] [PMC free article] [PubMed] [Google Scholar]
- Moens U., Prezioso C., and Pietropaolo V. (2020) ‘Genetic Diversity of the Noncoding Control Region of the Novel Human Polyomaviruses’, Viruses, 12: 1406. [DOI] [PMC free article] [PubMed] [Google Scholar]
- Moore P. S., and Chang Y. (2014) ‘The Conundrum of Causality in Tumor Virology: The Cases of KSHV and MCV’, Seminars in Cancer Biology, 26: 4–12. [DOI] [PMC free article] [PubMed] [Google Scholar]
- Pauk J. et al. (2000) ‘Mucosal Shedding of Human Herpesvirus 8 in Men’, New England Journal of Medicine, 343: 1369–77. [DOI] [PubMed] [Google Scholar]
- Persi E. et al. (2019) ‘Proteomic and Genomic Signatures of Repeat Instability in Cancer and Adjacent Normal Tissues’, Proceedings of the National Academy of Sciences of the United States of America, 116: 16987–96. [DOI] [PMC free article] [PubMed] [Google Scholar]
- Phipps W. et al. (2022) ‘A Prospective Study of HIV-Associated and HIV-Negative Kaposi Sarcoma in Uganda: Identifying Factors Associated with Poor Outcomes’, AIDS, 37: 51–9. [DOI] [PMC free article] [PubMed] [Google Scholar]
- Portes-Sentis S., Sergeant A., and Gruffat H. (1997) ‘A Particular DNA Structure Is Required for the Function of a Cis-Acting Component of the Epstein-Barr Virus OriLyt Origin of Replication’, Nucleic Acids Research, 25: 1347–54. [DOI] [PMC free article] [PubMed] [Google Scholar]
- Purushothaman P. et al. (2016) ‘KSHV Genome Replication and Maintenance’, Frontiers in Microbiology, 7: 54. [DOI] [PMC free article] [PubMed] [Google Scholar]
- Rezaee S. A. R. et al. (2006) ‘Kaposi’s Sarcoma-Associated Herpesvirus Immune Modulation: An Overview’, The Journal of General Virology, 87: 1781–804. [DOI] [PubMed] [Google Scholar]
- Rose T. M. et al. (2018) ‘Quantitative RNAseq Analysis of Ugandan KS Tumors Reveals KSHV Gene Expression Dominated by Transcription from the LTd Downstream Latency Promoter’, PLoS Pathogens, 14: e1007441. [DOI] [PMC free article] [PubMed] [Google Scholar]
- Sadler R. et al. (1999) ‘A Complex Translational Program Generates Multiple Novel Proteins from the Latently Expressed Kaposin (K12) Locus of Kaposi’s Sarcoma-Associated Herpesvirus’, Journal of Virology, 73: 5722–30. [DOI] [PMC free article] [PubMed] [Google Scholar]
- Santiago J. C. et al. (2021) ‘Intra-host Changes in Kaposi Sarcoma-Associated Herpesvirus Genomes in Ugandan Adults with Kaposi Sarcoma’, PLoS Pathogens, 17: e1008594. [DOI] [PMC free article] [PubMed] [Google Scholar]
- Santiago J. C. et al. (2022) ‘Genomic Changes in Kaposi Sarcoma-Associated Herpesvirus and Their Clinical Correlates’, PLoS Pathogens, 18: e1010524. [DOI] [PMC free article] [PubMed] [Google Scholar]
- Sattler C., Steer B., and Adler H. (2016) ‘Multiple Lytic Origins of Replication Are Required for Optimal Gammaherpesvirus Fitness In Vitro and In Vivo’, PLoS Pathogens, 12: e1005510. [DOI] [PMC free article] [PubMed] [Google Scholar]
- Schaefer M. H., Wanker E. E., and Andrade-Navarro M. A. (2012) ‘Evolution and Function of CAG/Polyglutamine Repeats in Protein-Protein Interaction Networks’, Nucleic Acids Research, 40: 4273–87. [DOI] [PMC free article] [PubMed] [Google Scholar]
- Sin S. H., and Dittmer D. P. (2013) ‘Viral Latency Locus Augments B-Cell Response In Vivo to Induce Chronic Marginal Zone Enlargement, Plasma Cell Hyperplasia, and Lymphoma’, Blood, 121: 2952–63. [DOI] [PMC free article] [PubMed] [Google Scholar]
- Szymula A. et al. (2018) ‘Epstein-Barr Virus Nuclear Antigen EBNA-LP Is Essential for Transforming Naïve B Cells, and Facilitates Recruitment of Transcription Factors to the Viral Genome’, PLoS Pathogens, 14: e1006890. [DOI] [PMC free article] [PubMed] [Google Scholar]
- Tsai M.-H. et al. (2017) ‘The Biological Properties of Different Epstein-Barr Virus Strains Explain Their Association with Various Types of Cancers’, Oncotarget, 8: 10238–54. [DOI] [PMC free article] [PubMed] [Google Scholar]
- Viejo-Borbolla A. et al. (2003) ‘A Domain in the C-Terminal Region of Latency-Associated Nuclear Antigen 1 of Kaposi’s Sarcoma-Associated Herpesvirus Affects Transcriptional Activation and Binding to Nuclear Heterochromatin’, Journal of Virology, 77: 7093–100. [DOI] [PMC free article] [PubMed] [Google Scholar]
- Wang Y. et al. (2004) ‘Kaposi’s Sarcoma-Associated Herpesvirus ori-Lyt-Dependent DNA Replication: Cis-Acting Requirements for Replication and ori-Lyt-Associated RNA Transcription’, Journal of Virology, 78: 8615–29. [DOI] [PMC free article] [PubMed] [Google Scholar]
- Wang Y. et al. (2006) ‘Kaposi’s Sarcoma-Associated Herpesvirus ori-Lyt-Dependent DNA Replication: Dual Role of Replication and Transcription Activator’, Journal of Virology, 80: 12171–86. [DOI] [PMC free article] [PubMed] [Google Scholar]
- Watanabe S., and Yoshiike K. (1985) ‘Decreasing the Number of 68-Base-Pair Tandem Repeats in the BK Virus Transcriptional Control Region Reduces Plaque Size and Enhances Transforming Capacity’, Journal of Virology, 55: 823–5. [DOI] [PMC free article] [PubMed] [Google Scholar]
- Weidner-Glunde M., Mariggiò G., and Schulz T. F. (2017) ‘Kaposi’s Sarcoma-Associated Herpesvirus Latency-Associated Nuclear Antigen: Replicating and Shielding Viral DNA during Viral Persistence’, Journal of Virology, 91: e01083–16. [DOI] [PMC free article] [PubMed] [Google Scholar]
- Wu Y.-H. et al. (2011) ‘The Manipulation of miRNA-Gene Regulatory Networks by KSHV Induces Endothelial Cell Motility’, Blood, 118: 2896–905. [DOI] [PubMed] [Google Scholar]
- Xu Y., Rodriguez-Huete A., and Pari G. S. (2006) ‘Evaluation of the Lytic Origins of Replication of Kaposi’s Sarcoma-Associated Virus/Human Herpesvirus 8 in the Context of the Viral Genome’, Journal of Virology, 80: 9905–9. [DOI] [PMC free article] [PubMed] [Google Scholar]
- Yan L. et al. (2019) ‘Towards Better Understanding of KSHV Life Cycle: From Transcription and Posttranscriptional Regulations to Pathogenesis’, Virologica Sinica, 34: 135–61. [DOI] [PMC free article] [PubMed] [Google Scholar]
- Yoo J. et al. (2010) ‘Kaposin-B Enhances the PROX1 mRNA Stability during Lymphatic Reprogramming of Vascular Endothelial Cells by Kaposi’s Sarcoma Herpes Virus’, PLoS Pathogens, 6: 37–8. [DOI] [PMC free article] [PubMed] [Google Scholar]
- Zaldumbide A. et al. (2007) ‘In Cis Inhibition of Antigen Processing by the Latency-Associated Nuclear Antigen I of Kaposi Sarcoma Herpes Virus’, Molecular Immunology, 44: 1352–60. [DOI] [PubMed] [Google Scholar]
Associated Data
This section collects any data citations, data availability statements, or supplementary materials included in this article.