Abstract
The complete chromosomal sequence for chromosome 1 from Leishmania major Friedlin predicts that this chromosome has 79 protein-coding genes. Surprisingly, the first 29 of these genes are encoded in tandem on one strand of DNA, and the remaining 50 genes are encoded in tandem on the other. No RNA polymerase promoters, centromeric sequences or origins of DNA replication have been identified in the DNA sequence. Statistical analyses of the nucleotide content reveal striking, non-random, sequence-biases that are correlated with genome organization. Analysis of coding regions suggests that novel transcription processes in Leishmania may be responsible for the nucleotide bias, which in turn affects gene organization in the chromosome. These results also suggest that the region between the two units of in-tandem genes is a candidate for an origin of DNA replication.
INTRODUCTION
Leishmania major is a diploid, eukaryotic, intracellular parasite. The complete sequence from chromosome 1 of L.major Friedlin (LmjF chr1) revealed that the protein-coding genes are organized in two large clusters, with all the coding sequences on the same strand within each cluster (1). This is consistent with polycistronic transcription of protein-coding genes in trypanosomatids (2,3). However, no RNA polymerase II (polII) promoters were found on chr1; indeed none have been definitively identified in any trypanosomatids. In addition, while the canonical telomeric sequences were found at each end of chr1, no centromeric sequences or replication origins were identified within the DNA sequence. Thus, much remains to be discovered about this chromosome, despite the elucidation of its complete nucleotide sequence.
Recently, statistical analyses of complete bacterial genomes have revealed that the distribution of nucleotides in these genomes is not random (4–7). Instead, there is a striking correlation between the direction of replication and the direction of transcription, with an increased purine content on the leading strand of replication (4). Thus, when purine excess is plotted as a function of nucleotide position within the genome, the result is a V-shaped curve, with the global minimum corresponding to the replication origin and the maximum corresponding to the replication terminus (4). Similar results were obtained with another statistical analysis called GC skew, where the replication origin and terminus are represented by a change in the sign of GC skew statistic (5). The GC skew algorithms were enhanced by the use of cumulative scores to show the results more clearly, with the replication origin represented as a minimum value and the terminus as a maximum, much like the purine excess curves (7).
The shape of the purine excess and GC skew plots were postulated to reflect the increased time which the replicaton lagging strand template spends in a single-stranded conformation, and hence the amount of time available for mutagenic damage (4). However, DNA damage more frequently results in the incorporation of a purine base (8), which would lead to purine excess in the lagging strand (and thus, pyrimidine excess in the leading strand); exactly the opposite of the bias observed (4). Thus, it was subsequently proposed that the bias might be explained by transcription-coupled repair of cytosine deaminations and thymidine dimers on the transcription template strand, increasing this strand’s pyrimidine content (4). Since there is a marked tendency for genes to be transcribed in the direction of replication (5), this would lead to purine accumulation in the leading strand (the non-template strand), explaining the observed positive correlation of coding direction with purine excess (9,10).
Here, we report that nucleotide composition analyses of LmjF chr1 reveal a negative correlation between purine excess and cumulative GC skew with coding direction, i.e. the converse of that seen in bacteria. One possible explanation is that transcription occurs on both DNA strands, balancing the transcription-coupled pyrimidine accumulation on both strands. As a consequence, purines accumulate on the lagging strand during replication, leading to maximum purine excess at the origin of replication. This explanation predicts that the boundary between the gene clusters on chr1, which corresponds to the region of maximum purine excess and cumulative GC skew, is a replication origin, with all the genes found on the leading strand of replication. We suggest that such novel transcriptional processes may be the driving force underlying the unusual genome organization in Leishmania and other trypanosomatids.
MATERIALS AND METHODS
Purine excess (4) was calculated as a running total across the 268 984-nt LmjF chr1 consensus sequence (GenBank accession no. AE001274), as described in equation 1, where l is the length of the chromosome, δN is the accumulating score of the base N (A, T, G or C) and Xi is the algorithmic score.
Cumulative GC skew and cumulative AT analyses (5,7,11) were carried out according to equation 2, which calculates skew for a sliding window of 10 000 bp, where Xi is the accumulating score of the algorithm, l is the length of the chromosome, j is the position of the sliding window in the chromosome, δR is the running total of purine (either A or G) and δY is the running count of pyrimidine (either T or C).
These analyses were initially carried out using the entire chr1 consensus sequence, and then subsequently using sequences representing the concatenated coding sequences of each of the 79 putative protein-coding ORFs (1) and the concatenated non-coding sequences (122 946 and 142 096 nt, respectively). Further analysis was carried out using only those sequences representing the first, second and third codon positions of the protein-coding ORFs. The results were plotted using GNUplot.
RESULTS AND DISCUSSION
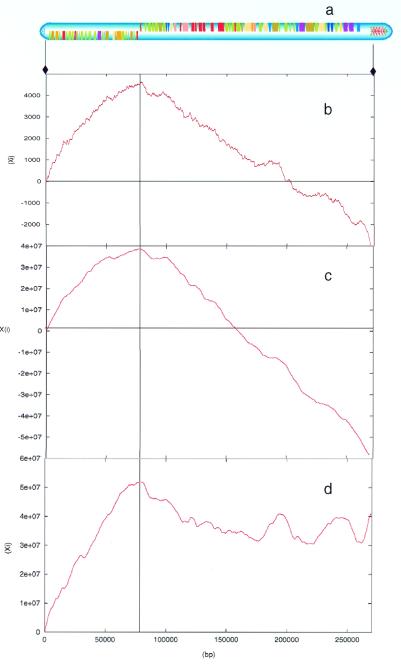
Analysis of purine excess across LmjF chr1 (Fig. 1b) showed a striking, non-random, distribution of nucleotide bias. In particular, it revealed a negative correlation between purine excess and the direction of the protein-coding genes (Fig. 1a), with the maximum of the purine excess score occurring precisely within the region between the two clusters of genes, which are oriented in opposite directions. Analogous results were obtained from analysis of cumulative GC skew (Fig. 1c), which also showed that the maximum value precisely coincides with the region between the two clusters of genes and that there is a negative correlation between gene direction and GC skew. This trend was also seen with cumulative AT analysis (Fig. 1d), although not as clearly as with cumulative GC skew. These results are analogous to AT skew analyses carried out in 14 bacterial genomes. Only six of the genomes surveyed showed a correlation between the location of the origin of replication and AT skew and none were as accurate as GC skew (12). Thus, the nucleotide bias observed is exactly the opposite of that seen in bacteria, where there is a positive correlation between gene direction and GC skew, AT skew or purine excess (4–7).
Figure 1.
Nucleotide bias analyses from LmjF chr1. The y-axis shows the algorithm score (Xi). Gene cluster boundaries are marked with a vertical line. (a) Gene organisation; the extent of the sequence analyzed is indicated by arrows. (b) Purine excess. (c) Cumulative GC skew. (d) Cumulative AT skew.
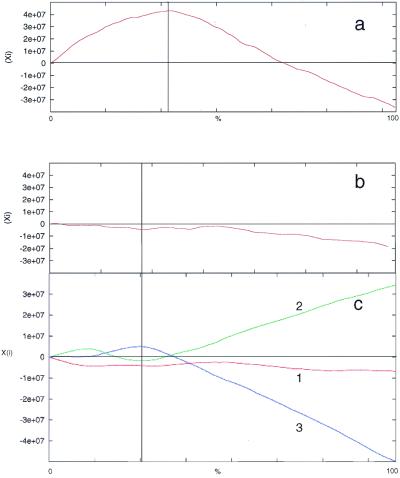
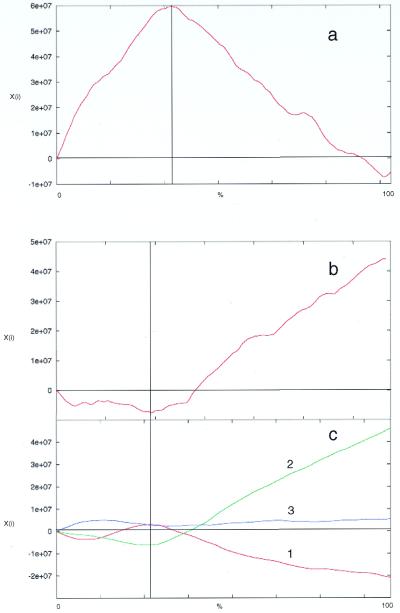
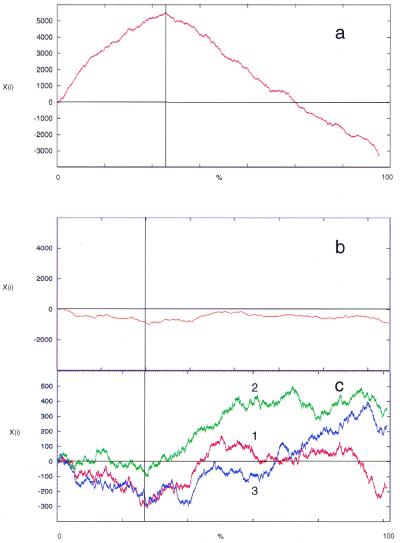
Leishmania transcribe their genes as polycistronic transcripts that are spliced to give mature mRNAs (2,3) and polypyrimidine tracts within the intergenic regions provide the polyadenylation and trans-splicing signals used in mRNA maturation (2,13,14). This raises the possibility that these tracts could be responsible for the purine bias, GC skew and AT skew seen in chr1. To further investigate this possibility, GC and AT cumulative skew analyses and purine excess analyses were performed on non-coding (Figs 2a, 3a and 4a) and coding sequence (Figs 2b, 3b and 4b). The skew in the coding regions was further analyzed to separate the skew arising in the first, second and third codon positions, respectively (Figs 2c, 3c and 4c).
Figure 2.
Cumulative GC skew analysis of (a) non-coding regions alone (i.e. protein-coding ORFs omitted from analysis). (b) ORFs alone (i.e. inter-ORF regions omitted from analysis). (c) Codon position within ORFs: 1, first; 2, second; 3, third. The boundary between the two strand-specific gene clusters is indicated by a vertical line. The x-axis is expressed as the percentage of sequence analyzed; thus the boundary is in a different position in coding and non-coding analyses. The y-axis shows algorithm score (Xi).
Figure 3.
Cumulative AT skew analysis of (a) non-coding regions alone (i.e. protein-coding ORFs omitted from analysis). (b) ORFs alone (i.e. inter-ORF regions omitted from analysis). (c) Codon position within ORFs: 1, first; 2, second; 3, third. The boundary between the two strand-specific gene clusters is indicated by a vertical line. The x-axis is expressed as the percentage of sequence analyzed; thus the boundary is in a different position in coding and non-coding analyses. The y-axis shows algorithm score (Xi).
Figure 4.
Purine excess analyses of (a) non-coding regions alone (i.e. protein-coding ORFs omitted from analysis). (b) ORFs alone (i.e. inter-ORF regions omitted from analysis). (c) Codon position within ORFs: 1, first; 2, second; 3, third. The boundary between the two strand-specific gene clusters is indicated by a vertical line. The x-axis is expressed as the percentage of sequence analyzed; thus the boundary is in a different position in coding and non-coding analyses. The y-axis shows algorithm score (Xi).
The results from these analyses show that the majority of GC and AT skew and purine excess occurs in the non-coding regions, with the maximum cumulative value coinciding with the region between the two gene clusters. This is not unexpected, due to the greater selection pressure for sequence conservation within the coding regions. However, when the analyses of the coding region are examined, differences in AT and GC skew are apparent. While there is no significant GC skew or purine excess in the coding region, some AT skew can be detected.
When the coding region is separated by codon position, AT skew is seen most strongly in the first and second codon positions, although in the opposite directions (Fig. 3c). Grigoriev et al. (12) suggest that, at least for Haemophilus influenzae, evolutionary forces affect AT and GC skew differently and these observations are consistent with the observation that AT skew in the first codon position are correlated with coding strand excess. This may also explain why AT skew is not as sensitive as GC skew for detecting origins of replication. Purine excess is almost equivalent to the sum of GC and AT skews numerically integrated with very small windows (12) and the lack of resolution at the codon level (Fig. 4c) may reflect this property of the plot.
In contrast to AT skew and purine excess, it can be seen that there is significant GC skew in the third position (Fig. 2c) where, due to the degeneracy of the genetic code, a higher silent mutation rate can be tolerated without coding information loss. Given that GC skew is more sensitive for detecting replication-based biases (7,12), these results suggest that the GC skew does not just reflect the presence of pyrimidine tracts in the inter-ORF regions. Instead, they argue that there are other evolutionary pressures influencing the composition of the chromosome.
We propose that one possible explanation of the nucleotide bias, which explains the negative correlation of purine excess and GC skew with the gene coding direction, is that transcription occurs on both strands of the chromosome along its entire length. Thus, the transcription-coupled pyrimidine accumulation (4) would occur on both strands, since both are used as templates for transcription. This would have the effect of countering the pyrimidine excess (purine deficit) in the gene-coding direction seen in bacteria, and would lead to accumulation of purine excess on the lagging strand of replication, as a result of replication-based mutagenic processes (8).
It is important to note that this model is not contingent on a single RNA polymerase molecule transcribing the entire chromosome. It is more likely that a larger number of RNA polymerase molecules transcribing smaller, overlapping regions exert the effect. Also, Leishmania mRNA is stabilized by correct post-transcriptional processing which, in turn, is directed by polypyrimidine tracts. These signals do not exist on the anti-sense strand, thus RNA produced from the anti-sense strand would be rapidly degraded by cellular processes. Anti-sense RNA technology for selective gene knock-out is only effective when these signals are incorporated (15). Therefore, RNA produced from the anti-sense strand would not be expected to be long-lived or to interfere with normal cellular processes.
Such an interpretation of the statistical analyses predicts that the origin of replication is located at the region of maximum cumulative GC skew and not the minimum, as seen in bacteria. This identifies the region between the two gene clusters on chr1 as a replication origin. Replication would proceed in both directions from this point toward the telomeres. The resultant pyrimidine accumulation on the leading strand of replication could be the evolutionary driving force behind the unique organization of chr1 into two large clusters of protein-coding genes, since this provides the strand-specific polypyrimidine tracts used for trans-splicing and polyadenylation. Similar analyses of other Leishmania chromosomes suggest that this is a general characteristic of Leishmania chromosomal gene organization. However, there is, as yet, no direct evidence whether transcription occurs on only one or both strands in Leishmania. Thus, alternative explanations, such as unusual DNA repair processes, might account for the observed nucleotide bias.
Acknowledgments
ACKNOWLEDGEMENTS
This work was supported by PHS grant AI24771 from the National Institute of Allergy and Infectious Disease to K.S.
REFERENCES
- 1.Myler P.J., Audleman,L., deVos,T., Hixson,G., Kiser,P., Lemley,C., Magness,C., Rickell,E., Sisk,E., Sunkin,S., Swartzell,S., Westlake,T., Bastien,P., Fu,G., Ivens,A. and Stuart,K. (1999) Proc. Natl Acad. Sci. USA, 96, 2902–2906. [DOI] [PMC free article] [PubMed] [Google Scholar]
- 2.Lebowitz J., Smith,A.B., Rusche,L. and Beverley,S.M. (1993) Genes Dev., 7, 996–1007. [DOI] [PubMed] [Google Scholar]
- 3.Ullu E., Matthews,K.R. and Tschudi,C. (1993) Mol. Cell. Biol., 13, 720–725. [DOI] [PMC free article] [PubMed] [Google Scholar]
- 4.Freeman J.M., Plasterer,T.N., Smith,T.F. and Mohr,S.C. (1998) Science, 279, 1827a. [Google Scholar]
- 5.Blattner F.R., Plunkett,G.,III, Bloch,C.A., Perna,N.T., Burland,V., Riley,M., Collado-Vides,J., Glasner,J.D., Rode,C.K., Mayhew,G.F., Gregor,J., Davis,N.W., Kirkpatrick,H.A., Goeden,M.A., Rose,D.J., Mau,B. and Shao,Y. (1997) Science, 277, 1453–1462. [DOI] [PubMed] [Google Scholar]
- 6.McLean M.J., Wolfe,K.H. and Devine,K.M. (1998) J. Mol. Evol., 47, 691–696. [DOI] [PubMed] [Google Scholar]
- 7.Grigoriev A. (1998) Nucleic Acids Res., 26, 2286–2290. [DOI] [PMC free article] [PubMed] [Google Scholar]
- 8.Wu C.-I. and Maeda,N. (1987) Nature, 327, 169–170. [DOI] [PubMed] [Google Scholar]
- 9.Francino M.P., Chao,L., Riley,M.A. and Ochman,H. (1996) Science, 272, 107–109. [DOI] [PubMed] [Google Scholar]
- 10.Francino M.P. and Ochman,H. (1997) Trends Genet., 13, 240–245. [DOI] [PubMed] [Google Scholar]
- 11.Lobry J.R. (1996) Mol. Biol. Evol., 13, 660–665. [DOI] [PubMed] [Google Scholar]
- 12.Grigoriev A., Freeman,J.M., Plasterer,T.N., Smith,T.F. and Mohr,S.C. (1998) Science, 281, 1923a. [Google Scholar]
- 13.Matthews K.R., Tschudi,C. and Ullu,E. (1994) Genes Dev., 8, 491–501. [DOI] [PubMed] [Google Scholar]
- 14.Curotto de Lafaille M.A., Laban,A. and Wirth,D.F. (1992) Proc. Natl Acad. Sci. USA, 89, 2703–2707. [DOI] [PMC free article] [PubMed] [Google Scholar]
- 15.Zhang W. and Matlashewski,G. (2000) Mol. Biochem. Parasitol., 107, 315–319. [DOI] [PubMed] [Google Scholar]


