

Abstract
The COVID-19 pandemic has worsened the psychological and social stress levels of university students due to physical illness, enhanced dependence on mobile devices and internet, a lack of social activities, and home confinement. Therefore, early stress detection is crucial for their successful academic performance and mental well-being. The advent of machine learning (ML)-based prediction models can have a crucial impact in predicting stress at its early stages and taking necessary steps for the well-being of individuals. This study aims to develop a reliable machine learning-based prediction model for perceived stress prediction and validate the model using real-world data collected through an online survey among 444 university students from different ethnicity. The machine learning models were built using supervised machine learning algorithms. Principal Component Analysis (PCA) and the chi-squared test were employed as feature reduction techniques. Moreover, Grid Search Cross-Validation (GSCV) and Genetic Algorithm (GA) were employed for hyperparameter optimization (HPO). According to the findings, around 11.26% of individuals were identified with high levels of social stress. In comparison, approximately 24.10% of people were found to be suffering from extremely high psychological stress, which is quite alarming for students' mental health. Furthermore, the prediction results of the ML models demonstrated the most remarkable accuracy (80.5%), precision (1.000), F1 score (0.890), and recall value (0.826). The Multilayer Perceptron model was shown to have the maximum accuracy when combined with PCA as a feature reduction approach and GSCV for HPO. The convenience sampling technique used in this study only considers self-reported data, which may have biased results and lack generalizability. Future research should consider a large sample of data and focus on tracking long-term impacts with coping strategies and interventions. The results of this study can be used to develop strategies to mitigate adverse effects of the overuse of mobile devices and promote student well-being during pandemics and other stressful situations.
Keywords: Perceived Stress Scale, Psychological Stress, Principal Component Analysis, Chi-squared Test, Genetic Algorithm, Constant Mobile Connectivity, COVID-19
1. Introduction
COVID-19, caused by the SARS-CoV-2 virus, is a highly contagious respiratory illness that has swept the world and caused widespread disruption and loss of life. According to data from the World Health Organization (WHO), over 138 million confirmed cases of COVID-19 and over 2.98 million deaths worldwide [1]. The pandemic has had a significant impact on global health and economies, leading to widespread disruption and hardship [[2], [3], [4]]. The COVID-19 pandemic has significantly impacted university students, causing increased stress and anxiety levels [[5], [6], [7]]. The sudden shift to remote learning forced students to heavily depend on mobile devices. As a result, limited in-person interaction with peers and instructors has presented new challenges for students struggling with the pandemic's uncertainty and its effects on their education and prospects [8]. Additionally, financial strain from job loss or reductions in family income has further contributed to students' stress and anxiety. Isolation and limited social opportunities have also taken a toll on students' mental health, leading to feelings of loneliness and depression [[9], [10], [11]].
The pandemic has disrupted the support systems students typically rely on, such as counseling services and peer support groups, making it harder for students to access the help they need. These challenges have been exacerbated by many university students' already high-stress levels, including academic pressure and uncertainty about their future careers. The COVID-19 pandemic has made it even more crucial for universities to provide support and resources to help students manage their mental health during this challenging time [12]. Therefore, the degree of stress among university students should be determined, and preventive actions should be adopted to improve their academic performance to ensure their future well-being [13]. Early diagnosis of a student's stress level can improve his or her life through early counseling and treatment for excessive stress. However, university administration bears some responsibility for student welfare, and advising all students can be a valiant endeavor for them. It would be more advantageous if a convenient tool could be utilized to anticipate the stress level among students so that the required counseling steps could be adopted effectively.
Over the years, there has been a growing recognition of the negative impact of stress on individuals, organizations, and society as a whole. As a result, many studies have been performed worldwide to develop efficient stress screening methods that can help identify those who may be at risk and provide appropriate interventions. For instance, researchers in Turkey created and validated the Turkish version of the Perceived Stress Scale (T-PSS-10), suggesting that health practitioners working with Turkish college students can use it as a screening instrument [14]. In addition, a study conducted in China validated the Chinese version of the Perceived Stress Questionnaire-13 (PSQ-C-13) using a sample of medical students [15]. Another study conducted in Ethiopia validated the PSS-10 for university students [16]. In Hungary, the PSS, the Ways of Coping Questionnaire (WCQ), and the Short Health Anxiety Inventory (SHAI) were used to collect data via a questionnaire administered during COVID-19, when dormitories were closed, and classes were conducted remotely [17]. Researchers are also exploring the use of chatbots to predict stress levels. One study investigated the effectiveness of a chatbot named Melinda in evaluating the stress levels of medical students during everyday conversations. They also looked into the essential condition for accepting a chatbot as a conversational partner, using validated stress instruments such as the Perceived Stress Questionnaire (PSQ20) [18]. Another study conducted in Italy involved the development of a chatbot to measure the engagement and effectiveness of Atena, a psychoeducational chatbot designed to assist with healthy coping mechanisms for stress and anxiety among university students [19]. Furthermore, in the UK, the feasibility and usability of a chatbot for mental health care within a social enterprise were investigated [20].
However, most studies did not utilize ML and data mining techniques. These techniques are being applied in numerous research studies to construct automated healthcare assistance systems that help experts forecast and prescribe solutions early [[21], [22], [23], [24], [25]]. Some earlier studies presented stress prediction techniques based on machine learning and data mining techniques for various target users [[26], [27], [28]]. However, less research has been conducted on students pursuing undergraduate and graduate degrees. Despite the significant impact of stress on the well-being of university students, there is a significant research gap in developing practical and reliable stress prediction tools. Many existing solutions are limited by their inability to capture stress's complex and dynamic nature accurately. Another limitation of existing models is the lack of validation using real-world data, making it difficult to determine their effectiveness in real-life settings. In light of this, we have formulated the following two research questions for this study.
-
•
To what extent has the COVID-19 pandemic impacted university students' stress levels and academic performances in relation to their mobile connectivity ?
-
•
Which ML-based models could be adapted to accurately predict the perceived stress levels of students during the COVID-19 pandemic?
The goal of this study was to determine the stress level PSS [29] during the COVID-19 pandemic concerning some vital factors, including gender, age, residence area, geolocation, academic level, academic satisfaction, sleep satisfaction, sleep hour, internet connectivity time, and many other significant life factors, using a thorough analysis and ML-based prediction system. As a result, an ML-based prediction model with extensive comparative analysis is established in this study. In order to build appropriate ML models for classifying people based on their stress level, eight supervised machine learning algorithms are used: Decision Tree Classifier (DTC), Random Forest Classifier (RFC), Logistic Regression (LR), K-Nearest Neighbors (KNN), Gradient Boosting Classifier (GBC), Adaboost Classifier (AdB), XGBoost Classifier (XGB), and Multi-Layer Perceptron (MLP). Principal component analysis and the chi-square test are used to optimize hyperparameters with grid search cross-validation and the evolutionary genetic algorithm. The main contributions of this study are as follows.
-
•
Conducting a cross-sectional study to collect data through an online survey administered among university students.
-
•
Analysis of the data and identification of insights related to the impact of mobile connectivity on students' stress levels during COVID-19 pandemic.
-
•
Development and validation of an ML-based prediction model for predicting PSS levels among students, which can be utilized by policymakers, educators, and mental health professionals.
2. Methodolgy
2.1. Study design and population
To better understand the impact of the COVID-19 pandemic on the stress levels and academic performance of the students, this study employed a cross-sectional survey method to collect the data. The demographics of the data consisted of undergraduate (age below 25 years) and postgraduate students (age above 21 years) [30]. The sample population was selected using a non-probability convenience sampling method, in which participants were recruited through social media platforms, university distribution lists, and personal contacts. The participation of the students in this study was voluntary, and they needed to consent before participating. A total of 444 students participated in this study. The number of participants is considered sufficient to conduct the study as the sample size exceeds 300 usually provides a reasonable margin of error in statistical inferences.
The survey data has been collected via Google Forms. The survey included queries regarding the participants' demographic information, academic performances, and perceived stress levels during the pandemic. The widely used and validated survey questionnaire, the Perceived Stress Scale (PSS), was used to measure the perceived stress of the students [29]. The survey design ensured that the questions were clear and concise, and participants could skip any questions they did not feel comfortable answering. The data capture period was from September 3, 2021, to November 8, 2021, and analysis was performed to identify the patterns or relationships between the variables. Overall, the study design and population selection ensured that the collected data were representative and provided valuable insights into the impact of the COVID-19 pandemic on the stress levels and academic performance of university students. The study was approved by the Committee for Advanced Studies and Research (CASR) at the Islamic University of Technology (IUT) in Bangladesh. The methodological workflow of this study has been illustrated in Fig. 1.
Fig. 1.

The methodological workflow diagram of the study.
2.2. Study measures
In this study, data was collected through an online survey conducted among university students from various ethnicities-the survey aimed to assess the stress levels caused by the overuse of mobile devices during COVID-19 pandemic. The questionnaire consisted of several parameters designed to assess different aspects of stress. The data collected through the online survey provided valuable insights into the stress levels experienced by individuals during the COVID-19 lockdown. Two research questions were addressed in the study. The first research question aimed to determine how much impact the COVID-19 pandemic had on students' stress levels and academic performances in relation to their mobile connectivity. The study examined the participants' data and offered an understanding of the scope of the pandemic's effects on students' stress levels and academic performances. The second research question was to find ML-based models that might be used to forecast students' stress levels during the COVID-19 epidemic. This research question aimed to identify models that could accurately predict students' stress levels, which could be utilized by policymakers, educators, and mental health professionals to devise interventions that promote students' well-being. The study addressed these two research questions by creating and validating a machine learning (ML)-based prediction model for predicting PSS levels among students. Overall, the research questions were created to shed light on how the pandemic affected students' stress levels and academic performances and suggest resources that may be used to promote students' well-being.
2.3. Data analysis
This study used descriptive data to calculate the percentage of students who experienced stress during the pandemic. The data was initially collected using an online survey, and the responses were then processed and cleaned using Python programming language (version 3.8.5) and the Anaconda data science platform (version 4.10.3). The Pandas library (version 1.4.4) was used to perform descriptive data analysis to calculate the percentage of students who experienced stress during the COVID-19 pandemic. Reduction techniques such as principal component analysis (PCA) and chi-squared tests were also used to simplify the data.
PCA was used to identify the most significant factors contributing to stress levels. In contrast chi-squared test was used to determine the association between stress levels and categorical variables. The analysis results were presented in frequency and percentage, which provided insights into the distribution of stress levels among students. The data analysis helped to understand the impact of different factors on stress levels. It provided the foundation for building a machine learning-based prediction system. The analysis findings provided valuable insights into students' stress levels distribution. They helped in understanding the impact of different factors on stress levels. These results formed the basis for building a machine learning-based prediction system for forecasting stress levels in the event of future pandemics. The analysis results could be used by policymakers, educators, and mental health professionals to develop targeted interventions that promote students' well-being and reduce the negative impact of pandemics on their mental health. Charts and graphs were created using Origin software (version 9.8.0.200) to visualize the findings.
This study involves four distinct phases, and after data collection and processing, the data is analyzed in several manners. First, all participants' psychological and social stress levels during the COVID-19 lockdown were assessed. Then the stress was examined concerning age, gender, dwelling area, geolocation, academic level, lifestyle, and internet access time. Finally, an ML based prediction model is constructed to forecast the stress level from people's lifestyle data if another pandemic arises. Fig. 1 depicts the overall workflow diagram for the study.
2.4. Building ML models
The dataset was initially imported into the Python environment, after which it was organized, processed, and analyzed. To begin, data was cleaned and encoded using one-hot encoding. This encoding method converts categorical data to numerical data, plotted and analyzed statistically. The dataset was assessed using three distinct techniques and different HPO algorithms to construct ML models. As is well known, HPO is an integral part of any ML-based prediction model [31]. Hyperparameters establish any ML algorithm's architecture and learning process, and it is crucial to obtain the optimal performance and case-specific prediction results from any machine learning model. In this study, two HPO algorithms, namely Grid Search and Evolutionary Genetic Algorithm are employed to optimize hyperparameters. Performance metrics such as accuracy, precision, F1 score, and ROC_AUC are calculated and compared to select the optimum model for predicting social and psychological stress. The overall workflow diagram is shown in Fig. 2.
Fig. 2.

ML prediction model construction workflow.
2.4.1. Grid search algorithm
Grid Search is a hyperparameter optimization algorithm that searches hyperparameters exhaustively from a specified grid space that has been explicitly configured. Grid search validates the model using the given grid space combinations and attempts to maximize the predefined performance metric [32]. When the number of hyperparameters is limited, grid search performs well; when the parameters are more significant, or the dataset is large, grid search consumes more resources and becomes less efficient. The number of evaluations grows exponentially as the number of hyperparameters rises.
2.4.2. Evolutionary algorithm
The evolutionary genetic algorithm is a metaheuristic natural selection algorithm used to solve various optimization problems [33]. Evolutionary genetic algorithms establish the starting population with the parameters specified, and the fitness score is calculated. This collection of parameters creates a chromosome that can be mutated, crossed over, and used to create a new generation of chromosomes. The mutation and cross-over processes are bio-inspired methods in which a new set of hyperparameters can gain information from the previous set and create a new generation for improved tuning of the hyperparameters. This new generation is again evaluated using the fitness function, and the set of chromosomes with the highest fitness value is chosen for the following generation. Fig. 3 depicts an evolutionary genetic algorithm.
Fig. 3.
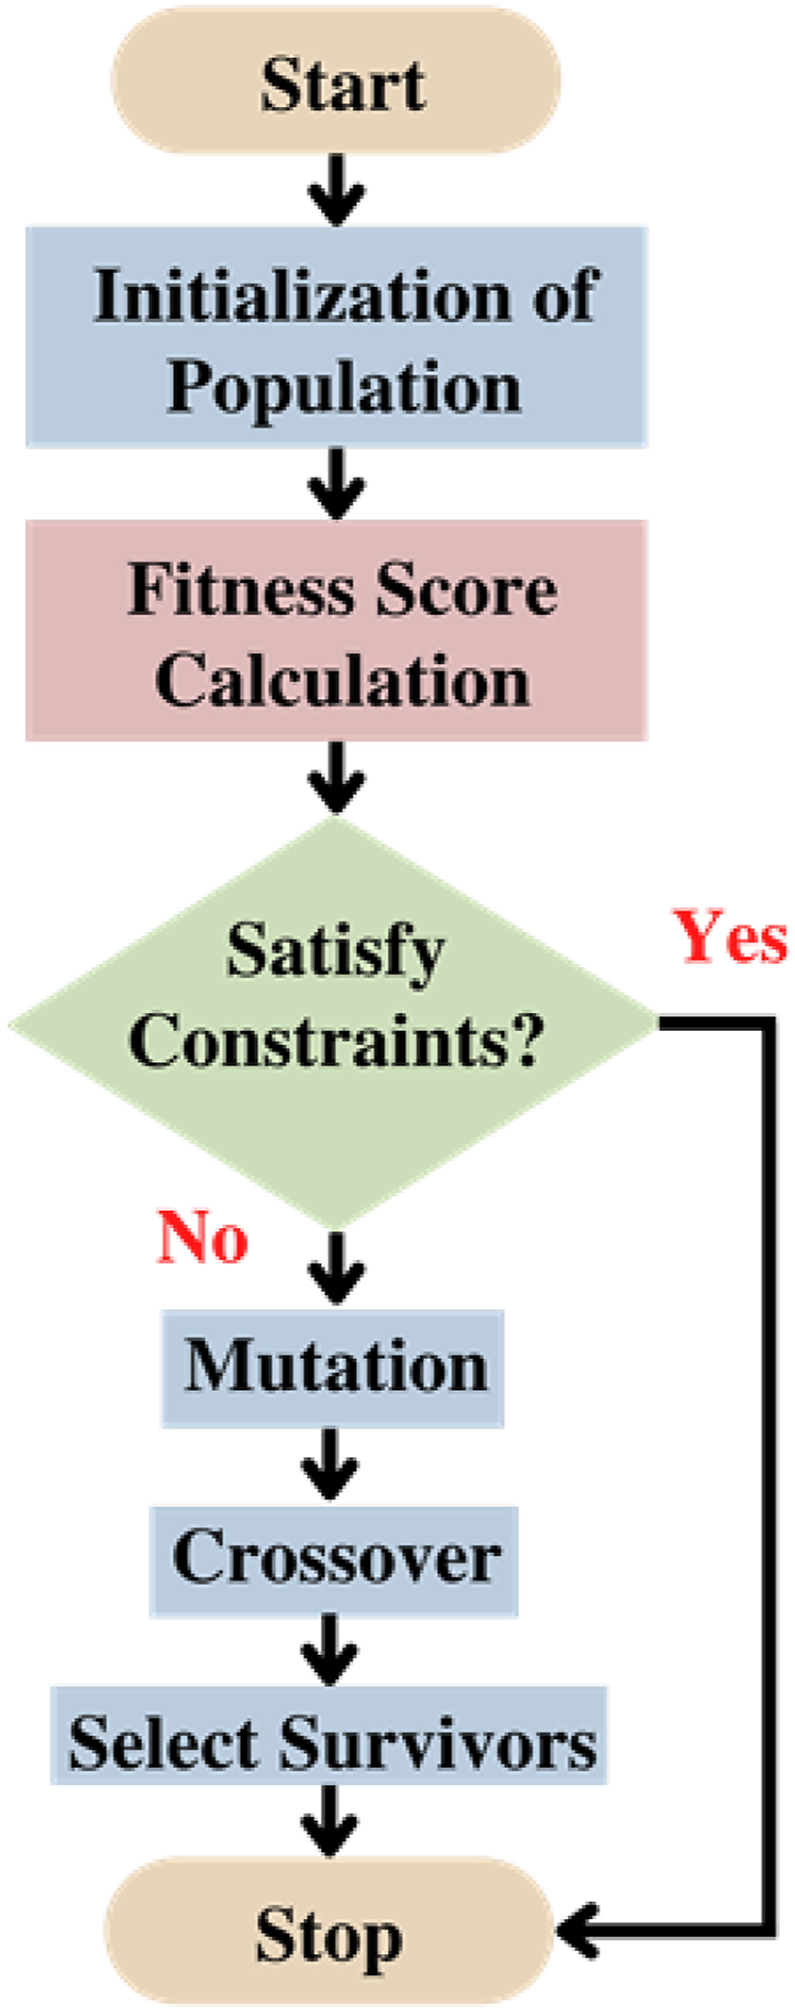
Evolutionary genetic algorithm.
2.4.3. Principal component analysis
Principal Component Analysis (PCA) is a dimensionality reduction method that condenses an extensive collection of variables into a smaller set, preserving the bulk of the information in the more extensive set. Reduced dimensionality reduces accuracy; however, the goal of reducing dimensionality is to trade some accuracy for simplicity. Machine learning algorithms can analyze data more quickly and easily because smaller data sets are easier to scrutinize and visualize, and there are fewer unnecessary elements to investigate. PCA was used extensively to reduce the number of variables and hence the number of decision-making units to rank and analyze. The PCA breaks down the data matrix X into infrastructure and noise components [34].
2.4.4. Chi-square test
The chi-square test assesses the importance of variables with the target column and ranks features accordingly. It is used when the target variable is categorical, and the likelihood ratio is used to evaluate the statistical significance. The chi-square statistic examines the degree of any inconsistencies between expected and actual results based on the sample size and number of variables involved in the relation. Degrees of freedom are used in these tests to determine whether a null hypothesis can be rejected based on the total number of experimental variables and samples.
2.4.5. Experimental environment
This study was carried out entirely on an Intel Core i5-8300H CPU running at 2.30 GHz, 16 GB of RAM, and an NVIDIA GTX 1050 Ti graphics unit with 4 GB of GPU memory using Jupiter Notebook v6.1.4 (Python 3 v3.8.5) and Anaconda-v4.10.3.
3. Result
3.1. Comparison of PSS score with demographical characteristics
The participants’ stress levels were evaluated using the PSS questionnaire, with scores ranging from 0 to 40. Fig. 4, Fig. 5 show the distribution of participants with different stress levels according to the PSS scale. During the outbreak of the COVID-19 pandemic, the majority of participants reported high levels of psychological stress and relatively low levels of social stress. Approximately 24.1% of participants reported very high levels of psychological stress, while 11.26% reported high levels of social stress. The questionnaire results were analyzed to determine psychological and social stress. The relationship between these two types of stress was analyzed using a scatterplot in Fig. 6. The scatterplot shows that higher social stress levels are associated with higher levels of psychological stress (see Fig. 8) (see Fig. 7).
Fig. 4.
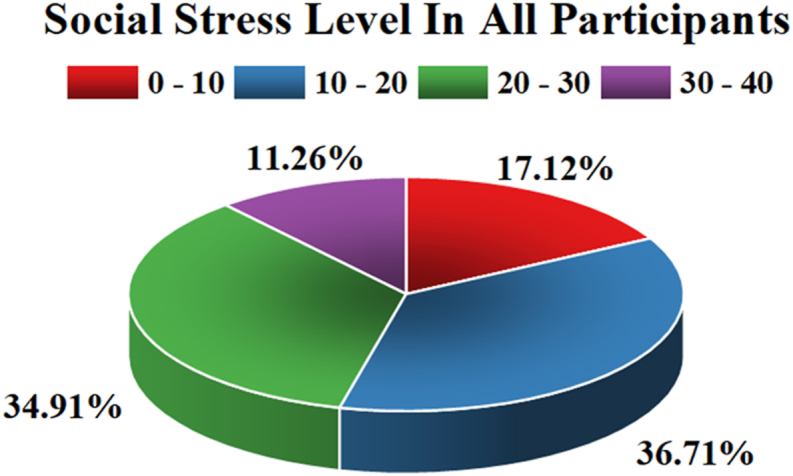
Pie chart for social stress.
Fig. 5.

Pie chart for psychological stress.
Fig. 6.

Scatterplot of psychological and social stress level.
Fig. 8.

Frequency distribution of Social Stress Level.
Fig. 7.

Frequency distribution of Psychological Stress Level.
Fig. 9(a) and Fig. 10(a) present the psychological and social stress levels of male and female participants, respectively. The results show that female participants experienced higher stress levels than male participants in terms of psychological and social stress. However, the maximum score for social stress was the same for males and females, but most women reported higher stress levels. The relationship between age and psychological and social stress levels is presented in Figs. 9(b) and Fig. 10(b), respectively. The study was conducted among five age groups, and the highest levels of psychological stress were found in participants aged 21–25 years. Social stress levels were similar in participants below 20 years old and those between 21 and 30 years old. As participants aged, their stress levels decreased for both psychological and social stress.
Fig. 9a.

Boxplot of psychological stress level according to (a) gender, (b) age, (c) city, (d) sleeping hours, (e) sleep satisfaction, (f) internet connectivity.
Fig. 10a.

Boxplot of social stress level according to (a) gender, (b) age, (c) city.
Fig. 9(c) and (i) illustrate the observed psychological stress levels based on housing area and geolocation. In contrast, Fig. 10(c) and (i) show the same for social stress levels. Results show that participants in big cities reported higher stress levels than those in small cities and rural areas. This is likely due to the increased population density in big cities, making it more challenging to maintain social distancing. Conversely, rural residents experienced lower stress levels because they had more space to move around and maintain social distance. Participants from Southeast Asia reported higher levels of psychological stress than those from other regions. In comparison, participants from Africa reported lower levels of psychological stress but higher levels of social stress. However, when considering both types of stress, the African population showed lower stress levels than other regions.
Fig. 9b.

Boxplot of psychological stress level according to (g) academic satisfaction, (h) academic level, and (i) geolocation.
Fig. 10b.

Boxplot of social stress level according to (d) sleeping hours, (e) sleep satisfaction, (f) internet connectivity, (g) academic satisfaction, (h) academic level, and (i) geolocation.
The findings of the study suggest that academic satisfaction is highly related to stress levels, as depicted in Figs. 9(g) and Fig. 10(g). Participants with high academic satisfaction levels reported lower psychological and social stress levels. Conversely, participants with lower academic satisfaction levels reported higher stress levels. Specifically, the study found that students in their second year of an undergraduate program experienced the highest psychological and social stress levels, as shown inFigs. 9(h) and Fig. 10(h). On the other hand, stress levels decreased as participants advanced academically.
The relationship between lifestyle and stress levels was also analyzed, and results showed that stress is closely related to sleep quality and satisfaction. Participants who slept less than 7 h per day reported higher stress levels. In comparison, those who slept more than 9 h per day reported higher stress levels than those who slept between 7 and 9 h. Additionally, the results showed that participants' internet activity was a significant contributor to stress levels, as depicted in Fig. 9(d), (e), 9(f), 10(d), 10(e), and 10(f). Participants who spent less time on the internet reported lower stress levels, indicating that internet dependency and connectivity during the pandemic may have contributed to increased anxiety levels.
3.2. Performance evaluation of ML models
3.2.1. Experiment A
Experiment A was conducted using the whole feature dataset. Initially, optimization of hyperparameters was not performed. Table 1 tabulates the normalized confusion matrices of the algorithms, while Table 2 provides performance metrics. After constructing models with default hyperparameters, the next model was constructed with hyperparameter optimization using a grid search technique and the whole dataset. Finally, the models were trained through an evolutionary genetic approach for hyperparameter optimization. All algorithms were fine-tuned for up to five generations using the genetic algorithm, and the optimum hyperparameters were achieved.
Table 1.
Normalized Confusion Matrices for ML Classifiers with Experiment A
| ML Algorithms | Default Hyperparameters |
HPO- Grid Search Algorithm |
HPO-Evolutionary GA |
|||||||||
|---|---|---|---|---|---|---|---|---|---|---|---|---|
| TP | TN | FP | FN | TP | TN | FP | FN | TP | TN | FP | FN | |
| DTC | 0.92 | 0.077 | 0.49 | 0.51 | 0.97 | 0.031 | 0.18 | 0.82 | 0.98 | 0.021 | 0.12 | 0.88 |
| RFC | 0.99 | 0.0073 | 0.012 | 0.99 | 1.0 | 0.0035 | 0.0099 | 0.99 | 0.99 | 0.009 | 0.013 | 0.99 |
| LR | 0.92 | 0.75 | 0.42 | 0.58 | 1.0 | 0.0 | 0.0 | 1.0 | 0.99 | 0.01 | 0.038 | 0.96 |
| KNN | 0.96 | 0.041 | 0.25 | 0.75 | 1.0 | 0.0023 | 0.003 | 1.0 | 1.0 | 0.0018 | 0.002 | 1.0 |
| GBC | 0.95 | 0.048 | 0.27 | 0.73 | 0.99 | 0.0091 | 0.037 | 0.96 | 0.99 | 0.011 | 0.049 | 0.95 |
| AdB | 0.93 | 0.067 | 0.39 | 0.61 | 0.99 | 0.0065 | 0.022 | 0.98 | 0.98 | 0.019 | 0.093 | 0.91 |
| XGB | 0.95 | 0.049 | 0.26 | 0.74 | 0.98 | 0.024 | 0.11 | 0.89 | 0.99 | 0.01 | 0.035 | 0.97 |
| MLP | 0.94 | 0.06 | 0.34 | 0.66 | 0.97 | 0.025 | 0.099 | 0.9 | 1.0 | 0.0 | 0.0 | 1.0 |
Table 2.
Performance Metrics of ML Algorithms by Experiment A
| Algorithms | Default Hyperparameters |
HPO- Grid Search Algorithm |
HPO-Evolutionary GA |
||||||||||||
|---|---|---|---|---|---|---|---|---|---|---|---|---|---|---|---|
| Accuracy | Precision | F1 Score | Recall | AUC | Accuracy | Precision | F1 Score | Recall | AUC | Accuracy | Precision | F1 Score | Recall | AUC | |
| DTC | 0.707 | 0.821 | 0.817 | 0.813 | 0.543 | 0.779 | 0.948 | 0.872 | 0.807 | 0.533 | 0.787 | 0.969 | 0.879 | 0.804 | 0.524 |
| RFC | 0.799 | 0.997 | 0.888 | 0.800 | 0.513 | 0.796 | 0.997 | 0.886 | 0.797 | 0.506 | 0.800 | 0.997 | 0.888 | 0.801 | 0.516 |
| LR | 0.744 | 0.865 | 0.843 | 0.823 | 0.569 | 0.795 | 1.000 | 0.886 | 0.795 | 0.500 | 0.796 | 0.990 | 0.885 | 0.800 | 0.515 |
| KNN | 0.771 | 0.929 | 0.866 | 0.811 | 0.542 | 0.796 | 0.999 | 0.886 | 0.797 | 0.504 | 0.797 | 0.999 | 0.887 | 0.797 | 0.503 |
| GBC | 0.772 | 0.923 | 0.866 | 0.815 | 0.552 | 0.795 | 0.990 | 0.885 | 0.800 | 0.513 | 0.795 | 0.987 | 0.884 | 0.801 | 0.516 |
| AdB | 0.749 | 0.878 | 0.848 | 0.819 | 0.562 | 0.796 | 0.994 | 0.886 | 0.799 | 0.510 | 0.791 | 0.976 | 0.881 | 0.804 | 0.524 |
| XGB | 0.777 | 0.928 | 0.869 | 0.817 | 0.558 | 0.791 | 0.971 | 0.881 | 0.806 | 0.532 | 0.797 | 0.991 | 0.886 | 0.801 | 0.515 |
| MLP | 0.759 | 0.896 | 0.855 | 0.818 | 0.560 | 0.795 | 0.974 | 0.883 | 0.808 | 0.537 | 0.796 | 1.000 | 0.886 | 0.796 | 0.500 |
The performance metrics from experiment A are represented in Tables 2 and it is clear from the tables that the RFC with evolutionary genetic algorithm yielded the best accuracy of 0.800. On the other hand, this experiment yields the highest precision (1.000), F1 Score (0.888), recall (0.823), and ROC AUC (0.569). The HPO has undeniably increased the performance of ML models, yet in our experiment, the ROC curve appears better with the default hyperparameters.
3.2.2. Results obtained from experiment B
Experiment B was carried out with reduced feature data obtained through 70% PCA. In experiment A, the ML models were trained using this reduced dimension dataset in three different ways. Table 3 tabulates the confusion matrices. The performance metrics for the three approaches are represented in Table 4. The performance metrics in this experiment demonstrate that the greatest accuracy was discovered using MLP to be 0.805, and the precision (1.000), F1 score (0.890), recall (0.827), and ROC AUC (0.569). Using evolutionary GA, the ROC curve provides higher performance in this experiment. The grid search HPO method yields the maximum accuracy. This experiment showed a performance that is substantially equal to all feature datasets, even though it decreases the data and takes nearly 70% of the information from the original dataset. This experiment decreased dimensionality while improving model performance.
Table 3.
Normalized Confusion Matrices for ML Classifiers with Experiment B.
| ML Algorithms | Default Hyperparameters |
HPO- Grid Search Algorithm |
HPO-Evolutionary GA |
|||||||||
|---|---|---|---|---|---|---|---|---|---|---|---|---|
| TP | TN | FP | FN | TP | TN | FP | FN | TP | TN | FP | FN | |
| DTC | 0.93 | 0.075 | 0.5 | 0.5 | 0.99 | 0.014 | 0.093 | 0.91 | 0.97 | 0.029 | 0.2 | 0.8 |
| RFC | 0.99 | 0.0087 | 0.024 | 0.98 | 1.0 | 0.0038 | 0.016 | 0.98 | 0.99 | 0.002 | 0.017 | 0.98 |
| LR | 0.93 | 0.07 | 0.43 | 0.57 | 1.0 | 0.0 | 0.0 | 1.0 | 0.97 | 0.031 | 0.16 | 0.84 |
| KNN | 0.96 | 0.044 | 0.25 | 0.75 | 1.0 | 0.0025 | 0.0081 | 0.99 | 1.0 | 0.0028 | 0.0091 | 0.99 |
| GBC | 0.95 | 0.05 | 0.27 | 0.73 | 0.98 | 0.017 | 0.087 | 0.91 | 0.99 | 0.009 | 0.046 | 0.95 |
| AdB | 0.93 | 0.067 | 0.4 | 0.6 | 0.98 | 0.018 | 0.073 | 0.93 | 0.99 | 0.013 | 0.057 | 0.94 |
| XGB | 0.95 | 0.049 | 0.27 | 0.73 | 0.98 | 0.016 | 0.072 | 0.93 | 0.98 | 0.016 | 0.062 | 0.94 |
| MLP | 0.94 | 0.062 | 0.35 | 0.65 | 0.97 | 0.26 | 0.84 | 0.92 | 0.91 | 0.085 | 0.51 | 0.49 |
Table 4.
Performance Metrics of ML Algorithms by Experiment B.
| Algorithms | Default Hyperparameters |
HPO- Grid Search Algorithm |
HPO-Evolutionary GA |
||||||||||||
|---|---|---|---|---|---|---|---|---|---|---|---|---|---|---|---|
| Accuracy | Precision | F1 Score | Recall | AUC | Accuracy | Precision | F1 Score | Recall | AUC | Accuracy | Precision | F1 Score | Recall | AUC | |
| DTC | 0.706 | 0.815 | 0.816 | 0.817 | 0.540 | 0.792 | 0.975 | 0.882 | 0.805 | 0.515 | 0.780 | 0.946 | 0.873 | 0.811 | 0.530 |
| RFC | 0.803 | 0.993 | 0.890 | 0.806 | 0.515 | 0.800 | 0.995 | 0.888 | 0.802 | 0.506 | 0.803 | 0.996 | 0.890 | 0.805 | 0.512 |
| LR | 0.744 | 0.864 | 0.844 | 0.825 | 0.562 | 0.800 | 1.000 | 0.889 | 0.800 | 0.500 | 0.791 | 0.957 | 0.880 | 0.814 | 0.540 |
| KNN | 0.779 | 0.931 | 0.871 | 0.819 | 0.551 | 0.801 | 0.997 | 0.889 | 0.802 | 0.504 | 0.801 | 0.997 | 0.889 | 0.802 | 0.504 |
| GBC | 0.781 | 0.926 | 0.871 | 0.822 | 0.561 | 0.796 | 0.977 | 0.885 | 0.808 | 0.523 | 0.799 | 0.988 | 0.887 | 0.805 | 0.512 |
| AdB | 0.753 | 0.876 | 0.850 | 0.826 | 0.566 | 0.800 | 0.981 | 0.887 | 0.809 | 0.526 | 0.800 | 0.986 | 0.888 | 0.807 | 0.520 |
| XGB | 0.781 | 0.927 | 0.871 | 0.822 | 0.560 | 0.799 | 0.981 | 0.886 | 0.808 | 0.523 | 0.801 | 0.985 | 0.888 | 0.808 | 0.524 |
| MLP | 0.767 | 0.899 | 0.861 | 0.826 | 0.569 | 0.805 | 0.979 | 0.889 | 0.815 | 0.543 | 0.718 | 0.820 | 0.823 | 0.827 | 0.564 |
3.2.3. Results obtained from experiment C
In experiment C, the feature reduction was made using the chi-square test, ten features were selected for the training of ML models using the trial-and-error method, and the performance metrics were evaluated similarly to experiments A and B. The performance metrics from experiment C yield the highest accuracy (0.800), precision (1.000), F1 score (0.887), recall (0.809), and ROC AUC (0.544). The highest accuracy is discovered utilizing the RFC, LR, and MLP model. In this instance, grid search and the evolutionary GA approach performed well. The normalized confusion matrices for this experiment are tabulated in Table 5, and the performance metrics are summarized in Table 6. This experiment yielded a good result, with performance almost equal to experiment A.
Table 5.
Normalized Confusion Matrices for ML Classifiers with Experiment C.
| ML Algorithms | Default Hyperparameters |
HPO- Grid Search Algorithm |
HPO-Evolutionary GA |
|||||||||
|---|---|---|---|---|---|---|---|---|---|---|---|---|
| TP | TN | FP | FN | TP | TN | FP | FN | TP | TN | FP | FN | |
| DTC | 0.98 | 0.022 | 0.15 | 0.85 | 0.99 | 0.014 | 0.049 | 0.95 | 0.98 | 0.02 | 0.068 | 0.93 |
| RFC | 0.97 | 0.027 | 0.12 | 0.88 | 0.99 | 0.012 | 0.018 | 0.98 | 0.98 | 0.016 | 0.03 | 0.97 |
| LR | 0.98 | 0.017 | 0.043 | 0.96 | 0.98 | 0.015 | 0.033 | 0.97 | 0.99 | 0.0098 | 0.0099 | 0.99 |
| KNN | 0.96 | 0.037 | 0.22 | 0.78 | 1.0 | 0.002 | 0.0 | 1.0 | 1.0 | 0.0018 | 0.0 | 1.0 |
| GBC | 0.97 | 0.031 | 0.17 | 0.83 | 0.98 | 0.018 | 0.04 | 0.96 | 0.98 | 0.02 | 0.054 | 0.95 |
| AdB | 0.98 | 0.023 | 0.085 | 0.92 | 0.98 | 0.018 | 0.04 | 0.96 | 0.98 | 0.023 | 0.085 | 0.92 |
| XGB | 0.97 | 0.035 | 0.18 | 0.82 | 0.98 | 0.022 | 0.07 | 0.93 | 0.98 | 0.023 | 0.08 | 0.92 |
| MLP | 0.98 | 0.019 | 0.051 | 0.95 | 0.98 | 0.018 | 0.037 | 0.96 | 0.96 | 0.039 | 0.21 | 0.79 |
Table 6.
Performance Metrics of ML algorithms by Experiment C (default Hyperparameters).
| Algorithms | Default Hyperparameters |
HPO- Grid Search Algorithm |
HPO-Evolutionary GA |
||||||||||||
|---|---|---|---|---|---|---|---|---|---|---|---|---|---|---|---|
| Accuracy | Precision | F1 Score | Recall | AUC | Accuracy | Precision | F1 Score | Recall | AUC | Accuracy | Precision | F1 Score | Recall | AUC | |
| DTC | 0.778 | 0.959 | 0.873 | 0.801 | 0.522 | 0.794 | 0.987 | 0.884 | 0.800 | 0.521 | 0.795 | 0.983 | 0.884 | 0.803 | 0.529 |
| RFC | 0.788 | 0.967 | 0.879 | 0.805 | 0.535 | 0.798 | 0.995 | 0.886 | 0.799 | 0.520 | 0.800 | 0.992 | 0.887 | 0.802 | 0.528 |
| LR | 0.798 | 0.989 | 0.886 | 0.802 | 0.528 | 0.798 | 0.991 | 0.886 | 0.801 | 0.525 | 0.800 | 0.997 | 0.887 | 0.799 | 0.518 |
| KNN | 0.773 | 0.939 | 0.867 | 0.807 | 0.539 | 0.794 | 1.000 | 0.885 | 0.794 | 0.504 | 0.794 | 1.000 | 0.885 | 0.794 | 0.503 |
| GBC | 0.779 | 0.953 | 0.873 | 0.805 | 0.535 | 0.799 | 0.989 | 0.886 | 0.802 | 0.529 | 0.798 | 0.986 | 0.886 | 0.804 | 0.532 |
| AdB | 0.794 | 0.978 | 0.883 | 0.805 | 0.534 | 0.799 | 0.989 | 0.886 | 0.803 | 0.530 | 0.794 | 0.978 | 0.883 | 0.805 | 0.534 |
| XGB | 0.782 | 0.951 | 0.874 | 0.808 | 0.542 | 0.796 | 0.982 | 0.884 | 0.804 | 0.533 | 0.795 | 0.979 | 0.883 | 0.804 | 0.533 |
| MLP | 0.798 | 0.987 | 0.885 | 0.803 | 0.529 | 0.800 | 0.990 | 0.887 | 0.803 | 0.531 | 0.777 | 0.941 | 0.870 | 0.809 | 0.544 |
The accuracy from experiment A using default hyperparameters was lower than that of GSCV and evolutionary GA. Both grid search and evolutionary GA demonstrated acceptable levels of accuracy, and most algorithms perform better using evolutionary GA like previous study of stress detection. The evolutionary GA performs better in most of the algorithms in experiment B and C. In most cases, evolutionary GA outperforms GSCV; however, GSCV significantly boosts accuracy [35]. In all three experiments, evolutionary GA surpasses the other approaches in most cases.
The lower dimensionality could save resources, avoid overfitting ML models, and improve model reliability [36]. Furthermore, the computational time required in GSCV and evolutionary GA is compared in Fig. 11. This demonstrates that the GA requires much more computational time than the GSCV because the GA generates more sets of hyperparameters for trial and evaluation than the GSCV. Fig. 12a, Fig. 12b compare the accuracy, precision, F1 score, recall, and ROC_AUC of the three experiments, respectively. These results clearly show that, most performance metrics are maximized in experiment B. Among all the approaches this research found the highest accuracy (0.805), precision (1.000), F1 score (0.890), recall (0.826), and AUC (0.569).
Fig. 11.

Comparison of computational time.
Fig. 12a.

Comparison of (a) accuracy, (b) precision.
Fig. 12b.
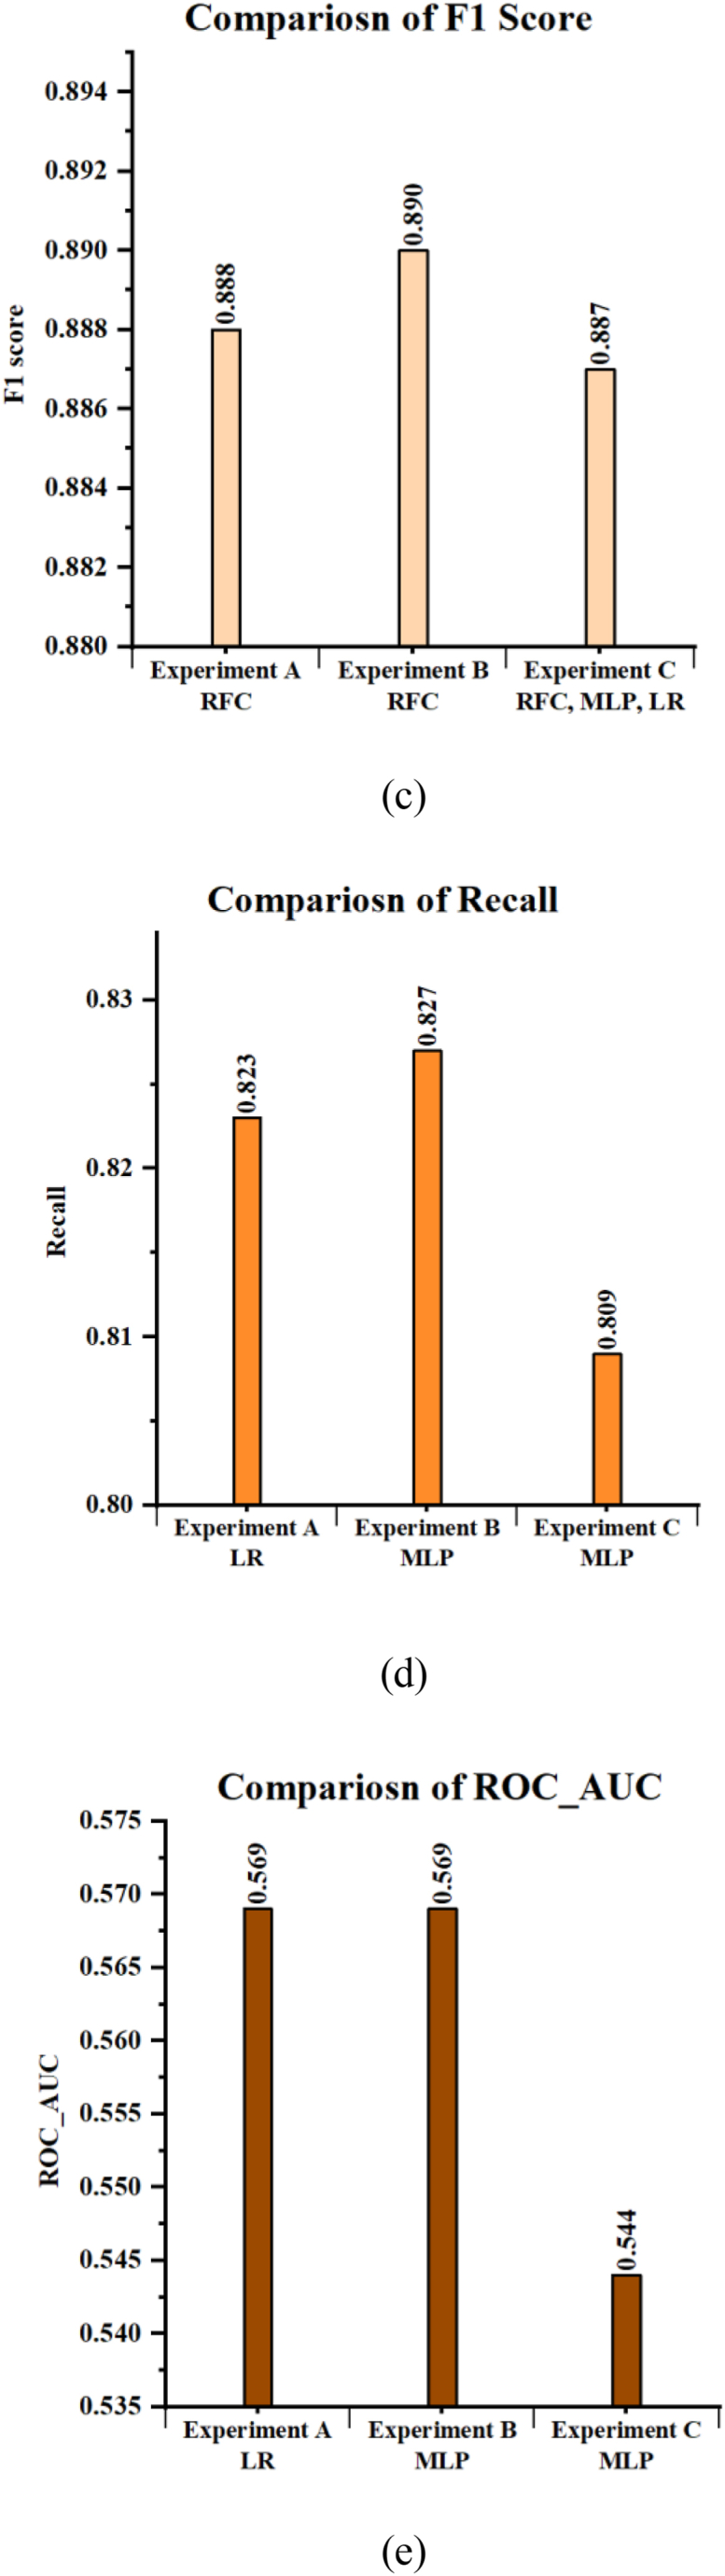
Comparison of (c) F1 score, (d) recall, (e) ROC_AUC.
4. Discussions
The results indicate that during COVID-19, a significant percentage of students experienced high levels of psychological stress (24.1%) and high levels of social stress (11.26%). Most participants experienced low to medium-level social stress but medium to high-level psychological stress during this period. Specifically, 27.93% and 27.76% of participants experienced mid and lower mid-levels of psychological stress. In comparison, 34.91% and 36.71% experienced mid and lower mid-levels of social stress. Additionally, 17.12% of participants had low levels of psychological stress, and 20% had low levels of social stress. According to a study in China, the COVID-19 pandemic has led to increased levels of stress, anxiety, and depression among university students, which in turn negatively affects their academic performance [37]. Our study also demonstrates a correlation between the COVID-19 pandemic and increased stress levels in students in university students. The findings suggest that lockdowns and home isolation contributed to the rise in stress levels, as did the increase in daily internet usage.
The three experiments investigated the efficacy of various machine learning algorithms employing feature reduction techniques and hyperparameter optimization methods. Experiment A was conducted using the whole feature dataset, and after hyperparameter optimization, the RFC algorithm using an evolutionary genetic approach yielded the best accuracy of 0.800. This experiment also yielded the highest precision (1.000), F1 Score (0.888), recall (0.823), and ROC_AUC (0.569), which is depicted in Table 2. On the other hand, in Experiment B, which was carried out using reduced feature data obtained through 70% PCA, the MLP algorithm using a five-fold grid search cross-validation approach achieved the best accuracy of 0.805. In addition, Table 4 signifies the precision was 1.000, the F1 score was 0.890, the recall was 0.826, and the AUC was 0.569. These results suggest that the ML-based prediction model developed in this study has the potential to accurately anticipate human stress levels in PSS during a pandemic situation.
These results suggest that the ML-based prediction model developed in this study has the potential to accurately anticipate human stress levels in PSS during a pandemic situation. These findings may help developing ML-based e-healthcare systems and other automated healthcare systems that can aid people in maintaining their mental health during a pandemic. The study results indicate that the COVID-19 pandemic has significantly impacted students' stress levels and academic performance. Specifically, the findings reveal that a high percentage of participants experienced psychological stress during the COVID-19 period. Moreover, the study data suggest that the COVID-19 pandemic has affected university students, as evidenced by the participants' high levels of perceived stress [38].
Comparing the performance of the different algorithms used in the experiments, it is clear that the evolutionary GA outperforms the other approaches in most cases. In Experiment A, both the grid search and evolutionary GA demonstrated acceptable levels of accuracy. However, evolutionary GA yielded the best results for most algorithms. In Experiment B, the MLP algorithm with the grid search approach achieved the best accuracy. In contrast, the RF algorithm with evolutionary GA achieved the best accuracy in Experiment C. However, in all three experiments, evolutionary GA outperformed the other approaches in most cases. Furthermore, when comparing the results of the experiments, Experiment B using reduced feature data obtained through 70% PCA, achieved the highest accuracy and performance metrics among all the approaches. Thus decreasing dimensionality can save resources, avoid overfitting, and improve model reliability.
Comparing the outcomes of the three experiments reveals that dimensionality reduction had no significant effect on the overall performance of the models, as experiment B, which employed PCA to reduce the dataset, achieved performance metrics comparable to those of experiment A. In addition, evolutionary GA is more effective than grid search for hyperparameter optimization, with the former producing the most significant results in most instances. Moreover, MLP consistently performed better in all three experiments, with the highest accuracy in experiments B and C. RFC also performed well, particularly in experiments A and C, where its default hyperparameters yielded the highest accuracy. With experiment C producing the best results, LR's performance could have been more consistent. In conclusion, it is essential to note that the ROC_AUC performance was generally poor across all experiments, with the maximum value occurring in experiments A and B (0.569).
In conclusion, the results of these investigations indicate that combining MLP and evolutionary GA for hyperparameter optimization is an efficient method for detecting stress from physiological data. In addition, reducing the dimensionality of the feature dataset had no significant effect on the overall performance of the models, making it a helpful technique for conserving computational resources and enhancing model accuracy. The findings revealed a correlation between the pandemic and increased stress levels in university students. The MLP algorithm with Experiment B using the five-fold grid search cross-validation approach achieved the best accuracy of 0.805. The precision was 1.000, the F1 score was 0.890, the recall was 0.826, and the AUC was 0.569. These results suggest that the ML-based prediction model developed in this study has the potential to accurately anticipate human stress levels in PSS during a pandemic situation. A similar study found that the Random Forest algorithm was found to play the most significant role in predicting the stress level detection in online classes, and the accuracy was 73.91% [39].
These results build on existing evidence of the negative impact of the COVID-19 pandemic on students’ mental health and academic performance. They also highlight the specific challenges faced by university students [40]. Policymakers, educators, and health professionals can use the findings to develop effective interventions to address the psychological stress and academic challenges experienced by students during the pandemic. The ML-based prediction model developed in this study can be utilized to monitor and predict students stress levels and provide timely interventions. These results should be considered when promoting mental health and academic resilience among students during and after pandemics. The data contribute a clearer understanding of the need for comprehensive support for students in crisis, including social and academic support, counseling, and mental health services. Overall, this study adds to the growing body of research on the negative impact of pandemics on mental health and emphasizes the need for comprehensive support systems for students during times of crisis.
5. Limitations and future research directions
The study has several limitations that must be considered when interpreting the findings. First, the generalizability of the results may be limited by the specific population studied, which consists of students. Therefore, caution should be exercised when generalizing the results to other populations. Second, the reliability of the data is impacted by the self-reported nature of the survey responses, which may be subject to bias and inaccurate recall [41]. Third, the results cannot confirm a causal relationship between the pandemic and students' stress levels and academic performance due to the lack of data on specific variables, such as pre-pandemic stress levels and academic performance [42]. Fourth, the methodological choices were constrained by the limitations of conducting research during a pandemic, such as the inability to collect in-person data [43]. Finally, it is beyond this study's scope to examine the pandemic's long-term effects on students' mental health and academic performance.
Based on the findings of this study, further research is needed to establish the long-term impact of the COVID-19 pandemic on students' stress levels and academic performance. It would be helpful to conduct longitudinal studies to track the development of stress levels and academic performance over a more extended period, such as several years. Future studies should also consider the various coping strategies that students utilize during the pandemic and how they affect their stress levels. Additionally, avenues for future research include exploring the impact of socioeconomic status and access to resources, such as high-speed internet and mental health services, on stress levels and academic performance during the pandemic [44]. Other potential research areas include the effectiveness of various interventions to reduce stress levels and improve academic performance, such as online counseling services and academic support programs. Further investigation into the use of ML-based models to predict stress levels in students could also be a fruitful area of research. Overall, these recommendations could provide valuable insights into how better to support students during pandemics and other stressful events.
6. Conclusion
As a global pandemic, COVID-19 hampered people's daily lives worldwide. It harmed both people's mental and physical well-being. It raisesstress in most students and lowers their mental strength due to lack of social interaction and heavy dependance on mobile devices. People suffered greatly from lockdown and home isolation, and the increased daily internet usage contributed to increased stress levels. According to the findings of this study, around 24.1% of participants had high psychological stress throughout the study period, whereas 11.26% experienced high social stress. In psychological stress, the mid and lower mid-levels of stress were experienced by 27.93% and 27.76% of participants, respectively, and 34.91% and 36.71% in social stress. Also, 17.12% of participants had low levels of psychological stress, and 20% had low levels of social stress. The findings indicate that most participants experienced low to medium-level social and medium-to-high-level psychological stress during COVID-19. Furthermore, the ML prediction model results are reasonable, with the highest accuracy, precision, F1 score, recall, and AUC of 0.805, 1.000, 0.890, 0.826, and 0.569, respectively. The best accuracy of 0.805 is attained utilizing the MLP algorithm with Experiment B using the five-fold grid search cross-validation approach. The study's findings are noteworthy and can aid in developing an ML-based prediction system to anticipate human stress levels in PSS if another pandemic arises. These findings may be helpful in the development of ML-based e-healthcare systems and other automated healthcare systems. Moreover, in a pandemic situation, it can aid people in maintaining their mental health.
Ethics statement
The studies involving human participants were reviewed and approved by Committee for Advanced Studies and Research (CASR) at the Islamic University of Technology (IUT) in Bangladesh (Reference number: REASP/CASR/48/29/06/Proc/01). Proper informed consent to participate in this study was provided by the participants as per the policy of CASR.
Funding information
This work was supported by the Islamic University of Technology under IUT Seed Grant REASP/IUT-RSG/2021/OL/07/008.
Data availability
The data used for this study is available at https://github.com/ishrakratul/Covid-19-Stress-Analysis-In-Undergraduate-Students.git which is mentioned in Ref. [30].
Declaration of competing interest
The authors declare that they have no known competing financial interests or personal relationships that could have appeared to influence the work reported in this paper
Footnotes
Supplementary data to this article can be found online at https://doi.org/10.1016/j.heliyon.2023.e17307.
Appendix A. Supplementary data
The following is the Supplementary data to this article.
References
- 1.WHO Coronavirus (COVID-19) Dashboard | WHO Coronavirus (COVID-19) Dashboard With Vaccination Data, (n.d.). https://covid19.who.int/(accessed February 10, 2023).
- 2.Archibong V., Usman I.M., Kasozi K.I., Aigbogun E.O., Josiah I., Monima A.L., Ssebuufu R., Chekwech G., Terkimbi S.D., Owoisinke O., Mbiydzenyuy N.E., Adeoye A., Aruwa J.O., Afodun A.M., Odoma S., Ssempijja F., Ayikobua E.T., Ayuba J.T., Nankya V., Onongha C., Henry S., Matama K., Yusuf H., Nalugo H., MacLeod E., Welburn S.C. Anxiety, anger and depression amongst low-income earners in southwestern Uganda during the COVID-19 total lockdown. Front. Public Health. 2021;9:1–10. doi: 10.3389/fpubh.2021.590458. [DOI] [PMC free article] [PubMed] [Google Scholar]
- 3.Lemuel A.M., Usman I.M., Kasozi K.I., Alghamdi S., Aigbogun E.O., Archibong V., Ssebuufu R., Kabanyoro A., Ifie J.E., Swase D.T., Ssempijja F., Ayuba J.T., Matama K., Onohuean H., Kembabazi S., Henry R., Odoma S., Yusuf H., Afodun A.M., Assaggaf H.M., Kairania E., Aslam A., Okon O., El-Saber Batiha G., Welburn S.C. COVID-19-Related mental health burdens: impact of educational level and relationship status among low-income earners of western Uganda. Front. Public Health. 2021;9:1–9. doi: 10.3389/fpubh.2021.739270. [DOI] [PMC free article] [PubMed] [Google Scholar]
- 4.Kasozi K.I., Mujinya R., Bogere P., Ekou J., Zirintunda G., Ahimbisibwe S., Matama K., Ninsiima H.I., Echoru I., Ayikobua E.T., Ssimbwa G., Musinguzi S.P., Muyinda R., Ssempijja F., Matovu H., MacLeod E., Anderson N.E., Welburn S.C. Pandemic panic and anxiety in developing countries. Embracing One Health offers practical strategies in management of COVID-19 for Africa. Pan Afr. Med. J. 2020;35:5–7. doi: 10.11604/pamj.2020.35.3.22637. [DOI] [PMC free article] [PubMed] [Google Scholar]
- 5.Hena Y., Salman K., Ramsha M. Covid 19: stress management among students and its impact on their effective learning. Int. Technol. Educ. J. 2020;4:65–74. https://files.eric.ed.gov/fulltext/EJ1286695.pdf [Google Scholar]
- 6.Shaikh S. COVID-19 : fear and anxiety among healthcare students in Saudi Arabia. A cross- sectional study. 2021;8:1638–1647. doi: 10.1177/00469580211025225. [DOI] [PMC free article] [PubMed] [Google Scholar]
- 7.Ali S., Tauqir S., Alam B.F., Farooqi F., Khan A.M., Khabeer A. COVID-19 knowledge, attitude and awareness among preclinical and clinical dental students: an online-based cross-sectional survey. J. Oral Res. 2021;10 doi: 10.17126/joralres.2021.026. [DOI] [Google Scholar]
- 8.Update on Omicron, (n.d.). https://www.who.int/news/item/28-11-2021-update-on-omicron (accessed July 12, 2022).
- 9.Mohsin S.F., Shah S.A., Agwan M.A.S., Ali S., Alsuwaydani Z.A., Alsuwaydani S.A. Effect of the COVID-19 pandemic on dental interns in Saudi Arabia. Work. 2022;71:825–831. doi: 10.3233/WOR-205377. [DOI] [PubMed] [Google Scholar]
- 10.Karobari M.I., Marya A., Ali S., Basheer S.N., Adil A.H., Horn R., Marya C.M., Venugopal A., Messina P., Scardina G.A. A multicultural demographic study to evaluate the impact of the SARS-CoV-2 pandemic on the job satisfaction across the dental industry. Pesqui. Bras. Odontopediatria Clin. Integr. 2021;21:1–10. doi: 10.1590/pboci.2021.171. [DOI] [Google Scholar]
- 11.Ali S., Tauqir S., Farooqi F.A., Al-Jandan B., Al-Janobi H., Alshehry S., Abdelhady A.I., Farooq I. Psychological impact of the COVID-19 pandemic on students, assistants, and faculty of a dental institute of Saudi Arabia. Int. J. Environ. Res. Publ. Health. 2021;18 doi: 10.3390/ijerph182413366. [DOI] [PMC free article] [PubMed] [Google Scholar]
- 12.Mujinya R., Kalange M., Ochieng J.J., Ninsiima H.I., Eze E.D., Afodun A.M., Nabirumbi R., Sulaiman S.O., Kairania E., Echoru I., Okpanachi A.O., Matama K., Asiimwe O.H., Nambuya G., Usman I.M., Obado O.L., Zirintunda G., Ssempijja F., Nansunga M., Matovu H., Ayikobua E.T., Nganda P.E., Onanyang D., Ekou J., Musinguzi S.P., Ssimbwa G., Kasozi K.I. Cerebral cortical activity during academic stress amongst undergraduate medical students at kampala international university (Uganda) Front. Psychiatr. 2022;13 doi: 10.3389/fpsyt.2022.551508. [DOI] [PMC free article] [PubMed] [Google Scholar]
- 13.Li Y., Wang A., Wu Y., Han N., Huang H. Impact of the COVID-19 pandemic on the mental health of college students: a systematic review and meta-analysis. Front. Psychol. 2021;12:1–14. doi: 10.3389/fpsyg.2021.669119. [DOI] [PMC free article] [PubMed] [Google Scholar]
- 14.Kaya C., Tansey T.N., Melekoglu M., Cakiroglu O., Chan F. Psychometric evaluation of Turkish version of the Perceived Stress Scale with Turkish college students. J. Ment. Health. 2019;28:161–167. doi: 10.1080/09638237.2017.1417566. [DOI] [PubMed] [Google Scholar]
- 15.Jiang C., Mastrotheodoros S., Zhu Y., Yang Y., Hallit S., Zhao B., Fan Y., Huang M., Chen C., Ma H., Meng R. The Chinese version of the perceived stress questionnaire-13: psychometric properties and measurement invariance for medical students. Psychol. Res. Behav. Manag. 2023;16:71–83. doi: 10.2147/PRBM.S385510. [DOI] [PMC free article] [PubMed] [Google Scholar]
- 16.Manzar M.D., Salahuddin M., Alghadir A., Anwer S., Peter S., Bahammam A.S., Pandi-Perumal S.R. Psychometric properties of the generalized anxiety disorder-7 Scale in Ethiopian university students. Bull. Menninger Clin. 2021;85:405–427. doi: 10.1521/BUMC.2021.85.4.405. [DOI] [PubMed] [Google Scholar]
- 17.Garbóczy S., Szemán-Nagy A., Ahmad M.S., Harsányi S., Ocsenás D., Rekenyi V., Al-Tammemi A.B., Kolozsvári L.R. Health anxiety, perceived stress, and coping styles in the shadow of the COVID-19. BMC Psychol. 2021;9:1–13. doi: 10.1186/s40359-021-00560-3. [DOI] [PMC free article] [PubMed] [Google Scholar]
- 18.Moldt J.A., Festl-Wietek T., Mamlouk A.M., Herrmann-Werner A. Assessing medical students' perceived stress levels by comparing a chatbot-based approach to the Perceived Stress Questionnaire (PSQ20) in a mixed-methods study. Digit. Heal. 2022;8 doi: 10.1177/20552076221139092. [DOI] [PMC free article] [PubMed] [Google Scholar]
- 19.Gabrielli S., Rizzi S., Bassi G., Carbone S., Maimone R., Forti S., Kessler F.B. vol. 9. 2021. pp. 1–14. (Engagement and Effectiveness of a Healthy-Coping Intervention via Chatbot for University Students during the COVID-19 Pandemic : Mixed Methods Proof-Of-Concept Study Corresponding Author). [DOI] [PMC free article] [PubMed] [Google Scholar]
- 20.G. Cameron, D. Cameron, G. Megaw, R. Bond, M. Mulvenna, S.O. Neill, C. Armour, M. Mctear, Assessing the Usability of a Chatbot for Mental Health Care, Springer International Publishing, n.d. 10.1007/978-3-030-17705-8. [DOI]
- 21.Ratul I.J., Wani U.H., Nishat M.M., Al-Monsur A., Ar-Rafi A.M., Faisal F., Kabir M.R. Survival prediction of children undergoing hematopoietic stem cell transplantation using different machine learning Classifiers by performing chi-square test and hyperparameter optimization: a retrospective analysis. Comput. Math. Methods Med. 2022;2022 doi: 10.1155/2022/9391136. [DOI] [PMC free article] [PubMed] [Google Scholar]
- 22.Kumar P., Garg S., Garg A. Assessment of anxiety, depression and stress using machine learning models. Procedia Comput. Sci. 2020;171:1989–1998. doi: 10.1016/j.procs.2020.04.213. [DOI] [Google Scholar]
- 23.Ratul I.J., Al-Monsur A., Tabassum B., Ar-Rafi A.M., Nishat M.M., Faisal F. 19th Int. Conf. Electr. Eng. Comput. Telecommun. Inf. Technol. ECTI-CON 2022. 2022. Early risk prediction of cervical cancer: a machine learning approach. [DOI] [Google Scholar]
- 24.Parthiban K., Pandey D., Pandey B.K. Impact of SARS-CoV-2 in online education, predicting and contrasting mental stress of young students: a machine learning approach. Augment. Hum. Res. 2021;6:1–7. doi: 10.1007/s41133-021-00048-0. [DOI] [Google Scholar]
- 25.Muntasir Nishat M., Faisal F., Jahan Ratul I., Al-Monsur A., Ar-Rafi A.M., Nasrullah S.M., Reza M.T., Khan M.R.H. A comprehensive investigation of the performances of different machine learning Classifiers with SMOTE-ENN oversampling technique and hyperparameter optimization for imbalanced heart failure dataset. Sci. Program. 2022;2022 doi: 10.1155/2022/3649406. [DOI] [Google Scholar]
- 26.Kulkarni R., Gaware U., Shriram R. In: Data Intell. Cogn. Informatics. Jacob I.J., Kolandapalayam Shanmugam S., Izonin I., editors. Springer Nature Singapore; Singapore: 2023. Statistical analysis of stress prediction from speech signatures; pp. 27–38. [Google Scholar]
- 27.Ng A., Wei B., Jain J., Ward E.A., Tandon S.D., Moskowitz J.T., Krogh-Jespersen S., Wakschlag L.S., Alshurafa N. Predicting the next-day perceived and physiological stress of pregnant women by using machine learning and explainability: algorithm development and validation. JMIR Mhealth Uhealth. 2022;10 doi: 10.2196/33850. [DOI] [PMC free article] [PubMed] [Google Scholar]
- 28.Anitha S., Vanitha M. A novel feature selection with stochastic gradient descent logistic regression for multilabeled stress prediction in working employees. Concurrency Comput. Pract. Ex. 2022;34 doi: 10.1002/cpe.6911. [DOI] [Google Scholar]
- 29.Chan S.F., La Greca A.M. Perceived stress Scale (PSS) Encycl. Behav. Med. 2020:1646–1648. doi: 10.1007/978-3-030-39903-0_773. [DOI] [Google Scholar]
- 30.ishrakratul/Covid-19-Stress-Analysis-In-Undergraduate-Students, (n.d.). https://github.com/ishrakratul/Covid-19-Stress-Analysis-In-Undergraduate-Students (accessed February 2, 2023).
- 31.Weerts H.J.P., Mueller A.C., Vanschoren J. Importance of tuning hyperparameters of machine learning algorithms. 2020. http://arxiv.org/abs/2007.07588
- 32.Belete D.M., Huchaiah M.D. Grid search in hyperparameter optimization of machine learning models for prediction of HIV/AIDS test results. Int. J. Comput. Appl. 2021;0:1–12. doi: 10.1080/1206212X.2021.1974663. [DOI] [Google Scholar]
- 33.Wang Z.Z., Sobey A. A comparative review between Genetic Algorithm use in composite optimisation and the state-of-the-art in evolutionary computation. Compos. Struct. 2020;233 doi: 10.1016/j.compstruct.2019.111739. [DOI] [Google Scholar]
- 34.Jayasutha V.G., Arunachalam T. Deep learning with statistical analysis for stress prediction of remote working IT employees in COVID-19 pandemic. Int. Conf. Sustain. Comput. Data Commun. Syst. ICSCDS 2022 - Proc. 2022:179–184. doi: 10.1109/ICSCDS53736.2022.9761009. [DOI] [Google Scholar]
- 35.Lekkas D., Jacobson N.C. Using artificial intelligence and longitudinal location data to differentiate persons who develop posttraumatic stress disorder following childhood trauma. Sci. Rep. 2021;11:1–10. doi: 10.1038/s41598-021-89768-2. [DOI] [PMC free article] [PubMed] [Google Scholar]
- 36.Salam M.A., Azar A.T., Elgendy M.S., Fouad K.M. The effect of different dimensionality reduction techniques on machine learning overfitting problem. Int. J. Adv. Comput. Sci. Appl. 2021;12:641–655. doi: 10.14569/IJACSA.2021.0120480. [DOI] [Google Scholar]
- 37.Cao W., Fang Z., Hou G., Han M., Xu X., Dong J., Zheng J. The psychological impact of the COVID-19 epidemic on college students in China. Psychiatr. Res. 2020;287 doi: 10.1016/J.PSYCHRES.2020.112934. [DOI] [PMC free article] [PubMed] [Google Scholar]
- 38.Alam M.D., Lu J., Ni L., Hu S., Xu Y. Psychological outcomes and associated factors among the international students living in China during the COVID-19 pandemic. Front. Psychiatr. 2021;12:1372. doi: 10.3389/FPSYT.2021.707342/BIBTEX/PDF. [DOI] [PMC free article] [PubMed] [Google Scholar]
- 39.Siddique S., Baidya S., Rahman M.S. 2021 5th Int. Conf. Electr. Inf. Commun. Technol. EICT 2021. 2021. Machine learning based model for predicting stress level in online education due to coronavirus pandemic: a case study of Bangladeshi students. [DOI] [Google Scholar]
- 40.Roche A.I., Holdefer P.J., Thomas E.B.K. College student mental health: understanding changes in psychological symptoms in the context of the COVID-19 pandemic in the United States. Curr. Psychol. 2022;1:1–10. doi: 10.1007/S12144-022-03193-W/FIGURES/2. [DOI] [PMC free article] [PubMed] [Google Scholar]
- 41.Appleby J.A., King N., Saunders K.E., Bast A., Rivera D., Byun J., Cunningham S., Khera C., Duffy A.C. Impact of the COVID-19 pandemic on the experience and mental health of university students studying in Canada and the UK: a cross-sectional study. BMJ Open. 2022;12:1–13. doi: 10.1136/bmjopen-2021-050187. [DOI] [PMC free article] [PubMed] [Google Scholar]
- 42.Brooks S.K., Webster R.K., Smith L.E., Woodland L., Wessely S., Greenberg N., Rubin G.J. The psychological impact of quarantine and how to reduce it: rapid review of the evidence. Lancet. 2020;395:912–920. doi: 10.1016/S0140-6736(20)30460-8. [DOI] [PMC free article] [PubMed] [Google Scholar]
- 43.Palese A., Papastavrou E., Sermeus W. Challenges and opportunities in health care and nursing management research in times of COVID-19 outbreak. J. Nurs. Manag. 2021;29:1351–1355. doi: 10.1111/jonm.13299. [DOI] [PMC free article] [PubMed] [Google Scholar]
- 44.Wang C., Pan R., Wan X., Tan Y., Xu L., Ho C.S., Ho R.C. Immediate psychological responses and associated factors during the initial stage of the 2019 coronavirus disease (COVID-19) epidemic among the general population in China. Int. J. Environ. Res. Publ. Health. 2020;17 doi: 10.3390/ijerph17051729. [DOI] [PMC free article] [PubMed] [Google Scholar]
Associated Data
This section collects any data citations, data availability statements, or supplementary materials included in this article.
Supplementary Materials
Data Availability Statement
The data used for this study is available at https://github.com/ishrakratul/Covid-19-Stress-Analysis-In-Undergraduate-Students.git which is mentioned in Ref. [30].