

Abstract
Increasing evidence has shown that light exists in a diverse range of deep‐sea environments. We unexpectedly found that blue light is necessary to produce excess zero‐valent sulfur (ZVS) in Erythrobacter flavus 21‐3, a bacterium that has been recently isolated from a deep‐sea cold seep. E. flavus 21‐3 is able to convert thiosulfate to ZVS using a novel thiosulfate oxidation pathway comprising a thiosulfate dehydrogenase (TsdA) and a thiosulfohydrolase (SoxB). Using proteomic, bacterial two‐hybrid and heterologous expression assays, we found that the light–oxygen–voltage histidine kinase LOV‐1477 responds to blue light and activates the diguanylate cyclase DGC‐2902 to produce c‐di‐GMP. Subsequently, the PilZ domain‐containing protein mPilZ‐1753 binds to c‐di‐GMP and activates TsdA through direct interaction. Finally, Raman spectroscopy and gene knockout results verified that TsdA and two SoxB homologs cooperate to regulate ZVS production. As ZVS is an energy source for E. flavus 21‐3, we propose that deep‐sea blue light provides E. flavus 21‐3 with a selective advantage in the cold seep, suggesting a previously unappreciated relationship between light‐sensing pathways and sulfur metabolism in a deep‐sea microorganism.
Keywords: adaptive strategy, blue light, deep‐sea bacterium, thiosulfate oxidation, zero‐valent sulfur
Subject Categories: Evolution & Ecology; Metabolism; Microbiology, Virology & Host Pathogen Interaction
Blue light promotes sulfur metabolism in the deep‐sea cold seep bacterium Erythrobacter flavus 21‐3 via a pathway involving a light‐sensing LOV histidine kinase and c‐di‐GMP production.

Introduction
Light is a ubiquitous and important environmental signal for bacteria (Gomelsky & Hoff, 2011). Bacteria can respond to and utilize light as an essential energy source in a variety of ways (Frigaard & Dahl, 2009; Elias‐Arnanz et al, 2011). Based on their photosynthesizing abilities, photo‐sensitive bacteria are divided into two groups: photosynthetic bacteria and non‐photosynthetic bacteria. Some anoxygenic photosynthetic bacteria harvest light using bacteriochlorophyll and carotenoid (Cogdell et al, 1999), and using inorganic and organic reduced sulfur compounds, elemental sulfur, hydrogen, and nitrite as electron donors (Howard et al, 2006; Griffin et al, 2007; Hoeft et al, 2007; Idi et al, 2015). Some oxygenic photosynthetic bacteria, like cyanobacteria, sense light using either phytochrome or rhodopsin, and use water for electron donors (Jung et al, 2003; Wiltbank & Kehoe, 2019). In addition to photosynthetic bacteria, there are also many non‐photosynthetic bacteria that sense light, by using different photoreceptors, including light–oxygen–voltage (LOV), the sensor protein for blue light using the FAD (BLUF), and bacteriophytochrome, among others (Davis et al, 1999; van der Horst et al, 2007). The light generates a signal that activates a downstream module, which then generates an output response. Many bacteria respond to light using a two‐component system containing LOV histidine kinases (LOV HKs) and their response regulators (Christie et al, 1998; Crosson & Moffat, 2001; Purcell et al, 2007; Swartz et al, 2007; Gao & Stock, 2009; Krauss et al, 2009; El‐Mowafy et al, 2013). Activated LOV HKs modulate the effector domains of their response regulators through transphosphorylation to affect gene expression and different cellular functions (Christie et al, 1998; Purcell et al, 2007; Gao & Stock, 2009; El‐Mowafy et al, 2013).
Most bacteria respond to light stimulation by regulating different aspects of cellular metabolism (Elias‐Arnanz et al, 2011). Sulfur metabolism in response to light stimulation has been studied widely in anoxygenic photosynthetic bacteria, mainly using green sulfur bacteria (GSB) and purple sulfur bacteria (PSB) (Frigaard & Dahl, 2009; Gregersen et al, 2011). Most of the studied bacteria used reduced sulfur as electron donors for reductive carbon dioxide fixation during photolithoautotrophic growth (Sirevag & Ormerod, 1970; Wang et al, 1993; Frigaard & Dahl, 2009). Elemental sulfur is an important intermediate and product of reduced sulfur oxidation, and it was therefore widely detected either on the surface or in the cytoplasm of the sulfur bacteria examined (Franz et al, 2009; Maki, 2013; Marnocha et al, 2016). The elemental sulfur was mainly generated by sulfide through the quinone reductase (SQR) and sulfur‐oxidizing enzyme (Sox) complex pathways. The SQR pathway produced soluble polysulfide, which generated elemental sulfur spontaneously (Steudel, 1996; Prange et al, 2004). The Sox complex pathway generated elemental sulfur when sulfur dehydrogenase SoxCD was lacking (Gregersen et al, 2011).
Due to their metabolic demands, sulfur bacteria are ubiquitously found in water columns or aquatic sediments, which have abundant reduced sulfur and lower oxygen (Vila et al, 2002). Deep‐sea cold‐seep sediments also have these characteristics; they contain active sulfur cycles and low concentrations of oxygen (Aharon & Fu, 2003). Sulfur‐oxidizing bacteria are widely distributed in these regions, and potentially use novel pathway of sulfur metabolism (Zhang et al, 2020). Increasing evidence supports the existence of deep‐sea light (Haddock et al, 2010; Wong et al, 2015; Baker et al, 2019). Organisms that live in the deep sea have previously been found to sense and use light to regulate various functions (Liu et al, 2021; Shan et al, 2022); however, whether and how deep‐sea sulfur bacteria respond to light is unclear.
Previously, we found that the deep‐sea cold‐seep bacterium, Erythrobacter flavus 21‐3, was able to convert thiosulfate into zero‐valent sulfur (ZVS) and sulfate (Zhang et al, 2020). Using genomic sequencing, its genome (~3.2 Mbp) was obtained. Using proteomic and genetic methods, we discovered a novel thiosulfate oxidation pathway that used thiosulfate dehydrogenase (TsdA) and thiosulfohydrolase (SoxB) (Fig EV1). Moreover, the occurrence of this thiosulfate oxidation pathway was found in the deep‐sea environment and was frequently used by microbes to take part in the active cold‐seep biogeochemical sulfur cycle (Cai et al, 2022). By chance, we found that light illumination significantly increased the formation of ZVS by E. flavus 21‐3. However, whether the formation of ZVS occurred via the novel thiosulfate oxidation pathway was unclear. In this study, we found that blue light significantly promoted the formation of ZVS in E. flavus 21‐3. Using a combination of proteomic, genetic, and biochemical methods, we found that the processes involved with sensing blue light and ZVS production were sequentially mediated by a light–oxygen–voltage histidine kinase (LOV‐1477), a diguanylate cyclase (DGC‐2902), a PilZ protein (mPilZ‐1753), a thiosulfate dehydrogenase (TsdA), and two thiosulfohydrolases (SoxB‐277 and SoxB‐285). Finally, we discussed the existence of light in the deep sea and the significance of light in driving the formation of ZVS in deep‐sea bacteria.
Figure EV1. The proposed thiosulfate oxidation pathway identified in E. flavus 21‐3.

This model was modified based on our previous study (Zhang et al, 2020). Briefly, E. flavus 21‐3 generated tetrathionate from two molecules of thiosulfate, which was catalyzed by thiosulfate dehydrogenase (TsdA). Then, the thiosulfohydrolase (SoxB) liberated the sulfate from tetrathionate. The remaining sulfane was converted to polysulfide and consequently formed stable zero‐valent sulfur (ZVS) in the form of S8 (the ‘?’ indicated that how polysulfide converted to ZVS was unknown). Next, the sulfur globule S8 was finally oxidized by sulfur dioxygenase A/sulfur dioxygenase B (SdoA/SdoB) with sulfite formation. Finally, the sulfite was non‐enzymatically/enzymatically converted to sulfate.
Results
Blue light stimulates the production of ZVS in the deep‐sea bacterium E. flavus 21‐3
In our previous study (Zhang et al, 2020), we found that the ZVS produced by E. flavus 21‐3 formed a “light white zone” around the bacterial colony, when cultured on a solid medium supplemented with thiosulfate. Both the intensity and area of the “light white zone” were proportional to the quantity of ZVS present. By chance, we observed that E. flavus 21‐3 produced a large amount of ZVS when it was cultivated using a solid medium with 100 mM sodium thiosulfate after exposure to white light for 72 h (Fig 1A). We also noticed that the ZVS‐forming capability was weak when E. flavus 21‐3 was cultured in the dark (Fig 1B). We confirmed these results using Raman spectroscopy (Fig 1A and B). The Raman spectrum showed three strong peaks at 152, 216, and 473 cm−1, which corresponded to the bending and stretching modes of the eightfold ring, and the vibration of the S‐S bond of cyclooctasulfur (Berg et al, 2014). Therefore, the formation of the ZVS produced by E. flavus 21‐3 was identified as S8.
Figure 1. The formation of zero‐valent sulfur (ZVS) by E. flavus 21‐3 when stimulated by blue light.

- Production of ZVS by E. flavus 21‐3 when it was cultivated on a 2216E plate supplemented with 100 mM sodium thiosulfate for 72 h with light illumination (upper panel). The yellow and white arrows correspond to the E. flavus 21‐3 colonies, and the light white zones are produced by the ZVS, respectively. The content within the “light white zone” on the plate was identified as ZVS in the form of S8 by Raman spectroscopy (lower panel). The red and yellow squares correspond to the specific points of the Raman spectroscopy detecting positions. They are located 0.5 and 2.5 cm away from the center of bacterial colony, and were present in and out of the “light white zone”, respectively. The red arrows show three typical Raman peaks of S8, at 152, 216, and 473 cm−1, which correspond to the bending and stretching modes of the eightfold ring, and the vibration of the S‐S bond of cyclooctasulfur. Strong Raman peaks appeared at ~1,157 and ~1,523 cm−1 due to the C‐C and C=C stretching modes of the carotenoids produced by E. flavus 21‐3. The strong Raman peak at ~988 cm−1 is due to the sulfate produced by E. flavus 21‐3. The peak at ~3,250 cm−1 corresponds to a symmetric ‐OH stretch, due to the occasional presence of water on the cover of the culture dish.
- The absence of ZVS in E. flavus 21‐3 when it was cultivated on a 2216E plate supplemented with 100 mM sodium thiosulfate for 72 h under dark condition (upper panel). The absence of ZVS around the bacterial colonies (which are marked by yellow arrows) was confirmed by Raman spectroscopy (lower panel). The blue and green squares correspond to the specific points where the Raman spectroscopy was detected. They are located 0.5 and 2.5 cm away from the center of bacterial colony, respectively.
- The yield of formed ZVS when E. flavus 21‐3 was cultivated either in the dark or under five different wavelengths of light (white, red, green, infrared, or blue) (N = 3 biological replicates).
- The growth status of E. flavus 21‐3 when it was cultivated either with blue light or in the dark (N = 5 biological replicates).
- The concentration of ZVS when E. flavus 21‐3 was cultivated under blue light or in the dark for 12, 24, 48, 72, or 96 h (N = 3 biological replicates).
Data information: In (C–E), data were presented as mean ± SD. In (D and E), Student's t‐test was performed. The P‐value for each test is presented. And n.s. means no significance.
Source data are available online for this figure.
White light is a mixture of different wavelengths, such as blue, red, and green light. Therefore, we sought to find out which specific kind of light stimulated ZVS production in E. flavus 21‐3. We cultivated E. flavus 21‐3 in the dark and under exposure to different wavelengths of 6 W of fluorescent light, including white light (wavelengths of 400–760 nm [450 μmol m−2 s−1]), blue light (wavelengths of 465–470 nm [20 μmol m−2 s−1]), green light (wavelengths of 520–525 nm [90 μmol m−2 s−1]), red light (wavelengths of 620–625 nm [80 μmol m−2 s−1]), and infrared light (wavelengths of 940 nm [5 μmol m−2 s−1]) (Shan et al, 2022). The amount of ZVS produced under these different conditions was then determined. The results showed that E. flavus 21‐3 produced ZVS with maximum efficiency when cultivated under blue light (Fig 1C). This indicated that blue light might be the main stimulus responsible for the generation of ZVS. To exclude the possibility that the different abilities to form ZVS were due to differences in biomass, we compared the growth rates and amount of ZVS generated from the bacterial cells cultivated under blue light and in the dark. Based on the colony formation unit (CFU) results, we found no significant differences between the growth of E. flavus 21‐3 under blue light and the growth of E. flavus 21‐3 in the dark, when cultivated with 100 mM sodium thiosulfate (Fig 1D). However, the amount of ZVS produced by E. flavus 21‐3 cultured under blue light was more (by 43.0–57.8%) than that produced by E. flavus 21‐3 cultured in the dark (Fig 1E). Therefore, we concluded that the different yields of ZVS produced by E. flavus 21‐3 were independent of its growth discrepancy in blue light and the dark.
A light–oxygen–voltage histidine kinase (LOV HK) responds to blue light and triggers the production of ZVS
To find out which protein mediated the sensing of blue light in E. flavus 21‐3, we performed proteomic assessments of E. flavus 21‐3 strains cultivated under blue light, and strains cultivated in the dark, for 48 and 72 h. We searched for and analyzed known bacterial blue light sensors, and found the upregulated expression of two genes, D0Y83_07385 and D0Y83_08225 (which both encode potential blue light sensors), in the cells cultivated under blue light for 48 and 72 h (Fig 2A). Consistently, the qRT–PCR results confirmed that the transcription of the D0Y83_07385 gene was significantly upregulated after a 36‐hour cultivation and a 48‐hour cultivation (Fig 2B). And the transcription of the D0Y83_08225 gene was also markedly upregulated after 36‐hour cultivation under blue light. Using the CDD search and HMM search, the proteins encoded by the D0Y83_07385 and D0Y83_08225 genes were both predicted to contain a Per‐ARNT‐Sim (PAS) domain. PAS domains occur widely in blue light sensors, which indicates that these two proteins are both blue light sensors in E. flavus 21‐3 (Pellequer et al, 1998; Christie et al, 1999; Gomelsky & Klug, 2002).
Figure 2. LOV histidine kinase LOV‐1477 is the potential blue light sensor driving the formation of ZVS in E. flavus 21‐3.

-
AProteomic analysis of the differences in protein expression in E. flavus 21‐3 when cultivated with 100 mM sodium thiosulfate for either 48 or 72 h under blue light or dark conditions. The asterisks mark the proteins showing significant expression differences (fold > 1.2) when E. flavus 21‐3 was cultivated under blue light compared to when E. flavus 21‐3 was cultivated in the dark.
-
BThe relative expression levels of the genes, D0Y83_07385 (lov‐1477) and D0Y83_08225 (lov‐1647), when E. flavus 21‐3 was cultivated in 2216E broth supplemented with 100 mM sodium thiosulfate for 36, 48, 60, and 72 h under blue light, compared to when E. flavus 21‐3 was cultivated in the dark. Data were presented as mean ± SD (N = 3 technical replicates). Student's t‐test was performed. The P‐value for each test is presented. And n.s. means no significance.
-
C, DThe spectral changes of potential light sensors including LOV‐1477 (C) and LOV‐1647 (D) illuminated with blue light for specific intervals of time.
-
E, FReaction kinetics for the dark recovery of LOV‐1477 and LOV‐1647. The recovery kinetics were measured at 25°C. LOV‐1477 (E) and LOV‐1647 (F) were incubated in the dark for 5‐minute increments and 30‐minute increments, respectively. The amount of photoproduct remaining was then plotted against the duration of the dark incubation.
-
GComparison of ZVS produced by the wild‐type strain, and the Δlov‐1647 (with deletion of lov‐1647 in E. flavus 21‐3) mutant strain, when cultivated with 100 mM sodium thiosulfate under blue light for 72 h.
Source data are available online for this figure.
To confirm that the proteins encoded by D0Y83_07385 and D0Y83_08225 were both blue light sensors, we analyzed their protein sequences. First, they were aligned with the characterized PAS‐domain‐containing proteins in Uniprot. We found that they were both homologous to the protein EL368‐LOV‐HK (Q2NCA3) from the Erythrobacter litoralis strain HTCC2594, with sequence similarities of 43.5 and 50.3%, respectively. The shared E‐values were 1.2e‐85 and 4.4e‐1111, respectively. After aligning the motifs and conserved domains, and predicting their structures, we concluded that both proteins contained a LOV domain and an HK domain. The HK domain consisted of a dimerization/histidine phosphotransfer (DHp) and a catalytic/ATP‐binding (CA) domain (Appendix Fig S1) (Rivera‐Cancel et al, 2014). The conserved flavin‐binding motif, GXNCRFLQ, and the autophosphorylation site at histidine residue were also found (Fig EV2) (Glantz et al, 2016). Therefore, we proposed that both proteins were LOV HKs. To verify their functions, we expressed and purified them, and then illuminated them with blue light. We applied the blue light for specific increments of time after dark adaption and then recorded the sequential spectra. The reaction kinetics of the dark recovery were also measured. These results showed that the proteins belonged to the LOV domain‐containing proteins (Fig 2C–F) (Swartz et al, 2001). We named the proteins encoded by the D0Y83_07385 and D0Y83_08225 genes, “LOV‐1477” and “LOV‐1647”, respectively.
Figure EV2. Multiple sequence alignments of the light–oxygen–voltage histidine kinase LOV‐1477, LOV‐1647, and other reported LOV proteins.

The flavin‐binding motif GXNCRFLQ and the conserved autophosphorylation site at histidine residue were marked with asterisks. Sequence alignments with LOV‐1477, LOV‐1647, and other LOV proteins were identified by MAFFT and R package msa, ggmsa, Biostrings, ggseqlogo, and cowplot.
To determine which LOV HK drove the ZVS production in E. flavus 21‐3 by sensing blue light, we attempted to individually delete the lov‐1477 and lov‐1647 genes to investigate their functions in vivo. The deletion of lov‐1647 did not affect ZVS production when the mutant (∆lov‐1647) was cultivated with 100 mM thiosulfate under blue light (Fig 2G). This indicated that LOV‐1647 might not be the key enzyme for sensing blue light and driving the formation of ZVS in E. flavus 21‐3. Using an established suicide vector, we failed to delete the lov‐1477 gene after much effort; this indicates that lov‐1477 might be an essential gene, involved in determining the metabolism of E. flavus 21‐3. Given that we only identified two proteins with potential roles in this pathway, and we excluded LOV‐1647, we proposed that LOV‐1477 might be the key enzyme responsible for the elevated yield of ZVS after sensing blue light.
LOV‐1477 phosphorylates the diguanylate cyclase, DGC‐2902, and promotes the production of c‐di‐GMP
The two‐component system associated with LOV proteins typically consists of a LOV HK and its cognate response regulator (Swartz et al, 2007). The phosphorylated receiver (REC) domain of the response regulator activates the effector domain to regulate cellular physiology (Sycz et al, 2015). As we proposed that LOV‐1477 was the blue light sensor of E. flavus 21‐3, we attempted to identify the potential response regulators of LOV‐1477. We searched for all proteins containing the REC domain, using alignments of the conserved REC domain. In total, we found seven genes encoding proteins that contained REC domains (Fig 3A), all of which were considered potential interaction partners of LOV‐1477. Based on the results of bacterial two‐hybrid assays, we found that four of the proteins (encoded by D0Y83_07390, D0Y83_14025, D0Y83_15570, and D0Y83_14465) interacted with LOV‐1477 (Fig 3B). These interactions were verified in a bacterial two‐hybrid system with elevated expression of beta‐galactosidase as a read‐out for protein–protein interactions (Fig 3C). This suggested that LOV‐1477 was a potentially important regulator, required for the mediation of several processes, including sulfur metabolism in E. flavus 21‐3. Among these four proteins, no known effector domain was found within the proteins encoded by D0Y83_07390 or D0Y83_14025 (Fig 3A); and for the protein encoded by D0Y83_15570, we detected a bacteriophytochrome histidine kinase that could sense infrared light (Liu et al, 2021) but not the blue light. In contrast, the protein encoded by D0Y83_14465 contained a GGDEF domain, a known effector domain associated with diguanylate cyclase (DGC) and the production of c‐di‐GMP (Simm et al, 2004) (Fig 3A). We thus proposed that D0Y83_14465 was most likely to be the cognate response regulator of LOV‐1477. In accordance with this, we performed qRT–PCR analyses, which showed that the transcription of the D0Y83_14465 gene was upregulated after 36‐hour and 48‐hour cultivations under blue light, compared to cultivations under dark conditions (Fig 3D). Moreover, the evident activity of c‐di‐GMP synthesis was found when D0Y83_14465 was heterologously expressed in Escherichia coli (Fig 3E). Given the diguanylate cyclase activity of D0Y83_14465, we decided to name it “DGC‐2902” in this study.
Figure 3. LOV histidine kinase LOV‐1477 phosphorylates diguanylate cyclase DGC‐2902 and facilitates the production of c‐di‐GMP.

- The domain annotations of proteins containing receiver (REC) domains. The asterisks highlight the proteins that interact with LOV‐1477 based on the results below.
- Detection of interaction between LOV‐1477 and the predicted proteins containing REC domains. Assays were done on MacConkey with 1% maltose and X‐gal‐LB indicator plate (LB broth with 40 μg ml−1 X‐gal) with 0.5 mM IPTG. Reporter strains of E. coli BTH101 were transformed, respectively, using T18 and T25 fusion constructs to exclude self‐activation. The E. coli BTH101 strain harboring pKNT25‐Zip and pCH363‐Zip plasmids was performed as the positive control.
- Measurement of the β‐galactosidase activity of E. coli BTH101 harboring pKNT25‐LOV1477 and pCH363 plasmids containing different REC domains of E. flavus 21‐3. The β‐galactosidase activity of the E. coli BTH101 harboring respectively used vector was used as the negative control. The β‐galactosidase activity of E. coli BTH101 harboring pKNT25‐Zip and pCH363‐Zip plasmids was measured as the positive control (N = 3 biological replicates).
- The relative expression of dgc‐2902 when E. flavus 21‐3 was cultivated under blue light for 36, 48, 60, and 72 h in comparison to when E. flavus 21‐3 was cultivated in the dark (N = 3 technical replicates).
- Comparison of the intracellular c‐di‐GMP concentration in E. coli BL21(DE3) with and without the overexpression of DGC‐2902, cultivated for 24 h. The c‐di‐GMP concentration of E. coli BL21(DE3) transformed with the empty vector was normalized as 1 (N = 3 biological replicates).
- Comparison of the intracellular c‐di‐GMP concentration in E. flavus 21‐3 cultivated for 36 h under blue light and in the dark. The c‐di‐GMP concentration of E. flavus 21‐3 cultivated in the dark was normalized as 1 (N = 3 biological replicates).
- Comparison of the intracellular c‐di‐GMP concentration in E. coli BL21(DE3) co‐expressing LOV‐1477 and DGC‐2902 after cultivation for 36 h under blue light and in the dark. The c‐di‐GMP concentration of this strain cultivated in the dark was normalized as 1 (N = 3 biological replicates).
- Comparison of the intracellular c‐di‐GMP concentration in E. coli BL21(DE3) co‐expressing LOV‐1477 mutant protein (with 185His mutated to Gln) and DGC‐2902, or co‐expressing LOV‐1477 and DGC‐2902 mutant protein (with 69Asp mutated to Gly), after cultivation for 36 h in the blue light and dark. The c‐di‐GMP concentration of the strains cultivated in the dark was normalized as 1 (N = 3 biological replicates).
Data information: In (C–H), data were presented as mean ± SD. Student's t‐test was performed. The P‐value for each test is presented. And n.s. means no significance.
Source data are available online for this figure.
Generally, the conserved His residue in the LOV HK and the conserved Asp residue in the REC domain of the response regulator were essential for this two‐component system (Purcell et al, 2007; Gao & Stock, 2009; El‐Mowafy et al, 2013). After multiple sequence alignments using sequences studied previously (Herrou & Crosson, 2011; MacGregor, 2016), the conserved His and Asp residues were found in LOV‐1477, and its response regulator, DGC‐2902 (Figs EV2 and EV3). Therefore, we deduced that blue light would cause a similar increase in autophosphorylation and subsequent phosphate group transfer in LOV‐1477 and DGC‐2902, resulting in the release of c‐di‐GMP as an output response.
Figure EV3. Multiple sequence alignments of the diguanylate cyclase DGC‐2902 and other reported REC domain‐containing proteins.

The conserved phosphorylation site was marked with asterisk. Sequence alignments with DGC‐2902 and other REC domain‐containing proteins were identified by MAFFT and R packages msa, ggmsa, Biostrings, ggseqlogo, and cowplot.
To verify the above speculation, we measured the intracellular c‐di‐GMP concentrations in E. flavus 21‐3 strains that were cultivated under either blue light or dark condition. Indeed, we found a higher concentration of c‐di‐GMP was produced by the E. flavus 21‐3 cultivated under blue light compared with the strain cultivated in the dark (Fig 3F). Then, we co‐expressed LOV‐1477 and DGC‐2902 together and tested their coordinated functions in E. coli because we failed to delete lov‐1477 in E. flavus 21‐3. As expected, we observed a higher concentration of c‐di‐GMP when E. coli was cultivated under blue light compared with E. coli strains cultivated in the dark (Fig 3G). In contrast, after mutating the 185His residue (the conserved autophosphorylation site) within LOV‐1477 or the 69Asp residue (the conserved phosphate accepting site in the REC domain) within the REC domain of DGC‐2902 to Gln and Gly, respectively, we found no significant differences in the concentrations of c‐di‐GMP when E. coli had been cultivated under blue light or in the dark (Fig 3H). Our above results suggested that when E. flavus 21‐3 was stimulated by blue light, LOV‐1477 phosphorylated DGC‐2902 to release more c‐di‐GMP as an output response.
mPilZ‐1753 binds to c‐di‐GMP and activates thiosulfate dehydrogenase (TsdA) through interaction
We next investigated the potential connection between ZVS production and the LOV‐1477/DGC‐2902 two‐component system in E. flavus 21‐3. To do this, we measured the relative expression of key enzymes involved in ZVS production—including thiosulfate dehydrogenase (TsdA) and thiosulfohydrolase (SoxB)—with E. flavus 21‐3 cultivated with thiosulfate either under blue light or in the dark (Zhang et al, 2020). The relative expression of tsdA in the E. flavus 21‐3 cultivated under blue light was upregulated after both the 36‐hour cultivation and the 48‐hour cultivation. There were no significant differences after the 60‐hour and 72‐hour cultivations (Fig 4A). These observations were consistent with the transcription of dgc‐2902 (Fig 3D). More importantly, the ZVS was present when mutant ∆soxB had been cultivated with 100 mM thiosulfate under blue light, but it was absent with mutant ∆tsdA (Fig 4B). We, therefore, inferred that DGC‐2902 might regulate TsdA to mediate ZVS formation by adjusting the production of c‐di‐GMP.
Figure 4. The diguanylate cyclase DGC‐2902 potentially coordinates with mPilZ‐1753 to activate thiosulfate dehydrogenase (TsdA) by regulating the production of c‐di‐GMP in blue light.
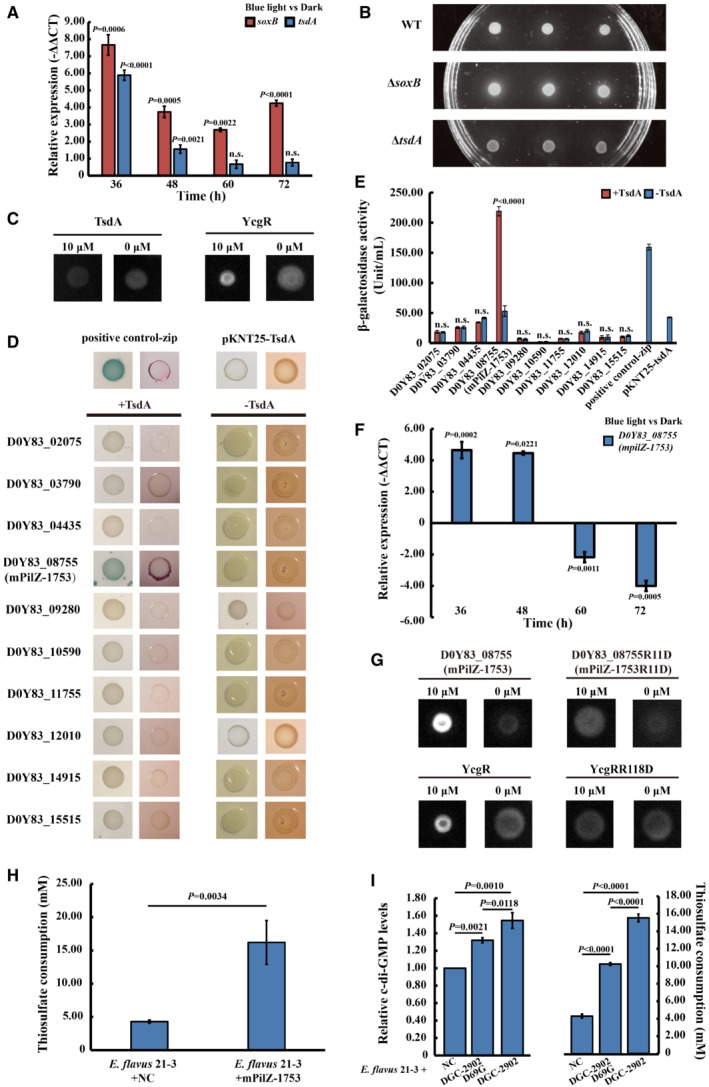
- The relative expression of tsdA and soxB (encoding the thiosulfohydrolase) when E. flavus 21‐3 was cultivated under blue light for 36, 48, 60, and 72 h compared to when E. flavus 21‐3 was cultivated in the dark (N = 3 technical replicates).
- ZVS was present when the E. flavus 21‐3 wild‐type strain and the mutant ΔsoxB strain (with a deletion of soxB) were cultivated with 100 mM thiosulfate under blue light but was absent when mutant ΔtsdA strain (with a deletion of tsdA) was cultivated under the same conditions.
- DRaCALA analysis on the interaction between 1 μM fluorescent c‐di‐GMP and 10 μM TsdA. The typical PilZ domain‐containing protein YcgR was used as the positive control for the DRaCALA analysis with the same performances used for TsdA. And the buffer used to dissolve protein was used as the negative control.
- The interactions between TsdA and the predicted PilZ proteins were assayed on MacConkey with 1% maltose and X‐gal‐LB indicator plate with 0.5 mM IPTG. Reporter strains of E. coli BTH101 were transformed, respectively, using T18 and T25 fusion constructs to exclude self‐activation. The E. coli BTH101 strain harboring pKNT25‐Zip and pCH363‐Zip plasmids was performed as the positive control.
- Measurement of the β‐galactosidase activity of E. coli BTH101 harboring pKNT25‐TsdA and pCH363 plasmids, inserted into different genes that encode PilZ proteins in E. flavus 21‐3. The β‐galactosidase activity of E. coli BTH101 strain harboring respectively used vector was measured as the negative control. The β‐galactosidase activity of E. coli BTH101 harboring pKNT25‐Zip and pCH363‐Zip plasmids was measured as the positive control (N = 3 biological replicates).
- The relative expression of mpilZ‐1753 when E. flavus 21‐3 was cultivated under blue light for 36, 48, 60, and 72 h, compared to cultivations in the dark (N = 3 technical replicates).
- DRaCALA analysis on the interaction between 1 μM fluorescent c‐di‐GMP and 10 μM mPilZ‐1753 as well as mPilZ‐1753R11D (a mutant of mPilZ‐1753). YcgR and YcgRR118D (a mutant of YcgR) were used as the positive and negative control, respectively, for the DRaCALA analysis with the same performances used for mPilZ‐1753. And the buffer used to dissolve protein was used as the negative control.
- Measurement of the thiosulfate consumption in E. flavus 21‐3 with/without the overexpression of mPilZ‐1753 after cultivation with 100 mM sodium thiosulfate under blue light for 72 h. “E. flavus 21‐3 + NC” in this panel refers to the E. flavus 21‐3 transformed with the empty vector was performed as the negative control (N = 3 biological replicates).
- Comparison of intracellular c‐di‐GMP concentration (left panel) and thiosulfate consumption (right panel) in E. flavus 21‐3 with the overexpression of DGC‐2902 and its mutant DGC‐2902D69G after cultivation with 100 mM sodium thiosulfate under blue light for 36 and 72 h, respectively. E. flavus 21‐3 transformed with the empty vector was performed as the negative control and its intracellular c‐di‐GMP concentration was normalized as 1, which is indicated as “E. flavus 21‐3 + NC” in this panel (N = 3 biological replicates).
Data information: In (A, E, F, H, and I), data were presented as mean ± SD. Student's t‐test was performed. The P‐value for each test is presented. And n.s. means no significance.
Source data are available online for this figure.
It is known that PilZ proteins are potential c‐di‐GMP effectors (Ryan et al, 2012; Chou & Galperin, 2016). They were able to interact with other proteins in a c‐di‐GMP‐dependent manner and then regulated bacterial metabolism (Chin et al, 2012; Guzzo et al, 2013; Xu et al, 2016). However, after domain prediction and the differential radial capillary action of ligand (DRaCALA) assay, we found that TsdA had neither predicted PilZ domain nor c‐di‐GMP‐binding ability (Fig 4C). Therefore, we wondered whether an individual PilZ protein interacted with TsdA to regulate the sulfur production in E. flavus 21‐3. To address this concern, we searched and found 10 homologous genes encoding PilZ that have been identified in the genome of E. flavus 21‐3. Their conserved c‐di‐GMP‐binding motifs, RXXXR and [D/N]hSXXG (h indicates a hydrophobic amino acid residue), were found (Fig EV4). With both the bacterial two‐hybrid (Fig 4D) and β‐galactosidase activity assays (Fig 4E), we found that only the protein encoded by D0Y83_08755 interacted with TsdA. The transcription of D0Y83_08755 was found to be upregulated after both the 36‐hour and 48‐hour cultivations, consistent with the expected expression patterns of dgc‐2902 and tsdA (Fig 4F). In addition, the results of the DRaCALA assay showed that the protein encoded by D0Y83_08755 could bind c‐di‐GMP (Fig 4G). Its ability to bind c‐di‐GMP decreased significantly when 11Arg was mutated to Asp, which is an amino acid determinative for c‐di‐GMP binding in the RXXXR motif. This was consistent with the characteristics of other known PilZ proteins (Ryjenkov et al, 2006; Fang et al, 2014). We subsequently named D0Y83_08755 as “mPilZ‐1753,” accordingly. Notably, when mPilZ‐1753 was overexpressed in strain 21‐3, the thiosulfate consumption was increased (Fig 4H), which suggested that the c‐di‐GMP receptor mPilZ‐1753 was able to enhance the activity of TsdA. Consistently, when the c‐di‐GMP producer DGC‐2902 was overexpressed in strain 21‐3, the higher intracellular c‐di‐GMP concentration and thiosulfate consumption were detected (Fig 4I). In contrast, after mutation of the 69Asp, the conserved phosphate accepting site in the REC domain of DGC‐2902, the lower c‐di‐GMP concentration and thiosulfate consumption were detected. It indicated that the TsdA's activity depended on c‐di‐GMP concentration. Combining with all results above, we considered that mPilZ‐1753 bound to the c‐di‐GMP and activated TsdA through interaction, which was similar to the mechanisms reported previously (Chin et al, 2012; Guzzo et al, 2013; Xu et al, 2016).
Figure EV4. Multiple sequence alignments of mPilZ‐1753 and other reported PilZ proteins.

The c‐di‐GMP‐binding motif RXXXR and [D/N]hSXXG and the conserved binding site were marked with asterisks. Sequence alignments with mPilZ‐1753 and other PilZ proteins were identified by MAFFT and R packages msa, ggmsa, Biostrings, ggseqlogo, and cowplot.
Two SoxB homologs collaborate with TsdA to drive ZVS production
SoxB was a key enzyme for the production of ZVS in E. flavus 21‐3 in our previous study (Zhang et al, 2020). Accordingly, based on our qRT–PCR analysis, the transcription of soxB (named soxB‐277 in this study) was significantly upregulated after illumination with blue light. This suggested that SoxB‐277 potentially played an important role in this pathway (Fig 4A). However, we also noticed the presence of ZVS with mutant ∆soxB‐277, when cultivated with 100 mM thiosulfate under blue light (Fig 4B). These differences from our previous results suggested that E. flavus 21‐3 might also use other SoxB homologs for ZVS production in response to blue light.
In our previous study, we identified another two SoxB homologs, including SoxB‐285 and SoxB‐291, in E. flavus 21‐3 (Zhang et al, 2020). To verify their roles in ZVS production, we deleted SoxB‐encoding genes respectively or pairwise. Using the Raman spectroscopy, we found that ZVS was only absent when both soxB‐277 and soxB‐285 were deleted (Fig 5A and B). But we found that mutant ∆soxB‐277 and mutant ∆soxB‐285 could still produce ZVS. Therefore, soxB‐277 and soxB‐285 are key genes that drive ZVS production in response to blue light, and they can be substituted for each other.
Figure 5. Thiosulfohydrolases (SoxB‐277 and SoxB‐285) coordinate with thiosulfate dehydrogenase (TsdA) to drive the production of ZVS in E. flavus 21‐3 when illuminated with blue light.

- The ZVS light white zone was present when E. flavus 21‐3 mutants ΔsoxB‐277, ΔsoxB‐285, ΔsoxB‐291, ΔsoxB‐277&291, and ΔsoxB‐285&291 were cultivated with 100 mM sodium thiosulfate under blue light, but was not present with mutant strain ΔsoxB‐277&285.
- Raman spectroscopy was used to detect the presence of the ZVS produced by E. flavus 21‐3 mutants ΔsoxB‐277, ΔsoxB‐285, ΔsoxB‐291, ΔsoxB‐277&291, ΔsoxB‐285&291, and ΔsoxB‐277&285. The red arrows show the typical Raman peaks of S8 (the form of ZVS).
- The proposed blue light response and thiosulfate oxidation coupling pathway in E. flavus 21‐3. Following blue light stimulation, an increase of autophosphorylation occurs at the conserved His residue of the LOV histidine kinase LOV‐1477. A phosphate group (Pi) is then transferred to the conserved Asp residue of the response regulator, the diguanylate cyclase DGC‐2902. DGC‐2902 then releases c‐di‐GMP as an output response. Then, mPilZ‐1753 binds to c‐di‐GMP and activates thiosulfate dehydrogenase (TsdA) through interaction, resulting in more thiosulfates being converted to tetrathionates. The tetrathionates are then hydrolyzed by thiosulfohydrolases (SoxB‐277 and SoxB‐285), and ZVS was finally formed. The red arrows indicate that the intracellular c‐di‐GMP concentration and the activity of TsdA increase when E. flavus 21‐3 is stimulated by blue light.
According to the above results, and results from our previous study (Zhang et al, 2020), we have deduced the following pathway (Fig 5C). Following blue light stimulation, an increase in autophosphorylation occurs at the conserved His residue of LOV‐1477. A phosphate group is then transferred to the conserved Asp residue of the response regulator, DGC‐2902. DGC‐2902 then releases c‐di‐GMP as an output response. Then, mPilZ‐1753 binds to c‐di‐GMP and activates TsdA through interaction, resulting in more thiosulfates being converted to tetrathionates. The tetrathionates are then hydrolyzed by SoxB‐277 and SoxB‐285, resulting in a release of sulfate and H+, which decreases the environmental pH. The remaining sulfur atoms then either attach to membrane‐bound thiol groups or are added to other polysulfide species. The polysulfides (polythionates) then become unstable under acidic conditions and are partly converted to stable ZVS, in the form of cyclooctasulfur S8. Finally, ZVS is produced.
Discussion
In this study, we found that E. flavus 21‐3 generated more ZVS when cultivated with thiosulfate under blue light. The response to blue light was mediated by a light–oxygen–voltage histidine kinase (LOV‐1477), a diguanylate cyclase (DGC‐2902), a protein‐containing PilZ domain (mPilZ‐1753), and three key proteins in the thiosulfate oxidation pathway (TsdA, SoxB‐277, SoxB‐285). These findings provide novel insights into how bacteria regulate sulfur metabolism following exposure to light. Interestingly, E. flavus 21‐3 was isolated from a deep‐sea cold seep in the South China Sea. Previously, light in the deep sea was thought to be rare, and it was firmly believed that the deep sea had a typical, chemical ecosystem, independent of light. Here, we discuss why a pathway that responds to blue light has been preserved in E. flavus 21‐3—a bacterium that lives in the deep sea.
Firstly, we ask, “Does light exist in the deep sea?”. The answer is, yes. Increasing evidence now shows that light does exist in a diverse range of deep‐sea environments. There are two main sources of light in the deep sea: downwelling light and bioluminescence. Downwelling light is produced by the sun and stars, and then reflected and scattered by the moon and sky. But in the deep sea (from around depths of 800–1,000 m), the downwelling light diminishes and cannot be detected by deep‐sea organisms (Herring et al, 1990). The main source of light in the deep sea is from bioluminescence—produced and emitted by living organisms to find mates, escape predators, or attract prey (Haddock et al, 2010). Bioluminescence occurs following the oxidation of a light‐emitting molecule (luciferin) by an enzyme catalyst (a luciferase or photoprotein) (Haddock et al, 2010; Wong et al, 2015). Many benthic organisms are capable of emitting light, including Octocorallia and Holothuroidea, among others (Martini et al, 2019). Their light emission occurs between 460 and 520 nm, which is within the blue–green spectrum of light (Widder & Falls, 2014; Wong et al, 2015). In addition to animals, some bacteria that form obligate symbiotic relationships with deep‐sea organisms can also emit bioluminescence. They exist in specialized light organs, such as the modified dorsal fins of the anglerfish (Baker et al, 2019). These bacteria also emit blue–green light (~490 nm) (Brodl et al, 2018). Therefore, light, particularly blue and green light, is indeed present in the deep sea.
Secondly, we ask, “Can deep‐sea microorganisms sense blue light in the deep sea?”. To test this, we cultivated E. flavus 21‐3 in situ in a deep‐sea cold seep, where it had been isolated from. The test groups were kept in transparent boxes to allow light to pass through, and the control groups were kept in the dark. We found the former generated a little more ZVS than the latter (Fig EV5A). This suggests that E. flavus 21‐3 might sense and use light to produce ZVS in the deep‐sea cold seep. In addition to E. flavus 21‐3, an increasing number of other deep‐sea bacteria have been found to sense and use blue light to regulate their metabolisms. For example, Spongiibacter nanhainus was isolated from a deep‐sea cold seep and was found to sense blue light through the sensor protein for blue light using the FAD (BLUF) (Shan et al, 2022). Similarly, Idiomarina loihiensis was isolated from a deep‐sea hydrothermal vent and was found to have the blue light receptor, photoactive yellow protein (PYP), in its genome (van der Horst et al, 2009). Idiomarina loihiensis was also found to regulate the formation of biofilm by using PYP when exposed to blue light. Therefore, we believe that some deep‐sea bacteria can sense blue light in the deep sea.
Figure EV5. The in‐situ ZVS production and metabolism of E. flavus 21‐3 when cultivated in the deep‐sea light and dark conditions.

- Comparison of the ZVS concentration of E. flavus 21‐3 when cultivated in transparent boxes allowing light to pass through and dark boxes in the deep‐sea cold seep. Data are presented as mean ± SD (N = 3 biological replicates), and Student's t‐test was performed. The P‐value for the Student's t‐test is presented.
- Comparison of the level and the number of expressed proteins in E. flavus 21‐3 in different COG categories, when this strain was cultivated in the deep‐sea cold seep for 10 days or in the laboratory with 100 mM thiosulfate under light and dark conditions. Detailed information is described in Appendix Table S1.
Source data are available online for this figure.
Finally, we ask, “Why do deep‐sea bacteria possess these sensors and what is the biological significance of this?”. E. flavus 21‐3 might use the ZVS it generated to increase its chances of survival (Cai et al, 2022). When the blue light is present, more ZVS is produced, and energy production and conversion in E. flavus 21‐3 are increased; we observed this both in the laboratory and at the in situ site (Fig EV5B, Appendix Table S1). Therefore, we have inferred that the ZVS produced in response to blue light is a survival strategy used by E. flavus 21‐3 to adapt to the deep‐sea environment. This pathway might enable E. flavus 21‐3 to generate more ZVS and store food/energy whenever an organism that emits blue light is encountered in the deep sea. Similarly, we have deduced that other blue‐light‐sensing bacteria might also use their sensors for functions that enable them to better adapt or survive in the deep sea.
In summary, we have demonstrated that blue light stimulates the formation of ZVS in the deep‐sea bacterium E. flavus 21‐3. These findings are a good addition to those from previous studies, which showed deep‐sea bacteria could sense light but without any functional evidence. Future efforts to develop special equipment that can detect light and ZVS in the deep‐sea environment will be required to verify our discoveries.
Materials and Methods
Bacterial strains and cultivation conditions
Escherichia coli strains for vector construction were grown in Luria–Bertani broth (LB) at 37°C. E. flavus 21‐3 and its mutant strains were cultivated in 2216E broth (0.5% tryptone and 0.1% yeast extract in artificial seawater (ASW)) at 30°C. The ASW contained: 24.47 g NaCl, 3.917 g Na2SO4, 0.664 g KCl, 0.024 g SrCl, 4.981 g MgCl·6H2O, 1.102 g CaCl2, 0.192 g NaHCO3, 0.026 g H3BO4, and 0.0039 g NaF per 1 l of Milli‐Q water. The pH was adjusted to 7.2–7.5 using 1 M NaOH. Cell cultures of E. flavus 21‐3 exhibited high turbidity after forming ZVS, which significantly affected the accuracy of the OD600 values used to monitor bacterial growth. We thus determined the growth status of E. flavus 21‐3 grown in the ZVS‐containing medium using the colony formation unit (CFU) results. Briefly, the culture was diluted gradually, spread on the 2216E plate, and the number of colonies was then counted after 3‐day cultivation.
To determine whether E. flavus 21‐3 senses light in deep‐sea environments, we cultivated strains in a deep‐sea cold seep, in situ, where E. flavus 21‐3 was isolated from. For this purpose, 50 ml E. flavus 21‐3 culture (OD600 ≈ 0.1) was harvested by centrifugation at 1,000 × g for 10 min and then washed three times in ASW. Washed cells were then transferred to 50 ml ASW in dialysis tubes, which allowed the exchanging of ions in the cold seep. The dialysis tubes were then fixed into three transparent boxes and three dark boxes. Finally, bacterial cells were cultivated in the cold seep of the South China Sea for 10 days using the remotely operated vehicle (ROV) of RV KEXUE, as previously described (Zheng et al, 2021).
All strains, plasmids, and primers used in this study are listed in Appendix Tables S2 and S3. When required, antibiotics were added at the following concentrations: ampicillin, 50 μg ml−1; chloramphenicol, 25 μg ml−1; kanamycin, 50 μg ml−1; streptomycin, 25 μg ml−1; and gentamicin, 20 μg ml−1.
Determining the amount of ZVS and thiosulfate in the bacterial cultures
The confocal Raman micro‐spectroscope (WITec alpha300 R system; WITec Company, Germany) was used to identify the amount of ZVS produced by E. flavus 21‐3. To determine the concentration of ZVS produced by E. flavus 21‐3 and mutants, bacterial cultures were grown at 30°C in 2216E broth, supplemented with 100 mM sodium thiosulfate. ZVS was then extracted from the culture using trichloromethane, using a previously described method (Boulegue, 1978; Gagnon et al, 1996). Using 5 ml of trichloromethane, 2 ml of the sample was then extracted, twice. The extracts were then measured using a UV–Vis spectrometer (Infinite M1000 Pro; Tecan, Männedorf, Switzerland) at 270 nm. To determine the concentration of ZVS generated by the E. flavus 21‐3 strains exposed to different wavelengths of light, bacterial cells were cultivated in 2216E broth supplemented with 100 mM sodium thiosulfate for 3 days under the illumination of different wavelengths of light or under dark conditions. The different light exposure conditions included white light (wavelengths of 400–760 nm [450 μmol m−2 s−1]), blue light (wavelengths of 465–470 nm [20 μmol m−2 s−1]), green light (wavelengths of 520–525 nm [90 μmol m−2 s−1]), red light (wavelengths of 620–625 nm [80 μmol m−2 s−1]), infrared light (wavelengths of 940 nm [5 μmol m−2 s−1]), and darkness. The concentration of thiosulfate was then determined by iodometric titration according to previous research (Asakai & Hioki, 2011).
Proteomic analysis
For the proteomic analyses, the performance of in situ cultivated E. flavus 21‐3 was described in our previous study (Cai et al, 2022). In this study, E. flavus 21‐3 was cultivated in 50 ml 2216E broth with 100 mM sodium thiosulfate under blue light and dark conditions. Cells were harvested after 48 or 72 h by centrifugation at 5,000 × g for 10 min at 4°C. Pellets were then washed with 10 mM PBS (pH 7.4) and resuspended in a lysis buffer (8 M urea and 1% protease inhibitor). The resuspension was then sonicated and the remaining debris was removed by centrifugation at 10,000 × g for 10 min at 4°C. The concentration of the protein was then determined using a BCA kit (Solarbio, China) after the supernatant had been collected.
To digest proteins, 5 mM dithiothreitol was used to reduce the sample to 65°C for 30 min, and 11 mM iodoacetamide was used to alkylate it at room temperature for 15 min in darkness. Then, 100 mM tetraethylammonium bromide (TEAB) was used to dilute the protein sample until its urea concentration was less than 2 M. For the first digestion, trypsin was finally added into the sample at 1:50 trypsin‐to‐protein mass ratio and 1:100 trypsin‐to‐protein mass for a second 4‐hour digestion. After digestion, the Strata X C18 SPE column (Phenomenex, USA) was used to desalt the sample. After vacuum drying, the peptide was reconstituted in 0.5 M TEAB and processed based on the TMT kit protocol.
The tryptic peptides were fractionated using high‐pH reverse‐phase HPLC using Agilent 300Extend C18 column (4.6 mm ID, 5 μm particles, and 250 mm length). Then, the peptides were combined into 18 fractions and vacuum dried. Tryptic peptides were dissolved in 0.1% formic acid and loaded onto a homemade reversed‐phase analytical column (75 μm i.d., 15 cm length). The gradient was comprised of an increase from 6 to 23% solution B (0.1% formic acid in 98% acetonitrile) in more than 26 min, 23–35% in 8 min, and climbing to 80% in 3 min, then holding at 80% for 3 min, all at a constant flow rate of 0.5 ml min−1 on an EASY‐nLC 1000 UPLC system.
The peptides were subjected to NSI source using tandem mass spectrometry in Q Exactive™ Plus (Thermo Fisher Scientific, USA) coupling online to the UPLC. The electrospray voltage applied was 2.0 Kv. The m/z scan range was 350–1,800 for the full scan, and intact peptides were detected in the Orbitrap at a resolution of 70,000. NCE was used to select for MS/MS set as 28. Then, the fragments were detected in the Orbitrap at a resolution of 17,500. The data‐dependent procedure alternated between 1 MS scan followed by 20 MS/MS scans with 15.0 s dynamic exclusion. Automatic gain control (AGC) was set at 5E4. The fixed first mass was set as 100 m/z.
Maxquant search engine was used to process the resulting MS/MS data. Tandem mass spectra were searched against the NCBI database concatenated with the reverse decoy database. Trypsin/P was specified as cleavage enzyme allowing up to two missing cleavages. In the first search and main search, the mass tolerance for precursor ions was set as 20 and 5 ppm, respectively. The mass tolerance for fragment ions was set as 0.02 Da. Carbamidomethyl on Cys was specified as a fixed modification and oxidation on Met was specified as variable modification. FDR was adjusted to < 1% and the minimum score for peptides was set to 40.
The peptides sequences were annotated using KEGG (Release 103.0), Pfam (v35.0), COG (v2020), and Uniprot (Kanehisa et al, 2016; Galperin et al, 2021; Mistry et al, 2021). The cut‐off was set as 1e‐20. Protein domains were predicted by NCBI batch web CD‐Search Tool (v2020) and further confirmed by the specific Pfam model using HMMer (Mistry et al, 2013; Lu et al, 2020).
Protein structure prediction and annotation
To predict the structures of LOV‐1477 and LOV‐1647, alphafold2 and DSSP were used with the default parameters (Kabsch & Sander, 1983; Joosten et al, 2011; Mirdita et al, 2022). To search for proteins containing blue light sensor domains, REC domains, GGDEF domains, and PilZ domains, NCBI conserved domain searches and HMM searches were used (Mistry et al, 2013; Lu et al, 2020). When performing HMM searches, the Pfam and TIGRfam databases were used to search for target proteins (Haft et al, 2003; Mistry et al, 2021). The motifs and conserved amino acids were then confirmed by aligning multiple sequences against known sequences, using MAFFT (Rozewicki et al, 2019). Finally, these results were presented using R packages msa, ggmsa, Biostrings, ggseqlogo, and cowplot (Bodenhofer et al, 2015; Wagih, 2017; Zhou et al, 2022).
Quantitative real‐time PCR (qRT–PCR)
To determine the transcription of genes in E. flavus 21‐3, bacterial cells were harvested by centrifugation at 5,000 × g for 10 min at 4°C. Total RNAs from each sample were extracted using the reagent, Trizol (Solarbio, China). The concentration of RNAs was then determined by Spectrophotometer (NanoPhotometer® NP80, Implen, Germany). RNAs were reverse transcribed into cDNA using ReverTra Ace™ qPCR RT Master Mix with gDNA Remover (TOYOBO, Japan). Transcription of the genes was then determined by qRT–PCR using the QuantStudio™ 6 Flex (Thermo Fisher Scientific, USA) and SYBR® Green Realtime PCR Master Mix (TOYOBO, Japan). The PCR program was set as follows: 95°C for 1 min, followed by 40 cycles of denaturation at 95°C for 15 s, annealing at 52°C for 15 s, and extension at 72°C for 15 s. The 16S rRNA was used as an internal reference. The relative gene expression was then calculated using the 2−ΔΔCt method and was normalized to that of 16S rRNA.
Expression, purification, and characterization of LOV‐1477 and LOV‐1647
LOV‐1477 and LOV‐1647 were expressed as GST‐tagged fusion proteins in E. coli BL21(DE3) and then purified using an immobilized glutathione Sepharose column (GE, GSTrap FF, USA). Both samples were dialyzed in a GST‐A buffer (20 mM HEPES, 300 mM KCl, 1 mM DTT, and 10% glycerin, pH 7.5) with 60 μM FMN, and kept in the dark overnight. Illumination was achieved using a 6 W blue‐light‐emitting high‐power LED (emitting wavelengths between 465 and 470 nm [20 μmol m−2 s−1]) mounted on the top of the cuvette. The spectral changes of LOV‐1477 and LOV‐1647 illuminated with blue light for specific intervals of time were recorded by UV/Vis scan. When their spectra stopped changing, they were kept in the dark and the absorbance was recorded at 450 nm at specific intervals of time.
Construction of gene deletion mutants of E. flavus 21‐3
To delete genes lov‐1477, lov‐1647, soxB‐277, soxB‐285, and soxB‐291 from the genome of E. flavus 21‐3, the upstream and downstream flanking regions of the corresponding genes were amplified using the primers listed in Appendix Table S3. The PCR products were purified, combined, and used as templates for an overlap extension PCR. The PCR products were then purified, digested, and inserted into the suicide vector, pEX‐18GM, using the restriction sites described in Appendix Table S2. The resulting vector was then transformed sequentially into E. coli SY327 and E. coli S17‐1. Bacterial conjugation between the E. flavus 21‐3 strain and the E. coli S17‐1 strain containing the resulting vector was then performed by culturing in 2216E broth at 28°C for 3 days. They were then resuspended and resuscitated with 2216E broth for 2 h at 28°C, 150 rpm. The cultivated strains were screened on a 2216E agar plate supplemented with 25 μg ml−1 gentamicin and ampicillin. After 5‐day cultivation, the selected strains were cultured in 2216E broth for 48 h and were selected again on the 2216E agar plate supplemented with 10% sucrose. Putative mutants were checked using primers listed in Appendix Table S3.
Bacterial two‐hybrid assay
The two‐hybrid system used T25 and T18 fragments, which are complementary fragments of the adenylate cyclase (CyaA) catalytic domain. The two proteins of interest were fused to the T25 and T18 fragments and then co‐expressed in a bacterial strain that lacked CyaA, E. coli BTH101. When these two proteins interact, it will result in the functional complementation between T25 and T18. This activates the CyaA and results in the production of cAMP. The cAMP then binds to the catabolite activator protein, CAP, leading to the formation of the pleiotropic regulator cAMP/CAP complex. In E. coli BTH101, expression of the lacZ gene, which encodes beta‐galactosidase, is then positively controlled by the cAMP/CAP complex. The functional complementation mediated by the interactions between two proteins can then be quantified by measuring the level of beta‐galactosidase activity. The cAMP/CAP complex can also activate the transcription of maltose genes in E. coli BTH101. Maltose ferments, which results in red colonies upon the acidification of the maltose/phenol red indicator plate (MacConkey medium). For the bacterial adenylate cyclase two‐hybrid assays, recombinant pKNT25 and pCH363 carrying the detected genes were used in various combinations to co‐transform into BTH101 cells. The transformed cells were then incubated at 30°C with shaking at 150 rpm for 6 h. After this, 2 μl of the culture was plated onto LB‐X‐gal‐IPTG medium (1% NaCl, 1% tryptone, 0.5% yeast extract, 1.5% agar, 0.5 mM IPTG, 40 μg ml−1 X‐gal, and 50 μg ml−1 streptomycin) and MacConkey medium (4% MacConkey agar, 0.5 mM IPTG, 50 μg ml−1 streptomycin, and 1% maltose), and then incubated at 30°C for 48 h. Efficiencies of the interactions between different hybrid proteins were then quantified by measuring the β‐galactosidase activity in the liquid cultures. Before the assay, an optical density of 600 nm was recorded. Cells from 2 ml of culture were collected by centrifuging at 4°C, 10,000 × g for 1 min. Cells were then resuspended using 1 ml PBS (containing 3.3 μl β‐mercaptoethanol). Four hundred microliters of the suspension and 600 μl PBS (containing 3.3 μl β‐mercaptoethanol) were then transferred to a clean tube. Then, 100 μl trichloromethane and 50 μl 0.1% SDS buffer were added and vortexed for 10 s. Next, 200 μl 4 mg ml−1 ortho‐nitrophenyl‐β‐galactoside (ONPG) was added, which initiated the reaction at 28°C. When the solution turned a pale‐yellow color, or the reaction was maintained for 5 min, 500 μl 1 M NaCO3 was added to stop the reaction, and the Abs420 nm was then measured. The enzymatic activity (A) was measured in units per milliliter and was calculated according to the following equation: A = 200 × ((OD420 nm of the solution − OD420 nm of the control tube)/minutes of incubation) × dilution factor.
Determination of the concentration of c‐di‐GMP
Fifty milliliter of the bacterial cell culture was collected by centrifuging at 3,000 × g for 10 min. The supernatant was removed, and cells were resuspended with 40 ml PBS. The cells were sonicated, and the remaining debris was then removed by centrifuging at 10,000 × g for 10 min at 4°C. The supernatant was then used to determine the concentration of c‐di‐GMP using the c‐di‐GMP Elisa kit (Meimian, China; Cayman, USA).
Differential radial capillary action of ligand assay (DRaCALA)
LOV‐1477, LOV‐1647, mPilZ‐1753, YcgR, and their mutant proteins were overexpressed and purified as the method described above. And the TsdA was overexpressed and purified as the method reported previously (Zhang et al, 2020). As previously described (Roelofs et al, 2011; Fang et al, 2014), purified proteins were dialyzed in 50 mM Tris‐NaCl three times. The sample was then diluted to 10 μM using 50 mM Tris‐NaCl. Following this, 1 μl of 10 μM 2′‐fluo‐c‐di‐GMP was added to the 9 μl protein dilution, vortexed, and then left to react for 15 min in the dark. After this, 2 μl of the dilution was spotted onto a nitrocellulose membrane, and it was then allowed to air dry at room temperature in dark. This took approximately 5–10 min, depending on the humidity of the room. Finally, the samples were scanned for fluorescence (2′‐fluo‐c‐di‐GMP) using the Tanon‐5200SF scanner (λexc 470 nm, λemi 535 nm, China).
Author contributions
Ruining Cai: Conceptualization; investigation; methodology; writing – original draft; writing – review and editing. Wanying He: Methodology; writing – review and editing. Jing Zhang: Resources; writing – review and editing. Rui Liu: Methodology; writing – review and editing. Ziyu Yin: Methodology; writing – review and editing. Xin Zhang: Methodology; writing – review and editing. Chaomin Sun: Conceptualization; funding acquisition; project administration; writing – review and editing.
Disclosure and competing interests statement
The authors declare that they have no conflict of interest.
Supporting information
Appendix
Expanded View Figures PDF
Source Data for Expanded View
PDF+
Source Data for Figure 1
Source Data for Figure 2
Source Data for Figure 3
Source Data for Figure 4
Acknowledgements
We thank Professor Beile Gao from the South China Sea Institute of Oceanology, Chinese Academy of Sciences, for kindly providing bacterial two‐hybrid system. We also thank the Marine Science Data Center of Chinese Academy of Sciences, the Center for High Performance Computing and System Simulation of Pilot National Laboratory for Marine Science and Technology (Qingdao), and Demin Xu from the University of Science and Technology of China for their support in data analysis. We thank Dr. Diana Walsh from Life Science Editors for her great effort to improve the writing quality of our manuscript. This work was supported by the Science and Technology Innovation Project of Laoshan Laboratory (Grant No. LSKJ202203103), Shandong Provincial Natural Science Foundation (Grant No. ZR2021ZD28), the NSFC Innovative Group Grant (No. 42221005), Key Collaborative Research Program of the Alliance of International Science Organizations (Grant No. ANSO‐CR‐KP‐2022‐08), Strategic Priority Research Program of the Chinese Academy of Sciences (Grant No. XDA22050301), Major Research Plan of the National Natural Science Foundation (Grant No. 92051107), China Ocean Mineral Resources R&D Association Grant (Grant No. DY295‐B2‐14), and Key deployment projects of Center of Ocean Mega‐Science of the Chinese Academy of Sciences (Grant No. COMS2020Q04) for Chaomin Sun.
The EMBO Journal (2023) 42: e112514
See also: U Römling & A Möglich (June 2023)
Data availability
Genomic information: Genome of E. flavus 21‐3; GenBank CP032228 (https://www.ncbi.nlm.nih.gov/nuccore/CP032228.1/). Proteomics data: In situ proteomic data of E. flavus 21‐3 and corresponding mutants; PRIDE PXD029383 (https://www.ebi.ac.uk/pride/archive/projects/PXD029383). Proteomics data: Blue light promotes zero‐valent sulfur production in a deep‐sea bacterium; PRIDE PXD035435 (http://www.ebi.ac.uk/pride/archive/projects/PXD035435).
References
- Aharon P, Fu BS (2003) Sulfur and oxygen isotopes of coeval sulfate‐sulfide in pore fluids of cold seep sediments with sharp redox gradients. Chem Geol 195: 201–218 [Google Scholar]
- Asakai T, Hioki A (2011) Investigation of iodine liberation process in redox titration of potassium iodate with sodium thiosulfate. Anal Chim Acta 689: 34–38 [DOI] [PubMed] [Google Scholar]
- Baker LJ, Freed LL, Easson CG, Lopez JV, Fenolio D, Sutton TT, Nyholm SV, Hendry TA (2019) Diverse deep‐sea anglerfishes share a genetically reduced luminous symbiont that is acquired from the environment. Elife 8: e47606 [DOI] [PMC free article] [PubMed] [Google Scholar]
- Berg JS, Schwedt A, Kreutzmann AC, Kuypers MMM, Milucka J (2014) Polysulfides as intermediates in the oxidation of sulfide to sulfate by Beggiatoa spp. Appl Environ Microbiol 80: 629–636 [DOI] [PMC free article] [PubMed] [Google Scholar]
- Bodenhofer U, Bonatesta E, Horejs‐Kainrath C, Hochreiter S (2015) msa: an R package for multiple sequence alignment. Bioinformatics 31: 3997–3999 [DOI] [PubMed] [Google Scholar]
- Boulegue J (1978) Solubility of elemental sulfur in water at 298‐K. Phosphorus Sulfur Relat Elem 5: 127–128 [Google Scholar]
- Brodl E, Winkler A, Macheroux P (2018) Molecular mechanisms of bacterial bioluminescence. Comput Struct Biotechnol J 16: 551–564 [DOI] [PMC free article] [PubMed] [Google Scholar]
- Cai RN, He WY, Liu R, Zhang J, Zhang X, Sun CM (2022) Deep‐sea in situ insights into the formation of zero‐valent sulfur driven by a bacterial thiosulfate oxidation pathway. mBio 13: e0014322 [DOI] [PMC free article] [PubMed] [Google Scholar]
- Chin K‐H, Kuo W‐T, Yu Y‐J, Liao Y‐T, Yang M‐T, Chou S‐H (2012) Structural polymorphism of c‐di‐GMP bound to an EAL domain and in complex with a type II PilZ‐domain protein. Acta Crystallogr D Biol Crystallogr 68: 1380–1392 [DOI] [PubMed] [Google Scholar]
- Chou SH, Galperin MY (2016) Diversity of cyclic di‐GMP‐binding proteins and mechanisms. J Bacteriol 198: 32–46 [DOI] [PMC free article] [PubMed] [Google Scholar]
- Christie JM, Reymond P, Powell GK, Bernasconi P, Raibekas AA, Liscum E, Briggs WR (1998) Arabidopsis NPH1: a flavoprotein with the properties of a photoreceptor for phototropism. Science 282: 1698–1701 [DOI] [PubMed] [Google Scholar]
- Christie JM, Salomon M, Nozue K, Wada M, Briggs WR (1999) LOV (light, oxygen, or voltage) domains of the blue‐light photoreceptor phototropin (nph1): binding sites for the chromophore flavin mononucleotide. Proc Natl Acad Sci USA 96: 8779–8783 [DOI] [PMC free article] [PubMed] [Google Scholar]
- Cogdell RJ, Isaacs NW, Howard TD, McLuskey K, Fraser NJ, Prince SM (1999) How photosynthetic bacteria harvest solar energy. J Bacteriol 181: 3869–3879 [DOI] [PMC free article] [PubMed] [Google Scholar]
- Crosson S, Moffat K (2001) Structure of a flavin‐binding plant photoreceptor domain: insights into light‐mediated signal transduction. Proc Natl Acad Sci USA 98: 2995–3000 [DOI] [PMC free article] [PubMed] [Google Scholar]
- Davis SJ, Vener AV, Vierstra RD (1999) Bacteriophytochromes: phytochrome‐like photoreceptors from nonphotosynthetic eubacteria. Science 286: 2517–2520 [DOI] [PubMed] [Google Scholar]
- Elias‐Arnanz M, Padmanabhan S, Murillo FJ (2011) Light‐dependent gene regulation in non‐phototrophic bacteria. Curr Opin Microbiol 14: 128–135 [DOI] [PubMed] [Google Scholar]
- El‐Mowafy M, Bahgat MM, Bilitewski U (2013) Deletion of the HAMP domains from the histidine kinase CaNik1p of Candida albicans or treatment with fungicides activates the MAP kinase Hog1p in S. cerevisiae transformants. BMC Microbiol 13: 209 [DOI] [PMC free article] [PubMed] [Google Scholar]
- Fang X, Ahmad I, Blanka A, Schottkowski M, Cimdins A, Galperin MY, Romling U, Gomelsky M (2014) GIL, a new c‐di‐GMP‐binding protein domain involved in regulation of cellulose synthesis in enterobacteria . Mol Microbiol 93: 439–452 [DOI] [PMC free article] [PubMed] [Google Scholar]
- Franz B, Gehrke T, Lichtenberg H, Hormes J, Dahl C, Prange A (2009) Unexpected extracellular and intracellular sulfur species during growth of Allochromatium vinosum with reduced sulfur compounds. Microbiol 155: 2766–2774 [DOI] [PubMed] [Google Scholar]
- Frigaard NU, Dahl C (2009) Sulfur metabolism in phototrophic sulfur bacteria. Adv Microb Physiol 54: 103–200 [DOI] [PubMed] [Google Scholar]
- Gagnon C, Mucci A, Pelletier E (1996) Vertical distribution of dissolved sulphur species in coastal marine sediments. Mar Chem 52: 195–209 [Google Scholar]
- Galperin MY, Wolf YI, Makarova KS, Alvarez RV, Landsman D, Koonin EV (2021) COG database update: focus on microbial diversity, model organisms, and widespread pathogens. Nucleic Acids Res 49: D274–D281 [DOI] [PMC free article] [PubMed] [Google Scholar]
- Gao R, Stock AM (2009) Biological insights from structures of two‐component proteins. Annu Rev Microbiol 63: 133–154 [DOI] [PMC free article] [PubMed] [Google Scholar]
- Glantz ST, Carpenter EJ, Melkonian M, Gardner KH, Boyden ES, Wong GKS, Chow BY (2016) Functional and topological diversity of LOV domain photoreceptors. Proc Natl Acad Sci USA 113: E1442–E1451 [DOI] [PMC free article] [PubMed] [Google Scholar]
- Gomelsky M, Hoff WD (2011) Light helps bacteria make important lifestyle decisions. Trends Microbiol 19: 441–448 [DOI] [PubMed] [Google Scholar]
- Gomelsky M, Klug G (2002) BLUF: a novel FAD‐binding domain involved in sensory transduction in microorganisms. Trends Biochem Sci 27: 497–500 [DOI] [PubMed] [Google Scholar]
- Gregersen LH, Bryant DA, Frigaard NU (2011) Mechanisms and evolution of oxidative sulfur metabolism in green sulfur bacteria. Front Microbiol 2: 116 [DOI] [PMC free article] [PubMed] [Google Scholar]
- Griffin BM, Schott J, Schink B (2007) Nitrite, an electron donor for anoxygenic photosynthesis. Science 316: 1870 [DOI] [PubMed] [Google Scholar]
- Guzzo CR, Dunger G, Salinas RK, Farah CS (2013) Structure of the PilZ–FimXEAL–c‐di‐GMP complex responsible for the regulation of bacterial type IV pilus biogenesis. J Mol Biol 425: 2174–2197 [DOI] [PubMed] [Google Scholar]
- Haddock SHD, Moline MA, Case JF (2010) Bioluminescence in the sea. Ann Rev Mar Sci 2: 443–493 [DOI] [PubMed] [Google Scholar]
- Haft DH, Selengut JD, White O (2003) The TIGRFAMs database of protein families. Nucleic Acids Res 31: 371–373 [DOI] [PMC free article] [PubMed] [Google Scholar]
- Herring PJ, Marine Biological Association of the United Kingdom , Campbell AK, Whitfield M, Maddock L (1990) Light and life in the sea. Cambridge, UK: Cambridge University Press; [Google Scholar]
- Herrou J, Crosson S (2011) Function, structure and mechanism of bacterial photosensory LOV proteins. Nat Rev Microbiol 9: 713–723 [DOI] [PMC free article] [PubMed] [Google Scholar]
- Hoeft SE, Blum JS, Stolz JF, Tabita FR, Witte B, King GM, Santini JM, Oremland RS (2007) Alkalilimnicola ehrlichii sp. nov., a novel, arsenite‐oxidizing haloalkaliphilic gammaproteobacterium capable of chemoautotrophic or heterotrophic growth with nitrate or oxygen as the electron acceptor. Int J Syst Evol Microbiol 57: 504–512 [DOI] [PubMed] [Google Scholar]
- Howard EC, Henriksen JR, Buchan A, Reisch CR, Buergmann H, Welsh R, Ye WY, Gonzalez JM, Mace K, Joye SB et al (2006) Bacterial taxa that limit sulfur flux from the ocean. Science 314: 649–652 [DOI] [PubMed] [Google Scholar]
- Idi A, Nor MHM, Wahab MFA, Ibrahim Z (2015) Photosynthetic bacteria: an eco‐friendly and cheap tool for bioremediation. Rev Environ Sci Biotechnol 14: 271–285 [Google Scholar]
- Joosten RP, Beek TAHT, Krieger E, Hekkelman ML, Hooft RWW, Schneider R, Sander C, Vriend G (2011) A series of PDB related databases for everyday needs. Nucleic Acids Res 39: D411–D419 [DOI] [PMC free article] [PubMed] [Google Scholar]
- Jung KH, Trivedi VD, Spudich JL (2003) Demonstration of a sensory rhodopsin in eubacteria. Mol Microbiol 47: 1513–1522 [DOI] [PubMed] [Google Scholar]
- Kabsch W, Sander C (1983) Dictionary of protein secondary structure‐pattern‐recognition of hydrogen‐bonded and geometrical features. Biopolymers 22: 2577–2637 [DOI] [PubMed] [Google Scholar]
- Kanehisa M, Sato Y, Morishima K (2016) BlastKOALA and GhostKOALA: KEGG tools for functional characterization of genome and metagenome sequences. J Mol Biol 428: 726–731 [DOI] [PubMed] [Google Scholar]
- Krauss U, Minh BQ, Losi A, Gartner W, Eggert T, von Haeseler A, Jaeger KE (2009) Distribution and phylogeny of light‐oxygen‐voltage‐blue‐light‐signaling proteins in the three kingdoms of life. J Bacteriol 191: 7234–7242 [DOI] [PMC free article] [PubMed] [Google Scholar]
- Liu G, Shan YQ, Zheng RK, Liu R, Sun CM (2021) Growth promotion of a deep‐sea bacterium by sensing infrared light through a bacteriophytochrome photoreceptor. Environ Microbiol 23: 4466–4477 [DOI] [PubMed] [Google Scholar]
- Lu SN, Wang JY, Chitsaz F, Derbyshire MK, Geer RC, Gonzales NR, Gwadz M, Hurwitz DI, Marchler GH, Song JS et al (2020) CDD/SPARCLE: the conserved domain database in 2020. Nucleic Acids Res 48: D265–D268 [DOI] [PMC free article] [PubMed] [Google Scholar]
- MacGregor BJ (2016) Visualizing evolutionary relationships of multidomain proteins: an example from receiver (REC) domains of sensor histidine kinases in the Candidatus Maribeggiatoastr. Orange Guaymas draft genome. Front Microbiol 7: 1780 [DOI] [PMC free article] [PubMed] [Google Scholar]
- Maki JS (2013) Bacterial intracellular sulfur globules: structure and function. J Mol Microbiol Biotechnol 23: 270–280 [DOI] [PubMed] [Google Scholar]
- Marnocha CL, Levy AT, Powell DH, Hanson TE, Chan CS (2016) Mechanisms of extracellular S0 globule production and degradation in Chlorobaculum tepidum via dynamic cell globule interactions. Microbiology 162: 1125–1134 [DOI] [PMC free article] [PubMed] [Google Scholar]
- Martini S, Kuhnz L, Mallefet J, Haddock SHD (2019) Distribution and quantification of bioluminescence as an ecological trait in the deep sea benthos. Sci Rep 9: 14654 [DOI] [PMC free article] [PubMed] [Google Scholar]
- Mirdita M, Schutze K, Moriwaki Y, Heo L, Ovchinnikov S, Steinegger M (2022) ColabFold: making protein folding accessible to all. Nat Methods 19: 679–682 [DOI] [PMC free article] [PubMed] [Google Scholar]
- Mistry J, Finn RD, Eddy SR, Bateman A, Punta M (2013) Challenges in homology search: HMMER3 and convergent evolution of coiled‐coil regions. Nucleic Acids Res 41: e121 [DOI] [PMC free article] [PubMed] [Google Scholar]
- Mistry J, Chuguransky S, Williams L, Qureshi M, Salazar GA, Sonnhammer ELL, Tosatto SCE, Paladin L, Raj S, Richardson LJ et al (2021) Pfam: the protein families database in 2021. Nucleic Acids Res 49: D412–D419 [DOI] [PMC free article] [PubMed] [Google Scholar]
- Pellequer JL, Wager‐Smith KA, Kay SA, Getzoff ED (1998) Photoactive yellow protein: a structural prototype for the three‐dimensional fold of the PAS domain superfamily. Proc Natl Acad Sci USA 95: 5884–5890 [DOI] [PMC free article] [PubMed] [Google Scholar]
- Prange A, Engelhardt H, Truper HG, Dahl C (2004) The role of the sulfur globule proteins of Allochromatium vinosum: mutagenesis of the sulfur globule protein genes and expression studies by real‐time RT‐PCR. Arch Microbiol 182: 165–174 [DOI] [PubMed] [Google Scholar]
- Purcell EB, Siegal‐Gaskins D, Rawling DC, Fiebig A, Crosson S (2007) A photosensory two‐component system regulates bacterial cell attachment. Proc Natl Acad Sci USA 104: 18241–18246 [DOI] [PMC free article] [PubMed] [Google Scholar]
- Rivera‐Cancel G, Ko W‐H, Tomchick DR, Correa F, Gardner KH (2014) Full‐length structure of a monomeric histidine kinase reveals basis for sensory regulation. Proc Natl Acad Sci USA 111: 17839–17844 [DOI] [PMC free article] [PubMed] [Google Scholar]
- Roelofs KG, Wang JX, Sintim HO, Lee VT (2011) Differential radial capillary action of ligand assay for high‐throughput detection of protein‐metabolite interactions. Proc Natl Acad Sci USA 108: 15528–15533 [DOI] [PMC free article] [PubMed] [Google Scholar]
- Rozewicki J, Li SL, Amada KM, Standley DM, Katoh K (2019) MAFFT‐DASH: integrated protein sequence and structural alignment. Nucleic Acids Res 47: W5–W10 [DOI] [PMC free article] [PubMed] [Google Scholar]
- Ryan RP, Tolker‐Nielsen T, Dow JM (2012) When the PilZ don't work: effectors for cyclic di‐GMP action in bacteria. Trends Microbiol 20: 235–242 [DOI] [PubMed] [Google Scholar]
- Ryjenkov DA, Simm R, Romling U, Gomelsky M (2006) The PilZ domain is a receptor for the second messenger c‐di‐GMP ‐ the PilZ domain protein YcgR controls motility in enterobacteria. J Biol Chem 281: 30310–30314 [DOI] [PubMed] [Google Scholar]
- Shan YQ, Liu G, Cai RN, Liu R, Zheng RK, Sun CM (2022) A deep‐sea bacterium senses blue light via a BLUF‐dependent pathway. mSystems 7: e0127921 [DOI] [PMC free article] [PubMed] [Google Scholar]
- Simm R, Morr M, Kader A, Nimtz M, Romling U (2004) GGDEF and EAL domains inversely regulate cyclic di‐GMP levels and transition from sessility to motility. Mol Microbiol 53: 1123–1134 [DOI] [PubMed] [Google Scholar]
- Sirevag R, Ormerod JG (1970) Carbon dioxide fixation in photosynthetic green sulfur bacteria. Science 169: 186–188 [DOI] [PubMed] [Google Scholar]
- Steudel R (1996) Mechanism for the formation of elemental sulfur from aqueous sulfide in chemical and microbiological desulfurization processes. Ind Eng Chem Res 35: 1417–1423 [Google Scholar]
- Swartz TE, Corchnoy SB, Christie JM, Lewis JW, Szundi I, Briggs WR, Bogomolni RA (2001) The photocycle of a flavin‐binding domain of the blue light photoreceptor phototropin. J Biol Chem 276: 36493–36500 [DOI] [PubMed] [Google Scholar]
- Swartz TE, Tseng TS, Frederickson MA, Paris G, Comerci DJ, Rajashekara G, Kim JG, Mudgett MB, Splitter GA, Ugalde RA et al (2007) Blue‐light‐activated histidine kinases: two‐component sensors in bacteria. Science 317: 1090–1093 [DOI] [PubMed] [Google Scholar]
- Sycz G, Carrica MC, Tseng TS, Bogomolni RA, Briggs WR, Goldbaum FA, Paris G (2015) LOV histidine kinase modulates the general stress response system and affects the virB operon expression in Brucella abortus . PLoS One 10: e0124058 [DOI] [PMC free article] [PubMed] [Google Scholar]
- van der Horst MA, Key J, Hellingwerf KJ (2007) Photosensing in chemotrophic, non‐phototrophic bacteria: let there be light sensing too. Trends Microbiol 15: 554–562 [DOI] [PubMed] [Google Scholar]
- van der Horst MA, Stalcup TP, Kaledhonkar S, Kumauchi M, Hara M, Xie A, Hellingwerf KJ, Hoff WD (2009) Locked chromophore analogs reveal that photoactive yellow protein regulates biofilm formation in the deep sea bacterium Idiomarina loihiensis . J Am Chem Soc 131: 17443–17451 [DOI] [PubMed] [Google Scholar]
- Vila X, Guyoneaud R, Cristina XP, Figueras JB, Abella CA (2002) Green sulfur bacteria from hypersaline Chiprana Lake (Monegros, Spain): habitat description and phylogenetic relationship of isolated strains. Photosynth Res 71: 165–172 [DOI] [PubMed] [Google Scholar]
- Wagih O (2017) ggseqlogo: a versatile R package for drawing sequence logos. Bioinformatics 33: 3645–3647 [DOI] [PubMed] [Google Scholar]
- Wang X, Modak HV, Tabita FR (1993) Photolithoautotrophic growth and control of CO2 fixation in Rhodobacter sphaeroides and Rhodospirillum rubrum in the absence of ribulose‐bisphosphate carboxylase‐oxygenase. J Bacteriol 175: 7109–7114 [DOI] [PMC free article] [PubMed] [Google Scholar]
- Widder EA, Falls B (2014) Review of bioluminescence for engineers and scientists in biophotonics. IEEE J Sel Top Quantum Electron 20: 232–241 [Google Scholar]
- Wiltbank LB, Kehoe DM (2019) Diverse light responses of cyanobacteria mediated by phytochrome superfamily photoreceptors. Nat Rev Microbiol 17: 37–50 [DOI] [PubMed] [Google Scholar]
- Wong JM, Perez‐Moreno JL, Chan TY, Frank TM, Bracken‐Grissom HD (2015) Phylogenetic and transcriptomic analyses reveal the evolution of bioluminescence and light detection in marine deep‐sea shrimps of the family Oplophoridae (Crustacea: Decapoda). Mol Phylogenet Evol 83: 278–292 [DOI] [PubMed] [Google Scholar]
- Xu L, Venkataramani P, Ding Y, Liu Y, Deng Y, Yong GL, Xin L, Ye R, Zhang L, Yang L (2016) A cyclic di‐GMP‐binding adaptor protein interacts with histidine kinase to regulate two‐component signaling. J Biol Chem 291: 16112–16123 [DOI] [PMC free article] [PubMed] [Google Scholar]
- Zhang J, Liu R, Xi SC, Cai RN, Zhang X, Sun CM (2020) A novel bacterial thiosulfate oxidation pathway provides a new clue about the formation of zero‐valent sulfur in deep sea. ISME J 14: 2261–2274 [DOI] [PMC free article] [PubMed] [Google Scholar]
- Zheng RK, Liu R, Shan YQ, Cai RN, Liu G, Sun CM (2021) Characterization of the first cultured free‐living representative of Candidatus Izemoplasma uncovers its unique biology. ISME J 15: 2676–2691 [DOI] [PMC free article] [PubMed] [Google Scholar]
- Zhou L, Feng TZ, Xu SB, Gao FL, Lam TT, Wang QW, Wu TZ, Huang HN, Zhan L, Li L et al (2022) ggmsa: a visual exploration tool for multiple sequence alignment and associated data. Brief Bioinform 23: bbac222 [DOI] [PubMed] [Google Scholar]