Abstract
We report herein the first homogeneous assays based on the ribonuclease activity of a deoxyribozyme. The previously reported deoxyribozyme was covalently modified with biotin and used to assay biotin-binding interactions through changes in fluorescence upon substrate turnover. Deoxyribozymes with fluorescence-based reporting have the potential to serve as general analytical tools.
INTRODUCTION
The seminal discovery that nucleic acids can act as catalysts (1,2) sparked great interest that initially focused on their possible role in evolution as pre-protein catalysts and on their potential for the construction of new therapeutic agents (3,4). Nucleic acid oligomers are attractive reagents because they can be repeatedly selected for certain properties and then amplified (5,6). However, analytical applications of nucleic acid catalysts have lagged by comparison. A ligase reaction has been used to assay effector oligonucleotides and cofactors when coupled to RT–PCR (7). Also, ribozyme-based sensors for small molecules have been recently reported (8), but the read out was again based on gel autoradiography methodology. Ribozyme kinetics can be followed by double end-labeled substrates (9), but this strategy has not yet been incorporated into ribozyme-based assays.
In the present work we report the first deoxyribozyme-based homogeneous assays built on these precedents. We illustrate the capabilities of this approach through design of a novel modular deoxyribozyme rendered sensitive to allosteric inhibition by a receptor protein through incorporation of a specific ligand. Combined with recent progress in directed evolution and rational modular design of ribozymes (8), such oligonucleotide-based catalysts have potential to function as general fluorescent analytical tools with tailored specificity and sensitivity operating in homogeneous solutions.
MATERIALS AND METHODS
Materials
All oligonucleotides were custom made by Integrated DNA Technologies (Coralville, IA) and purified by HPLC, when larger then 10 bases. Samples were dissolved in RNase- and DNase-free water, separated into aliquots and frozen at –20°C until needed. The biotin-binding proteins neutravidin, avidin and ImmunoPure Immobilized Streptavidin were purchased from Pierce (Rockford, IL), biotin, streptavidin, anti-biotin monoclonal antibody from Sigma-Aldrich Co. (St Louis, MO) and monomeric avidin (Soft-Link Soft-Release Avidin Resin) from Promega (Madison, WI). All experiments were performed in autoclaved 50 mM HEPES buffer, 1 M NaCl, pH 7.5, at room temperature. MgCl2 was obtained from Aldrich and used as 200 mM autoclaved stock solutions in water.
Instrumental
All fluorescence spectra were obtained on a F-2000 fluorescence spectrophotometer (Hitachi Instruments, Inc., San Jose, CA) with a Hamamatsu xenon lamp. Experiments were performed at an excitation wavelength of 480 nm, emission scan 510–590 nm.
Procedures
General. Enzymes (E and 5B-E) and substrate (S) were diluted to the desired concentrations in HEPES buffer and mixed. Reactions were initiated after 10 min by addition of Mg2+. The total reaction volume ranged between 10 and 20 µl. Aliquots (1–2 µl) were diluted to 1 ml with HEPES buffer in a quartz microcuvette. After vigorous stirring with a pipette and vortex mixer, spectra were taken. Peak selection at the two maxima (519–522 or 569–575 nm) was performed automatically and these values were used in calculations of the Rn value (Rn = E520/E570).
Assays. Metal salts, E, 5-BE, S, effector oligonucleotides and proteins were serially diluted in DNase- and RNase-free water. Effector molecules were premixed with enzymes prior to the addition of substrate. Biotin-saturated buffer was used in controls to determine specificity of receptor–ligand interactions with modified enzyme 5B-E.
RESULTS AND DISCUSSION
Kinetic characterization of the parent system
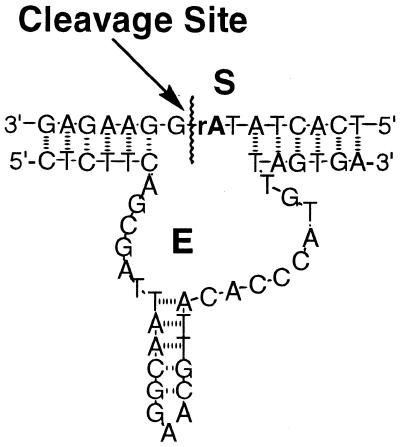
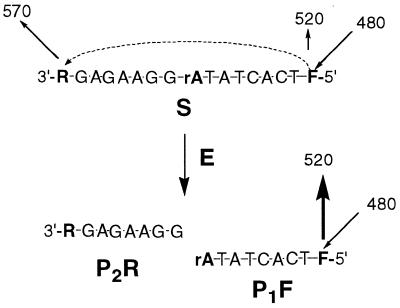
Although ribozymes have been extensively studied, we chose to use for our assays the more durable deoxyribozymes. We began with deoxyribozyme E (Fig. 1), which was reported (10) to cleave chimeric substrate S containing a single embeded ribonucleotide [kcat ∼ 0.01 min–1 at c(E) = 300 nM, Km = 15 µM]. The substrate was labeled for fluorescence resonance energy transfer reporting (FRET). FRET is commonly used to follow transformation of substrates by protein-based enzymes (11–13) and has recently been applied to kinetic characterization of the hammerhead ribozyme (9). Fluorescence emission from the reporting fluorescein donor F at the 5′-end of the substrate is partially quenched by the 3′-tetramethylrhodamine acceptor (R) (Fig. 2). After cleavage of S to yield products P1F and P2R, R would no longer quench emission from F. We estimated that fluorescence could rise by a maximum of 10-fold, based on comparison of fluorescence from S with equimolar amounts of products P1F and P2R. The ratio of fluorescence at 520 (F) and 570 nm (R) upon excitation at 480 nm yielded the so-called Rn value (11).
Figure 1.
Structures of deoxyribozyme (E) and chimeric substrate (S) with embedded single ribonucleotide (bold).
Figure 2.
Cleavage of S to yield product fragments containing rhodamine (P2R) and fluorescein (P1F) leading to increased fluorescein emission (larger arrow).
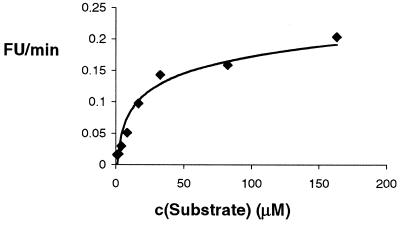
As expected, addition of 5′-F,3′-R dual-labeled substrate to the deoxyribozyme resulted in increasing fluorescence emission at 520 nm. At low substrate conversions (<10% reaction) the rate of increase in the fluorescence signal versus substrate concentration fits Michaelis–Menten kinetics (Fig. 3). Kinetic characterization of E (336 nM) with 5 mM Mg2+ and substrate (2–160 µM) yielded an apparent Km of 22 µM and an apparent Vmax of 0.2 (E520 – E570) min–1. Using a fluorescence versus [% product] calibration curve, a value for kcat (apparent) of ∼10–2 min–1 was obtained. These values were in good agreement with reported values derived from gel electrophoresis and autoradiography of product (10), indicating that, at least within the range of c(S) studied, there is little difference between the two methods.
Figure 3.
Rate [fluorescent units (FU)/min] versus c(S), c(E) = 336 nM.
We next sought to determine the lower limit of deoxyribozyme concentration that produced a detectable signal. This concentration defines the limit of analyte detection for assays based on the activation or deactivation of deoxyribozyme by effectors. At extended reaction times (∼1 day), E at c = 50 pM provided a detectable signal in a system incorporating 3 µM S in the presence of 7 mM MgCl2. This unexpected result implies a kcat 10-fold greater then that obtained with 330 nM E as above and, indeed, we found an inverse correlation between the turnover number and concentration of enzyme. Although detailed consideration of this observation is beyond the scope of this study, dimer formation of E is a possible explanation: the enzyme is capable of forming an E*E dimer as well as En*Sm concatamers with stability comparable to that of the E*S complex. In this manner, the enzyme at high concentrations could function as an inhibitor.
The lower limits of c(deoxyribozyme) can be reduced further by substitution of Mg with other divalent cations that can increase the deoxyribozyme turnover several-fold (10). Also, all-ribonucleotide substrates can result in substantially higher turnover numbers (14).
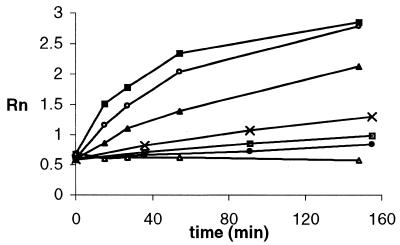
In order to report the concentrations of effector analytes the confounding effector Mg2+ must be controlled. As expected, in the presence of various concentrations of Mg2+ (0.5–30 mM), changes in Rn values for c(E) = 0.8 µM and c(S) = 16 µM over time showed the expected Mg2+ dependence (Fig. 4). In control reactions, where either Mg2+ or enzyme were omitted, the Rn value did not change significantly. Thus, it will be necessary for assays based on the deoxyribozyme activity to be certain that Mg2+ concentrations do not vary significantly. In samples where Mg may be variable, the issue can be addressed by adding excess magnesium salts with or without prior removal of endogenous Mg by treatment with EDTA attached to beads.
Figure 4.
Time course (Rn versus time) for cleavage of S by E in the presence of various concentrations of Mg2+ ion: 50 mM (closed squares); 25 mM (open circles); 12.5 mM (closed triangles); 5 mM (crosses); 2.5 mM (open squares); 1.25 mM (closed circles); 0 mM (open triangles); c(E) = 100 nM, c(S) = 3 µM.
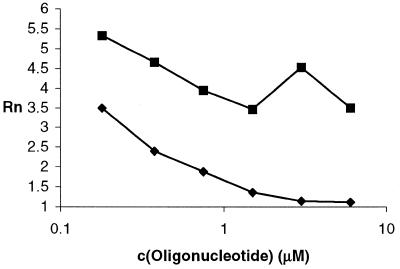
We assumed that any species that bound either E or S and altered reaction kinetics could be assayed with this system and we decided to demonstrate this with oligonucleotide effectors of E in a single mismatch detection assay. Reliable detection of a single mismatch (15,16) in an oligonucleotide requires careful thermodynamic considerations to maximize the rate differences. To test the feasibility of this proposal, we used a tridecaoligodeoxyribonucleotide inhibitor d(TAACGTTCCGTTA) (I) that binds to the non-conserved stem–loop region holding the conserved regions correctly positioned. The fully complementary oligonucleotide opened the stem–loop region, while a single mismatch oligonucleotide d(TAACATTCCGTTA) (II) did not (Fig. 5). The detection of single point mutations holds promise as a general method, because oligonucleotide sequences complementary to analytes could be used to substitute for the non-conserved loop structure, thereby implementing allosteric inhibition. Alternatively, the sequence complemetary to the analyte can be attached in a manner such that analyte binding relieves an inhibition and thereby effects allosteric activation (17). We will report separately on our efforts towards a self-amplifying detection system for single point mutations.
Figure 5.
Rn versus concentration of oligonucleotides: I (fully complementary, closed diamonds) and II (single mismatch, closed squares). Reaction conditions: c(Mg2+) = 2 mM, c(E) = 200 nM, c(S) = 3 µM, time 2 h; control without E, Rn = 0.95.
Assay of receptor–ligand interactions
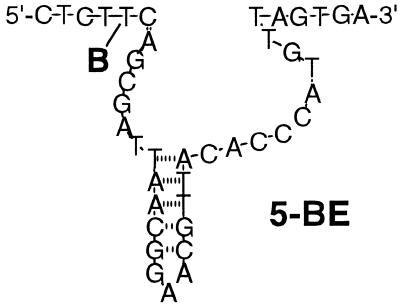
In order to couple receptor–ligand interactions with deoxyribozyme activity, we attached a ligand to E to achieve negative cooperativity between ligand binding and substrate cleavage (18). We reasoned that a judiciously positioned small molecule that is covalently attached to E would not significantly hinder cleavage of substrate; at the same time, the ligand would serve as a bait for bulky binding proteins, which would influence the rate of cleavage through steric interactions. The sensitivity of this system would depend on the difference in cleavage rates between free enzyme and enzyme bound to protein. To test this expectation, we chose biotin as the ligand because the chemistry of biotinylation of oligonucleotides is well developed, diverse and applicable to other ligands and because several proteins with different pI values, avidities for biotin and degrees of glycosylation are commercially available. Although 5′- and 3′-biotin attachments to E could be easily synthesized, biotin at this site would be remote from the regions important for cleavage and thus not likely to yield a very sensitive system. Alternatively, attaching biotin to the conserved loop region, important for correct positioning of substrate and enzyme, would likely retard the rate of cleavage unacceptably. Thus, we designed an internally modified enzyme 5B-E (Fig. 6), with biotinylated dT, with the expectation that the biotin moiety would be inconsequential to the enzyme, but proteins interacting with biotin at this position would likely diminish the rate of cleavage through steric interactions with both the substrate-binding region and the conserved loop region.
Figure 6.
Deoxyribozyme 5B-E covalently modified by biotin (B) and sensitized to allosteric inhibition by biotin-binding proteins.
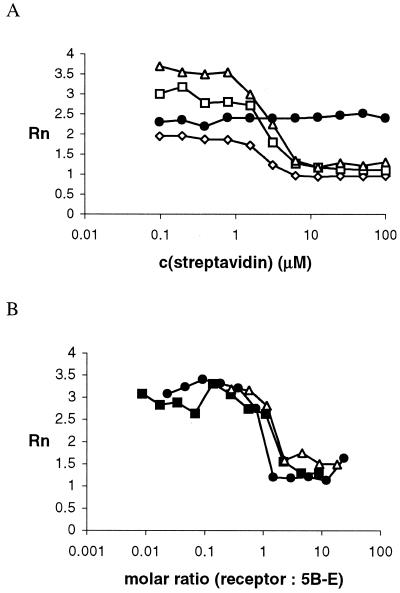
This design was fully validated in the experiment: biotin-modified 5B-E retained sufficient activity, albeit 20-fold less than the unmodified analog E, and the addition of one equivalent of streptavidin blocked the activity. The time course (Fig. 7A) for the changes in the Rn value obtained by cleavage of S (5 µM) by 5B-E (3 µM, 50 mM HEPES, 500 mM NaCl, 1.25 mM MgCl2, pH 7.5) in the presence of dilutions of streptavidin stock solution (4 mg/ml, 25 µM, 100 µM binding sites) revealed increases in Rn only for those reactions in which the concentration of streptavidin was substoichiometric. In negative controls, the same streptavidin dilutions showed no effect on E, preincubation of streptavidin with free biotin blocked the inhibition of 5B-E and the reaction was insensitive to non-specific antibodies. In positive controls, the modified oligonucleotide 5B-E was found to also be sensitive to avidin, neutravidin and anti-biotin antibody in solution (Fig. 7B). In an experiment simulating cell surface receptors, streptavidin-on-agarose beads and monomeric avidin beads blocked the activity of 5B-E and this interaction was also inhibited by pretreatment of the beads with biotin. Therefore, the binding of biotin to a variety of receptors ‘switches off’ the substrate cleavage activity of an oligonucleotide enzyme modified through a rationally introduced allosteric site.
Figure 7.
(A) Rn versus c(streptavidin), with c(5B-E) = (3 µM) [20 (open diamonds), 40 (open squares) and 60 (open triangles) min] and control deoxyribozyme E (closed circles). (B) Rn versus molar ratio (receptor per B-E) for neutravidin (open triangles), avidin (closed circles) and anti-biotin antibody (closed squares).
In order to define the limit of detection for receptor molecules, serial dilutions of 5B-E and streptavidin were tested. Due to the stable background signal, we were able to reliably detect streptavidin concentrations of <1 nM at extended incubation times (∼1 day). The sensitivity of this assay under extended reaction times is acceptable for some of the anticipated homogeneous solution screening applications (e.g. screening of hybridomas). For clinical applications, which require rapid read out, further selection to compensate for the loss of activity or a different higher activity deoxyribozyme would be advantageous.
Conclusions and future directions
We have demonstrated that nucleic acid catalysts could be used to report concentrations of protein effectors through a change in a fluorescence signal. Simple binding aptamers can compete with antibodies in heterogenous assays and the results reported here suggest that (deoxy)ribozymes may offer further advantage through general single-step homogeneous catalytic assays. An important property of (deoxy)ribozyme-based catalysts is the potential for rational introduction of allosteric regulation sites that are amenable to further optimization through a well-defined selection process. A general approach to (deoxy)ribozymes activated by small molecules has been established (8) and similar work on proteins is anticipated. A significant improvement in binding constants of the allosteric sites and more efficient reaction mechanisms can be expected with the advent of an expanded genetic code suitable for the selection process (19,20).
Our efforts are now focused on deoxyribozyme-based high throughput screening assays. Because substrate–enzyme recognition is based on the complementarity of the oligonucleotide sequences, these enzymes also present us with a unique opportunity for parallel detection of several different interactions in a single assay and we will report on these efforts shortly.
Acknowledgments
ACKNOWLEDGEMENTS
We thank Drs Therese Wilson and Qais Al-Awqati for helpful comments, support and encouragement. Financial support was provided by the Counterdrug Technology Center of the Office of National Drug Control Policy (D.W.L.) and an NIH postdoctoral fellowship (M.N.S.).
REFERENCES
- 1.Cech T.R., Zaug,A.J. and Grabowski,P.J. (1981) Cell, 27, 487–496. [DOI] [PubMed] [Google Scholar]
- 2.Guerrier-Takada C., Gardiner,K., Marsh,T., Pace,N. and Altman,S. (1983) Cell, 35, 849–857. [DOI] [PubMed] [Google Scholar]
- 3.Looney D. and Yu,M. (1997) In Turner,P.C. (ed.), Ribozyme Protocols. Humana Press, Totowa, NJ, pp. 469–486.
- 4.Hager A.J., Pollard,J.D. and Szostak,J.W. (1996) Chem. Biol., 3, 717–725. [DOI] [PubMed] [Google Scholar]
- 5.Gold L., Polisky,B., Uhlenbeck,O. and Yarus,M. (1995) Annu. Rev. Biochem., 64, 763–797. [DOI] [PubMed] [Google Scholar]
- 6.Osborne S.E. and Ellington,A.D. (1997) Chem. Rev., 97, 349–370. [DOI] [PubMed] [Google Scholar]
- 7.Roberson M.P. and Ellington,A.D. (1999) Nature Biotechnol., 17, 62–66. [DOI] [PubMed] [Google Scholar]
- 8.Soukup G.A. and Breaker,R.R. (1999) Trends Biotechnol., 17, 469–476. [DOI] [PubMed] [Google Scholar]
- 9.Singh K.K., Parwaresch,R. and Krupp,G. (1999) RNA, 5, 1348–1356. [DOI] [PMC free article] [PubMed] [Google Scholar]
- 10.Breaker R.R. and Joyce,G.F. (1995) Chem. Biol., 2, 655–660. [DOI] [PubMed] [Google Scholar]
- 11.Lie Y.S. and Petropoulos,C.J. (1998) Curr. Opin. Biotechnol., 9, 43–48. [DOI] [PubMed] [Google Scholar]
- 12.Ghosh S.S., Eis,P.S., Blumeyer,K., Fearon,K. and Millard,D.P. (1994) Nucleic Acids Res., 22, 3155–3159. [DOI] [PMC free article] [PubMed] [Google Scholar]
- 13.Kelemen B.R., Klink,T.A., Behlke,M.A., Eubanks,S.R., Leland,P.A. and Raines,R.T. (1999) Nucleic Acids Res., 27, 3696–3701. [DOI] [PMC free article] [PubMed] [Google Scholar]
- 14.Santoro S.W. and Joyce,G.F. (1997) Proc. Natl Acad. Sci. USA, 94, 4262–4266. [DOI] [PMC free article] [PubMed] [Google Scholar]
- 15.Tyagi S. Bratu,D.P. and Kramer,F.R. (1998) Nature Biotechnol., 16, 49–53. [DOI] [PubMed] [Google Scholar]
- 16.Storhoff J.J. Elghanian,R., Mucic,R.C., Mirkin,C.A. and Letsinger,R.L. (1998) J. Am. Chem. Soc., 120, 1959–1964. [Google Scholar]
- 17.Porta H. and Lizardi,P.M. (1995) Biotechnology, 13, 161–164. [DOI] [PubMed] [Google Scholar]
- 18.Engel W.D. and Khanna,P.L. (1992) J. Immunol. Methods, 150, 99–102. [DOI] [PubMed] [Google Scholar]
- 19.Battersby T.R., Ang,D.N., Burgstaller,P., Jurczyk,S.C., Bowser,M.T., Buchanan,D.D., Kennedy,R.T. and Benner,S.A. (1999) J. Am. Chem. Soc., 121, 9781–9789. [DOI] [PubMed] [Google Scholar]
- 20.Santoro S.W., Joyce,G.F., Sakthivel,K., Gramatikova,S. and Barbas,C.F. (2000) J. Am. Chem. Soc., 122, 2433–2439. [DOI] [PubMed] [Google Scholar]


