

Abstract

There are few measurements of barium sulfate (BaSO4) solubility in water above 373 K available in the literature. BaSO4 solubility data at water saturation pressure are scare. The pressure dependence on BaSO4 solubility has not previously been comprehensively reported for the pressure range 100–350 bar. In this work, an experimental apparatus was designed and built to measure BaSO4 solubility in aqueous solutions under high-pressure (HP), high-temperature (HT) conditions. The solubility of BaSO4 was experimentally determined in pure water over the temperature range from T = (323.1 to 440.1) K and pressures ranging from p = (1 to 350) bar. Most of the measurements were done at water saturation pressure: six data points were done above the saturation pressure (323.1–373.1 K) and 10 experiments were conducted at water saturation (373.1–440.1 K). The reliability of the extended UNIQUAC model and results generated in this work was demonstrated by comparing with the scrutinized experimental data reported in the literature. The model gives a very good agreement with BaSO4 equilibrium solubility data, demonstrating the reliability of the extended UNIQUAC model. The accuracy of the model at high temperature and saturated pressure due to data insufficiencies is discussed.
1. Introduction
The formation of inorganic scale deposits or crystalline fouling is a common problem in many industries from energy production to food, biology, medical, and mining. The problems are also seen in private homes, for example, in water supply systems.1 It is a complex phenomenon that causes serious economic and technical problems, thereby affecting the vast majority of industrial processes. Once scales have started depositing on any surface, they will continue to get thicker. Scale deposits block the flow of substances and cause equipment2 to malfunction and reduce energy transfer.3 Scale, along with corrosion4 and gas hydrates,5 is likely one of the three most serious water-related production issues, and it must be well understood in order to determine the best treatment strategy.
Various chemical or physical treatments have been proposed to mitigate scaling.6 By means of physical treatment, the easily accessible scale can be milled and removed. This is only applicable to scales that can be easily milled out after formation. Physical treatment is generally associated with drilling processes, making it costly to implement. Scale dissolvers (removers) are more cost-effective in dealing with scaling problems.7 The effectiveness of chemical methods for removing scale is greatly determined by the type of scale and the accessibility of scale to the chemicals.8 Carbonate scale can often be dissolved using acids, while sulfate scale removal requires physical methods. The effectiveness of the chemical method is mainly determined by how well the chemicals access to the scale surface during treatment. Therefore, the surface area to volume ratio is a critical factor in evaluating scale removal efficiency.9 For example, even the strongest scale dissolvers will have a limited effect on kinetics of scale dissolution when a nonporous layer of scale with a small surface area to volume has been formed. Some nonporous scale deposits reside in the tubing or connections of hardware that are difficult to access with chemicals, exhibiting low efficiency through chemical treatment methods.
Scale prevention is both technically and economically more effective than scale removal or dissolution. Scale prediction is an important part of scale prevention which is dependent upon solubility data for the scale-forming compounds. Phase equilibrium calculations allow assessment of the risk of scaling during early process design stages. However, the ability to accurately predict scale solubility is currently limited due to a poor understanding of the thermodynamics. The thermodynamics of scaling is influenced by composition, temperature, pressure, and ionic strength, which makes it a challenging task.10 These variables change dramatically during the flow path of the fluid, and they can also differ significantly owing to the heterogeneity of the resource area. For instance, as injected saturated water flows to the high-temperature zone in water injection wells, the solubility of some salts in the injected water might decrease, resulting in scale deposition. Similarly, a pressure drop can also reduce the scale solubility in water.11,12 As a result, construction of a reliable thermodynamic model is required to accurately predict the scaling tendency and to solve the environmental and industrial process problems noted above. The use of precise data is essential for developing strong models and making accurate predictions.
Calcium sulfate (CaSO4), calcium carbonate (CaCO3), strontium sulfate (SrSO4), and barium sulfate (BaSO4) are some of the most common scales in oil production environments. It occurs when mixing two incompatible waters such as seawater with high sulfate concentrations and formation waters with low calcium, barium, and strontium concentrations.13 BaSO4 is the principal scale in the North Sea offshore oilfields;14 it has a very low solubility with a pKsp = 9.99 solubility product at 25 °C.15 This low solubility product provides challenges when working with BaSO4.
Additional difficulties can arise due to the limited measurements available to support the calculation results for BaSO4. The literature contains several publications reporting on phase equilibrium of systems containing BaSO4, discussed by Krumgalz,16 Stipp and co-workers,17 and Corrêa et al.18 These existing data are restricted to a narrow range of temperature and pressure. For BaSO4 solubility in pure water, only 56 of the data points reported exceed temperatures of 373 K and pressures greater than 40 bar. Not only are the previous literature studies limited in the experimental temperature and pressure ranges but there is also commonly poor agreement between the reported values from different authors, which prevents an unequivocal representation of the properties of the system. Although studies have focused on the solubility of BaSO4 in pure water at water vapor saturation pressure at different temperatures,19−22 only two papers report experimental measurement at temperatures over 373 K23,24 with conflicting results. Strübel23 reports a BaSO4 solubility of 16.5 μmol/kg H2O at 523 K and water saturation pressure. To our best knowledge, the data of Jones et al. is the only other data that exist at water saturation pressure and 523 K. They report a much lower value of 5.3 μmol BaSO4/kg H2O.
A key problem which thus arises concerns is the choice of data source to be incorporated into the thermodynamic model. In addition, the amount of data on BaSO4 solubility in pure water at higher pressures is very limited. The accuracy of models is much dependent on the available experimental data on which the model parameters are based. The availability of data on the solubility of BaSO4 at temperatures higher than 373 K and saturation pressure is scarce. BaSO4 solubility data in the range of 100–350 bar are needed to verify solubility in this pressure range.
To improve the current data availability, especially to confirm the general solubility trends over 373 K at the corresponding saturation pressure, a reliable experimental setup has been developed to determine BaSO4 solubility in the temperature range between 323 and 440 K and pressures ranging from 1 to 350 bar in pure water. The experiments were conducted to fill the gaps in the solubility data for BaSO4 presented in the literature. This work presents new measurements of BaSO4 solubility in pure water at an elevated pressure and temperature conditions. The new BaSO4 solubility data might lead to better solubility models and even better prediction of scaling in water. Through the BaSO4 solubility data, we expect to improve data quality, which can lead to better performance of thermodynamic models in a elevated pressure and temperature range.
2. Experimental Section
2.1. Chemicals and Preparation
BaSO4 in powder form with purity of 99.99% on trace metal basis was used in this work. The chemical was used as received from the supplier (Sigma-Aldrich) without further purification. The solid was equilibrated adding ultrapure water (Type 1) with a resistivity of 18.2 MΩ·cm at 25 °C produced in a Water Purification System (Merck Millipore). The BaSO4 powder used for this study consisted of particles with a wide size distribution. To prevent possible influencing factors of particles, the initial powder was pre-sieved into uniform size and only particles ranging between 53 and 96 μm were used. Figure 1 shows a microscopic image of the particle that was sieved and used for dissolution. The BaSO4 particle shows a smooth surface and regular shape. The particle size indicates that the sieving process was effective in producing particles of consistent size for the dissolution experiment.
Figure 1.

Scanning electron micrograph (SEM) image (×2000) of a BaSO4 solid particle after sieving.
2.2. Methodology
2.2.1. Apparatus for Solubility Measurement
The sparingly soluble characteristic of BaSO4 in water is a particular source of concern in terms of measurement accuracy, and measurement can therefore be challenging. Accurate measurements depend on the purity of chemicals, adequate equilibration, effective sampling, as well as reliable analysis.
The apparatus was designed and built to perform experimental determinations of BaSO4 solubility. The apparatus can be operated at temperatures up to 448 K and pressures up to 500 bar, which covers the conditions necessary to assess the solubility within the scope of this study. The solubility measurement system shown in Figure 2 includes the following systems:
Figure 2.

Schematic of experimental rig used for measurement of BaSO4 solubility.1,14,17-high pressure syringe ISCO pump; 2-valve; 3-oven; 4-temperature transducer; 5,6,7-high pressure equilibration cell; 8-pressure transducer; 9-high pressure filter (pore size: 0.5 μm); 10-check valve); 11-cooling bath; 12-back pressure regulator; 13,16-high pressure cell; 15-sample vial; 18-data logger.
(a) The phase equilibrium system, which consists of an oven-3, three high-pressure stainless-steel cells (−5, −6, −7) with interior volumes of 500 mL, and a connected high-pressure syringe pump-1 (Teledyne ISCO 260D). The high-pressure syringe pump was used to regulate the pressure/flow rate of the BaSO4 solution.
(b) The cooling system, which is a low-temperature thermostatic bath-11.
(c) The sampling system includes a high-pressure cell-16 associated with a high-pressure syringe pump-17, a back pressure regulator-12 controlled by a high-pressure cell-13, and a syringe pump-14. To ensure that no solids were entrained during sampling, a filter-9 with a pore size of 0.5 μm was fitted in line with a check valve to the outflow. A check valve-10 was supplied to prevent nitric acid solution from flowing back into the cell.
(d) A data acquisition system, which includes a computer and data acquisition unit-18, as shown in Figure 2. The online data acquisition unit is connected to a computer, which allowed real time data reading of temperatures and pressures throughout the measurement runs. The analytical work was carried out using an ion Chromatograph (930 Compact IC Flex Metrohm) equipped with an IC conductivity detector and a MagIC Net data module. For cation separation, the column was a cation-exchange column (Metrosep C6-250/4.0) packed with a polymer-based cation exchanger. Data were collected using a Metrohm data acquisition system interfaced to a computer running MagIC Net software (Metrohm). Millipore water was used for all effluent, sample, and standard preparation. The concentration of Ba2+ in the effluent solution was identified and quantified by calibration of the detector response to a known concentration using an external standard. The solubility of BaSO4 in pure water was considered to be identical to the molality of Ba2+.
The uncertainty in the pressure measured by the syringe pump was ±0.05 bar. The flow rate could be adjusted from 1 × 10⁻⁵ to 50 mL/min. The temperature was recorded by a T-type thermocouple with a precision of ±0.5 °C. The pressure was recorded by pressure transducers that were calibrated prior to the experiment using a digital pressure gauge (LabDMM) with a working range of 0–500 bar and an uncertainty of ±1.5 mbar according to the manufacturer’s specification.
2.2.2. Procedure
The experimental procedure for solubility measurement was designed to account for sufficient equilibration, precipitation prevention, and reliable analysis techniques, which thus includes solid–liquid equilibration, in-situ dilution, and ions analysis. To achieve solid–liquid equilibrium, an excess of highly pure BaSO4 crystals was added to the stainless-steel equilibrium cell, where it was mixed with ultrapure water. The slurry was stirred continuously at a speed of 350 rpm using a magnetic stirrer. A total of two independent equilibrations were performed in the high-pressure equilibration cell-5 and cell-7 (see Figure 2), which were placed in the oven at the experimental temperature. The experimental pressure of the BaSO4 solution was regulated by the high-pressure syringe pump at a constant pressure mode. Cell-6 in Figure 2 was regarded as a reference cell filled with a known concentration of barium chloride solution to correct the dilution folds after sampling.
A period of 72 h was adopted as sufficient for ensuring equilibration of BaSO4. Considering that the container used in this work has 100 times larger volume than the flask used in our previous work and that a smaller magnetic stirrer bar was used in this study, we selected a reasonable equilibration time of 120 h to establish equilibration in the current study. After allowing the BaSO4 mixed solution to reach equilibrium, at least 24 h were provided to settle the solution after turning off the magnetic stirrer.
The sampling process was then initiated by manually opening the outlet valve of the equilibration cell, while the syringe pump connected to the equilibrium cell was immediately switched from constant pressure mode to constant flow rate mode at 0.01 mL/min. The piston inside the equilibrium cell thus could push the saturated solution out of the cell at the same rate as the syringe pump was configured. To avoid BaSO4 precipitation due to temperature reduction after flowing it out of the oven, the saturated sample was diluted by mixing it with the bypass nitric acid (HNO3) solution. A 2 wt % HNO3 solution was used for this dilution when sampling for composition analysis. Prior to opening the outlet of the cell for sampling, HNO3 solution was injected into the mainstream line by a syringe pump-17 (see Figure 2) at the same rate as eluent solution, 0.01 mL/min. The pressure of the HNO3 solution was maintained at the same level as the pressure in the equilibration cell by using back pressure regulators. By doing this, precipitation of BaSO4 is expected to be prevented during dilution under the same temperature and pressure conditions. The diluted solution was cooled to room temperature by passing it through a water bath. The eluent solution came out of the back pressure regulator-12 and was collected in a vial-15 at room temperature and atmospheric pressure for later barium concentration analysis.
The sampling dilution folds were adjusted based on diluting the reference barium chloride solution in known concentration. Ion chromatography was used to determine the concentration of Ba2+ in the diluted samples. The results were corrected with the dilution folds of reference solution to obtain the actual Ba2+ concentration in the original saturated sample. The solubility of BaSO4 was calculated from the molality of Ba2+, which was assumed to be equal to the concentration of SO42–. The IC analyses were repeated up to three times to ensure that the IC measurement was reproducible. To determine the solubility of BaSO4 in the original sample, barium concentrations obtained through IC were corrected for the dilution process. It was assumed that the change in SO42– concentration would be the same as the change in Ba2+ concentration. The solubility of BaSO4 is thus assumed to be equal to the molality of barium ions.
2.2.3. Uncertainty Analysis
The uncertainties of the experimental BaSO4 solubility data associated with the sampling, calibration, calculation, and measurement of concentration are calculated using eq 1, in which xi represents any independent parameter affecting the solubility value (bBaSO4) and ∂bBaSO4/∂xi is a sensitivity coefficient.25
| 1 |
In the vast majority of measurements, the combined uncertainty is dominated by the effect from successive dilutions. This contribution was calculated as the product of the dilution factor (considered to be the sensitivity factor) and the IC resolution determined from calibration runs (for dilute solutions, 0.4 μmol Ba2+/kg water). Otherwise, the largest contribution to the combined uncertainty is the standard deviation from successive IC analyses. Finally, the expanded uncertainty is obtained by multiplying uc by 3.18, which corresponds to the Student’s t (2-tailed distribution) for 95% confidence with 3 degrees of freedom.
3. Solid–Liquid Equilibrium Calculations
Throughout this work, the extended UNIQUAC model presented by Thomsen and Rasmussen26 was employed to compare with the experimental results. The extended UNIQUAC is an activity coefficient model, and it is combined with the Soave-Redlich-Kwong (SRK) equation of state27 for gas phase non-ideality. The model only requires two parameters per species, (volume (ri) and surface area (qi) parameters) plus two parameters per species pair (interaction energy parameters, uij and uii). It would be inaccurate to regress these factors due to the lack of experimental data on solubility.28 Speciation calculations will provide information on the degree of dissociation and indicate whether the species will hydrolyze or form other complexes. Therefore, these calculations are used to determine the true composition of the solutions.
Eq 2 shows the general equations to be solved to determine the speciation equilibrium, in which K is the equilibrium constant, ΔG0 is the change in the standard state Gibbs energy due to the chemical reaction, ai is the activity, and νi is the stoichiometric coefficient of species i. In order to solve this equation, the standard state properties of the species present in the system must be known to calculate ΔG0, and a thermodynamic model suited for electrolyte solutions must be available to determine the individual activities (ai). The activities are temperature, pressure, and composition-dependent; therefore, these effects must be taken into consideration in the prediction model. Thomsen et al.29 calculated the heat capacity by the correlation of eq 3 which accounts for temperature dependence by heat capacity coefficients CP1, i and CP2, i. García et al.30 incorporated two additional parameters (α, β) to the extended UNIQUAC model as eq 4.
| 2 |
| 3 |
| 4 |
This concludes the modeling basis, and further details on the temperature and pressure dependence of the model are presented in their paper.30 The goal of this work is to report data that could be used to improve the pressure dependency of the extended UNIQUAC model, as given by eq 4.
4. Results and Discussion
The amount of existing solubility of BaSO4 in pure water is very scare. There is also a lack of information on BaSO4 solubility at elevated temperature and pressure. Additionally, due to extremely low solubility of BaSO4, the available measurements reported so far show a considerable scatter, which are derived from only three references;23,31,32 not any two sets of the references are in good agreement. The isobaric equilibrium solubility data of BaSO4 in pure water reported in the literature was compared to the solubility estimated by the extended UNIQUAC model as shown in Figure 3.
Figure 3.

Comparisons of available data of BaSO4 in pure water from the literature (square, Lyashchenko and Churagulov;32 triangle, Strübel;23 and circle, Blount31) and calculations from the extended UNIQUAC model (indicated by solid line) at a pressure range of (a) 100–500 bar and (b) 900–2100 bar. The colors are used to symbolize pressures.
The solubility reaches a maximum value near 373 K. The plotted data include those reported by Lyashchenko and Churagulov32 who calculated the data using a thermodynamic theory applied to the experimental data of Blount.31 Similar recalculated data in other references has been well discussed by Krumgalz16 and Stipp and co-workers.17 These calculated results are not included here. Data from Strübel are scattered and disagree with the tendency shown by other measurements at the whole examined range. The data from Blount (indicated by circles) give a consistent picture, but there is a lack of data at wide pressure and temperature ranges. Consequently, there are only two data sources that can be used to regress the model parameters and model the temperature and pressure dependency of BaSO4 solubility at the vapor pressure of water.
Importantly, data on BaSO4 solubility at pressures ranging from 100 to 350 bar are essential for constructing models to predict solubility under the typical reservoir conditions. Experimental solubility data for BaSO4 in this practical range are scarce. Thus, for this study, the experimental measurement conditions (p, T) for the binary system were conducted from T = (323.1 to 440.1) K and from p = (1 to 350) bar, as detailed in Figure 4.
Figure 4.

Pressure and temperature conditions at which BaSO4 solubility was measured in the present work.
For each isotherm (323.1 and 373.1 K), data were taken from 100 to 351 bar. At T = (373.1 to 440.1) K, the measurements were carried out 1 bar higher than the corresponding water saturated pressure to avoid sampling with any vapor phase. The influence of small pressure rise on solubility can be negligible according to the extended UNIQUAC model. The experimentally determined solubility of BaSO4 in pure water at all the measuring points expressed as μmol/kg H2O is collected in Table 1.
Table 1. Experimental Solubility of Barium Sulfate in Pure Water at Varying Temperatures T and Pressures P Determined in This Worka.
| T/K | p/bar | bBaSO4 · μmol/kg H2O |
|---|---|---|
| 323.1 | 101.3 | 14 ± 3 |
| 323.1 | 201.5 | 16.3 ± 0.16 |
| 323.1 | 301.1 | 20.2 ± 0.2 |
| 373.1 | 100.1 | 19.6 ± 0.3 |
| 373.1 | 200.0 | 20.5 ± 0.2 |
| 373.1 | 351.2 | 22 ± 1 |
| 373.1 | 2.0 | 12 ± 1 |
| 373.1 | 2.0 | 13.4 ± 0.7 |
| 379.1 | 2.2 | 14.72 ± 0.08 |
| 383.1 | 2.4 | 16.23 ± 0.03 |
| 393.1 | 2.9 | 17.8 ± 0.2 |
| 398.1 | 3.3 | 17.8 ± 0.5 |
| 416.1 | 4.9 | 20.99 ± 0.09 |
| 416.1 | 4.9 | 22.1 ± 0.1 |
| 423.1 | 5.8 | 19.54 ± 0.04 |
| 440.1 | 8.4 | 16.0 ± 0.4 |
Standard uncertainty for temperature is u(T) = 0.1 K, and standard uncertainty for pressure is us(p) = 0.1 bar.
Figure 5 shows the values for BaSO4 solubility bBaSO4 in pure water at 323.1 K and pressures ranging from 101.3 to 301.1 bar obtained from our experimental measurements, together with the reported data in the literature32,33 and calculated ones by the extended UNIQUAC model. At 323.1 K and 1 bar, the experimental results obtained by Melcher33 are in appreciable agreement with the data calculated by the extended UNIQUAC.
Figure 5.

Solubility of BaSO4 (in μmol/kg H2O) in pure water measured at 323.1 K and 101.3, 201.5, and 301.1 bar compared to results calculated with the extended UNIQUAC model and measurements reported in the literature. Red circle, data measured in this work; blue diamond and black square, data from the literature;32,33 and solid line, extended UNIQUAC model.
The data presented at 1 bar and 500 bar were calculated by Lyashchenko and Churagulov32 using the experimental data of Blount.31 The values are slightly underestimated compared to the values calculated with the extended UNIQUAC model. Although one data determined at 1000 bar is 33.6 μmol/kg H2O,32 the verification of this condition is beyond the pressure range at which we have been able to work.
Figure 5 also shows that the new data measured in this work are in good agreement with the extended UNIQUAC model calculations. The pressure dependency of BaSO4 solubility for the binary solutions was found to vary smoothly across the system. The BaSO4 solubility increases from 14 to 20 μmol/kg H2O as a function of pressure. The increase in solubility tends to agree with the trend exhibited by the data reported in the literature.32,33 The solubility data measured at these conditions are in good agreement with reliable references, which is the evidence of the robustness and accuracy of our experimental setup and methodology in determining the solubility of BaSO4.
The same methodology was employed in other conditions. The equilibrium solubility of BaSO4 in water versus pressure at constant temperature of 373.1 K is presented in Figure 6 together with solubility data reported by other authors.19,23,31−33 The extended UNIQUAC calculations are also illustrated. As seen in Table 1, the relationship of BaSO4 solubility and temperature dependency was indicated at temperatures of 323.1 and 373.1 K. In this temperature range, as expected, the solubility increased with increasing temperature under a constant pressure. The direct relation between solubility and pressure is clearly depicted in Figure 6, showing that the solubility of BaSO4 increases slightly as a function of pressure. The change in solubility caused by a pressure increase flattens temperatures higher than 373.1 K. The solubility of BaSO4 increased 12.2% from 100 to 350 bar at 373.1 K, while it increased 44.2% from 101 to 301 bar at 323.1 K. According to the results, it is concluded that pressure has a positive effect on the solubility of BaSO4 in pure water. This is in compliance with results from other authors.19,23,31−33 Three determinations of solubility from Blount31 were conducted at pressures from 460 to 496 bar, with respective solubility of 24.2, 25.3, and 25.8 μmol/kg H2O. Figure 6 shows that our data agree with the extended UNIQUAC estimates. As evidenced by the existing data produced by a validated methodology, the extended UNIQUAC model gives reliable results for the solubility of BaSO4 in water from 100 to 350 bar at temperatures 323.1 and 373.1 K.
Figure 6.

Solubility of BaSO4 (in μmol/kg H2O) in pure water measured at temperature of 373.1 K and pressures 100.1, 200.0, and 351.2 bar. Red circle, data measured in this work; blue triangle, blue circle, blue diamond, and black square data from the literature;19,23,31−33 black solid line, extended UNIQUAC model.
This work includes a comparison of the experimental solubility data to the thermodynamic model developed by Thomsen and Rasmussen26 based on the parametrization obtained by García et al.30 To evaluate the quality of the extended UNIQUAC model, relative deviations between experimental solubility and solubility calculated from the extended UNIQUAC were made. Comparisons were made for all available experimental data being evaluated, including those in the literature that were not used for determining the extended UNIQUAC model parameters. The relative deviation in solubility is expressed as 100 × (bexp – bcal)/bcal.
The relative deviations between experimental solubility values and values calculated with the extended UNIQUAC model are depicted in Figure 7 at pressures from 100.1 to 351.2 bar and temperatures of 323.15 and 373.15 K, respectively. The relative deviations are within 10% across the whole measuring range, with the exception of data at 100 bar and 323.15 K. Given the low concentration values and the complexity of the measurements, this deviation is considered acceptable. Comparisons with the data in the literature are also depicted in Figure 7. The relative deviations between experimental values and the values from the extended UNIQUAC model are within the scatter of the literature data. The experimental solubility of BaSO4 agrees with values calculated by the extended UNIQUAC within acceptable deviations.
Figure 7.

Relative deviations of the experimental solubility bexp of BaSO4 from values bcal calculated with the extended UNIQUAC plotted versus pressure. Symbols: data measured in this work at 323.1 K (blue circle) and 373.1 K (red circle); data obtained from the literature19,23,31−33 at 323.1 K (gray multiplication sign) and 373.1 K (black multiplication sign).
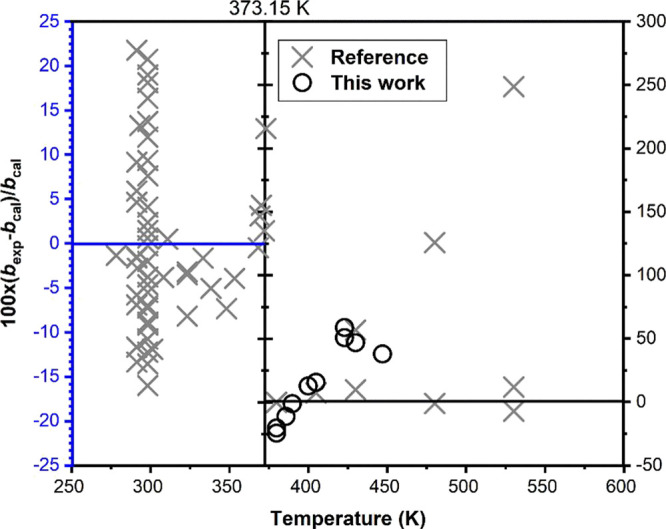
Solubility measurement of BaSO4 in water at saturation pressure is extremely challenging. At these conditions, vapor pressure of water is larger than the ambient pressure; therefore, a back pressure must be established to avoid formation of water bubbles due to depressurization of the system, when sampling the saturated solution. This is a challenging and quite sensitive procedure, which makes it difficult to obtain a consistent sample from the equilibrium cell. As observed in Figure 7, a higher relative deviation is evident at saturation pressures, particularly at conditions closer to the saturation state, where more negative deviations are obtained.
We conducted BaSO4 solubility measurements in the difficult temperature range from 373.1 to 440.1 K. The respective pressure is given by the 1 bar greater than water saturation pressure, as listed in Table 1. The results and values calculated with the extended UNIQUAC are depicted in Figure 8, along with comparisons with the different sets of data in the literature.19−21,24,31−45 There are 20 sets data for BaSO4 solubility in pure water available from different authors covering a wide range of temperature. The majority of published measurement data were obtained at 298.1 K. The solubility observed below 373.1 K increases as a function of temperature as reported by authors. In this temperature range, the extended UNIQUAC model can generally represent most of the experimental data sets for this system with a high accuracy. Nevertheless, this agreement is lost for temperatures higher than 373.1 K, where the reported data from various sources are widely divergent.
Figure 8.

BaSO4 solubility (in μmol/kg H2O) in water at water saturation pressure compared with the extended UNIQUAC model and reference measurements.19−21,24,31−45
A very large discrepancy is found between the tendency followed by the data reported by Strübel23 and the data reported by Lyashchenko and Churagulov32 when temperatures exceed 373.15 K. Strübel23 obtained a maximum BaSO4 solubility of 20.87 μmol/kg H2O at conditions close to 423.15 K, while solubility values published by Lyashchenko and Churagulov32 show a maximum solubility at 373.15 K. However, it is worth to mention that the latter results were calculated by extrapolation from experimental measurement31 obtained under high pressures. The recalculated values are represented as the solid squares in Figure 8. These are in complete agreement with the data from Jones et al.46 and the extended UNIQUAC model. Jones et al. only reported one experimental solubility of 5.3 μmol/kg H2O at 523.15 K. The measurements were carried out using a method for filtration of the saturated solution driven by quenching. The filtered solution was cooled to room temperature prior to radioactive analysis.46 It is reasonable to suspect solubility to change during this cooling period. Because of the temperature and pressure limitations of our apparatus, we are unable to perform a confirmation to validate if the solubility is reproducible at this temperature.
We need to stress that the existing data on BaSO4 solubility in water at saturation pressure are scarce. The main dataset available in this range was predicted from simple correlations. This was performed by Lyashchenko and Churagulov32 using data from other high temperature and high pressure conditions. The original data from of Blount31 can be seen in Figure 3. It is not reasonable to assume that these predictions are of high quality due to the observed scatter in the original measurements.
As it can be seen in Figure 8, the precision of the results generated in this work is comparable to that of other measurements at the same conditions, although they might seem dispersed and, to some extent, scattered. Relative deviations of the experimental data of this work and references from the extended UNIQUAC are shown in Figure 9. The figure shows wide range of differences among the various data sets. At a temperature lower than 373.1 K, the relative deviation decreases with temperature. The data of Melcher33 and Templeton19 cover the largest temperature range of 291.15–373.15 K. The data of both were fitted to within ±7% in solubility. The majority of solubility data is located at 298.15 K at which Powell et al.43 carried out intensive measurements with variable agreement from 0.26 to 20.7%. Data from Rosseinsky39 and from Nancollas et al.435 fit the model with an agreement of 9% at the same temperature. Near the temperature of 373.15 K, the fit of the extended UNIQUAC shows good agreement with the data of Blount,31 Templeton,19 and Melcher.33
Figure 9.
Relative deviations of the experimental solubility bexp from values bcal calculated with the extended UNIQUAC. Black circle, data determined in this work; gray multiplication sign, data obtained from the literature.19−21,24,31−45
The deviations from the extended UNIQUAC increase quickly as the temperature increases above 373.15 K. The disagreement of our measurements and the model was increased from 1 to 58% over the examined temperature range. The great discrepancy is observed mainly at temperatures over 400 K, where only three sets of data are available. At other temperatures, the model is capable of calculating the experimental data quite accurately. The model estimates a lower solubility compared to measurements above 373.15 K. This deviation is partly due to difficulties in accurately measuring solubility at elevated temperatures. In addition, the speciation of SO42– to HSO4– is increasingly evident at temperatures higher than 175 °C, while it is negligible at low temperatures.47
There are also considerable deviations for data in the temperature range between 300 and 373 K. This may be linked to the limited amount of data available in the temperature range of 300–373 K compared to the data collected at ambient temperature, where the deviations tend to be evenly distributed. This deviation could also be due to various factors such as measurement errors and insufficient equilibrium time used to determine solubility at an elevated temperature.
The sparingly soluble nature of BaSO4 in water makes precise solubility measurement and clear interpretation of results quite difficult, especially at elevated temperatures and corresponding water saturation pressures. These measurements often require special experimental consideration and approaches. First, measurements are done at a water saturation pressure greater than 1 bar leads to challenging sampling of the BaSO4 saturated solution at experimental conditions. Also, as indicated in Figure 8, BaSO4 solubility at water saturation conditions shows a very non-ideal behavior by changing significantly within limited temperature and pressure ranges. Finally, the solubility for sparingly soluble salts is seriously misestimated in the presence of any impurity or bubbles during sampling. In the case of BaSO4, contamination by sulfate ions will produce much lower solubility measurements due to a common ion effect,48 while the presence of small amount of chlorides will greatly increase the measured BaSO4 solubility.19 Based on this reasoning, it is expected that the measurement of solubility of sparingly soluble salts shows a relatively low reproducibility with an acceptable deviation with current methodology compared to other references.
An accurate knowledge of the solubility is of great importance for a better understanding of BaSO4 scaling. The time required for consistent creation of results is in the order of weeks per data point. This work is of interest for a further examination of the solubility of BaSO4 in pure water at 440 K at water saturation pressure because it is necessary to validate the general trend of the extended UNIQUAC prediction in this temperature and pressure range based on reliable experimental data. Measurements of solubility at high temperature and pressure are also recommended. This would improve data quality and, as a result, the performance of the thermodynamic model.
5. Conclusions
The solubility of BaSO4 found in natural waters has been studied in connection with the problem of scaling in this work. The experiments were done with the intention to complete the gaps found in the BaSO4 solubility data reported in the literature. The experimental plan was designed with the target of providing the model with the necessary data to improve solubility calculation. An experimental set-up was developed to determine the solubility of BaSO4 in pure water up to 440 K and 350 bar. Ion chromatography was applied as an analytical technique to be implemented in the determination of BaSO4 solubility. Demonstration of the equipment was carried out by measuring solubility of BaSO4 in water up to 350 bar and 373.15 K.
The apparatus and method described in this paper for measuring the solubilities of BaSO4 in aqueous solutions at elevated temperatures and pressures are considered to be reliable and were validated as a part of this work. Isothermal solubility as a function of pressure was explored in the range between 100 and 350 bar. The solubility of BaSO4 in water was observed to increase as a function of pressure.
The standard deviation calculated for each run shows a very good precision of the methodology implemented. The error estimated for the pressure dependence measurements varies from 3 to 10%, showing a good agreement with the extended UNIQUAC model. The temperature dependence on solubility shows discrepancy between different data sources at temperatures over 400 K at water saturation pressure. The experimental solubility data generated in this study indicates that the temperature for maximum solubility of BaSO4 is higher than that reported by other studies. This knowledge might be helpful in predicting scale formation at the studied conditions and thus prevent economic or technological issues. Additional data for temperatures over 440 K at saturation pressure are needed to validate the general tendency of the extended UNIQUAC model in the future.
Acknowledgments
The authors acknowledge the Danish Underground Consortium (TotalEnergies, E&P Denmark, and Noreco & Nordsofonden). This work was funded by the Danish Offshore Technology Centre (DTU Offshore) under the CTR2 program. Reference data cited in the manuscript can be obtained by contacting the CERE Consortium (www.cere.dtu.dk). Research institutes and consortium members can get the data free of charge.
Glossary
Abbreviations
- r
volume
- q
surface area
- u
energy interaction parameter
- p
pressure parameter
- a
activity
- v
stoichiometric coefficient
- SLE
solid–liquid equilibrium
Author Contributions
The manuscript was written through contributions of all authors. All authors have given approval to the final version of the manuscript.
The authors declare no competing financial interest.
References
- Dyer S. J.; Graham G. M. The Effect of Temperature and Pressure on Oilfield Scale Formation. J. Pet. Sci. Eng. 2002, 35, 95–107. 10.1016/S0920-4105(02)00217-6. [DOI] [Google Scholar]
- Olajire A. A. A Review of Oilfield Scale Management Technology for Oil and Gas Production. J. Pet. Sci. Eng. 2015, 135, 723–737. 10.1016/j.petrol.2015.09.011. [DOI] [Google Scholar]
- Boch R.; Leis A.; Haslinger E.; Goldbrunner J. E.; Mittermayr F.; Fröschl H.; Hippler D.; Dietzel M. Scale-Fragment Formation Impairing Geothermal Energy Production: Interacting H2S Corrosion and CaCO3 Crystal Growth. Geotherm. Energy 2017, 5, 4. 10.1186/s40517-017-0062-3. [DOI] [Google Scholar]
- El-Sherik A. M.Trends in Oil and Gas Corrosion Research and Technologies: Production and Transmission; Woodhead Publishing, 2017. [Google Scholar]
- Perfeldt C. M.; Sharifi H.; von Solms N.; Englezos P. Oil and Gas Pipelines with Hydrophobic Surfaces Better Equipped to Deal with Gas Hydrate Flow Assurance Issues. J. Nat. Gas Sci. Eng. 2015, 27, 852–861. 10.1016/J.JNGSE.2015.09.044. [DOI] [Google Scholar]
- Gutzeit J.Cleaning of Process Equipment and Piping: A Complete How-to Manual; National Assn of Corrosion, 1997. [Google Scholar]
- Mindler A. B.; Epstein A. C. Measurements and Control in Reverse Osmosis Desalination. Desalination 1986, 59, 343–379. 10.1016/0011-9164(86)90036-6. [DOI] [Google Scholar]
- Hasson D.; Shemer H.; Sher A. State of the Art of Friendly “Green” Scale Control Inhibitors: A Review Article. Ind. Eng. Chem. Res. 2011, 50, 7601–7607. 10.1021/ie200370v. [DOI] [Google Scholar]
- Chauhan K.; Sharma P.; Chauhan G. S. Removal/Dissolution of Mineral Scale Deposits. Miner. Scales Deposits 2015, 701–720. 10.1016/B978-0-444-63228-9.00029-2. [DOI] [Google Scholar]
- Yap J.; Fuller M. J.; Schafer L. A.; Kelkar S.. Removing Iron Sulfide Scale: A Novel Approach. In Abu Dhabi International Petroleum Exhibition and Conference; OnePetro, 2010. [Google Scholar]
- Crabtree M.; Eslinger D.; Fletcher P.; Miller M.; Johnson A.; King G. Fighting Scale: Removal and Prevention. Oilf. Rev. 1999, 11, 30–45. [Google Scholar]
- Shi W.; Kan T. A.; Fan C.; Tomson M. B. Solubility of Barite up to 250 °C and 1500 Bar in up to 6 m NaCl Solution. Ind. Eng. Chem. Res. 2012, 51, 3119–3128. 10.1021/ie2020558. [DOI] [Google Scholar]
- Sorbie K. S.; Mackay E. J. Mixing of Injected, Connate and Aquifer Brines in Waterflooding and Its Relevance to Oilfield Scaling. J. Pet. Sci. Eng. 2000, 27, 85–106. 10.1016/S0920-4105(00)00050-4. [DOI] [Google Scholar]
- Mitchell R. W.; Grist D. M.; Boyle M. J. Chemical Treatments Associated with North Sea Projects. J. Pet. Technol. 1980, 32, 904–912. 10.2118/7880-PA. [DOI] [Google Scholar]
- Kuwahara Y. In Situ Atomic Force Microscopy Study of Dissolution of the Barite (0 0 1) Surface in Water at 30° C. Geochim. Cosmochim. Acta 2011, 75, 41–51. 10.1016/j.gca.2010.10.003. [DOI] [Google Scholar]
- Krumgalz B. S. Temperature Dependence of Mineral Solubility in Water. Part 3. Alkaline and Alkaline Earth Sulfates. J. Phys. Chem. Ref. Data 2018, 47, 23101. 10.1063/1.5031951. [DOI] [Google Scholar]
- Zhen-Wu B. Y.; Dideriksen K.; Belova D. A.; Raahauge P. J.; Stipp S. L. S. A Comparison of Standard Thermodynamic Properties and Solubility Data for Baryte, Ba2+(Aq) and SO42–(Aq). Mineral. Mag. 2014, 78, 1505–1515. 10.1180/minmag.2014.078.6.17. [DOI] [Google Scholar]
- Corrêa L. F. F.; Hao J.; Neerup R.; Almeida S.; Shi M.; Thomsen K.; Fosbøl P. L. Review of Barium Sulphate Solubility Measurements. Geothermics 2022, 104, 102465 10.1016/J.GEOTHERMICS.2022.102465. [DOI] [Google Scholar]
- Templeton C. C. Solubility of Barium Sulfate in Sodium Chloride Solutions from 25° to 95°C. J. Chem. Eng. Data 1960, 5, 514–516. 10.1021/je60008a028. [DOI] [Google Scholar]
- Brower E.; Renault J.. Solubility and Enthalpy of the Barium-Strontium Sulfate Solid Solution Series; New Mexico State Bureau Of Mines And Mineral Resources, 1971; Vol. 116, pp 1–21. [Google Scholar]
- Trendafelov D.; Balarew C.; Zlateva I.; Keremidtchieva B.; Gradinarov S. Investigations of the BaSO4 Conversion to BaCO3 in the Quaternary Reciprocal Water-Salt System BaSO4+ K2CO3+ BaSO3+ K2SO4. Dokl. Bolg. Akad. Nauk. 1994, 47, 47–50. [Google Scholar]
- Gomaa E. A. Solubility and Solvation Parameters of Barium Sulphate in Mixed Ethanol-Water Mixtures at 301.15 K. Int. J. Mater. Chem. 2012, 2, 16–18. 10.5923/j.ijmc.20120201.03. [DOI] [Google Scholar]
- Strübel G. Zur Kenntnis Und Genetischen Bedeutung Des Systems BaSO4–NaCl–H2O. Neues Jahrb. Miner. Monatsh 1967, 4, 223–234. [Google Scholar]
- Jones E. V.; Lietzke M. H.; Marshall W. L. The Solubility of Several Metal Sulfates at High Temperature and Pressure in Water and in Aqueous Uranyl Sulfate Solution. J. Am. Chem. Soc. 1957, 79, 267–271. 10.1021/ja01559a005. [DOI] [Google Scholar]
- Ellison S. L. R.; Williams A.. Quantifying Uncertainty in Analytical Measurement; Eurachem, 2012. [Google Scholar]
- Thomsen K.; Rasmussen P. Modeling of Vapor–Liquid–Solid Equilibrium in Gas–Aqueous Electrolyte Systems. Chem. Eng. Sci. 1999, 54, 1787–1802. 10.1016/S0009-2509(99)00019-6. [DOI] [Google Scholar]
- Soave G. Equilibrium Constants from a Modified Redlich-Kwong Equation of State. Chem. Eng. Sci. 1972, 27, 1197–1203. 10.1016/0009-2509(72)80096-4. [DOI] [Google Scholar]
- Thomsen K.Electrolyte Solutions: Thermodynamics, Crystallization, Separation Methods; Technical University of Denmark: Lingby, 2009. [Google Scholar]
- Thomsen K.; Rasmussen P.; Gani R. Correlation and Prediction of Thermal Properties and Phase Behaviour for a Class of Aqueous Electrolyte Systems. Chem. Eng. Sci. 1996, 51, 3675–3683. 10.1016/0009-2509(95)00418-1. [DOI] [Google Scholar]
- García A. V.; Thomsen K.; Stenby E. H. Prediction of Mineral Scale Formation in Geothermal and Oilfield Operations Using the Extended UNIQUAC Model: Part I Sulfate Scaling Minerals. Geothermics 2005, 34, 61–97. 10.1016/j.geothermics.2004.11.002. [DOI] [Google Scholar]
- Blount C. Barite Solubilities and Thermodynamic Quantities up to 300 Degrees C and 1400 Bar. Am. Mineral. 1977, 62, 942–957. [Google Scholar]
- Lyashchenko A. K.; Churagulov B. R. Influence of Pressure on the Temperature Coefficients of the Solubility of Electrolytes in Water. Russ. J. Inorg. Chem. 1981, 26, 642–644. [Google Scholar]
- Melcher A. C. The Solubility of Silver Chloride, Barium Sulphate, and Calcium Sulphate at High Temperatures. J. Am. Chem. Soc. 1910, 32, 50–66. 10.1021/ja01919a003. [DOI] [Google Scholar]
- Fresenius R. Ueber Die Bestimmung Der Schwefelsäure, Vornehmlich Bei Gegenwart von Salpetersauren Alkalien. Z. Anorg. Allg. Chem. 1870, 9, 52–63. 10.1007/BF01362832. [DOI] [Google Scholar]
- Kohlrausch F.; Rose F. Die Löslichkeit Einiger Schwer Löslicher Körper Im Wasser, Beurteilt Aus Der Elektrischen Leitungsfähigkeit Der Lösungen. Z. Phys. Chem. 1893, 12, 234–243. [Google Scholar]
- Holleman A. F. Bestimmungen Der Löslichkeit Sogenannter Unlöslicher Salze. Z. Phys. Chemie 1893, 12, 125–139. [Google Scholar]
- Küster F. W. Über Die Löslichkeitsverhältnisse Des Baryumsulfates. Z. Anorg. Allg. Chem. 1896, 12, 261–271. 10.1002/zaac.18960120149. [DOI] [Google Scholar]
- Kolthoff J. M.; Vogelenzang E. H. Die Bestimmung von Sulfat Als Baryumsulfat. Z. Anorg. Allg. Chem. 1919, 58, 49–69. 10.1007/BF01400177. [DOI] [Google Scholar]
- Rosseinsky D. R.The Solubility of Barium Sulphate in Water at 25°C; Rhodes University, 1957; http://hdl.handle.net/10962/d1013097. [Google Scholar]
- Yuan M.Barium Sulfate Scale Inhibition in the Deepwater Cold Temperature Environment. In InternationalSymposium on Oilfield Scale; OnePetro, 2001. [Google Scholar]
- Paige C. R.; Kornicker W. A.; Hileman O. E. Jr.; Snodgrass W. J. Solution Equilibria for Uranium Ore Processing: The BaSO4-H2SO4-H2O System and the RaSO4-H2SO4-H2O System. Geochim. Cosmochim. Acta 1998, 62, 15–23. 10.1016/S0016-7037(97)00320-7. [DOI] [Google Scholar]
- Lieser K. H. Radiochemische Messung Der Löslichkeit von Erdalkalisulfaten in Wasser Und in Natriumsulfatlösungen. Z. fur Anorg. Allg. Chem. 1965, 335, 225–231. 10.1002/zaac.19653350502. [DOI] [Google Scholar]
- Powell J. L.; Coller B. A. W.; Jones A. L. L. Effect of S-35 Tracer, Particle Size and Imperfection on the Solubility of Barium Sulphate. J. Cryst. Growth 1978, 43, 185–196. 10.1016/0022-0248(78)90166-5. [DOI] [Google Scholar]
- Nancollas G. H.; Purdie N. Crystallization of barium sulphate in aqueous solution. Trans. Faraday Soc. 1963, 59, 735–740. 10.1039/tf9635900735. [DOI] [Google Scholar]
- Nancollas G. H.; Purdie N. Crystallization of Barium Sulphate in Aqueous Solution. Trans. Faraday Soc. 1963, 59, 735–740. 10.1039/tf9635900735. [DOI] [Google Scholar]
- Lokshin K. A.; Zhao Y. Fast Synthesis Method and Phase Diagram of Hydrogen Clathrate Hydrate. Appl. Phys. Lett. 2006, 88, 131909 10.1063/1.2190273. [DOI] [Google Scholar]
- Jones E. V.; Lietzke M. H.; Marshall W. L. The Solubility of Several Metal Sulfates at High Temperature and Pressure in Water and in Aqueous Uranyl SulfateSolution. J. Am. Chem. Soc. 1957, 79, 267–271. 10.1021/ja01559a005. [DOI] [Google Scholar]
- Wang X.; Deng G.; Ko S.; Yi-Tsung Lu A.; Zhao Y.; Dai C.; Paudyal S.; Ouyang B.; Mateen S.; Kan A. T.; Tomson M. B.. Improved Scale Prediction for High Calcium Containing Produced Brine and Sulfide Scales; SPE International Oilfield Scale Conference and Exhibition; OnePetro, 2020, p D031S006R003, 10.2118/200699-MS. [DOI] [Google Scholar]
- Jiang C. Solubility and Solubility Constant of Barium Sulfate in Aqueous Sodium Sulfate Solutions between 0 and 80° C. J. Solution Chem. 1996, 25, 105–111. 10.1007/BF00972763. [DOI] [Google Scholar]