Abstract
Aminoglycosides are an important class of antibiotic that selectively target RNA structural motifs. Recently we have demonstrated copper derivatives of aminoglycosides to be efficient cleavage agents for cognate RNA motifs. To fully develop their potential as pharmaceutical agents it is necessary to understand both the structural mechanisms used by aminoglycosides to target RNA, and the relative contributions of hydrogen bonding and electrostatic interactions to recognition selectivity. Herein we report results from a calorimetric analysis of a stem–loop 23mer RNA aptamer complexed to the aminoglycoside neomycin B. Key thermodynamic parameters for complex formation have been determined by isothermal titration calorimetry, and from the metal-ion dependence of these binding parameters the relative contributions of electrostatics and hydrogen bonding toward binding affinity have been assessed. The principal mechanism for recognition and binding of neomycin B to the RNA major groove is mediated by hydrogen bonding.
INTRODUCTION
Aminoglycosides are a large family of molecules that find extensive clinical use in the treatment of Gram-negative infections (1). The antibacterial activity of these molecules has been attributed to binding to ribosomal RNA with inhibition of protein translation. Recent reports have also demonstrated selective and high affinity binding of aminoglycosides to a variety of other RNA structural motifs (2–4), including 16S rRNA (1,5), the Rev response element (RRE) (6), hammerhead ribozymes (7), group I intron ribozymes (2) and TAR–RNA (8). The molecular mechanisms through which neomycin B or other aminoglycosides inhibit RNA functions are poorly understood. Chemical modification studies have identified a stem–loop structure as a common binding motif for neomycin B (4), while NMR solution structures have now been reported for a variety of RNA–aminoglycoside complexes (9–16). Similar structural mechanisms for recognition and binding are emerging for complexes with natural RNA motifs and RNAs from combinatorial selection libraries.
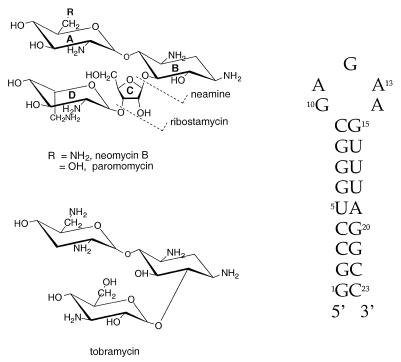
More recently we have demonstrated copper derivatives of aminoglycosides to be efficient cleavage agents for cognate RNA motifs (17) and also to mediate cleavage of DNA (18). To understand the origin of selectivity for the binding of aminoglycosides to biologically relevant RNA targets, it is necessary to evaluate the relative importance of hydrogen bonding and electrostatic contributions to binding affinity. Neomycin B (Fig. 1) carries six amine groups, is highly charged (+6) at neutral pH and has many hydroxyl groups on its sugar rings. It is expected, therefore, that there might be strong electrostatic and hydrogen bonding interactions between neomycin and the phosphate backbone or base/sugar heteroatoms of a target RNA molecule. For example, paromomycin, which differs from neomycin by a single amino to hydroxyl substitution, shows a 100-fold lower affinity for the RRE (6). No primary sequence homologies exist between all of the neomycin-binding RNAs, suggesting that the recognition process has a structural basis that can be fine-tuned by choice of aminoglycoside and the stereochemistry of ring substituents. Determination of the principal binding interactions that promote high affinity recognition of ligands for cognate RNA molecules will allow improvement of the binding affinity and selectivity of the RNA–ligand contact, while also allowing an opportunity to relate this thermodynamic data to specific neomycin–RNA contacts. Recent reports have suggested a strong electrostatic contribution to binding energy (7,19); however, the data do not exclude the possibility of a dominant hydrogen bonding term.
Figure 1.
Primary and secondary structure of the R23 RNA and the neomycin B aminoglycoside ligand.
To evaluate the relative contributions of hydrogen bonding and electrostatic attraction toward the thermodynamic binding free energy, the metal-ion dependence of key thermodynamic binding parameters for complex formation between neomycin B and a cognate RNA motif has been analyzed in terms of a polyelectrolyte theory that has previously been validated for evaluation of ion, ligand and protein binding to both polynucleotides and short oligonucleotides (20). The conclusions from this analysis have been compared with the expected binding mode determined by solution NMR studies (21). Binding parameters were determined by use of isothermal titration calorimetry, which provides direct experimental values for the binding constant K, enthalpy change ΔH, entropy change ΔS, as well as the number of binding sites. By monitoring the variation of binding affinity with background salt concentration, it is possible to separate the binding energy into salt dependent and salt independent terms. The former is responsive to electrostatic interactions, while the latter reflects hydrogen bonding interactions (22). In previous work we have demonstrated that aminoglycoside binding of small molecule anions, including adenosine di-, tri- and tetra-phosphates, is dominated by electrostatic attraction of the positively charged aminoglycosides for the anion, and can be treated in terms of Debye–Huckel theory (18). We here demonstrate that this contrasts markedly with binding to cognate RNA sequences and indicates the origin of RNA recognition by such ligands.
MATERIALS AND METHODS
RNA synthesis and purification
R23 RNA was prepared by in vitro transcription (23) using T7 RNA polymerase (24). The DNA templates and the 18mer T7 promoter were purchased from IDT. The sequences of the top-strand and template-strand DNA molecules were: top, 5′-TAATACGACTCACTATAG-3′; template, 3′-ATTATGGTGAGTGATATCCGGACCCGCTCTTCAAATCCGG-5′. The T7 RNA polymerase was purified from an over-expressing strain of Escherichia coli pAR1219 according to published methods (24). Typical transcription reaction conditions were 40 mM Tris, 1 mM spermidine, 5 mM DTT, 0.01% Triton X-100, 80 mg/ml PEG, 4 mM of each NTP (ATP, CTP, GTP, UTP), 0.4 mM top and bottom strand DNA, 28 mM MgCl2 and T7 RNA polymerase (A280 = 0.15). The transcription reaction was carried out at 37°C for 4 h, and the formation of a white precipitate indicated that the reaction was in progress. Finally, 50 mM EDTA was added to terminate the reaction.
R23 RNA was ethanol precipitated, purified using PAGE (20%) and then electroeluted from the gel. It was further concentrated by ethanol precipitation and exchanged into the desired NMR buffer (50 mM sodium chloride, 10 mM sodium phosphate and 0.1 mM EDTA at pH 6.5) by centricon ultrafiltration (Amicon, Centricon-3; Millipore, Bedford, MA).
RNA quantitation
RNA concentration was quantitatively determined by measurement of the phosphorus concentration using inductively coupled plasma-mass spectroscopy (ICP-MS) on a Perkin-Elmer Sciex ELAN 6000 ICP-MS (Table 1) at the Microscopy and Chemical Analysis Research Center at the Ohio State University. Five microliters of the RNA solution which could be used directly for the calorimetric measurements was diluted into 1 ml (total vol) of buffer [10 mM NaOH, 30 mM NaCl, pH 7.0 (adjusted by HEPES free acid)]. The concentration of phosphorus was estimated from the atomic absorption using the calibration curve obtained from standard phosphorus solutions of known concentration. The phosphorus concentration was then converted into the molecular concentration of the RNA. The extinction coefficient of the RNA in 10 mM NaOH, 30 mM NaCl, pH 7.0 (adjusted by HEPES free acid) is 146.10 cm–1 mM–1.
Table 1. Phosphate analysis: determination of RNA extinction coefficient.
| [Na+]a (mM) | OD260 nmb | [P]c (µΜ) | [RNA]d (mΜ) | ɛe (cm–1 mM–1) |
|---|---|---|---|---|
| 10 | 8.94 | 26.8 | 0.05826 | 153.45 |
| 20 | 7.59 | 25.9 | 0.05630 | 134.80 |
| 40 | 6.54 | 18.8 | 0.04870 | 134.29 |
| 80 | 6.18 | 19.1 | 0.04152 | 148.84 |
| 160 | 6.02 | 18.6 | 0.04044 | 144.88 |
| 320 | 6.22 | 18.3 | 0.03978 | 156.35 |
aBackground [Na+] concentration.
bOD at 260 nm.
cConcentration of phosphorus determined by ICP-MS.
dConcentration of RNA determined by ICP-MS, assuming a molecular weight for RNA of 7105.
eThe extinction coefficient determined from the data in columns 2 and 4.
Calorimetry experiments
The reaction buffer for dissolution of the RNA was prepared in a 50 ml tube. A 500 µl vol of 1.0 M NaOH was diluted with 15 ml of H2O. The pH was adjusted to 7.0 by adding 1 M HEPES free acid (∼1.4 ml). Subsequently a volume of 1.0 M NaCl was added to the required concentration, and finally the solution was transferred to a volumetric flask and the volume made up to 50 ml with dd-H2O. The buffered RNA solution (0.035–0.050 mM) was loaded into the reaction cell.
The stock of neomycin B to be loaded into the syringe was prepared as follows. To 5 ml of a 100 mM solution of neomycin B (Sigma, St Louis, MO) was added 100 µl of 1 M NaOH. Subsequently ∼70 µl of a 1 M HEPES solution was added dropwise to adjust the pH to 7.0, and then a volume of NaCl 1.0 M was added to adjust the ionic strength to the required level. Finally, the solution was transferred into the volumetric flask and the volume adjusted to 10 ml by addition of dd-H2O.
Calorimetry experiments were carried out with a stirring speed of 300 r.p.m. and the data collected at 25°C. The neomycin B solution (1.5–3 mM) was injected (15 µl ×16 injections from a 250 µl syringe) over a 10-s time interval, with 7 min between injections to allow complete equilibration and baseline recovery. The concentration of Na+ varied from 10 to 320 mM. Approximately 320 mM of Na+ was found to be the maximum limit for measurement.
Theoretical models
Polyelectrolyte theory. Binding constants can be analyzed in terms of polyelectrolyte theory according to equation 1 (25,26):
ln Keff = ln Kt° + Z·ζ–1 (ln (γ± δ)) + Z·ψ (ln [M+]) 1
where Z is the charge on the cation, ψ is the fraction of ions associated with each phosphate, Keff is the effective binding constant for a monovalent cation concentration [M+], Kt° is the ‘thermodynamic’ binding constant, γ± is the mean activity coefficient at a cation concentration [M+], and terms ζ and δ are numerical constants for RNA. Parameter Kt° reflects the contribution of non-electrostatic interactions to the binding of a ligand to a polyanion. In our case this can be ascribed to hydrogen bonding, an estimate of which can be made using equation 1, and from this ΔGt° = –RT ln Kt° can be calculated. We have used this approach previously in a detailed analysis of electrostatic and hydrogen bonding contributions for metal binding to RNA and DNA (22). The work of Epstein has demonstrated that the theory holds up well even for short oligonucleotides of only six bases in length, or longer (20). A systematic study of the variation of salt dependence with apparent binding affinity, K, will therefore provide the relative contributions from electrostatic and non-electrostatic binding interactions, which can then be further analyzed in terms of the structural model based on solution NMR studies from this laboratory and others (21).
Debye–Huckel theory. The salt dependence of binding events that are both dominated by electrostatic interactions and approximate to the interaction of spherical charged species can often be described in terms of the Debye–Huckel formalism (27). Considering the association between two ions, A+ and B–, the following relationship holds:
ΔG = –RT ln K0 – RT(z+│z–│CI1/2) 2
where K0 = [AB]/[A][B], neglecting non-ideal behavior, and C = (2πNAρA)1/2(e2/4πɛ0ɛr,AkT), where I is the ionic strength, NA is the Avogadro constant, k is Boltzmann’s constant, e is the proton charge, ɛ0 is the permittivity of vacuum, ρA is the solvent density and ɛr,A is the solvent dielectric constant. Therefore, ΔG (or K) versus I1/2 plot yields a straight line.
Structure calculations
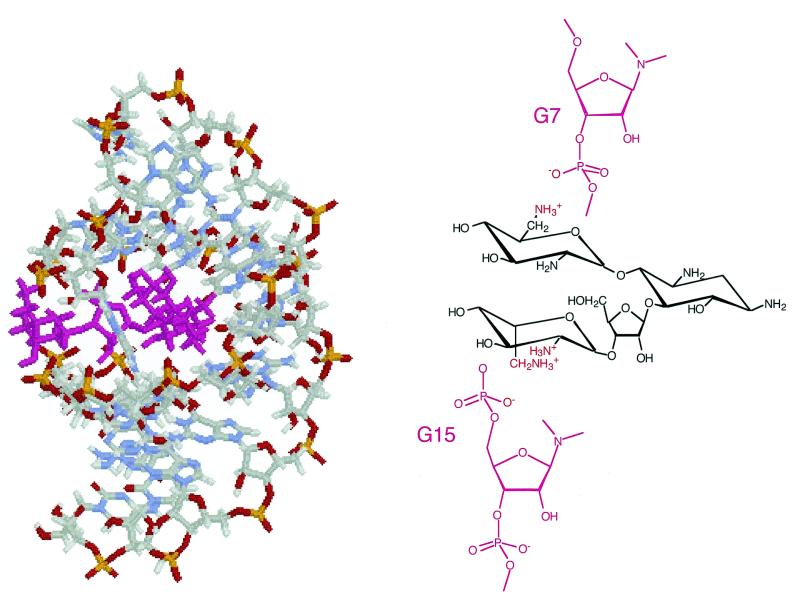
A complete description of the structural determination of the R23–neomycin B complex will be published elsewhere; however, a brief summary of how the structure illustrated in Figure 6 was generated is described here. A total of 326 restraints were used for molecular modeling, of which 244 were for R23, 52 for neomycin B and 20 for intermolecular NOEs between R23 and neomycin B. The hydrogen-bonding patterns of the base pairs were determined from analysis of NOESY spectra in H2O. Structure calculations were performed by use of the X-PLOR program. The starting structure of neomycin B was generated by use of the INSIGHT program. The charge on each atom of neomycin B was calculated using an AM3 force field with the MOPAC program, and the charge values were used in the structure calculations. The force field for neomycin B was adopted from the ‘topam3.cho’ force field in X-PLOR. The starting structure of R23 was also generated in an A-form using the INSIGHT program. Watson–Crick base pairing was maintained in the (G1–C9)·(G15–C23) stem region. The neomycin B molecule was placed in a randomized orientation in the major groove of R23, guided by the intramolecular NOE peaks. To completely randomize the starting structure of the complex, a random seed was given to each starting structure to generate initial velocities of all atoms. In this way 40 starting structures were created. Restrained molecular dynamics calculations were performed on the R23–neomycin B complex using a simulated annealing protocol in vacuo with a distance-dependent dielectric constant using the X-PLOR program. The starting structures were first minimized over 200 steps to avoid severe steric repulsion. The dynamics simulations were then performed at 1000 K over a period of 3 ps, during which time all of the distance restraints were added in a gradual manner. The simulated annealing protocol was continued by cooling from 1000 to 100 K over 100 ps, followed by Powell minimization. The structures were analyzed for NOE violations and covalent geometry. More than 50% of the structures were selected in this manner. A representative structure of R23 bound to neomycin B is shown in Figure 6, which is consistent with that of a recently published complex with an RNA analog of R23 (21).
Figure 6.
(Left) Illustration of the complex of R23 and neomycin B. Base A13 flips out of the loop and appears to form a latch across the groove where the aminoglycoside sits. This structural model is very similar to that of a complex with an RNA analog of R23 (21). (Right) Summary of key electrostatic contacts formed between the proximal phosphate groups and protonated amines. The other amines are shown explicitly as not-protonated for reason of clarity only.
RESULTS
Ligand binding stoichiometry
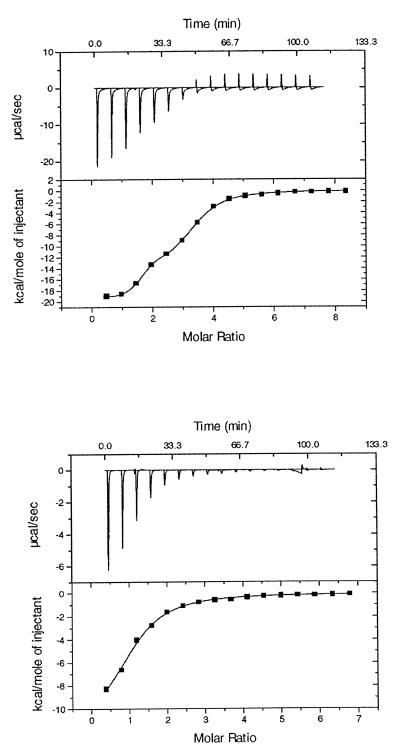
Figure 2 (top) shows a typical calorimetric profile for neomycin binding to R23, obtained at low ionic strength (10 mM Tris, 10 mM NaCl). The endothermic component at the end of the titration arises from the dilution effect of neomycin B. All data sets were satisfactorily fit after subtraction of the control data to correct for dilution effects. Under low salt conditions a two-site model was required for fitting. Although the high affinity class was populated by one neomycin ligand (ΔH1 = –21.6 kcal mol–1 and K1 = 1.78 × 10⁶ M–1 in 10 mM NaCl), fitting of the weaker class of sites required a stoichiometry of two ligands, with measured ΔH2 = –19.4 kcal mol–1 and K2 = 7.8 × 10⁴ M–1 in 10 mM NaCl. Under low salt conditions there apparently exists one tightly bound neomycin and two more weakly bound ligands of similar binding affinity. Increasing ionic strength washes out the two weakly bound ligands, and so with higher salt concentrations (>60 mM NaCl) the data was readily fit to a single site model with a stoichiometry of one (Fig. 2, bottom), with measured ΔH1 = –11.0 kcal mol–1 and K1 = 9.4 × 10⁴ M–1 in 80 mM NaCl.
Figure 2.
(Top) Calorimetric trace of aminoglycoside binding to a cognate 23mer RNA sequence, obtained at low ionic strength. A solution of RNA in a buffer (35 mM HEPES, 10 mM NaCl, pH 7) was titrated with aliquots of neomycin B in the same buffer. Calorimetry experiments were carried out with a stirring speed of 300 r.p.m. and the data were collected at 25°C. The neomycin B solution (2 mM) was injected (15 µl ×16 injections) from a 250 µl syringe over a 10-s time interval, with 7 min between injections to allow complete equilibration and baseline recovery. A two-site model was required to obtain a good fit to the data (χ2 = 214). A single site model showed significant deviations (χ 2 = 2.1 × 10⁵). (Bottom) Calorimetric trace obtained at high ionic strength (320 mM Na+). Other solution conditions were similar to those reported above.
Binding parameters for the high affinity site
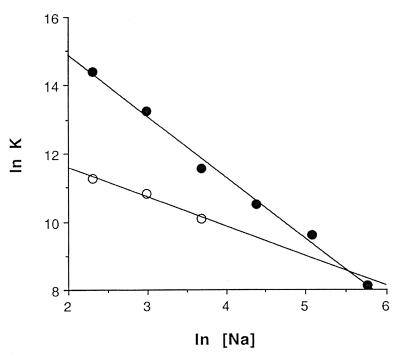
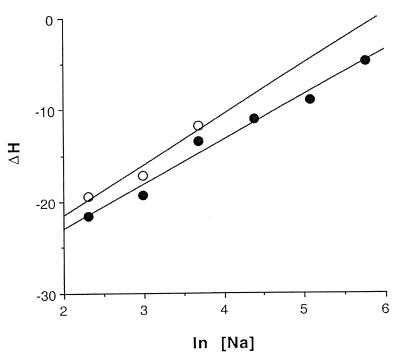
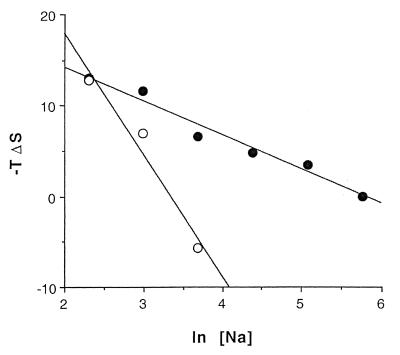
Binding affinities (K1) vary from 1.45 × 10⁶ M–1 in 10 mM NaCl to 3.3 × 10³ M–1 at 320 mM NaCl (Table 2A) and are enthalpically driven over this concentration range, although the entropic contribution becomes more important in the high salt range. The ΔH1 drops from –21.6 kcal mol–1 in 10 mM Na+ to –4.8 kcal mol–1 in 320 mM Na+, while ΔS1 varies from –44 cal K–1 mol–1 to ∼0 cal K–1 mol–1 over the same range. These parameters show a linear relationship with ln [Na+], including ln K1 (Fig. 3) ΔH1 and ΔS1 (Figs 4 and 5). By contrast, no relationship between these parameters and [Na+]1/2 is found that is consistent with the Debye–Huckel theory (no plot shown).
Table 2. Salt dependence of binding parameters for neomycin B complexed to R23 RNA.
| Na+ (mM) | ln K | ΔH (kcal mol–1) | ΔS (cal K–1 mol–1) | –TΔS (kcal mol–1) |
|---|---|---|---|---|
| (A) High affinity site | ||||
| 10 | 14.39 ± 0.1 | –21.6 | –44 | 13.1 |
| 20 | 13.26 ± 0.1 | –19.3 | –39 | 11.6 |
| 40 | 11.54 ± 0.08 | –13.4 | –22 | 6.6 |
| 80 | 10.50 ± 0.06 | –11.0 | –16 | 4.8 |
| 160 | 9.61 ± 0.06 | –9.0 | –12 | 3.5 |
| 320 | 8.12 ± 0.05 | –4.8 | 0 | 0 |
| (B) Low affinity site | ||||
| 10 | 11.27 ± 0.2 | –19.4 | –43 | 12.8 |
| 20 | 10.80 ± 0.2 | –17.2 | –23 | 6.9 |
| 40 | 10.07 ± 0.18 | –11.7 | –19 | 5.7 |
Calorimetric data for aminoglycoside binding to a cognate 23mer RNA sequence. A solution of RNA in a buffer (35 mM HEPES, pH 7, with varying NaCl) was titrated with aliquots of neomycin B in the same buffer.
Figure 3.
Plots of ln K versus ln [Na+] for the high affinity binding site (closed circles) and the low affinity binding sites (open circles).
Figure 4.
Plots of ΔH versus ln [Na+] for the high affinity binding site (closed circles) and the low affinity binding sites (open circles).
Figure 5.
Plots of –TΔS versus ln [Na+] for the high affinity binding site (closed circles) and the low affinity binding sites (open circles).
Binding parameters for the low affinity site
The calorimetric response from the two weak sites became immeasurably small above 40 mM Na+ (Table 2B). At lower ionic strength, binding parameters could be determined, although the error was higher relative to the tight binding case. Binding affinities (K2) vary from 7.8 × 10⁴ M–1 in 10 mM NaCl to 2.36 × 10⁴ M–1 in 40 mM NaCl. Similar to the situation for the high affinity site, over this concentration range the binding reaction is enthalpically driven, with an increasingly less favorable entropic component. Similar to the high affinity sites described immediately above, the data shows a variation with ln [Na+] that is consistent with polyelectrolyte theory (Figs 3–5), but not the Debye–Huckel theory.
DISCUSSION
Our studies have focused on the complex between neomycin B and a cognate RNA aptamer, R23. A solution structure has recently been published for a complex of neomycin B with a closely related aptamer (21). This structure is very similar to that determined independently in this laboratory for the complex with R23, and so the bonding patterns shown in Figure 6 have been independently verified.
Binding constants and ligand stoichiometry
The calorimetric data show that three neomycin B molecules bind to the 23mer RNA at low background salt concentration and only one neomycin B binds to R23 RNA at high background salt concentration. It has already been established that neomycin B binds to R23 RNA with low selectivity at low salt concentration, and a 1:1 stoichiometry is reported at high salt concentration (∼300 mM) (4,28,29), while Famulok and Huttenhofer (29) have reported Kd values 0.5–1000 µM for neomycin B binding to various RNAs from analytical affinity chromatography measurements. Although the experimental conditions were not the same, and no direct comparison is possible, our value of K1 ∼8 × 10⁴ M–1 is reasonably close to their results. Binding data has also been determined by surface plasmon resonance (28); however, this analysis was based on the use of Scatchard plots which typically yield inaccurate results (especially if the ligand–macromolecule stoichiometry exceeds 1:1) and provides no additional thermodynamic information. Also, the conditions of highest stringency used in the latter study included a relatively high concentration of NaCl (150 mM): conditions under which weakly bound aminoglycosides would readily dissociate and escape detection. Our results are consistent with the scope of previous findings, suggest a 3:1 binding ratio at lower background salt concentration and provide additional insight on the thermodynamic parameters and bonding mechanisms that promote recognition for target RNAs. An analysis of the parameters obtained for the well-defined tight binding site is presented below.
Hydrogen bonding and electrostatic contributions to binding energy
Aminoglycosides are highly charged at neutral pH, with the potential for strong electrostatic and hydrogen bonding interactions with the phosphate backbone of RNA, and base/sugar heteroatoms of the target RNA. Both types of interactions are experimentally observed in the solution structure shown previously in Figure 6, although the structure per se does not provide any insight on their relative magnitudes. The experimental results reported herein provide a direct measure of HB and ES contributions by examination of the salt dependence of K1, since only electrostatic contacts are competed for by increasing salt concentration.
According to polyelectrolyte theory, ln K1 versus ln [M+] yields a straight line and the slope of the plot, δlnK1/δln[M+], is equal to –m′ψ (equation 1). Since we do not know the exact value of ψ for the 23mer RNA, we have used the values for double-strand poly(A)·poly(U) (ψ = 0.89) (25), and for single-strand poly(A) and poly(U) (ψ = 0.78 and 0.68, respectively), for comparative purposes. Using ψ = 0.89 and –δlnK1/δln[M+] = 1.9 (Fig. 3) gives an m′ value of 2.1, while ψ = 0.68 gives m′ = 2.8, and so a reasonable range for m′ is 2.1–2.8 and is consistent with the structural model shown for the high affinity site in Figure 6, which predicts from two to three electrostatic contacts. The K1 value at [Na+] = 1 M, which accounts for the hydrogen bond interactions, is K10 = 5.9 × 10³ M–1.
Structural insight on hydrogen bonding and electrostatic stabilization of neomycin B binding to R23
Our low resolution solution structure of the neomycin B–R23 RNA complex (Fig. 6) shows that neomycin B at the high affinity site binds in the major groove at the top of the stem, and in close proximity to the loop. This structure shows excellent accord with a published structure for neomycin B complexed to an analog of R23 (21). The presence of G–U base pairs facilitate widening of the major groove and promotes binding of neomycin B to R23. The binding of neomycin B to the RNA major groove is not only mediated by electrostatic contacts from positively charged ammonium sites on the aminoglycoside to the negatively charged phosphates on the RNA backbone, but also by favorable hydrogen bonding from rings A and B of neomycin B to base residues in the RNA major groove (Fig. 6). We have quantitated the relative magnitudes of each binding component as described earlier. Figure 6 shows that only two phosphates form electrostatic contacts to, at most, three amino groups of neomycin B, and so an m′ value (equation 1) of ~2–3 is expected, and is consistent with the experimentally determined value of 2.1. The neomycin B binding pocket contains negatively charged phosphate oxygens from bases 4 and 15 that are clustered around the opening of the major groove and are within range for both hydrogen bonding and electrostatic contacts with amines on rings A and D (Fig. 6). Apparently most of the protonated amines of neomycin B located on rings A and B bind via hydrogen bonding.
Both rings A and B of neomycin are required for recognition of R23 and are buried inside the major groove, while ring C is positioned in the middle of the groove and ring D is located at the outer surface. In particular, the amino group on ring A seems to be a key structural feature that promotes recognition of R23, since alteration of the amino group on ring A (Fig. 1) abolishes binding (12,13).
There have been several previous efforts to predict both the conformations of RNA-bound aminoglycosides, and the factors contributing to the binding energies. These have included both computational studies (30) and evaluation of the binding affinities of derivative aminoglycoside ligands (7,19,31–33). It is important to note that the approach that we have used to distinguish H-bonding and electrostatic contributions avoids the use of aminoglycoside derivatives that may either bind to a target RNA in a distinct fashion, or perturb the RNA tertiary structure. Similarly, the use of chemical interference studies to investigate which nucleotides are important for aminoglycoside binding may result in changes in the tertiary structure of the RNA and thereby perturb the binding mode of the ligand.
In a previous report on neomycin B binding to the hammerhead ribozyme the importance of ionic contacts between the charged amino groups of the aminoglycoside and the phosphate backbone of the RNA was emphasized (7,33). However, the data reported are also consistent with the dominance of H-bonding, as described in this work. Rando and coworkers (31) have also demonstrated the lack of significant ionic contacts for RNA aptamers that bind to tobramycin by use of ethylation interference experiments and Ce(III)-mediated footprinting experiments. In general, the use of activity as a monitor of aminoglycoside binding to ribozymal RNA may afford binding constants, but does not discriminate electrostatic from hydrogen-bonding contributions as suggested in several recent reports (7,19,33).
Finally, in a crystallographic study of aminoglycoside binding to hammerhead RNA (34), it was observed that the intramolecular ammonium distances of the aminoglycoside span ranges similar to the interionic distances between crystallographically defined Mg2+ ions. Inasmuch as these displaced Mg2+ ions are hexahydrated and interact with the RNA in an outer sphere fashion by hydrogen bonding through the waters of hydration, this supports the notion that hydrogen bonding is a critical and most likely dominant contributor to binding free energy and recognition.
Enthalpic and entropic terms
Both ΔH1 and ΔS1 are negative and become less negative with increasing monovalent salt concentration, and so formation of the aminoglycoside–RNA complex is enthalpically driven. With increasing background salt concentration, the binding becomes less enthalpically favorable and more entropically driven, since δΔH1/δ[M+] and δΔS1/δ[M+] are positive. At 1 M of Na+ concentration, ΔH10 = –0.7 kcal mol–1 and ΔS10 = +73 cal K–1 mol–1. Thus, the contribution from hydrogen bonding is enthalpically and entropically driven, while the electrostatic interaction is enthalpically driven in the experimental background salt concentration range. The more positive ΔH1 found with increasing monovalent cation concentration reflects weaker interactions between the RNA and neomycin B. The more positive ΔS1 with increase of monovalent cation is due to the disturbance of the solvent sphere between the RNA and neomycin B.
Implications for drug design
The dominance of hydrogen bonding provides a satisfactory explanation for the recognition of cognate RNA motifs by aminoglycosides. The directional characteristics of the H-bond convey a dependence on the stereochemistry and positions of -NH2 and -OH functional groups on the aminoglycoside rings, and provides an explanation for the dramatic variations of binding affinity with subtle changes in stereochemistry experimentally observed (6,30–32,35). Such variation is not readily accounted for by electrostatics. In this context, it is significant that capreomycin and viomycin, which are more positively charged than neomycin B, failed to interact with the RRE and inhibit the Rev binding function (6), supporting an important role for directed hydrogen bond formation in promoting strong and selective binding. A comparative study of various neomycin B derivatives (neamine, paromomycin and ribostamycin) with the A-site of 16S rRNA has been carried out by Fourmy et al. (12,13). Their studies have indicated that rings A and B are critical for neomycin B–RNA recognition, and that these two rings are again engaged in significant hydrogen bonding interactions with conserved base residues in the A-site of 16S rRNA. Efforts to form metal derivatives of aminoglycosides should therefore focus on the non-essential rings and preserve the binding core of rings A and B.
CONCLUSIONS
Molecular recognition of nucleic acids can arise by virtue of binding specificity at the level of primary and secondary structure; however, it is at the level of tertiary structure that the highest level of selectivity with non-nucleotide ligands should be achieved. Retroviruses contain single strands of RNA that are folded into complex secondary and tertiary conformations, including local regions of duplex structure, that may distort as a result of base mismatches, bulges, pseudoknots and hairpins. Few non-nucleotide ligands possess secondary structural specificity; however, recognition at the level of tertiary structure is particularly relevant for structured RNA motifs. Accordingly, compounds capable of specific binding to RNA over DNA are attractive targets for development of anti-viral drugs. Structural elucidation of the R23 RNA–aminoglycoside complex has allowed us to explore and detail the structural factors that are responsible for the specificity of the interaction, and to relate these to a detailed consideration of thermodynamic binding parameters. In particular, the principal mechanism for recognition and binding of neomycin B to the RNA major groove is mediated by hydrogen bonding. At physiological ionic strengths ~80% of the binding energy derives from hydrogen bonding from rings A and B. In addition to this unique high affinity site (K1 = 1.78 × 10⁶ M–1 in 10 mM NaCl), two weakly bound aminoglycosides are detected calorimetrically (K2 = 7.8 × 10⁴ M–1 in 10 mM NaCl) under conditions of low, non-physiological ionic strength. For both the high and low affinity sites, binding is enthalpically driven (ΔH1 = –21.6 kcal mol–1, –TΔS1 = 13.1 kcal mol–1, in 10 mM NaCl, and ΔH2 = –19.4 kcal mol–1, –TΔS1 = 12.8 kcal mol–1, in 10 mM NaCl). The dominance of hydrogen bonding provides a satisfactory explanation for the recognition of cognate RNA motifs by aminoglycosides. The directional characteristics of the H-bond convey a dependence on the stereochemistry and positions of -NH2 and -OH functional groups on the aminoglycoside rings, and provides an explanation for the dramatic variations of binding affinity with subtle changes in stereochemistry experimentally observed. Such variation is not readily accounted for by electrostatics.
Acknowledgments
ACKNOWLEDGEMENTS
This work was supported by a grant from the Petroleum Research Fund, administered by the American Chemical Society and the National Science Foundation, CHE-9706904. J.A.C. is a Camille Dreyfus Teacher-Scholar (1994–1999).
REFERENCES
- 1.Moazed D. and Noller,H.F. (1987) Nature, 327, 389. [DOI] [PubMed] [Google Scholar]
- 2.von Ahsen U., Davies,J. and Schroeder,R. (1992) J. Mol. Biol., 226, 935–941. [DOI] [PubMed] [Google Scholar]
- 3.Wallis M.G., Streicher,B., Wank,H., von Ahsen,U., Clodi,E., Wallace,S.T., Famulok,M. and Schroeder,R.(1997) Chem. Biol., 4, 357–366. [DOI] [PubMed] [Google Scholar]
- 4.Wallis M.G., Ahsen,U., Schroeder,R. and Famulok,M. (1995) Chem. Biol., 2, 543–552. [DOI] [PubMed] [Google Scholar]
- 5.Purohit P. and Stern,S. (1994) Nature, 370, 659–662. [DOI] [PubMed] [Google Scholar]
- 6.Zapp M.L., Stern,S. and Green,M.R. (1993) Cell, 74, 969–978. [DOI] [PubMed] [Google Scholar]
- 7.Stage T.K., Hertel,K.J. and Uhlenbeck,O.C. (1995) RNA, 1, 95–101. [PMC free article] [PubMed] [Google Scholar]
- 8.Mei H.-Y., Galan,A.A., Halim,N.S., Mack,D.P., Moreland,D.W., Sanders,K.B., Truong,H.N. and Czarnik,A.W. (1995) Bioorg. Med. Chem. Lett., 5, 2755. [DOI] [PubMed] [Google Scholar]
- 9.Battiste J.L., Mao,H., Rao,N.S., Tan,R., Muhandiram,D.R., Kay,L.E., Frankel,A.D. and Williamson,J.R. (1997) Science, 273, 1547–1551. [DOI] [PubMed] [Google Scholar]
- 10.Batey R.T., Battisite,J.L. and Williamson,J.R. (1995) Methods Enzymol., 261, 300–322. [DOI] [PubMed] [Google Scholar]
- 11.Battiste J.L., Tan,R., Frankel,A.D. and Williamson,J.R. (1995) Biomolec. NMR, 6, 375–389. [Google Scholar]
- 12.Fourmy D., Recht,I.M. and Puglisi,J.D. (1998) J. Mol. Biol., 277, 347–362. [DOI] [PubMed] [Google Scholar]
- 13.Fourmy D., Yoshizawa,S. and Puglisi,J.D. (1998) J. Mol. Biol., 277, 333–345. [DOI] [PubMed] [Google Scholar]
- 14.Peterson R.D., Bartel,D.P., Szostak,J.W., Horvath,S.J. and Feigon,J. (1994) Biochemistry, 33, 5357–5366. [DOI] [PubMed] [Google Scholar]
- 15.Peterson R.D. and Feigon,J. (1996) J. Mol. Biol., 264, 863–877. [DOI] [PubMed] [Google Scholar]
- 16.Varani G. and Tinoco,I.,Jr (1991) Q. Rev. Biophys., 24, 479–532. [DOI] [PubMed] [Google Scholar]
- 17.Sreedhara A., Patwardhan,A. and Cowan,J.A. (1999) Chem. Commun., 1147–1148. [Google Scholar]
- 18.Sreedhara A. and Cowan,J.A. (1998) J. Chem. Soc. Chem. Commun., 1737–1738. [Google Scholar]
- 19.Wang H. and Tor,Y. (1997) J. Am. Chem. Soc., 119, 8734–8735. [Google Scholar]
- 20.Epstein I.R. (1978) Biophys. Chem., 8, 327–339. [DOI] [PubMed] [Google Scholar]
- 21.Jiang L., Majumdar,A., Hu,W., Jaishree,T.J., Xu,W. and Patel,D.J. (1999) Structure, 7, 817–827. [DOI] [PubMed] [Google Scholar]
- 22.Black C.B. and Cowan,J.A. (1994) J. Am. Chem. Soc., 116, 1174–1178. [Google Scholar]
- 23.Milligan J.F. and Uhlenbeck,O.C. (1989) Methods Enzymol., 180, 51–62. [DOI] [PubMed] [Google Scholar]
- 24.Wyatt J.R., Chastain,M. and Puglisi,J.D. (1991) Biotechniques, 11, 764–769. [PubMed] [Google Scholar]
- 25.Record M.T., Lohman,T.M. and de Haseth,P. (1976) J. Mol. Biol., 107, 145–158. [DOI] [PubMed] [Google Scholar]
- 26.Record M.T., Anderson,C.F. and Lohman,T.M. (1978) Q. Rev. Biophys., 11, 145–158. [Google Scholar]
- 27.Petrucci S. (1972) Ionic Interactions, 1, 117–177. [Google Scholar]
- 28.Hendrix M., Priestley,E.S., Joyce,G.F. and Wong,C.-H. (1997) J. Am. Chem. Soc., 119, 3641–3648. [DOI] [PubMed] [Google Scholar]
- 29.Famulok M. and Huttenhofer,A. (1996) Biochemistry, 35, 4265–4270. [DOI] [PubMed] [Google Scholar]
- 30.Leclerc F. and Cedergren,R. (1998) J. Med. Chem., 41, 175–182. [DOI] [PubMed] [Google Scholar]
- 31.Cho J., Hamasaki,K. and Rando,R.R. (1998) Biochemistry, 57, 4985–4992. [DOI] [PubMed] [Google Scholar]
- 32.Hamasaki K., Killian,J., Cho,J. and Rando,R.R. (1998) Biochemistry, 57, 656–663. [DOI] [PubMed] [Google Scholar]
- 33.Clouet-d’Orval B., Stage,T.K. and Uhlenbeck,O.C. (1995) Biochemistry, 34, 11186–11190. [DOI] [PubMed] [Google Scholar]
- 34.Hermann T. and Westhof,E. (1998) J. Mol. Biol., 276, 903–912. [DOI] [PubMed] [Google Scholar]
- 35.Wang Y. and Rando,R.R. (1995) Chem. Biol., 2, 281–290. [DOI] [PubMed] [Google Scholar]


