


Abstract
Transfer of alanine from Escherichia coli alanyl-tRNA synthetase (AlaRS) to RNA minihelices that mimic the amino acid acceptor stem of tRNAAla has been shown, by analysis of variant minihelix aminoacylation activities, to involve a transition state sensitive to changes in the ‘discriminator’ base at position 73. Solution NMR has indicated that this single-stranded nucleotide is predominantly stacked onto G1 of the first base pair of the alanine acceptor stem helix. We report the activity of a new variant with the adenine at position 73 substituted by its non-polar isostere 4-methylindole (M). Despite lacking N7, this analog is well tolerated by AlaRS. Molecular dynamics (MD) simulations show that the M substitution improves position 73 base stacking over G1, as measured by a stacking lifetime analysis. Additional MD simulations of wild-type microhelixAla and six variants reveal a positive correlation between N73 base stacking propensity over G1 and aminoacylation activity. For the two ΔN7 variants simulated we found that the propensity to stack over G1 was similar to the analogous variants that contain N7 and we conclude that the decrease in aminoacylation efficiency observed upon deletion of N7 is likely due to loss of a direct stabilizing interaction with the synthetase.
INTRODUCTION
Fidelity in translation of the genetic code depends, in part, upon the ability of aminoacyl-tRNA synthetases to covalently attach the correct amino acid to the 3′-end of their cognate tRNAs. This is accomplished in a two-step reaction in which the amino acid is first activated to form an aminoacyl–adenylate intermediate. In the second step, the amino acid is transferred to the 3′-end of the tRNA. Understanding how synthetases distinguish between tRNAs that may possess similar structural and chemical characteristics is therefore central to understanding the accuracy of protein translation. The original ‘discriminator site’ hypothesis correlated the nature of the fourth base from the 3′-end of the tRNA, the ‘discriminator’ base (N73), to the chemical structure of the attached amino acid (1). Although the details of this early hypothesis were not entirely correct, in most aminoacylation systems the discriminator base is indeed an important synthetase recognition element (2,3).
In tRNAAla all the primary recognition elements, which include the A73 discriminator base, are contained in the amino acid acceptor stem (4,5). Indeed, RNA microhelices and duplexes that mimic the tRNAAla acceptor stem are efficiently charged with alanine by Escherichia coli alanyl-tRNA synthetase (AlaRS) (6,7). Biochemical studies have found that mutation of wild-type A73 to other naturally occurring bases reduces aminoacylation activity, but does not abolish it as long as the critical G3:U70 base pair is present (8,9). Thus, the G3:U70 base pair is the major determinant that marks a tRNA molecule for alanine acceptance (10,11), but the N73 position remains a modulating element (Fig. 1; 8).
Figure 1.

Sequence of E.coli microhelixAla examined in this study with the A73 discriminator base position circled and the critical 3:70 position required for aminoacylation boxed.
Substitution of A73 by any of the naturally occurring bases has been shown to slow transfer of the activated amino acid to the 3′-end of the tRNA (9). A recent study that examined contributions of specific N73 functional groups to aminoacylation activity revealed that the exocyclic amino group of A73 was not a major recognition element, although substitution of this functional group with a keto oxygen resulted in negative discrimination (12). In addition, exchange of the major groove N7 with CH resulted in a 14-fold decrease in aminoacylation activity (12).
Biochemical studies have also indicated that pyrimidine substitutions at N73 are not well tolerated (8,9,12). A purine, when present as a dangling 3′-nucleotide at the end of an RNA (13–15) or DNA (16) duplex, is generally more stabilizing than a pyrimidine at the same position. This stability is primarily due to improved stacking interactions with the adjacent terminal base pair. In the present study we describe molecular dynamics (MD) simulations designed to probe whether specific functional groups at position 73 exert their effect via a direct or an indirect mechanism, where the latter influence may be realized through changes in base stacking propensities. MD simulations of the wild-type A73-containing microhelixAla (A73) and six purine 73 variants [containing guanine (G73), hypoxanthine (I73), 7-deazaadenine (7DAA73), 2-aminoadenine (2AA73), 4-methylbenzimidazole (Z73) and 4-methylindole (M73)] have been carried out. Figure 2 summarizes the in vitro aminoacylation activities and the chemical structures of these variants. Our results reveal a strong positive correlation between aminoacylation activity and the propensity for a base at position 73 to stack over G1. Our data also support the conclusion that major groove recognition at position N7 occurs via a direct mechanism.
Figure 2.

Chemical structures of N73 microhelixAla variants and their respective aminoacylation activities (12; this study) given in ΔΔG‡ (kcal/mol), which is defined as –RTln[(kcat/KM)variant/(kcat/KM)wild-type]. Aminoacylation assays were carried out with the 2′-deoxynucleotide version of the base analogs M, 2AA and 7DAA. ND indicates that the aminoacylation activity has not yet been determined.
MATERIALS AND METHODS
RNA preparation
Solid phase synthesis of RNA oligonucleotides was accomplished using TOM-protected phosphoramidite monomers on a Pharmacia Gene Assembler Special (17). All RNA synthesis reagents, including the 2′-deoxy-4-methylindole phosphoramidite monomer, were purchased from Glen Research (Sterling, VA). The oligonucleotides were purified on 16% polyacrylamide gels, eluted and desalted as described (18,19).
Aminoacylation assays
Escherichia coli AlaRS was purified as previously described (20). Aminoacylation assays were carried out using RNA duplexAla substrates (3′-ribotridecamer annealed to a 5′-ribononamer) essentially as described (7). Duplexes were annealed immediately before use by heating at 80°C for 2 min, cooling to 60°C for 2 min, adding MgCl2 to 10 mM and placing on ice. RNA duplexes (4.5 µM) and all other assay components were pre-equilibrated at room temperature prior to initiating the reaction with AlaRS (45 nM). Initial rates of aminoacylation are proportional to RNA concentration under the conditions used in these experiments. Thus, the initial velocity is an accurate reflection of kcat/Km.
Simulation protocol
Simulations of the G73, I73, 7DAA73, 2AA73, Z73 and M73 microhelix variants were all performed according to the protocol described previously for the wild-type A73 microhelixAla (21); we recapitulate here only the most important details. Initial microhelix structures were derived from a high resolution NMR structure of the E.coli microhelixAla determined by Ramos and Varani (22). The microhelices were surrounded by sodium counterions and 9 Å of TIP3P (23) water. Particle mesh Ewald (PME) (24) was used to account for long range electrostatic interactions. Analysis of simulation data was over a 2.0 ns trajectory generated using the SANDER module of AMBER 5.0 (25,26) with a 2.0 fs time step. The SHAKE algorithm (27) was applied to all hydrogen atoms and the non-bonded interactions cut-off was set to 9.0 Å. The pair list was updated every 25 steps. Constant pressure (1 bar) and temperature (300 K) were maintained according to the Berendsen (28) coupling algorithm. The equilibration protocol followed the method of Cheatham and Kollman (29; see also http://www.amber.ucsf.edu/amber/tutorial/polyA-polyT ), after which an additional 500 ps equilibration was performed under production conditions. In the case of 7DAA73, the additional equilibration was for 2200 ps.
The CARNAL module of AMBER 5.0 was used to analyze the trajectories. Helical parameters (30,31) were analyzed using the program CURVES 5.3 (32). Static structures and trajectory dynamics were visualized using Insight (33) and VMD (34), respectively. Properties [including helical parameters, averages, root mean square deviations (RMSDs) and base stacking analyses] were computed over all 2000 1 ps snapshots of the 2.0 ns production run period.
Force-field parameters
Simulations employed the Cornell et al. (35) force field as implemented in AMBER 5.0 (25,26). Extension of this force field by definition of parameters (atom types, force constants, equilibrium values and partial atomic charges) for I and 2AA has been presented elsewhere (21). The equivalent data for non-standard nucleotides 7DAA, M and Z are provided in Supplementary Material. Atom types, force constants and equilibrium values were assigned based on analogy to previously defined bases and/or the tryptophan side chain. Partial atomic charges were derived by fitting to Hartree–Fock (36) electrostatic potentials (ESP) calculated with the 6-31G* basis set (37–39) and normalizing to the existing force field (35,40). Electronic structure calculations were carried out using Gaussian 98, revision A.6 (41).
RESULTS
Aminoacylation activity of M73 microhelixAla
It was previously determined that placing a deoxynucleotide at position 73 of duplexAla has no effect on aminoacylation (42). Here we show that replacing the wild-type discriminator base with the modified deoxynucleotide analog M leads to a reduction in aminoacylation of only 2.9 ± 0.0086-fold (Fig. 2). This modification replaces the N7 nitrogen with a methine carbon atom and additionally places a methyl group in the major groove position normally occupied by an amino group. The reduction in activity with M (~3-fold) is significantly less than the 14-fold reduction observed upon incorporation of 7DAA at position 73 (12; Fig. 2). The latter analog contains only the N7 substitution and the comparison suggests that the additional methyl group present in the M analog has a positive impact on the efficiency of aminoacylation.
Simulation convergence
Meaningful interpretation of MD simulations requires that trajectories sample relevant regions of conformational phase space. One measure of whether this criterion is satisfied for a given trajectory is the stability of various structural characteristics over the time course of the analysis. Figure 3 details the RMSD of each structure from its average over the 2 ns production period (RMSDs from starting structures are provided in Supplementary Material). The RMSDs fluctuate within a small range about converged values in all cases. A similar analysis was carried out for various helical parameters, including base pair inclination, local twist and x-displacement from the global helix axis (30,31). In every case, the trajectories fluctuated over a small range about a converged average value (see Supplementary Material). Such dynamic behavior is consistent with a system that is statistically converged (43,44), thereby ensuring that further analysis of the trajectory is thermodynamically justified.
Figure 3.
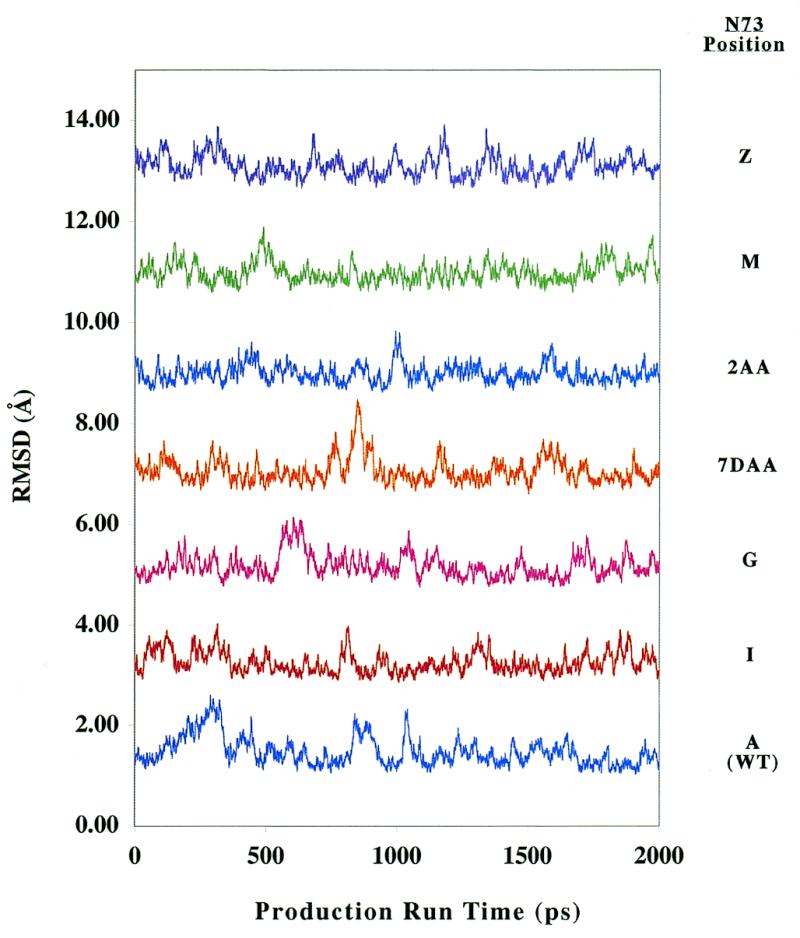
RMSDs (Å) from average structures taken over the production run portion of each trajectory. Values have an arbitrary 0 and are calculated excluding the single-stranded region of the microhelix.
2-Dimensional (2D) stacking analysis
To define the stacking of N73 over the G1:C72 base pair, it is helpful to define a 2D coordinate system. In this instance we define the first coordinate to be the distance between the centers of mass (COMs) of the six-membered rings of the N73 and G1 bases. The second coordinate is defined as the distance between the COM of the five-membered ring of N73 and the COM of the six-membered ring of C72. Figure 4 provides plots in this coordinate system that illustrate the stacking behavior of the wild-type and five variant microhelices for each of the 2000 data points analyzed in their respective trajectories. To facilitate the analysis, this representation of stacking space is divided into four quadrants. In particular, the first, second, third and fourth quadrants represent structures in which (I) rN73–C72 > 4.0 Å and rN73–G1 < 4.0 Å, (II) rN73–C72 and rN73–G1 < 4.0 Å, (III) rN73–C72 < 4.0 Å and rN73–G1 > 4.0 Å and (IV) rN73–C72 and rN73–G1 > 4.0 Å, respectively, where r is the relevant COM distance. Structures in the various quadrants can thus be characterized as having (I) an N73 base stacking over G1, (II) an N73 base positioned between G1 and C72, (III) an N73 base stacking over C72 and (IV) an N73 base that is not stacked over either base.
Figure 4.

Two-dimensional plots of N73 stacking over the G1:C72 base pair. The quadrants indicated by the intersecting solid lines are defined in the subsection of the text entitled 2D stacking analysis. In the above plots the abscissa is the distance (Å) between the COMs of the six-membered rings of the N73 and G1 bases. The ordinate is defined as the distance between the COM of the five-membered ring of N73 and the COM of the six-membered ring of C72.
Refinement of stacking categories
As an alternative presentation of the stacking data, we calculate the percentage of total simulation time that the N73 base occupied a particular stacking category (Fig. 5). Data points are assigned to quadrants as described above with one additional constraint. To be considered to occupy quadrant I, II or III the inter-base rise between N73 and C72 must be between 3.0 and 6.0 Å. If the inter-base rise is >6.0 or <3.0 Å, which can occur for certain conformations that either tilt N73 strongly or roll it out from the helical axis, then the N73 base is considered not to be stacked and is assigned to quadrant IV. In essence, this third dimensional requirement restricts the relative orientations of the N73 and G1:C72 bases so that quadrants I, II and III are only occupied by true stacked configurations. (Rise in a single strand of DNA is defined for sequential bases. Thus, when N73 stacks over G1, rise values for N73/C72 can be as large as 6 Å because the G1:C72 base pair distorts to improve the N73/G1 stacking interaction. Of course, any choice of cut-off is arbitrary, but visualization of a large number of structures suggests that use of a rise constraint helps to separate the qualitatively different stacking arrangements observed in the various systems. Note that in quadrant III the COM constraint prevents rise values much in excess of 4 Å, so it is not possible for water molecules to intercalate between the bases in any of the first three quadrants.)
Figure 5.

Percentage of total simulation time that a particular N73 base was found in each of the four stacking quadrants (I–IV) as defined in Figure 4 and in the text.
This approach quantifies the qualitative observations that can be drawn from Figure 4. For example, inspection of Figure 4 indicates that 2AA73 appears to have a very large percentage of stacking interactions falling in quadrant I (stacking over G1) while I73 has a considerably smaller such percentage. Figure 5 indicates the difference as representing ~35% of the total simulation time. Overall, the total stacking over G1 is largest for Z73, M73 and 2AA73, somewhat smaller for A73 and 7DAA73 and considerably smaller for G73 and I73.
Stacking lifetimes
In cases where stacking of N73 over G1 was observed (i.e. occupation of quadrant I and an inter-base rise between 3.0 and 6.0 Å) we computed the total lifetime of that interaction as defined by its continuation over consecutive 1 ps snapshots; individual lifetimes were considered terminated when an unstacked structure persisted for >5 ps. Those data are presented for each variant in Table 1, with the data broken down into the percentage contribution of ranges of stacking lifetimes to the total simulation time. More than half of the total simulation time for variants Z and 2AA involved structures with stacking interactions persisting for >500 ps. In the case of variants A and 7DAA, lifetimes in excess of 500 ps were not observed, but more than half of the simulation time involved structures with stacking interactions ranging from 200 to 500 ps. Stacking interactions in variants G and I were much more short lived, with more than half the simulation time involving stacking interactions of <100 ps.
Table 1. Contribution of stacking lifetime ranges to total simulation time and normalized RMS lifetimes χ for all variantsa.
| Variant | Stacking lifetime |
χb | ||||
|---|---|---|---|---|---|---|
| Not stacked | 1–100 | 101–200 | 201–500 | >500 | ||
| Z | 1.7 | 8.3 | 24.4 | 0.0 | 65.7 | 370 |
| M | 2.9 | 6.5 | 9.9 | 51.9 | 28.9 | 319 |
| 2AA | 8.7 | 2.9 | 8.1 | 21.4 | 59.1 | 329 |
| A (wild-type) | 12.3 | 28.3 | 7.0 | 52.5 | 0.0 | 106 |
| 7DAA | 19.5 | 16.6 | 8.2 | 55.8 | 0.0 | 109 |
| G | 35.6 | 32.5 | 11.8 | 20.3 | 0.0 | 42 |
| I | 33.6 | 35.2 | 17.7 | 13.6 | 0.0 | 36 |
aStacking lifetimes and χ are in ps while the contribution of stacking lifetime ranges to the total simulation time are tabulated as percent of total simulation time.
bEquation 1 in the text.
Table 1 also lists the normalized root mean square (RMS) stacking lifetime χ defined as
χ = ![]()
![]() 1
1
where i is an index of the total number N of observed stacking lifetimes τi. The parameter χ thus provides a single value measure of stacking propensity as the product of the RMS lifetime for non-zero lifetimes and the fraction of simulation time exhibiting stacking.
DISCUSSION
Modeling base stacking
Studies employing high levels of electronic structure theory to evaluate base–base stacking energies have recently begun to appear (45–55). Such studies have been particularly useful in identifying fundamental aspects of stacking interactions and trends as a function of the involved bases. Thus, for instance, it has been observed that in the gas phase purine–purine stacks are strongest, followed by purine–pyrimidine stacks, followed by pyrimidine–pyrimidine stacks. Florían et al. (55) showed that this prediction continues to hold true even after inclusion of aqueous solvation effects into the theoretical model, which is in good agreement with available measurements (56–60).
In the full helix environment, unfortunately, it is not practical to carry out MD simulations with quantum chemical methods, particularly the high level methods required to accurately calculate stacking interactions. Hobza et al. (61) have compared results from six different classical force fields (as well as several approximate quantum chemical schemes) to high level stacking energies and experimental and computed geometries and concluded that the force field of Cornell et al. (35) provides the best agreement with the high level data. These studies motivated our choice of the Cornell et al. force field for this work.
Description of stacking behavior
One phenomenon expected to influence stacking propensity is the electrostatic interaction between N73 and G1. The presence of carbonyl groups in G1 makes its π system relatively electron poor, so that stacking with purines characterized by electron-rich π systems (i.e. purines substituted with good electron donors, like amino groups) would be expected to be more favorable. A different phenomenon involves the hydrophobicity of N73; increased hydrophobicity will favor stacked arrangements over non-stacked, although it is not necessarily obvious that stacking over G1 will be preferred over C72.
Considering first the wild-type microhelixAla, the simulation results indicate that A73 prefers to inter-strand stack over G1 for 70% of the simulation time (Fig. 5, category I). This stacking tendency is consistent with NMR studies of microhelixAla, which have shown that A73 not only shares NOEs with G1, but it also protects G1 from solvent exchange (22,62,63). Thermodynamic measurements of ΔG°stacking in RNA indicate 3′-terminal A stacking over a G:C base pair in general to be thermodynamically favorable (14,64). Relating this stacking interaction to AlaRS aminoacylation activity, Ramos and Varani have hypothesized that the A73 interaction with the G1:C72 base pair affects the orientation of the remaining CCA end so as to stabilize the transition state (22).
Now considering variants of A73, the 2AA73 base is predicted by our analysis to stack over G1 with greater frequency than the wild-type A73 base, while G73 and I73 stack with markedly lower frequency than A73 (Fig. 5); analysis of stacking lifetimes further quantifies the differences between these variants (Table 1). The parameter χ, in particular, indicates the variants roughly group into three categories, with Z, M and 2AA exhibiting persistent and long-lived stacking interactions, A and 7DAA showing shorter lived but still significant interactions and G and I having only rare stacking interactions.
The lifetime analysis thus provides some information about the shape of the local potential energy surface associated with stacking. For the cases of G73 and I73 we may infer a rather flat surface associated with stacking/unstacking, i.e. there is considerable flexibility in the stacking geometries. Conversely, stacking in 2AA73 creates a structure that may be considered to lie in a well on the potential energy surface that has relatively steeper sides in the direction of unstacking. This behavior can be correlated with the shape of the stacking distributions in Figure 4. The pattern for 2AA73 stacking is a much tighter distribution than that for I73, suggesting that I73 samples a greater volume of phase space over the course of the simulation.
The trends for 2AA73, A73, G73 and I73 are consistent with electrostatic interactions contributing to stacking proclivity. Purine 2AA has the most electron-rich π system with two substituent amino groups, A has one amino group, G includes an electron-withdrawing carbonyl group in addition to the amino group and I has only a carbonyl group (Fig. 2).
Although the differences in stacking behavior for the purines are subtle, there is good precedent for such differences to have measurable consequences. For instance, Metzger et al. (65) found the melting temperature of a human tRNALeu microhelix to decrease when the wild-type A73 was substituted by G73, even though NMR spectra for each variant indicated identical conformations for the CCA ends.
Turning now to a comparison of A73 to 7DAA73, the MD analysis finds little difference between the two with respect to stacking interactions. This predicted insensitivity to N versus CH at the 7 position is also observed in a comparison of Z73 to M73 (Fig. 5). Such results are consistent with thermodynamic studies of dangling ends, which have found that such subtle changes in functional groups have little effect on base–base stacking (66).
Both M73 and Z73 are, however, predicted to stack over G1 with greater frequency than does the wild-type A73 base. The M73 substitution was chosen specifically because of previous work (16) demonstrating that the increased hydrophobicity of this analog relative to adenine contributes to enhanced purine–purine stacking, and the present results are thus consistent with expectations. Experimental data are not available for the behavior of Z-containing microhelixAla, but as noted above the similar stacking behavior of Z73 and M73 is consonant with the similarity between A73 and 7DAA73.
Implications for aminoacylation activity
Comparing the stacking behavior observed in the simulations with the experimental aminoacylation activities (Fig. 2), it appears that the variants fall into two distinct classes. Activities have been measured for four cases where a nitrogen atom is present at purine ring position 7, namely wild-type A73, 2AA73, G73 and I73, and the efficiency of aminoacylation correlates with the tendency for N73 to stack over G1, i.e. 2AA > A > G > I (although there is only a small degree of distinction between G and I). This suggests that enhanced stacking facilitates aminoacylation, consistent with the hypothesis of Ramos and Varani (22) that the flexibility of the CCA single-stranded region may be reduced by a strong stacking interaction between N73 and G1. Such reduced flexibility would decrease the entropy loss that accompanies forming the activated complex for aminoacylation and thus lower the free energy of activation.
The other class of data is comprised of 7DAA73 and M73, each of these bases lacking a nitrogen atom at the heterocyclic 7 position. The simulations indicate 7DAA73 to stack over G1 in a fashion that is essentially indistinguishable from wild-type A73, while variant M73 is predicted to have still stronger stacking interactions. Although the relative preference for M73 to stack more strongly than 7DAA73 is reflected in the relative activation free energies for the aminoacylation of these two variants, both have higher activation free energies than would be expected given the correlation between stacking and aminoacylation in the purines noted above. We take this as an indication that there is likely to be a direct stabilizing interaction between a purine N7 and the enzyme, the loss of which accounts for the decreased activity of the deaza variants.
Such specific recognition of discriminator base functionality in synthetase–tRNA complexes is well established. For instance, in the co-crystal structure of yeast tRNAAsp complexed with yeast aspartyl-tRNA synthetase, active site residues make base-specific hydrogen bonding interactions with G73 and the first base pair (67,68). In the class II Thermus thermophilus seryl-tRNA synthetase–tRNASer crystal structure Glu258 is observed directly interacting with the discriminator base (69). Although direct recognition of purine N7 has apparently not yet been observed for the discriminator base in a synthetase–tRNA complex, the hydrogen bonding of N7 to amino acid residues in other systems has been found to play important roles in both protein–RNA (70) and protein–DNA recognition (71).
In the absence of a crystal structure for the AlaRS–tRNAAla complex, the hypothesis of specific recognition cannot practically be tested by MD. The above analysis suggests, however, that variant Z73 may be a particularly interesting target for study. The presence of the N7 together with the very strong stacking predicted from MD suggests that this variant should be a substantially better substrate for E.coli AlaRS than the wild-type microhelix. Experimental work to evaluate this prediction is presently underway.
SUPPLEMENTARY MATERIAL
The Supplementary Material, available at NAR Online, includes atom types, charges and force field parameters for non-standard nucleic acid bases. Details for other helical parameters analyzed to assess convergence are also provided.
Supplementary Material
Acknowledgments
ACKNOWLEDGEMENTS
We thank the Minnesota Supercomputer Institute, the NIH (GM49928), the Alfred P. Sloan Foundation and the University of Minnesota for financial support.
REFERENCES
- 1.Crothers D.M., Seno,T. and Söll,D.G. (1972) Proc. Natl Acad. Sci. USA, 69, 3063–3067. [DOI] [PMC free article] [PubMed] [Google Scholar]
- 2.Hou Y.-M. (1997) Chem. Biol., 4, 93–96. [DOI] [PubMed] [Google Scholar]
- 3.Giegé R., Sissler,M. and Florentz,C. (1998) Nucleic Acids Res., 26, 5017–5035. [DOI] [PMC free article] [PubMed] [Google Scholar]
- 4.Musier-Forsyth K. (1998) J. Biochem. Mol. Biol., 31, 525–535. [Google Scholar]
- 5.Musier-Forsyth K. and Schimmel,P. (1999) Acc. Chem. Res., 32, 368–375. [Google Scholar]
- 6.Francklyn C. and Schimmel,P. (1989) Nature, 337, 478–481. [DOI] [PubMed] [Google Scholar]
- 7.Musier-Forsyth K., Scaringe,S., Usman,N. and Schimmel,P. (1991) Proc. Natl Acad. Sci. USA, 88, 209–213. [DOI] [PMC free article] [PubMed] [Google Scholar]
- 8.Shi J.-P., Francklyn,C., Hill,K. and Schimmel,P. (1990) Biochemistry, 29, 3621–3626. [DOI] [PubMed] [Google Scholar]
- 9.Shi J.P. and Schimmel,P. (1991) J. Biol. Chem., 266, 2705–2708. [PubMed] [Google Scholar]
- 10.Hou Y.-M. and Schimmel,P. (1988) Nature, 333, 140–145. [DOI] [PubMed] [Google Scholar]
- 11.McClain W.H. and Foss,K. (1988) Science, 240, 793–795. [DOI] [PubMed] [Google Scholar]
- 12.Fischer A.E., Beuning,P.J. and Musier-Forsyth,K. (1999) J. Biol. Chem., 274, 37093–37096. [DOI] [PubMed] [Google Scholar]
- 13.Petersheim M. and Turner,D.H. (1983) Biochemistry, 22, 256–263. [DOI] [PubMed] [Google Scholar]
- 14.Sugimoto N., Kierzek,R. and Turner,D.H. (1987) Biochemistry, 26, 4554–4558. [DOI] [PubMed] [Google Scholar]
- 15.Burkard M.E., Kierzek,R. and Turner,D.H. (1999) J. Mol. Biol., 290, 967–982. [DOI] [PubMed] [Google Scholar]
- 16.Guckian K.M., Schweitzer,B.A., Ren,R.X.F., Sheils,C.J., Paris,P.L., Tahmassebi,D.C. and Kool,E.T. (1996) J. Am. Chem. Soc., 118, 8182–8183. [DOI] [PMC free article] [PubMed] [Google Scholar]
- 17.Wu X. and Pitsch,S. (1998) Nucleic Acids Res., 26, 4315–4323. [DOI] [PMC free article] [PubMed] [Google Scholar]
- 18.Scaringe S.A., Francklyn,C. and Usman,N. (1990) Nucleic Acids Res., 18, 5433–5441. [DOI] [PMC free article] [PubMed] [Google Scholar]
- 19.Sproat B., Colonna,F., Mullah,B., Tsou,D., Andrus,A., Hampel,A. and Vinayak,R. (1995) Nucleosides Nucleotides, 14, 255–273. [Google Scholar]
- 20.Beuning P.J., Gulotta,M. and Musier-Forsyth,K. (1997) J. Am. Chem. Soc., 119, 8397–8402. [Google Scholar]
- 21.Nagan M.C., Kerimo,S.S., Musier-Forsyth,K. and Cramer,C.J. (1999) J. Am. Chem. Soc., 121, 7310–7317. [Google Scholar]
- 22.Ramos A. and Varani,G. (1997) Nucleic Acids Res., 25, 2083–2090. [DOI] [PMC free article] [PubMed] [Google Scholar]
- 23.Jorgensen W.L., Chandrasekhar,J., Madura,J.D., Impey,R.W. and Klein,M.L. (1983) J. Chem. Phys., 79, 926–935. [Google Scholar]
- 24.York D.M., Darden,T.A. and Pedersen,L.G. (1993) J. Chem. Phys., 99, 8345–8348. [Google Scholar]
- 25.Pearlman D.A., Case,D.A., Caldwell,J.W., Ross,W.S., Cheatham,T.E., DeBolt,S., Ferguson,D., Seibel,G. and Kollman,P. (1995) Comput. Phys. Commun., 91, 1–41. [Google Scholar]
- 26.Case D.A., Pearlman,D.A., Cladwell,J.W., Cheatham,T.E., Ross,W.S., Simmerling,C.L., Darden,T.A., Merz,K.M., Stanton,R.V., Cheng,A.L., Vincent,J.J., Crowley,M., Ferguson,D.M., Radmer,R.J., Seibel,G.L., Singh,U.C., Weiner,P.K. and Kollman,P.A. (1997) AMBER v.5.0. University of California, San Francisco, CA.
- 27.Ryckaert J., Ciccotti,G. and Berendsen,H.J.C. (1977) J. Comput. Phys., 23, 327–341. [Google Scholar]
- 28.Berendsen H.J.C., Postma,J.P.M., van Gunsteren,W.F., DiNola,A. and Haak,J.R. (1984) J. Comput. Phys., 81, 3684–3690. [Google Scholar]
- 29.Cheatham T.E. and Kollman,P.A. (1997) J. Am. Chem. Soc., 119, 4805–4825. [Google Scholar]
- 30.Lavery R. and Skelnar,H. (1988) J. Biomol. Struct. Dyn., 1, 63–91. [DOI] [PubMed] [Google Scholar]
- 31.Lavery R. and Skelnar,H. (1989) J. Biomol. Struct. Dyn., 4, 655–667. [DOI] [PubMed] [Google Scholar]
- 32.Lavery R. and Skelnar,H. (1998) Curves v.5.3. Institut de Biologie Physico-Chimique, Paris, France.
- 33. (2000) Insight v.98.0. Molecular Simulations Inc., San Diego, CA.
- 34.Humphrey W., Dalke,A. and Schulten,K. (1996) J. Mol. Graph., 14, 33–38. [DOI] [PubMed] [Google Scholar]
- 35.Cornell W.D., Cieplak,P., Bayly,C.I., Gould,I.R., Merz,K.M., Ferguson,D.M., Spellmeyer,D.C., Fox,T., Caldwell,J.W. and Kollman,P.A. (1995) J. Am. Chem. Soc., 117, 5179–5197. [Google Scholar]
- 36.Hehre W.J., Radom,L., Schleyer,P.v.R. and Pople,J.A. (1986) Ab Initio Molecular Orbital Theory. Wiley, New York, NY.
- 37.Ditchfield R., Hehre,W.J. and Pople,J.A. (1971) J. Chem. Phys., 54, 724–728. [Google Scholar]
- 38.Hehre W.J., Ditchfield,R. and Pople,J.A. (1972) J. Chem. Phys., 56, 2257–2261. [Google Scholar]
- 39.Hariharan P.C. and Pople,J.A. (1972) Chem. Phys. Lett., 66, 217. [Google Scholar]
- 40.Pang Y.-P., Miller,J.L. and Kollman,P.A. (1999) J. Am. Chem. Soc., 121, 1717–1725. [Google Scholar]
- 41.Frisch M.J., Trucks,G.W., Schlegel,H.B., Gill,P.M.W., Johnson,B.G., Robb,M.A., Cheeseman,J.R., Keith,T.A., Petersson,G.A., Montgomery,J.A., Raghavachari,K., Al-Laham,M.A., Zakrzewski,V.G., Ortiz,J.V., Foresman,J.B., Peng,C.Y., Ayala,P.A., Wong,M.W., Andres,J.L., Replogle,E.S., Gomperts,R., Martin,R.L., Fox,D.J., Binkley,J.S., Defrees,D.J., Baker,J., Stewart,J.P., Head-Gordon,M., Gonzalez,C. and Pople,J.A. (1998) Gaussian 98. Gaussian Inc., Pittsburgh, PA.
- 42.Musier-Forsyth K. and Schimmel,P. (1992) Nature, 357, 513–515. [DOI] [PubMed] [Google Scholar]
- 43.Cheatham T.E. and Brooks,B.R. (1998) Theor. Chem. Acc., 99, 279–288. [Google Scholar]
- 44.Cheatham T.E. and Kollman,P.A. (1998) In Sarma,R.H. and Sarma,M.H. (eds), Structure, Motion, Interaction and Expression of Biological Macromolecules. Adenine Press, New York, NY, pp. 99–132.
- 45.Hobza P., Sponer,J. and Polásek,M. (1995) J. Am. Chem. Soc., 117, 792–798. [Google Scholar]
- 46.Sponer J., Leszczynski,J. and Hobza,P. (1996) J. Biomol. Struct. Dyn., 14, 117–135. [DOI] [PubMed] [Google Scholar]
- 47.Sponer J., Leszczynski,J. and Hobza,P. (1996) J. Comp. Chem., 17, 841–850. [Google Scholar]
- 48.Sponer J., Leszczynski,J. and Hobza,P. (1996) J. Phys. Chem., 100, 5590–5596. [Google Scholar]
- 49.Sponer J., Vetterl,V., Leszczynski,J. and Hobza,P. (1996) J. Biomol. Struct. Dyn., 13, 695–702. [DOI] [PubMed] [Google Scholar]
- 50.Sponer J., Leszczynski,J. and Hobza,P. (1996) J. Phys. Chem., 100, 1965–1973. [Google Scholar]
- 51.Sponer J., Florian,J., Hobza,P. and Leszczynski,J. (1996) J. Biomol. Struct. Dyn., 13, 827–834. [DOI] [PubMed] [Google Scholar]
- 52.Sponer J. and Hobza,P. (1997) Chem. Phys. Lett., 267, 263–270. [Google Scholar]
- 53.Alhambra C., Luque,F.J., Gago,F.G. and Orozco,M. (1997) J. Phys. Chem. B, 101, 3846–3853. [Google Scholar]
- 54.Sponer J., Gabb,H.A., Leszczynski,J. and Hobza,P. (1997) Biophys. J., 73, 76–87. [DOI] [PMC free article] [PubMed] [Google Scholar]
- 55.Florián J., Sponer,J. and Warshel,A. (1999) J. Phys. Chem. B, 103, 884–892. [Google Scholar]
- 56.Ts’o P.O.P., Melvin,I.S. and Olson,A.C. (1963) J. Am. Chem. Soc., 85, 1289–1295. [Google Scholar]
- 57.van Holde K.E. and Rossetti,G.P. (1967) Biochemistry, 6, 2189–2196. [DOI] [PubMed] [Google Scholar]
- 58.Broom A.D., Schweizer,M.P. and Ts’o,P.O.P. (1967) J. Am. Chem. Soc., 89, 3612–3616. [Google Scholar]
- 59.Solie T.N. and Schellman,J.A. (1968) J. Mol. Biol., 33, 61–70. [DOI] [PubMed] [Google Scholar]
- 60.Nakano N.I. and Igarashi,S.J. (1970) Biochemistry, 9, 577–585. [DOI] [PubMed] [Google Scholar]
- 61.Hobza P., Kabelac,M., Sponer,J., Mejzlik,P. and Vondrasek,J. (1997) J. Comp. Chem., 18, 1136–1150. [Google Scholar]
- 62.Limmer S., Hofmann,H.-P., Ott,G. and Sprinzl,M. (1993) Proc. Natl Acad. Sci. USA, 90, 6199–6202. [DOI] [PMC free article] [PubMed] [Google Scholar]
- 63.Limmer S., Reif,B., Ott,G., Lubos,A. and Sprinzl,M. (1996) FEBS Lett., 385, 15–20. [DOI] [PubMed] [Google Scholar]
- 64.Turner D.H., Sugimoto,N. and Freier,S.M. (1988) Annu. Rev. Biophys. Biophys. Chem., 17, 167–192. [DOI] [PubMed] [Google Scholar]
- 65.Metzger A.U., Heckl,M., Willbold,D., Breitschopf,K., RajBhandary,U.L., Rösch,P. and Gross,H.J. (1997) Nucleic Acids Res., 25, 4551–4556. [DOI] [PMC free article] [PubMed] [Google Scholar]
- 66.Santa-Lucia J.J., Kierzek,R. and Turner,D.H. (1991) J. Am. Chem. Soc., 113, 4313–4322. [Google Scholar]
- 67.Ruff M., Krishnaswamy,S., Boeglin,M., Poterszman,A., Mitschler,A., Podjarny,A., Rees,B., Thierry,J.J. and Moras,D. (1991) Science, 252, 1682–1689. [DOI] [PubMed] [Google Scholar]
- 68.Cavarelli J., Rees,B., Ruff,M., Thierry,J.-C. and Moras,D. (1993) Nature, 362, 181–184. [DOI] [PubMed] [Google Scholar]
- 69.Cusack S., Yaremchuk,A. and Tukalo,M. (1996) EMBO J., 15, 2834–2842. [PMC free article] [PubMed] [Google Scholar]
- 70.Hermann T. and Westhof,E. (1999) Chem. Biol., 6, R335–R343. [DOI] [PubMed] [Google Scholar]
- 71.Nadassy K., Wodak,S.J. and Janin,J. (1999) Biochemistry, 38, 1999–2017. [DOI] [PubMed] [Google Scholar]
Associated Data
This section collects any data citations, data availability statements, or supplementary materials included in this article.