Abstract
The homeodomain-containing protein Hex (also named Prh) is expressed in primitive endoderm (during the early phases of development), in some endoderm-derived tissues and in endothelial and hematopoietic precursors. Hex expression is extinguished during terminal differentiation of endothelial and hematopoietic cells as well as in adult lung. Previous investigations have demonstrated that Hex is expressed during early thyroid gland development. No information has been reported on Hex expression in adult thyroid gland or on the function of this protein in follicular thyroid cells. These issues represent the focus of the present study. We demonstrate that Hex mRNA is present in rat and human adult thyroid gland as well as in differentiated follicular thyroid cell lines. In FRTL-5 cells TSH reduces Hex expression. In thyroid cell lines transformed by several oncogenes Hex expression is completely abolished. By using co-transfection assays we demonstrate that Hex is a repressor of the thyroglobulin promoter and that it is able to abolish the activating effects of both TTF-1 and Pax8. These data would suggest that Hex may play an important role in thyroid cell differentiation. Protein–DNA interaction experiments indicate that Hex is able to bind sites of the thyroglobulin promoter containing either the core sequence 5′-TAAT-3′ or 5′-CAAG-3′. The DNA binding specificity of the Hex homeodomain, therefore, is more ‘relaxed’ than that observed in the majority of other homeodomains.
INTRODUCTION
Transcription factors are the chief regulators of gene expression, therefore they play a critical role in the control of cell differentiation. These proteins recognize target genes through interaction with specific DNA sequences and modulate gene expression by acting either on the basal transcriptional machinery or on chromatin structure (1,2). Early models of the regulation of gene expression were based on the concept that molecular switches could be controlled by single transcription factors. On the contrary, now it is accepted that transcriptional regulation usually consists of integrated mechanisms, generated by the cooperation of several transcription factors, even in the simplest organisms (3). Thus, in order to understand differentiation of a given cell type, it is critical to know which transcription factors are expressed in that cell type and how these proteins functionally interact with each other.
In the thyroid follicular cell (TFC) three cell-specific transcription factors have been identified so far: TTF-1, TTF-2 and Pax8 (4–7). Expression of these proteins occurs at the beginning of thyroid development and continues throughout adult life. Functionally relevant binding sites for TTF-1, TTF-2 and Pax8 have been found in promoters and enhancers of genes whose expression is either unique to TFC, such as thyroglobulin (Tg) and thyroperoxidase (TPO), or restricted to a few cell types (including TFC), such as thyrotropin receptor (TSHr) and sodium iodide symporter (NIS) (8–10). TTF-1, TTF-2 and Pax8 are not uniquely expressed in the TFC: in addition to the developing and mature thyroid gland, TTF-1 is expressed in the lung and in several regions of the developing brain (11), TTF-2 in Rathke’s pouch (5) and Pax8 in the developing kidney (12). Gene inactivation studies in mice have demonstrated that the absence of one of these transcriptional regulators greatly affects development of the thyroid gland (13–15). Thus, investigations on these transcription factors are critical to understand how TFC differentiation occurs. In addition, studies on TTF-1, TTF-2 and Pax8 allow an understanding of the molecular basis of thyroid dysgenesis (16–18) and a better characterization of thyroid cancer (19).
However, it is not yet possible to generate an accurate model of how thyroid differentiation is achieved. For example, although TTF-1, TTF-2 and Pax8 start to be expressed at the beginning of thyroid development (8.5 days gestational age in the mouse), the Tg gene starts to be expressed only at day 15 gestational age in the mouse (11). Thus, unknown additional events must occur to turn on Tg expression during the late phase of thyroid development. One of the reasons for the difficulty in describing TFC differentiation in detail is the scanty knowledge of transcriptional regulators other than TTF-1, TTF-2 and Pax8 whose expression is restricted to this cell type.
Homeobox genes are a large family of transcription factors that play a fundamental role in cell differentiation during development (20). The Hex homeobox gene, also known as Prh (21,22), is expressed in a variety of tissues and cell types during development, including visceral endoderm, fetal liver and lung and endothelial and hematopoietic precursors. In these latter cell types, Hex expression is down-regulated during terminal differentiation, thus suggesting a role for this gene only during the selection and/or initial differentiation steps (23,24). By studying adult human tissues it has been reported that Hex is expressed in liver but not in lung (25). Since Hex is expressed in fetal lung, these results suggest that down-regulation of Hex expression may also occur in cell types of endodermal origin. Recent observations indicate that Hex is expressed in thyroid anlage and in the fetal thyroid up to 15.5 days gestation in the mouse (24). Expression of the Hex gene in the adult thyroid, as well as its function in the TFC, has not yet been investigated. For this reason we have studied Hex expression in the adult rat as well as in differentiated thyroid cell lines. Moreover, the role that Hex protein plays in thyroid transcription has been investigated by transfection experiments. The results indicate that Hex is expressed in adult thyroid and could play an important role in differentiation of TFC.
MATERIALS AND METHODS
Cell cultures and tissues
NIH 3T3 and HeLa cells were cultured in DMEM medium with 10% calf serum (Gibco). FRTL5 and PC Cl3 cells were maintained in F12 Coon’s modified medium with 5% calf serum and hormone mixture as previously described (26). The FRTL5 Ki Mol, PC E1A+v-raf and PC MPSV cell lines were described in Berlingieri et al. (27) and were grown under the same conditions as the wild-type FRTL-5 and PC Cl3 cells. Rat tissues were obtained from 6-week-old Fisher rats. Human thyroid specimens were obtained from patients undergoing surgery. Rat thyroids and human tissue fragments of ∼0.5 cm3 were quickly frozen by dipping in liquid nitrogen and stored at –80°C.
Northern blot analysis
Total RNA from cell cultures or frozen tissues was prepared by the guanidinium thiocyanate/acid phenol procedure (28). Northern blotting was performed using standard procedures, formaldehyde/agarose gels and filter hybridization using the Church and Gilbert method (29). After hybridization and high stringency washes, filters were exposed using a Bio-Rad GS-525 Molecular Imager for the indicated times (see figure legends). The signal intensity of captured images was quantitated using the Multi-Analyst computer program. The DNA fragments used as probes in northern analysis were as follows: for glyceraldeyde 3-phosphate deydrogenase (GAPDH), a 1.3 kb PstI fragment of plasmid pGAPDH1 containing the coding region of GAPDH; for Hex, a 1.7 kb EcoRI fragment of plasmid 6A1.1 containing the cDNA of human Hex (21); for Pax8, a HindIII–EcoRI fragment of human Pax8 cDNA (19).
Cell transfections
FRTL-5 cells were plated at 1.5 × 10⁶ cells/100 mm tissue culture dish 48 h prior to transfection. Three hours prior to transfection, the medium was changed to Dulbecco’s modified Eagle’s medium containing 5% calf serum and growth factors. HeLa cells were plated at 4 × 10⁵/60 mm tissue culture dishes 5 h prior to transfection. Transfections were carried out by calcium phosphate co-precipitation as described (30). The plasmid containing the Tg promoter linked to the CAT gene (Tg-CAT) has been described by Musti et al. (31). Plasmids RSV-CAT and c-fos-CAT contain the RSV and c-fos promoters, respectively, both linked to the CAT gene (32,33). In both the TTF-1 and Pax8 expression vectors, protein expression is driven by the cytomegalovirus promoter (CMV) (6). The full-length cDNA for Hex (21) was cloned in the HindIII and XbaI sites of the pRC/CMV vector. The CMV-LUC plasmid, in which the luciferase gene product (LUC) is controlled by the CMV promoter, was always co-transfected to monitor the efficiency of transfection. In FRTL-5 cell transfections the following amounts of plasmid were used: CMV-Hex, 3 µg; Tg-CAT, 3 µg; CMV-LUC, 1 µg. In HeLa cell transfections the following amounts of plasmid were used: CMV-TTF-1, 1.5 µg; CMV-Pax8, 1.5 µg; CMV-Hex, 1.5 µg; Tg-CAT, 1.5 µg; RSV-CAT, 0.5 µg; c-fos-CAT, 1.5 µg; CMV-LUC, 0.5 µg. Twenty-four hours after transfection cells were harvested and cell extracts were prepared by a standard freeze and thaw procedure. CAT activity was measured by an ELISA method (Amersham). LUC activity was measured by a chemiluminescence procedure (30).
Bacterial expression of homeodomains and purification
Plasmids encoding for the TTF-1 and Antennapedia (Antp) homeodomains (HDs) have already been described (34,35). In all of these plasmids, transcription of the TTF-1 and Antp HD coding sequence is driven by the T7 RNA polymerase promoter. The coding sequence of the Hex HD was isolated by PCR from the human Hex cDNA (25) using oligonucleotides HH1 (5′-TGGCTAGAATTCATAAAAGGAAAGGCGGCCAGGTG-3′) and HH2 (5′-CTGCGCTGTGGATCCTTATTTTTTATTGCTTTGAGGGTTCTCCTG-3′), cloned in the bacterial expression vector pT7.7 at the BamHI and EcoRI restriction sites and verified by nucleotide sequence. The resulting protein is 65 amino acids long and consists of the isolated human Hex HD plus Met at the N-terminus and the four amino acid peptide Lys-Gln-Glu-Asn at the C-terminus.
Proteins were expressed using Escherichia coli strain BL21 (DE3) (36). Briefly, BL21 cells were transformed with expression plasmids and cultures were grown in LB at 37°C with shaking overnight. Then, 200 ml of LB were inoculated with the overnight cultures and shaken at 37°C until the OD600 reached 0.6. At this point expression of T7 RNA polymerase was induced with 0.5 mM IPTG and, 3 h after induction, bacteria were pelleted and frozen at –80°C. HDs were partially purified using Econo Pac S cartridges (Bio-Rad). According to SDS–PAGE analysis, a purity of 40–80% was achieved. The concentration of the active protein was measured by oligonucleotide saturation assay. A gel retardation assay (see below) was performed without calf thymus DNA and with increasing concentrations of oligonucleotides (0.4–10 nM), then the protein-bound and free oligonucleotide concentration values were subjected to Scatchard plot analysis (37). The percentage of active protein was usually 20–40%.
Gel retardation assay
Double-stranded oligodeoxynucleotides, labeled at the 5′-end with 32P, were used as probes. Qualitative gel retardation assays were performed by incubating protein and DNA (both at a final concentration of 0.1 µM) in a buffer containing 20 mM Tris–HCl pH 7.6, 75 mM KCl, 0.25 mg/ml bovine serum albumin, 5 mM dithiothreitol, 10 µg/ml calf thymus DNA, 10% glycerol for 30 min at room temperature. Protein-bound and free DNA were separated on native 7.5% polyacrylamide gels run in 0.5× TBE for 1.5 h at 4°C. Gels were dried and exposed to a Bio-Rad GS-525 Molecular Imager. The equilibrium dissociation constant (Kd) was measured by gel retardation assay, omitting calf thymus DNA in the binding reaction and using 1–15 nM protein and 3.3 nM DNA probe. The amount of protein-bound and free DNA was measured with Multi-Analyst software on a Bio-Rad GS-525 Molecular Imager. Kd was defined by the following equation:
Kd = [DNA]·[HD]/[DNA–HD]
where [DNA] is the free DNA concentration, [HD] the free HD concentration and [DNA–HD] the DNA–HD complex concentration.
RESULTS
Hex expression in adult TFC and effect of TSH
In order to test whether Hex is expressed in adult thyroid, the presence of Hex mRNA in adult human and rat thyroid tissue, as well as in differentiated cell lines from rat thyroid (FRTL-5 and PC Cl3), was investigated by northern blot analysis. Figure 1a shows that Hex mRNA is expressed in adult human thyroid tissue and in FRTL-5 cells as a major transcript of 1.8 kb. Faint longer transcripts were also detected in both human tissue and FRTL-5 cells. However, due to the fact that in both species >95% of Hex mRNA is expressed as a 1.8 kb transcript, only this form was measured in other northern blot analyses. Figure 1b shows that, in addition to FRTL-5 cells, Hex transcript is detectable in PC Cl3 cells and adult rat thyroid tissue but not in NIH 3T3 and HeLa cells. After normalization to the GAPDH signal, no significant difference in Hex expression was detected among FRTL-5, PC Cl3 and rat thyroid tissue (data not shown). These results indicate that Hex expression in TFC persists during adult life. In this respect thyroid tissue differs from the lung, in which Hex expression is extinguished in the adult (24).
Figure 1.
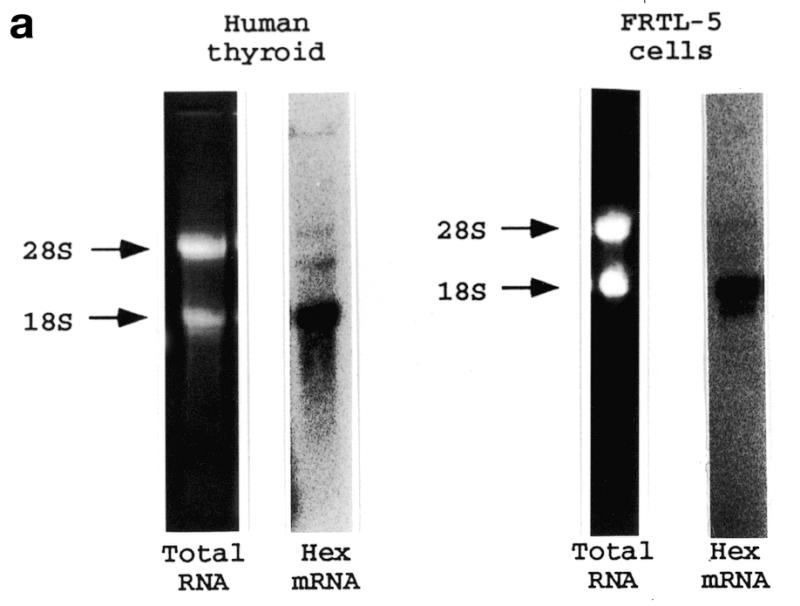
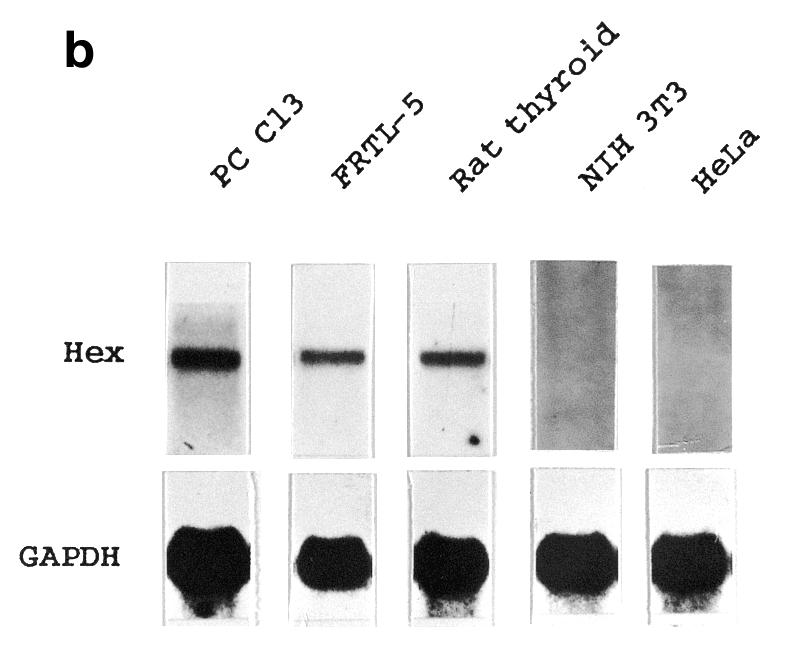
Hex expression in adult thyroid tissues and differentiated cell lines. Total RNA was prepared as described in Materials and Methods and subjected to northern blot analysis using Hex and GAPDH DNA probes. (a) Hex expression in human thyroid and FRTL-5 cells. The length of the Hex mRNA was calculated according to the migration of the 28S and 18S rRNAs. (b) Hex expression in adult rat thyroid tissue and in the indicated cell lines. The exposure time was 10 and 24 h for (a) and (b), respectively.
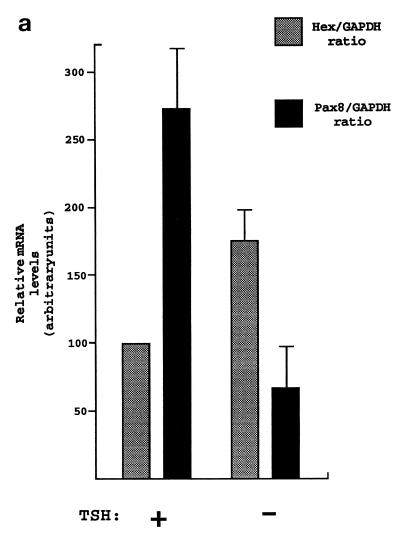
TSH is the major regulator of TFC functions and it is required for FRTL-5 proliferation (26). In order to address the role that TSH may have on Hex expression, FRTL-5 cells were cultured in the presence or absence of TSH (1 mU/ml) for 5 days, then the levels of Hex, Pax8 and GAPDH mRNAs were assayed by northern blotting. Pax8 gene expression was up-regulated in the presence of TSH (38,39). Pax8 mRNA levels are much lower than those of the highly expressed GAPDH gene and, therefore, they could represent a good internal control to exclude non-specific effects due to TSH starvation. Figure 2a indicates that FRTL-5 cells cultured in the absence of TSH show up-regulation of Hex mRNA expression when compared to cells cultured in the presence of hormone. In contrast, Pax8 mRNA levels are reduced upon TSH withdrawal. Therefore, Hex expression in TFC is not dependent on the presence of TSH which, instead, plays an inhibitory role.
Figure 2.
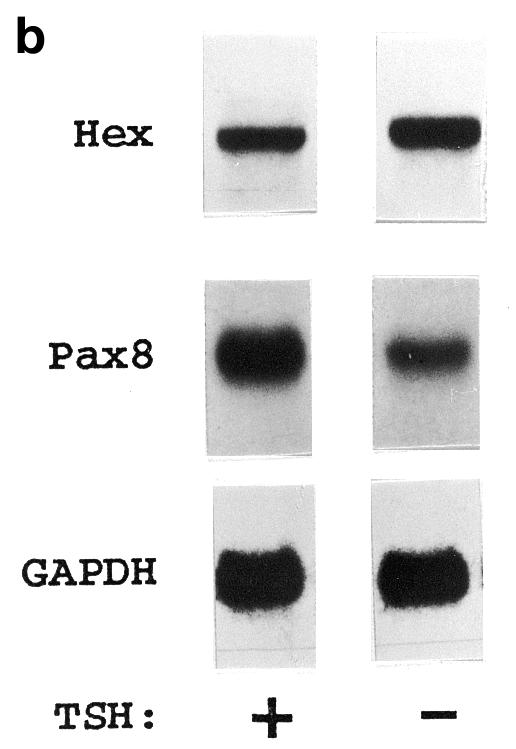
TSH effect on Hex mRNA expression. (a) FRTL-5 cells were kept in the presence or absence of TSH (1 mU/ml) for 5 days. Hex, Pax8 and GAPDH mRNAs were detected by northern blotting. Filters were exposed to a phosphorimager for 24 h. Signals were quantitated using the Multi-Analyst computer program and normalized to the corresponding GAPDH values. The Hex:GAPDH ratio in the presence of TSH was considered arbitrarily as 100. Each bar represents the mean value ± SD of three independent experiments. (b) Representative autoradiograms.
Effects of neoplastic transformation on Hex expression
In order to study the effect of neoplastic transformation on Hex expression, the presence of Hex mRNA in transformed rat cell lines derived from FRTL-5 and PC Cl3 was investigated. Cell lines PC E1A+v-raf, PC MPSV and FRTL-5 Ki Mol, respectively transformed by the E1A+v-raf, v-mos and v-Ki-ras oncogenes (27), were subjected to northern blot analysis. These cell lines represent complete cell dedifferentiation and transformation, because expression of the entire set of genes typical of the TFC phenotype is abolished. In addition, these cell lines produce aggressive tumors in nude mice (27). In accordance with these data, the transformed cell lines showed an absence of Pax8 expression (Fig. 3). In none of the transformed cell lines could Hex mRNA be detected (Fig. 3). These results indicate that dedifferentiation of TFC abolishes Hex expression.
Figure 3.
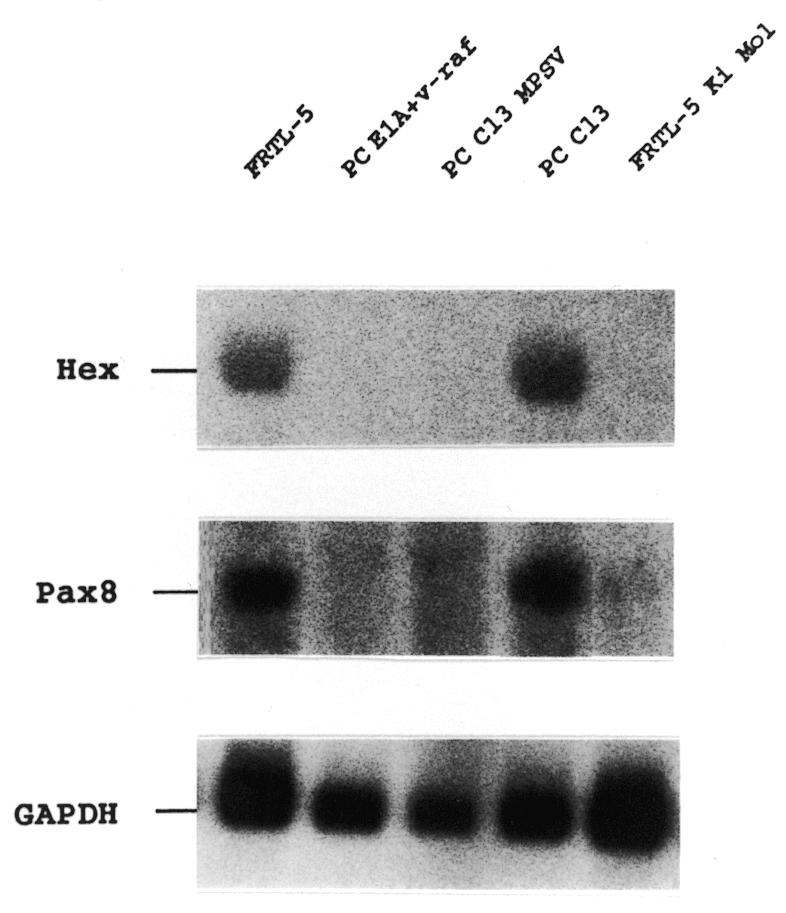
Transformation abolishes Hex expression in thyroid cells. Total RNA from the indicated cell lines was subjected to northern blotting using Hex, Pax8 and GAPDH specific probes. After hybridization and high stringency washes the filter was exposed overnight and the image was captured using a Bio-Rad GS-525 Molecular Imager.
Transcriptional effects of Hex protein
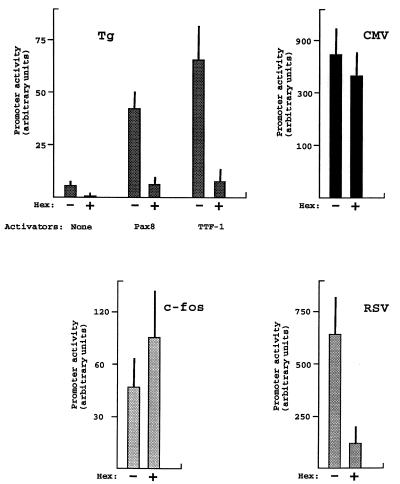
In order to test whether Hex protein may regulate thyroid-specific transcription, a co-transfection approach was used. HeLa cells were transfected with the Hex expression vector together with a construct in which the Tg promoter was fused to the CAT reporter gene (Tg-CAT) (31). As an internal control, the Tg-CAT construct was always co-transfected with the CMV-LUC plasmid, in which LUC gene transcription is driven by the CMV promoter. The transcriptional effect of Hex was also tested on the c-fos and RSV promoters. Both of these promoters were fused to the CAT reporter gene. The results are shown in Figure 4. As expected, the Tg promoter has only a weak activity in HeLa cells. The presence of the Hex expression vector further reduces this basal activity. Pax8 and TTF-1 activate the Tg promoter (6,40). The effect of Hex on Pax8 and TTF-1 induction of the Tg promoter was investigated. Under our experimental conditions Pax8 and TTF-1 increase basal Tg promoter activity 8- and 13-fold, respectively. The presence of the Hex expression vector abolishes both Pax8 and TTF-1 activating effects. The activity of the RSV promoter was also greatly reduced in the presence of Hex. In contrast to the inhibitory effect exerted on the Tg and RSV promoters, Hex expression has no effect on the CMV promoter and a slightly activating effect on the c-fos promoter. These results indicate that the inhibitory effect exerted by Hex is promoter specific, though not restricted to the Tg promoter. The inhibition of promoter activity exerted by Hex appears not to be related to the strength of the promoter itself. In fact, both relatively strong (CMV and RSV) and relatively weak promoters (c-fos and Tg) are differentially regulated by Hex expression. In the expression vectors that we have used to activate the Tg promoter, transcription of Pax8 and TTF-1 was driven by the CMV promoter. The lack of a significant inhibitory effect of Hex expression on the CMV promoter would exclude the possibility that the inhibitory effect exerted on the Tg promoter is due to reduced expression of Pax8 or TTF-1. In addition, the repressive effect on basal activity of the Tg promoter would suggest that Hex protein exerts this function by acting on components of the basal transcriptional machinery and not on a TTF-1- or Pax8-dependent activatory mechanism.
Figure 4.
Hex expression inhibits Tg promoter activity. Tg-CAT, c-fos-CAT and RSV-CAT were transfected into HeLa cells as described in Materials and Methods. As an internal control, CMV-LUC was always co-transfected. Tg-CAT was transfected into HeLa cells in the absence/presence of TTF-1 or Pax8 expression vectors, each condition with or without the Hex expression vector. TTF-1 or Pax8 expression vectors were not used in the case of the c-fos and RSV promoters. Forty-eight hours after transfection cells were harvested and CAT and LUC activities measured. Each bar represents the mean value ± SD from four independent experiments.
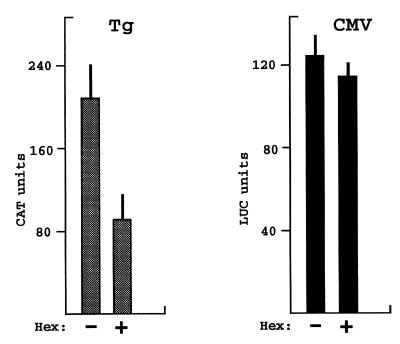
The results obtained by co-transfection of HeLa cells suggest that in TFC, which normally express Hex, the Tg promoter would be subject to tonic inhibition by this protein. In order to test whether the amount of endogenous Hex protein exerts maximal repressive effects, we up-regulated the Hex protein levels in FRTL-5 cells by transfecting its expression vector and measured the activity of the Tg and CMV promoters. The results are shown in Figure 5. Overexpression of Hex protein in FRTL-5 cells produces a significant decrease in Tg promoter activity. As in HeLa cells, overexpression of Hex protein in FRTL-5 cells has no effect on activity of the CMV promoter. Therefore, the amount of endogenous Hex protein present in FRTL-5 cells is unable to exert a maximal inhibitory effect on the Tg promoter.
Figure 5.
Hex overexpression down-regulates the Tg promoter in FRTL-5 cells. Tg-CAT and CMV-LUC plasmids were transfected into FRTL-5 cells in the absence/presence of Hex expression vector. Forty-eight hours after transfection cells were harvested and CAT and LUC activities measured. Each bar represents the mean value ± SD from three independent experiments.
Hex binding to the Tg promoter
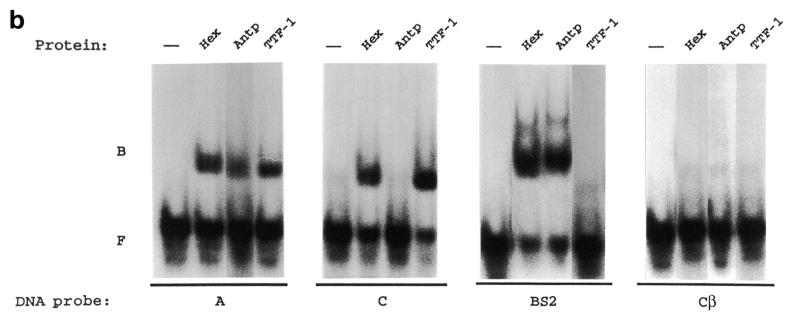
A large number of HD-containing proteins specifically bind to sequences containing a 5′-TAAT-3′ core motif (41). A typical example of this is the Antp class HDs (42). A few HDs instead prefer sequences containing a core motif different from 5′-TAAT-3′. For example, HDs of the NK class (TTF-1 is a member of this class) recognize sequences containing a 5′-CAAG-3′ core motif (43). By selection experiments a 5′-TAAT-3′ consensus-containing sequence has been determined as the preferred binding site for the Hex HD (21). However, in the same experiment it was shown that the Hex HD is able to recognize sequences containing only part of the 5′-TAAT-3′ core motif. We have tested Hex HD binding to two sequences of the Tg promoter (Fig. 6a). The A sequence contains a 5′-TAAT-3′ core motif and, therefore, is expected to be recognized by the Hex HD. This sequence also contains the 5′-CAAG-3′ core motif, which is bound by the TTF-1 HD (44). The C sequence contains only the 5′-CAAG-3′ core motif and is bound either by TTF-1 or Pax8 (6). The Cβ sequence is a mutant of the C sequence in which the 5′-CAAG-3′ core motif has been abolished. As a positive control the BS2 oligonucleotide was used, which represents a typical binding sequence for Antp class HDs (42). The Kd values of the Hex, Antp and TTF-1 HDs for these oligonucleotides were measured by gel retardation assays. The results are shown in Table 1. The TTF-1 HD binds with high affinity to sequence C and with an ∼100-fold lower affinity to the BS2 sequence. In contrast, the Antp HD recognizes sequence BS2 with much higher affinity than sequence C. The obtained Kd values are in good agreement with previous measurements (42,45). Therefore, the TTF-1 and Antp HDs show the expected DNA binding specificities. Under the same experimental conditions, the Hex HD is able to recognize with high affinity both the C and BS2 sequences, suggesting that the binding specificity of this protein is less stringent than those of the TTF-1 and Antp HDs. Because of the presence of both the 5′-TAAT-3′ and the 5′-CAAG-3′ core motifs, the A sequence is bound with high affinity by both the TTF-1 and Hex HDs. The intermediate affinity shown by the Antp HD–A sequence complex is probably due to the presence of the dinucleotide CA just 3′ to the 5′-TAAT-3′ motif, which is not optimal for the Antp class HDs (46). Although the DNA binding specificity of the Hex HD is less stringent than those shown by the TTF-1 and Antp HDs, its binding to the C, BS2 and A sequences is specific. In fact, the Hex HD is unable to recognize with high affinity the Cβ sequence, which does not contain either the 5′-TAAT-3′ or the 5′-CAAG-3′ motif (note that the extremely high Kd values shown by the TTF-1 and Hex HDs on the Cβ sequence indicate that the additional 5′-CAAG-3′ motif present at the 5′-end of the bottom strand of sequences C and Cβ is irrelevant for specific binding). Altogether these data indicate that Hex HD binding to DNA is specific. However, the Hex HD is able to recognize both the 5′-TAAT-3′ and the 5′-CAAG-3′ motifs. Thus, the DNA binding specificity of this protein is more relaxed than those of the TTF-1 and Antp HDs.
Figure 6.
Hex binding to sequences of the Tg promoter. (a) Oligonucleotides used in the gel retardation assay. The 5′-TAAT-3′ and 5′-CAAG-3′ sites are boxed. The underlined bases in the A oligonucleotide correspond to 5′-CAAG-3′ in the bottom strand (not shown). The black dots below the Cβ oligonucleotide indicate the two bases which differ between the C and Cβ oligonucleotides. (b) Binding of Hex, Antp and TTF-1 HDs to the A, C, BS2 and Cβ oligonucleotides. The gel retardation assay was performed as described in Materials and Methods. B, protein-bound DNA; F, free DNA.
Table 1. Kd values (×10–9 M) of the Hex, Antp and TTF-1 HDs with the A, C, BS2 and Cβ sequences.
| HD | DNA sequence | |||
|---|---|---|---|---|
| A | C | BS2 | Cβ | |
| Hex | 2.3 | 1.2 | 1.8 | 330.0 |
| Antp | 8.5 | 47.0 | 0.8 | 156.0 |
| TTF-1 | 1.1 | 0.2 | 24.1 | 232.0 |
Because of this more relaxed DNA binding specificity, we next tested whether the Hex HD is able to discriminate high affinity sequences from a large excess of genomic DNA. The Hex, Antp and TTF-1 HDs were incubated with the A, C, BS2 and Cβ probes in the presence of a 100-fold excess of calf thymus DNA and protein–DNA complexes were revealed by gel retardation assay. The results are shown in Figure 6b and they indicate that the Hex HD is able to discriminate high affinity binding sequence from genomic DNA as efficiently as the Antp and TTF-1 HDs. Because of the extremely high Kd values (Table 1), none of the tested HDs was able discriminate the Cβ sequence from genomic DNA. Thus, in spite of a DNA binding specificity more relaxed than those of other HDs, the Hex HD is able to efficiently discriminate between specific and non-specific DNA sequences.
DISCUSSION
We have demonstrated that Hex is a transcriptional repressor of the Tg promoter. A repressive effect on the Tg promoter has also been demonstrated for TTF-2 (5). In contrast, either TTF-1 or Pax8 are able to activate thyroid-specific promoters (6,40). Previous investigations (47) have indicated that Hex may act as a transcriptional repressor. However, in those studies the repressor activity of Hex was demonstrated using artificial systems in which the protein was fused to the GAL-4 DNA-binding domain and, as a consequence, its effect was assayed on an artificial promoter containing polymerized GAL-4-binding sites. In contrast, in our study the function of Hex was investigated in the context of a natural promoter. Moreover, a cell type (TFC) in which this protein is normally expressed has been used for co-transfection studies. Thus, we have investigated Hex function in natural promoter and cellular contexts. Our experiments have overcome potential artificial effects generated by use of the GAL-4 system. It is now possible to affirm that Hex is a ‘bona fide’ transcriptional repressor. It should be pointed out, however, that we have used a transfection-based approach, in which the Hex protein acts on promoters contained in plasmid DNA. The repressor function of Hex in a chromosomal context has not yet been demonstrated. Nevertheless, consistent with our results, Hex overexpression in zebrafish embryos leads to down-regulation of bmp2b and wnt8 expression (48).
By using GAL-4 fusion proteins, Tanaka et al. demonstrated that Hex repression does not require the presence of the HD and is mediated by the proline-rich N-terminal region (47). Proline-rich domains are able to establish protein–protein interactions and are involved in transcriptional repression in several protein contexts (49–54). Taking these and our data together, the Hex effects could be described by a two-step model: (i) the Hex HD, by interacting with specific DNA sequences, selects target genes; (ii) the proline-rich domain, by establishing protein–protein interactions, down-regulates the transcription rate of target genes. Alternatively, a ‘squelching’ effect could be postulated. In fact, proline-rich domains are also able to activate transcription (55), therefore, it could be possible that Hex overexpression sequesters factors of the transcriptional machinery independently of the DNA-binding function of the HD. The observation that only the Tg and RSV and not the c-fos and CMV promoters are inhibited by Hex expression (Fig. 4) would indicate that the putative squelching effect involves a factor(s) that plays a transcriptional role in only a subset of promoters. A similar mechanism has been proposed to explain the repressive effect that TTF-2 exerts on thyroid-specific promoters (5).
Early reports have pointed out that the primary sequence of the Hex HD shows some peculiarities with respect to other HDs (21). For instance, it does not contain Arg at position 5. Arg5 is extremely conserved among HDs and plays a pivotal role in the interaction between the HD N-terminal arm and the DNA minor groove (56). Here we have demonstrated that the Hex HD shows a peculiar DNA binding specificity. In fact, it is able to recognize sequences containing either the 5′-TAAT-3′ or the 5′-CAAG-3′ core motif, which are uniquely recognized by the Antp and NK class HDs, respectively (57). Therefore, it appears that the Hex HD recapitulates both the Antp and TTF-1 HD specificities. We and others have demonstrated that critical residues in determining the different DNA binding specificities of the Antp and TTF-1 HDs are located at positions 6, 7 and 8 in the N-terminal arm and at position 54 in the recognition helix (57,58). Alignment of the Antp, TTF-1 and Hex HD sequences shows that the latter protein has a similar degree of homology to the TTF-1 and Antp HDs (47 and 53%, respectively) (Fig. 7). At positions 6 and 8 the Hex and TTF-1 HDs show the same amino acids (Val6 and Phe8). However, the absence of Arg5 could suggest that the N-terminal arm of the Hex HD contacts DNA in a different way than other HDs. As a result, the Hex HD would be unable to discriminate between T and C in the 5′-TAAT-3′ and 5′-CAAG-3′ motifs. Ala54 could explain why the Hex HD is unable to discriminate between T and G in the 5′-TAAT-3′ and 5′-CAAG-3′ motifs. In all HDs Asn51 recognizes the AA of the conserved core motifs (5′-TAAT-3′ and 5′-CAAG-3′) (56). Hex HD bears Asn51 and this would explain why it is unable to recognize the Cβ sequence. Altogether, these considerations provide possible explanations accounting for the peculiar Hex HD DNA binding specificity.
Figure 7.
Sequence homology between the Hex, TTF-1 and Antp HDs. The HD secondary structure is shown above the aligned Antp, Hex and TTF-1 HD sequences. Boxes indicate amino acids critical for sequence discrimination according to Damante et al. (57). Arrows indicate bases of the C sequence discriminated by the corresponding amino acids.
Several studies have shown that TSH increases Tg gene expression, even if the degree of stimulation depends on the cell system that is used (59,60). We and others have provided evidence indicating that Pax8 is one of the factors that mediates TSH stimulation of Tg expression (38,39). In fact, TSH increases Pax8 protein levels which, in turn, up-regulates Tg promoter activity (38). The control of Hex levels may be a second mechanism by which TSH regulates Tg transcription. In this case, however, TSH down-regulates Hex expression. Since Hex has an inhibitory effect on the Tg promoter, TSH-induced Hex down-regulation would increase Tg gene expression. Why should TSH use two different transcriptional mechanisms to regulate the Tg promoter? The situation is reminiscent of regulation of the Lac operon, in which full activation of transcription is obtained by the complementary effects of the Lac repressor and CAP (61). In this manner, small modifications of the levels of both transcriptional regulators (Pax8 and Hex in our case) can produce large effects on the transcription rate of the target gene (Tg in our case). The presence of TSH in the culture medium reduces Hex levels to 50% with respect to unstimulated cells. Although it is not large, this degree of reduction could cause important biological effects. In fact, the great majority of human diseases caused by mutations in homeobox-containing genes display dominant effects because of haploinsufficiency (the amount of protein produced by the single normal allele is not enough to satisfy the cell requirements) (62). This means that HD-containing proteins are very sensitive to concentration changes. Therefore, even if it is not dramatic, the TSH effect on Hex levels may produce consequences in TFC. Overexpression of Hex in FRTL-5 cells down-regulates the Tg promoter. FRTL-5 cell transfection was performed in the presence of TSH. Therefore, it appears that the amount of Hex protein present upon TSH stimulation does not exert a maximal inhibitory effect on the Tg promoter, further supporting the notion that an increase in Hex levels, such as occurs upon TSH withdrawal, may have an in vivo functional role.
The relationship existing between TSH, Hex and the Tg promoter may play a role during thyroid development. Tg gene expression is turned on at a late stage of thyroid development, as is that of TSHr (11). A simple hypothesis could assert that at a late stage of thyroid development the appearance of TSHr renders TFC sensitive to TSH; at that moment Hex expression would be down-regulated, thus reducing repression of the Tg promoter and allowing full transcriptional activation by Pax8 (whose protein levels would instead be up-regulated by TSH) (see Fig. 2; 38) and TTF-1. A detailed quantitative time course of TSHr, Tg and Hex expression during thyroid development is required to support this possibility.
An interplay between transcriptional activators and repressors in controlling cell type differentiation seems to be widely used in development. During pituitary ontogeny, for example, the transcriptional activating effects of PROP1 are inhibited by the repressor rpx (63). Attenuation of rpx expression occurs just prior to appearance of the terminal differentiation markers for anterior pituitary cell types (63,64).
The data shown in Figure 3 demonstrate that TFC transformation by several oncogenes abolishes Hex expression. From a qualitative point of view, oncogene transformation, which leads to complete dedifferentiation of TFC (27), yields similar effects on Hex expression as TSH, which, in contrast, promotes TFC differentiation. This apparent paradox could be explained by the widely demonstrated effect that TSH and oncogenes play in rat thyroid cell proliferation. In fact, FRTL-5 cells are TSH-dependent for growth (26) and oncogenes are able to abolish such a dependence (27,65). Thus, both TSH and oncogenes are able to induce TFC proliferation. It could be possible, therefore, that growth-related mechanisms down-regulate Hex expression in adult TFC. It should be pointed out, however, that from a quantitative point of view, TSH and oncogenes yield dissimilar effects on Hex expression: the hormone causes only a 50% down-regulation, while oncogenes completely abolish Hex expression. In order to address this issue, studies with a larger panel of transformed cell lines are underway.
Studies with hepatocytes have shown that while Hex expression is detected in highly differentiated hepatoma cells, it is abolished in poorly differentiated hepatoma cell lines (47). Thus, in both TFC-derived and hepatocyte-derived cell lines differentiated phenotype loss is associated with abolition of Hex expression. Expression of Hex mRNA in endodermal-derived cells seems to be different than that observed in hematopoietic cells. In fact, Hex mRNA is detected in leukemic cells but its expression is lost upon induction of differentiation into monocytes, macrophages and megakaryocytes (23). Based on these data it is tempting to speculate that Hex expression in liver and thyroid is controlled by similar mechanisms, different from those acting in hematopoietic cells.
Acknowledgments
ACKNOWLEDGEMENTS
We acknowledge Elisa Tell for improvements in the English. This work was funded by grants to G.D. from the Consiglio Nazionale delle Ricerche (CNR Target Project on Biotechnology), MURST and the PUGD of Udine, to L.P. from the University of Udine and to G.M. from the University of Trieste.
REFERENCES
- 1.Ptashne M. and Gann,A. (1997) Nature, 386, 569–577. [DOI] [PubMed] [Google Scholar]
- 2.Struhl K. (1999) Cell, 98, 1–4. [DOI] [PubMed] [Google Scholar]
- 3.Herskowitz I. (1989) Nature, 342, 749–757. [DOI] [PubMed] [Google Scholar]
- 4.Di Lauro R., Damante,G., De Felice,M., Arnone,M.I., Sato,K., Lonigro,R. and Zannini,M. (1995) J. Endocrinol. Invest., 18, 117–119. [DOI] [PubMed] [Google Scholar]
- 5.Zannini M., Avantaggiato,V., Biffali,E., Arnone,M.I., Sato,K., Pischetola,M., Taylor,B.A., Phillips,S.J., Simeone,A. and Di Lauro,R. (1997) EMBO J., 16, 3185–3197. [DOI] [PMC free article] [PubMed] [Google Scholar]
- 6.Zannini M., Francis-Lang,H., Plachov,D. and Di Lauro,R. (1992) Mol. Cell. Biol., 12, 4230–4241. [DOI] [PMC free article] [PubMed] [Google Scholar]
- 7.Guazzi S., Price,M., De Felice,M., Damante,G., Mattei,M.G. and Di Lauro,R. (1990) EMBO J., 9, 3631–3639. [DOI] [PMC free article] [PubMed] [Google Scholar]
- 8.Damante G. and Di Lauro,R. (1994) Biochim. Biophys. Acta, 1218, 255–266. [DOI] [PubMed] [Google Scholar]
- 9.Ikuyama S., Ohe,K., Takayanagi,R., Kohn,L.D. and Nawata,H. (1997) Endocr. J., 44, 247–256. [DOI] [PubMed] [Google Scholar]
- 10.Ohno M., Zannini,M., Levy,O., Carrasco,N. and Di Lauro,R. (1999) Mol. Cell. Biol., 19, 2051–2060. [DOI] [PMC free article] [PubMed] [Google Scholar]
- 11.Lazzaro D., Price,M., De Felice,M. and Di Lauro,R. (1991) Development, 113, 1093–1104. [DOI] [PubMed] [Google Scholar]
- 12.Plachov D., Chowdhury,K., Walther,C., Simon,D., Guenet,J.L. and Gruss,P. (1990) Development, 110, 643–651. [DOI] [PubMed] [Google Scholar]
- 13.Kimura S., Hara,Y., Pineau,T., Fernandez-Salguero,P., Fox,C.H., Ward,J.M. and Gonzalez,F.J. (1997) Genes Dev., 10, 60–69. [DOI] [PubMed] [Google Scholar]
- 14.Mansouri A., Chowdury,K. and Gruss,P. (1998) Nature Genet., 19, 87–90. [DOI] [PubMed] [Google Scholar]
- 15.De Felice M., Ovitt,C., Biffali,E., Rodriguez-Mallon,A., Arra,C., Anassiatidis,K., Macchia,P.E., Mattei,M.G., Mariano,A., Scholer,H., Macchia,V. and Di Lauro,R. (1998) Nature Genet., 19, 395–398. [DOI] [PubMed] [Google Scholar]
- 16.Macchia P.E., Lapi,P., Krude,H., Pirro,M.T., Missero,C., Chiovato,L., Souabni,A., Baserga,M., Tassi,V., Pinchera,A., Fenzi,G., Gruters,A., Busslinger,M. and Di Lauro,R. (1998) Nature Genet., 19, 83–85. [DOI] [PubMed] [Google Scholar]
- 17.Clifton-Bligh R.J., Wentworth,J.M., Heinz,P., Crisp,M.S., Lazarus,J.H. and Ludgate,M. and Chatterjee,V.K. (1998) Nature Genet., 19, 399–401. [DOI] [PubMed] [Google Scholar]
- 18.Damante G. (1998) Eur. J. Endocrinol., 139, 563–566. [DOI] [PubMed] [Google Scholar]
- 19.Fabbro D., Di Loreto,C., Beltrami,C.A., Belfiore,A., Di Lauro,R. and Damante,G. (1994) Cancer Res., 54, 4744–4749. [PubMed] [Google Scholar]
- 20.Gehring W.J. (1987) Science, 236, 1245–1252. [DOI] [PubMed] [Google Scholar]
- 21.Crompton M.R., Bartlett,T.J., MacGregor,A.D., Manfioletti,G., Buratti,E., Giancotti,V. and Goodwin,G.H. (1992) Nucleic Acids Res., 20, 5661–5667. [DOI] [PMC free article] [PubMed] [Google Scholar]
- 22.Bedford F.K., Ashworth,A., Enver,T. and Wiedemann,L.M. (1993) Nucleic Acids Res., 21, 1245–1249. [DOI] [PMC free article] [PubMed] [Google Scholar]
- 23.Manfioletti G., Gattei,V., Buratti,E., Rustighi,A., De Iuliis A., Aldinucci,D., Goodwin,G.H. and Pinto,A. (1995) Blood, 85, 1237–1245. [PubMed] [Google Scholar]
- 24.Thomas P.Q., Brown,A. and Bendington,R.S.P. (1998) Development, 125, 85–94. [DOI] [PubMed] [Google Scholar]
- 25.Hromas R., Radich,J. and Collins,S. (1993) Biochem. Biophys. Res. Commun., 195, 976–983. [DOI] [PubMed] [Google Scholar]
- 26.Ambesi-Impiombato F.S., Parks,L.A.M. and Coon,H.G. (1980) Proc. Natl Acad. Sci. USA, 77, 3455–3459. [DOI] [PMC free article] [PubMed] [Google Scholar]
- 27.Berlingieri M.T., Manfioletti,G.A., Santoro,M., Bandiera,A., Visconti,R., Giancotti,V. and Fusco,A. (1995) Mol. Cell. Biol., 15, 1545–1553. [DOI] [PMC free article] [PubMed] [Google Scholar] [Retracted]
- 28.Chomczynski P. and Sacchi,N. (1987) Anal. Biochem., 162, 156–159. [DOI] [PubMed] [Google Scholar]
- 29.Church G.M. and Gilbert,W. (1984) Proc. Natl Acad. Sci. USA, 81, 1991–1994. [DOI] [PMC free article] [PubMed] [Google Scholar]
- 30.Francis-Lang H., Zannini,M., De Felice,M., Berlingieri,M.T., Fusco,A. and Di Lauro,R. (1992) Mol. Cell. Biol., 12, 5793–5800. [DOI] [PMC free article] [PubMed] [Google Scholar]
- 31.Musti A.M., Ursini,V.M., Avvedimento,E.V., Zimarino,V. and Di Lauro,R. (1987) Nucleic Acids Res., 15, 8149–8166. [DOI] [PMC free article] [PubMed] [Google Scholar]
- 32.Sassone-Corsi P. and Verma,I.M. (1987) Nature, 326, 507–510. [DOI] [PubMed] [Google Scholar]
- 33.Gorman C.M., Merlino,G.T., Willingham,M.C., Pastan,I. and Howard,B.H. (1982) Proc. Natl Acad. Sci. USA, 79, 6777–6781. [DOI] [PMC free article] [PubMed] [Google Scholar]
- 34.Damante G. and Di Lauro,R. (1991) Proc. Natl Acad. Sci. USA, 88, 5388–5392. [DOI] [PMC free article] [PubMed] [Google Scholar]
- 35.Muller M., Affolter,M., Leupin,W., Otting,G., Wuthrich,K. and Gehring,W.J. (1988) EMBO J., 7, 4299–4304. [DOI] [PMC free article] [PubMed] [Google Scholar]
- 36.Studier F.W., Rosenberg,A.H., Dunn,J.J. and Dubendroff,J.W. (1991) Methods Enzymol., 185, 60–89. [DOI] [PubMed] [Google Scholar]
- 37.Scatchard G. (1949) Ann. N. Y. Acad. Sci., 51, 660–672. [Google Scholar]
- 38.Fabbro D., Pellizzari,L., Mercuri,F. and Damante,G. (1998) J. Mol. Endocrinol., 21, 347–354. [DOI] [PubMed] [Google Scholar]
- 39.Van Renterghem P., Dremier,S., Vassart,G. and Christophe,D. (1995) Mol. Cell. Endocrinol., 112, 83–93. [DOI] [PubMed] [Google Scholar]
- 40.De Felice M., Damante,G., Zannini,M., Francis-Lang,H. and Di Lauro,R. (1995) J. Biol. Chem., 270, 26649–26656. [DOI] [PubMed] [Google Scholar]
- 41.Laughon A. (1991) Biochemistry, 30, 11357–11367. [DOI] [PubMed] [Google Scholar]
- 42.Affolter M., Percival-Smith,A., Muller,M., Leupin,W. and Gehring,W.J. (1990) Proc. Natl Acad. Sci. USA, 87, 4093–4097. [DOI] [PMC free article] [PubMed] [Google Scholar]
- 43.Damante G., Fabbro,D., Pellizzari,L., Civitareale,D., Guazzi,S., Policarpou-Schwartz,M., Cauci,S., Quadrifoglio,F., Formisano,S. and Di Lauro,R. (1994) Nucleic Acids Res., 22, 3075–3083. [DOI] [PMC free article] [PubMed] [Google Scholar]
- 44.Sinclair A.J., Lonigro,R., Civitareale,D., Ghibelli,L. and Di Lauro,R. (1990) Eur. J. Biochem., 193, 311–318. [DOI] [PubMed] [Google Scholar]
- 45.Damante G., Tell,G., Formisano,S., Fabbro,D., Pellizzari,L. and Di Lauro,R. (1993) Biochem. Biophys. Res. Commun., 197, 632–638. [DOI] [PubMed] [Google Scholar]
- 46.Florence B., Handrow,R. and Laughon,A. (1991) Mol. Cell. Biol., 11, 3613–3623. [DOI] [PMC free article] [PubMed] [Google Scholar]
- 47.Tanaka T., Inazu,T., Yamada,K., Myint,Z., Keng,V.W., Inoue,Y., Taniguchi,N. and Noguchi,T. (1999) Biochem. J., 339, 111–117. [PMC free article] [PubMed] [Google Scholar]
- 48.Ho C.Y., Houart,C., Wilson,S.W. and Stainier,D.Y. (1999) Curr. Biol., 9, 1131–1134. [DOI] [PubMed] [Google Scholar]
- 49.Venot C., Maratrat,M., Dureuil,C., Conseiller E., Bracco,L. and Debussche,L. (1998) EMBO J., 17, 4668–4679. [DOI] [PMC free article] [PubMed] [Google Scholar]
- 50.Bartholomew C., Kilbey,A., Clarck,A.M. and Walker,M. (1997) Oncogene, 14, 569–577. [DOI] [PubMed] [Google Scholar]
- 51.Jiang S.W. and Eberhardt,N.L. (1996) J. Biol. Chem., 271, 9510–9518. [DOI] [PubMed] [Google Scholar]
- 52.Licht J.D., Hanna-Rose,W., Reddy,J.C., English,M.A., Ro,M., Grossel,M., Shaknovich,R. and Hansen,U. (1994) Mol. Cell. Biol., 14, 4057–4066. [DOI] [PMC free article] [PubMed] [Google Scholar]
- 53.Han K. and Manley,J.L. (1993) Genes Dev., 7, 491–503. [DOI] [PubMed] [Google Scholar]
- 54.Madden S.L., Cook,D.M., Morris,J.F., Gashler,A., Sukhatme,V.P. and Rauscher,F.J. (1991) Science, 253, 1550–1553. [DOI] [PubMed] [Google Scholar]
- 55.Triezenberg S.J. (1995) Curr. Opin. Genet. Dev., 5, 190–196. [DOI] [PubMed] [Google Scholar]
- 56.Gehring W.J., Affolter,M. and Burglin,T. (1994) Annu. Rev. Biochem., 63, 487–526. [DOI] [PubMed] [Google Scholar]
- 57.Damante G., Pellizzari,L., Esposito,R., Fogolari,F., Viglino,P., Fabbro,D., Tell,G., Formisano,S. and Di Lauro,R. (1996) EMBO J., 15, 4992–5000. [PMC free article] [PubMed] [Google Scholar]
- 58.Weiler S., Gruschus,J.M., Tsao,D.H., Yu,L., Wang,L.H., Nirenberg,M. and Ferretti,J.A. (1998) J. Biol. Chem., 273, 10994–11000. [DOI] [PubMed] [Google Scholar]
- 59.Van Heuverswyn B., Streydio,C., Brocas,H., Retetoff,S., Dumont,J. and Vassart,G. (1984) Proc. Natl Acad. Sci. USA, 81, 5941–5945. [DOI] [PMC free article] [PubMed] [Google Scholar]
- 60.Bone E., Kohn,L.D. and Chomczynski,P. (1986) Biochem. Biophys. Res. Commun., 141, 1261–1266. [DOI] [PubMed] [Google Scholar]
- 61.Gottesman S. (1984) Annu. Rev. Genet., 18, 415–442. [DOI] [PubMed] [Google Scholar]
- 62.Hu G., Vastardis,H., Bendall,A.J., Wang,Z., Logan,M., Zhang,H., Nelson,C., Stein,S., Greenfield,N., Seidman,C.E., Seidman,J.G. and Abate-shen,C. (1998) Mol. Cell. Biol., 18, 6044–6051. [DOI] [PMC free article] [PubMed] [Google Scholar]
- 63.Sorson M.W.,Wu,W., Dasen,J.S., Flynn,S.E., Norman,D.J., O’Connell,S.M., Gukovsky,I., Carriere,C., Ryan,A.K., Miller,A.P., Zuo,L., Gleiberman A.S., Andersen,B., Beamer,W.G. and Rosenfeld,M.G. (1996) Nature, 384, 327–333. [DOI] [PubMed] [Google Scholar]
- 64.Dasen J.S. and Rosenfeld,M.J. (1999) Curr. Opin. Genet. Dev., 9, 566–574. [DOI] [PubMed] [Google Scholar]
- 65.Fusco A., Berlingieri,M.T., Di Fiore,P.P., Portella,G., Grieco,M. and Vecchio,G. (1987) Mol. Cell. Biol., 7, 3365–3370. [DOI] [PMC free article] [PubMed] [Google Scholar]


