Abstract
In annular melt blowing, fiber formation is achieved by accelerating a molten polymer via drag forces imparted by high velocity air that attenuates the polymer jet diameter. The interactions at the polymer-air interface, which govern the motion of the jets and impact the resulting fiber characteristics, are important but not well understood yet. This work details the development and validation of a multiphase computational fluid dynamics (CFD) model to investigate these interactions and the effects of three key melt blowing process parameters (polymer viscosity and throughput, and air velocity) on two critical fiber attributes – whipping instability and fiber diameter. Simulation results highlighted that whipping instability was driven by the polymer-air velocity differential, and the fiber diameter was primarily modulated by polymer throughput and air velocity. The CFD model was validated by modulating the polymer and air throughputs and analyzing the fiber diameter experimentally. Empirical results showed good agreement between fabricated and model-estimated fiber diameters, especially at lower air velocities. An additional CFD simulation performed using a melt blowing nozzle geometry and process parameters described in literature also confirmed good correlation between model estimates and literature empirical data.
Keywords: Melt blowing, Multiphase CFD modeling, Nonwovens, Fiber formation process
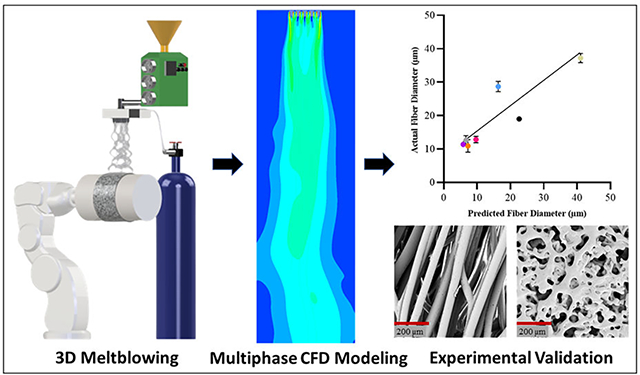
Graphical Abstract
1. Introduction
Polymer fiber fabrication processes are essential technologies for a breadth of commercial industries and products. Melt blowing processes, owing to their ability to manufacture a wide variety of microfibrous morphologies with a high throughput, has been utilized in diverse applications ranging from tissue engineering scaffolds1,2 to adsorbent media3–5 and filtration media6,7, and more. In annular melt blowing (Figure 1), a thermoplastic polymer is melted and extruded through a fiber fabrication die comprising several fiber formation nozzles. Each nozzle consists of a fine capillary through which the molten polymer is extruded surrounded by an annular air gap through which high temperature and pressure air is forced. The air expands upon exiting the fiber die, accelerating and forming a coalescent high-velocity jet that accelerates the polymer through drag forces. Upon such acceleration, the polymer jet experiences whipping instability and a resultant reduction in its diameter, producing a fiber that then cools as it travels through space. Melt blown fibers are subsequently aggregated on a collection system positioned in-line with the die, where the fibers overlay and produce a nonwoven web.
Figure 1.
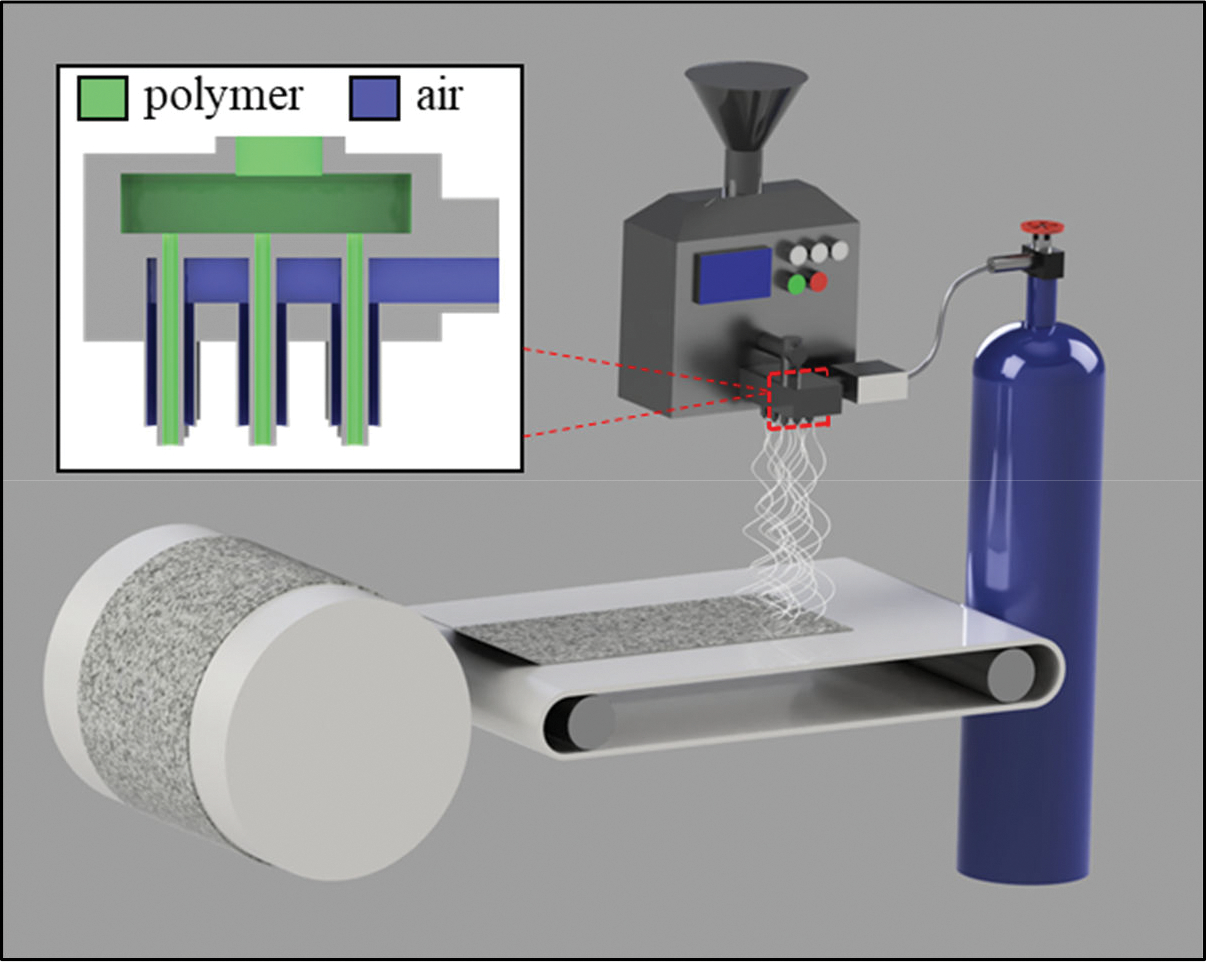
Schematic of a melt blowing system. Inset shows the cross-section of the fiber fabrication die.
The architecture of melt blown webs and their fibrous critical quality attributes interplay with their applications. For example, the pore size, fiber diameter, and permeability of the melt blown web are correlated with its particle filtration efficiency8, a key metric for air filtration and purification applications. Likewise, porosity, pore morphology, and fiber diameter affect the liquid adsorption rate and capacity of melt blown webs5, which govern their efficacy in applications such as chemical abatement, oil spill purification, and personal health products. Additionally, the fiber morphology, porous microarchitecture, and macrogeometry of melt blown scaffolds play a vital role in biomedical and tissue engineering applications1 by modulating the behavior of cellular and extracelleular components. As such, it is imperative to understand and control the interrelationships between melt blowing process parameters and web architectures to create reproducible, high quality products with properties fine tuned to their specific application and functions.
Key melt blowing parameters include the polymer melt viscosity (a function of melt temperature), polymer throughput, and attenuating air velocity, each of which has effects ranging across the system from fiber formation to web collection9–11. The polymer viscosity and throughput and the air velocity are central to the polymer jet’s velocity and motion. During fiber formation, the polymer’s acceleration at the fiber die results in both elongation of the polymer jet coaxial to the fiber nozzle and whipping instability and directional velocity oscillation orthogonal to the central axis of the fiber nozzle. The coaxial elongation is primarily responsible for reducing the polymer jet’s diameter and is modulated generally by the aforementioned process parameters. Increasing the polymer throughput or viscosity typically has a positive correlation to fiber diameter as it affects the overall polymer mass balance of the spin-line and polymer jet deformation. Likewise, increasing the attenuating air throughput for a constant polymer throughput produces smaller fibers as the drawing force is acting on a smaller mass. Similarly, other operating parameters can be tuned to vary the fiber morphology. These parameters also affect the fiber’s whipping instability, which modulates fiber entanglement and affects the fiber laydown patterns on the collector and resulting porous microarchitecture. The attenuating air velocity positively correlates with the magnitude of polymer jet whipping instability above a critical velocity required for the onset of jet instability12.
Unfortunately, the polymer and air jets’ attributes and interactions are challenging to empirically resolve online during manufacturing. Several components play into this challenge. The size scale at which the polymer jet exists is relatively small, while simultaneously, the velocity scale at which the polymer jet moves is quite large, making resolution of the jet and jet motion difficult, even for modern equipment. Strategies like high-speed, high-resolution photography13 and laser doppler vibrometry (LDV)10 have been used to characterize melt blowing polymer jet attributes. However, the parameter design space used in industrial melt blowing typically produces fiber jet motion with size and velocity scales that these methods have difficulty fully resolving across the domain polymer jet domain14. Further, seeding the polymer for LDV poses many challenges on its own, making this strategy suboptimal. Other strategies like hotwire anemometry15 and particle image velocimetry16 have been utilized to characterize melt blowing air-jet attributes. However, the results are highly dependent upon the localized melt blowing conditions and the often one-of-a-kind melt blowing apparatus used. Further, in characterizing attributes of either jet, any device placed under the melt blowing die will be contaminated with molten polymer; thus, such approaches necessarily must neglect the presence of the polymer jet. Even so, successful implementation of these strategies is not cheap or easy, requiring both high-cost equipment and specialized training.
Modern computing has primarily driven advancement in the formulation and solution of melt blowing simulations. Initial approaches centered upon one-, two-, and three-dimensional (3D) series of beads connected by viscoelastic spring-damper elements, representing a fiber, and successive approximation of solutions to systems of equations describing fundamental melt blowing aerodynamics and rheological dynamics17–19. Meanwhile, the development of computational fluid dynamics (CFD) systems was ongoing. Strategies employing CFD simulations initially approximated the air jet’s flow and temperature fields over the melt blowing domain and subsequent numerical approximation of the fiber jet dynamics in auxiliary models20–22. Such models neglected the polymer jet’s fundamental interaction with the air jet, given that the air jet flow field is solved independently and then used to approximate the polymer jet attributes in a separate model. With this approach, the interrelationships between the polymer jet’s motion and the air jet are lost. Other CFD models have utilized a fixed domain boundary condition to represent the axisymmetric flow of polymer for approximating the interaction between polymer and air jets23. In reality, the polymer jet and air jet share a moving free surface interface; thus, the effects of the polymer jet on the air jet and vice-versa in those models are diminished. Even recently, many models of melt blowing are based on the fundamentals mentioned above, comprising a series of beads24 or 3D numerical models with stochastic components25. The formulation and solution of these systems of quasilinear boundary value problems formulated with partial differential equations are nontrivial, requiring complex mathematical formulations and equally complex numerical approximation schema. While each modeling approach has advantages and limitations, a gap currently exists in melt blowing fiber formation models for one that is easily implemented, accurate, and resolves the critical interaction between the polymer and air jets.
To address this gap, here we develop a new approach to model annular melt blowing. Unlike the aforementioned models, this model can resolve the moving interface between the polymer and attenuating air jet. Such multiphase modeling provides a more accurate representation of the air and polymer jets’ motion because the free surface interface between the fluids is incorporated into the model formulation. This is to say that the air’s effect on the polymer and vice versa are captured in this model, which is essential for building an accurate representation of the polymer jet’s whipping instability and estimating the resultant fiber diameter.
To do so, we first created a model that couples multiple fluids through free surface interfaces to represent the flows of the polymer and the air in the melt blowing process. Once the multiphase model was formulated, we then assigned relevant boundary conditions and approximated solutions to the multi-fluid transport equations across a discretized mesh of computer-aided design geometry using a commercial software package, ANSYS Fluent (ANSYS, Canonsburg, PA). The approximated solution simulated annular melt blowing using relevant fiber formation parameters such as polymer viscosity, polymer throughput, and attenuating air throughput. The effects of these parameters on fiber motion, whipping instability, and fiber diameter were computationally characterized. Finally, the relationships between these parameters and fiber diameter were experimentally validated using a multipronged approach
2. Multiphase CFD modeling of melt blowing
Fiber formation in the melt blowing process fundamentally relies on coaxial flows of two fluids, a molten polymer and high-velocity air. The annular melt blowing nozzle geometry (Figure 2) comprising a capillary through which the molten polymer is extruded and a surrounding coaxial opening through which high-pressure air flows, drawing the polymer from the capillary tip towards the collector, governs these fluids’ initial interactions. In this study, the CFD model utilized a two-dimensional (2D) representation of the annular die – the air was supplied from two parallel rectangular inlets, reflecting a cross-section of the annular air gap, while the polymer was provided from a single rectangular inlet centered between the air inlets, reflecting the polymer capillary cross-section. The coaxial attenuating air flowed from the respective inlets at high velocity, while the polymer flowed from the separate inlet at low velocity. Near the polymer capillary tip, the attenuating air accelerated the polymer via frictional drag forces, forming a fine jet that travels through the remaining domain. The CFD domain was set up as a 2D rectangular planar geometry reflecting the area directly beneath the fiber die where the fiber diameter is primarily reduced and providing sufficient space to observe the whipping instability of the polymer jet.
Figure 2.
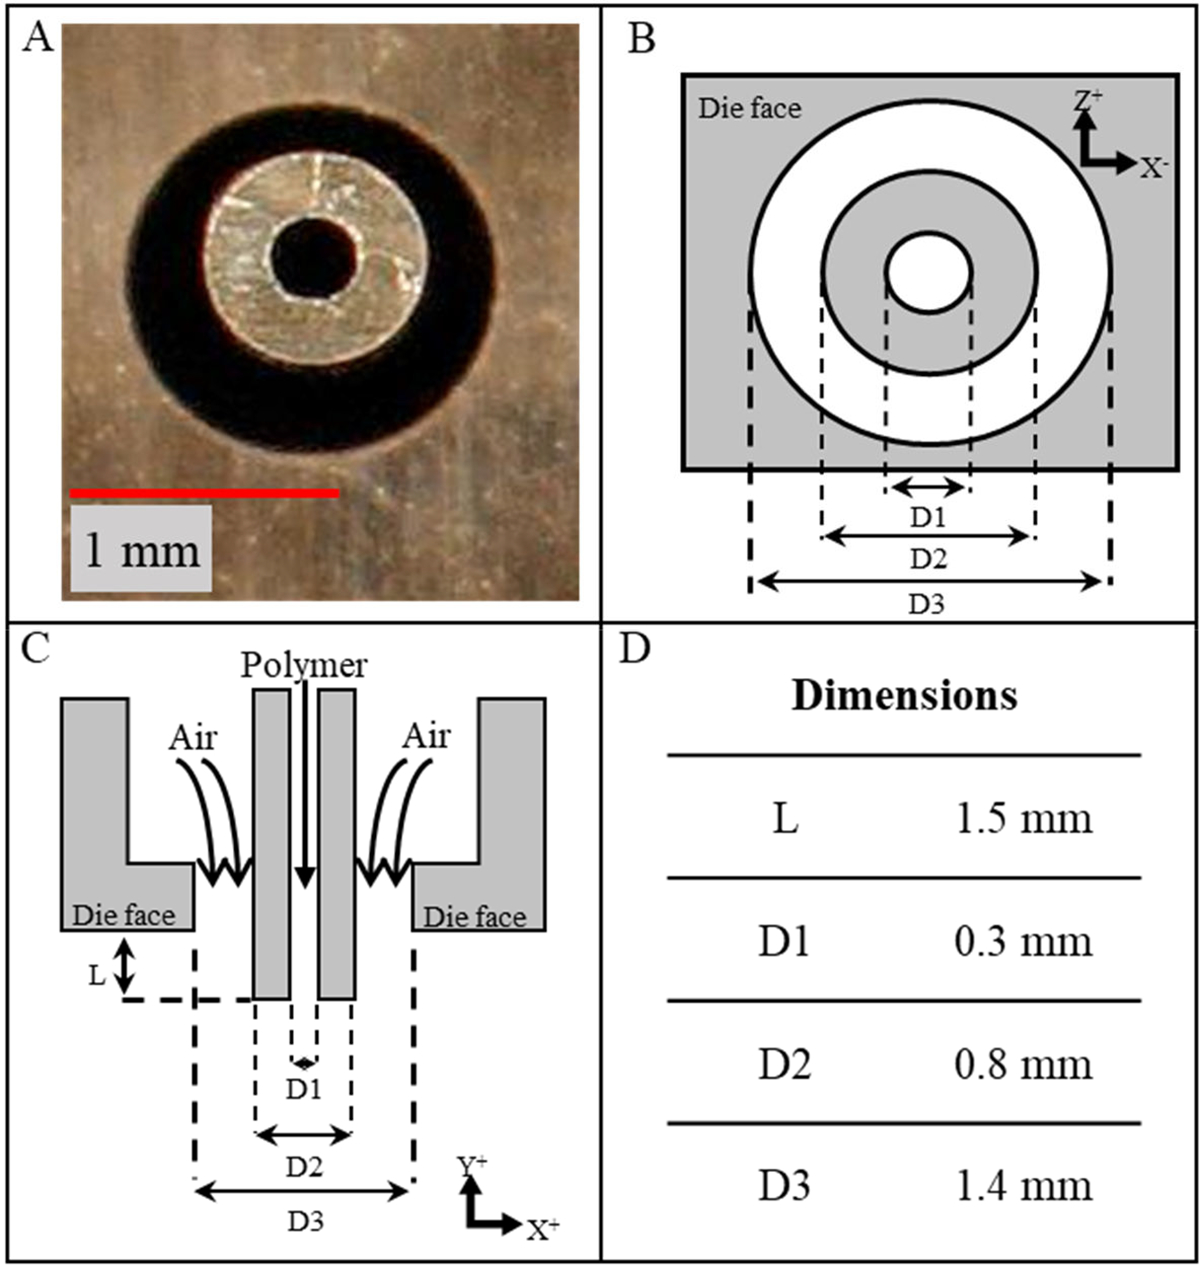
(A) Bottom-up photograph of an annular melt blowing nozzle; (B-D) schematics (bottom-up view, cross-sectional view) and dimensions of the annular nozzle with the central capillary for the polymer melt and coaxial outlet for attenuating air used in the CFD modeling in this study.
A CFD model formulation comprising of two Eulerian fluid flows was chosen for its ability to model separate and nonpenetrating phases and a sharp interface between them. This was applied to simulate the air and polymer jets as a two-phase flow using a volume of fluid method. In this method, a sharp, non-dispersive boundary was assigned between the fluids and allowed for the formulation of individual phase velocities and temperatures. The volume fraction of a phase was defined as the proportion of space occupied by that phase in a computational domain element. The volume fraction, when mapped across the geometry, tracked the interface between the two phases. The laws of conservation of mass and momentum were applied to each phase individually. The volume of phase , , was then defined by Eq. (1):
| (1) |
where is the volume fraction of phase . The following continuity, Eq. (2), must be satisfied such that the sum of the volume fraction of the phases in each element is 1.
| (2) |
The effective density of phase , , was defined by Eq. (3):
| (3) |
where is the physical density of phase .
Fluid transport in the domain as well as the interface between polymer and air fluids in the model, as the volume fraction, was approximated by the solution of a continuity equation, Eq. (4):
| (4) |
where is the phase reference density, or the volume-averaged density, of the phase in the solution domain, the velocity of phase , and the mass transfer from phase to , and vice-versa, and the mass transfer from phase to . Because the fluids were treated as immiscible and inert, no mass was transferred between them. A momentum conservation equation further governed the flow, Eq. (5):
| (5) |
where is the pressure shared by all phases, the acceleration due to gravity, an interphase momentum exchange coefficient, an external body force, a lift force, a wall lubrication force, a virtual mass force, a turbulent dispersion force, and the phase stress-strain tensor given by Eq. (6) with and as the shear and bulk viscosity of phase . No lift, turbulent dispersion, or wall lubrication models were modified from default. Virtual mass force modeling to study the accelerating polymer phase was included and unmodified from the default option.
| (6) |
The overall turbulence model for melt blowing simulations should be chosen based upon the amount of expected turbulent kinetic energy in the system. Less complex modeling schema are needed when an annular die is implemented as the directions of the 2D air jet flows are parallel. Thus, turbulent kinetic energy and turbulent mixing are lower than inset dies, where the air flows are directed towards each other and therefore produce significant amounts of turbulent kinetic energy. The k-epsilon model has been shown to be sufficient for modeling the turbulent regimes of annular melt blowing26, therefore we chose the two-equation k-epsilon mixture turbulence model as defined by Eqs. (7,8):
| (7) |
| (8) |
where is the turbulence kinetic energy, the rate of turbulence dissipation, the turbulent viscosity for the mixture, and and the turbulent Prandtl numbers. The term represented the generation of turbulence kinetic energy for the mixture, , were additional source terms for turbulence between phases, and constants ,
The mixture density, , molecular viscosity, , and mixture velocity, , were calculated from Eqs. (9–11):
| (9) |
| (10) |
| (11) |
where , , , are the volume fraction, density, viscosity, and velocity of the phase, respectively.
3. CFD simulation study
The CFD model was set up in ANSYS in a multistep procedure to capture the process physics described in section 2. First, the 2D annular melt blowing nozzle geometry was defined. The remaining spatial domain was then defined wherein the polymer and air jet motion would typically exist. A structured mesh was applied across this space, and relevant boundary conditions were specified. Subsequently, solutions to the multiphase fluid flow governing Eqs. (1–11) were approximated to model the fiber formation process.
3.1. Model geometry and mesh generation
An annular nozzle geometry derived from a Biax die (Biax Fiberfilm, Waterloo, WI), commonly used in melt blowing, was utilized. The CFD domain was set as a 2D rectangular planar geometry, 10 × 50 mm (Figure 3A). The 2D nozzle geometry and specifications (Figure 2) were translated to DesignModeler, the built-in CAD package in ANSYS (Figure 3B). A quadrilateral structured mesh with a specified element size of 0.1 mm was generated across the computational domain, providing high spatial efficiency discretization (Figure 3C). The resultant 100,000 element mesh was significantly refined compared to previous works20.
Figure 3.
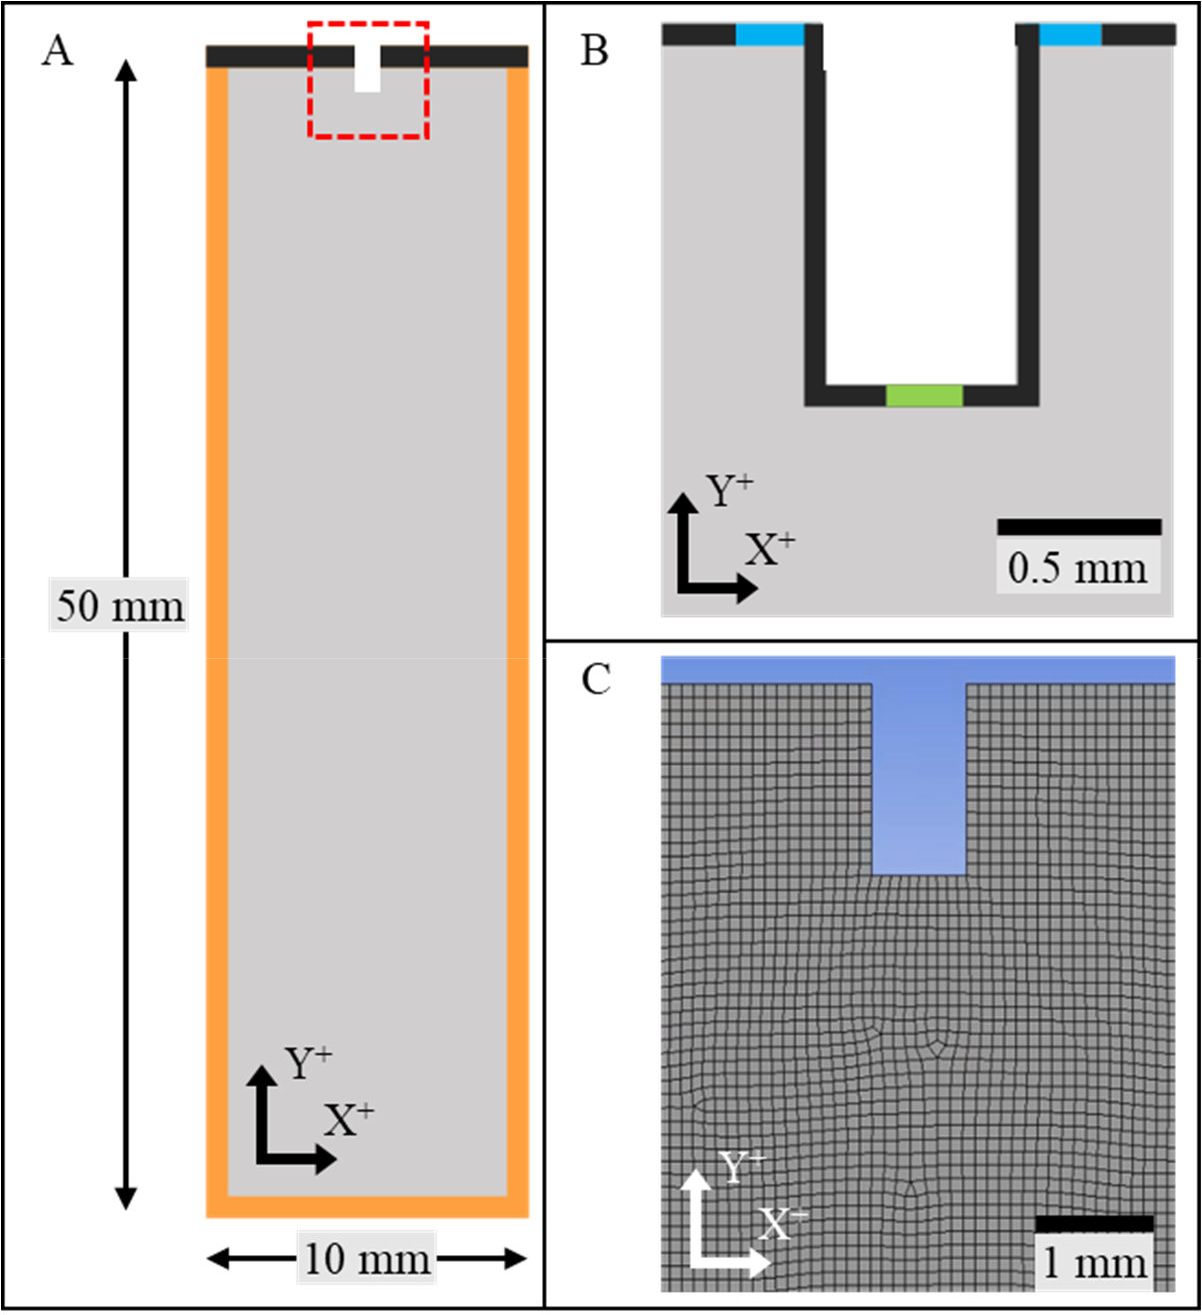
CFD model geometry (A) computational domain and geometry with walls (black) and pressure outlets (orange); (B) close up view of annular melt blowing nozzle with air inlets (blue) polymer inlet (green); (C) nozzle geometry with 0.1 mm quadrilateral mesh.
3.2. Fiber formation model boundary conditions
Three melt blowing process parameters: polymer viscosity, polymermass throughput, and attenuating air velocity, were considered and varied in a factorial design of experiments with polycaprolactone (PCL; Mw 43,000) as the model material. PCL is a thermoplastic that is widely utilized in biomedical applications using a variety of manufacturing processes including melt blowing1. The parameter levels (Table 1) were determined based upon estimated PCL density of 1.145 g/cm 3 and dynamic viscosities bracketing those of PCL melted to 120°C27. The polymer velocity boundary condition was calculated based on mass throughput rates utilized in melt blowing PCL with the Biax die geometry (Figure 2). Gravity was specified as −9.8 m/s2 in the y-direction. The polymer inlet was set as a velocity inlet with initial volume fractions of polymer = 1 and air = 0. All material parameters for the air were standard material properties from the ANSYS materials database. The air inlets were set as velocity inlets and the boundary condition calculated based on mass throughput rates utilized in melt blowing PCL with the Biax die geometry (Figure 2), with initial volume fractions of polymer = 0 and air = 1. Surface tension modeling between the viscous polymer fluid and the air was included but not modified, wherein the surface tension coefficient was approximated as 0.1 N/m28. The left, right, and bottom boundaries were set as pressure outlets with ambient pressure = 0 Pa, while all other boundaries were defined as walls.
Table 1:
Fiber formation model boundary conditions for polymer and air parameters
| Polymer Viscosity (Pa-s) | Polymer Velocity (m/s) | Attenuating Air Velocity (m/s) |
|---|---|---|
| 8 | 0.01 | 30 |
| 10 | 0.02 | 97 |
| 12 | 0.03 | 135 |
3.3. Solution method
Simulations were built and executed on a PC (Dell Precision Tower 7810, Dell, Round Rock, TX) running a Windows 10 64-bit operating system. The PC utilized 40 processing cores, 2.2 GHz each, with 128 GB RAM. ANSYS Fluent was run in 2D-double precision, using all 40 cores of the PC.
Fluent uses finite-element discretization to approximate solutions to fluid flow governing equations. To do so, Fluent utilizes several discretization schema. First, a phase-coupled SIMPLE algorithm was utilized for pressure-velocity coupling, wherein the velocities are coupled by phases in a segregated fashion. The least-squares cell-based spatial discretization for gradient evaluation was implemented, as was the Pressure Staggering Option (PRESTO!) pressure discretization scheme. Other discretization methods included first-order upwind for momentum, compressive for volume fraction, first-order upwind for turbulent kinetic energy, and first-order upwind for turbulent dissipation rate. First-order implicit was utilized for the transient formulation. No high order term relaxation was utilized.
An automatic hybrid method was utilized for model initialization. Airflow fields were initially solved and allowed to converge in a single-phase model using a velocity specific time step size, 1000 time steps, and a maximum of 10 iterations per step (Table 2). Heterogeneous time step sizes were necessary to minimize computational expense, ensure numerical stability and maintain low Courant number, as defined by Eq. (12)
| (12) |
where is the fluid velocity, is the time step size, and is the distance between mesh elements.
Table 2:
Initial air flow field solution time step sizes
| Air Velocity (m/s) | Time Step Size (s) |
|---|---|
| 30 | 10−4 |
| 97 | 10−5 |
| 135 | 10−5 |
After the air flow approximation, the secondary phase polymer flow was initialized. This is not to suggest that the polymer and air flows were solved separately. The airflow regimes are highly transient due to the initial impulse of high velocity from the inlet; thus, it was first necessary to establish convergent air field responses before introducing the low-velocity polymer and modeling the multiphase interactions. Vice-versa, if the polymer was introduced before the attenuating air, the surface tension of the fluid would dominate the governing equations and lead to unstable fluid aggregation and rapid model divergence. In essence, once a convergent air flow field was established, the polymer phase was initialized and introduced to form the multiphase model. Multiphase model solution convergence was achieved using a polymer velocity specific time step size, number of time steps, and ten iterations per step, to rapidly achieve ~10−4 convergence of all residual variables, as summarized in Table 3. Again, heterogeneity was utilized to maintain low Courant number, improve numerical stability, and minimize computational expense.
Table 3:
Multiphase solution time step sizes and number of steps
| Polymer Velocity (m/s) | Time Step Size (s) | Number of Steps |
|---|---|---|
| 0.01 | 10−3 | 200 |
| 0.02 | 10−4 | 1000 |
| 0.03 | 10−4 | 1000 |
4. Model validation
A multipronged approach was used to validate this model. First, we used a melt blowing apparatus with die geometry shown in Figure 2 to manufacture 1 mm thick PCL fiber mats (n = 1) at select parameters (Table 4). Briefly, PCL (Mw 43,000, Polysciences Inc, Warrington, PA) was melted to 120°C and extruded through a Biax fiber fabrication die1. High pressure, 140°C attenuating air generated by an industrial air-process heater (Backer Hotwatt, Danvers, MA) was forced through the Biax die to draw melt blown PCL fibers. The fibers were collected on a rotating mandrel (Ø 210 mm) with surface velocity 100 m/min, controlled and positioned by a high-speed industrial 6–axis robotic arm (Denso, Japan). Polymer throughput and attenuating air velocity were varied following a factorial design of experiments (Table 4), which reflected a subset of the factorial design used in the CFD simulations.
Table 4:
Polymer and air throughput parameters used during experimental validation
| Polymer Throughput (g/nozzle/min) | 0.10 | 0.15 | |
| Attenuating Air Throughput (L/min) | 35 | 110 | 175 |
The whipping instability of fibers manufactured at a constant polymer throughput of 0.1 (g/nozzle/min) and air throughputs of 35, 110 and 175 L/min was analyzed via in-process, high-speed photography (A7R4a camera, Sony; shutter speed = 1/8000 s). For the fiber diameter analysis, discs (Ø 8 mm, n = 2) were punched at random locations in each sample, sputter-coated with a 60:40 ratio of gold to palladium for 90 s at 29 mA DC and 0.05 Torr (Denton Vac, Moorestown, NJ) and imaged via scanning electron microscopy (SEM; Phenom Pro, Phenom, Netherlands) at 5 kV accelerating voltage. 450x micrographs (n = 3 per sample) were captured at substantially different locations on each disc. Fiber diameters were measured from the these micrographs using ImageJ (n = 90 per sample).
To further validate the CFD model, a common annular melt blowing geometry described in literature20,29 (Figure 4) was utilized to construct the multiphase model. Relevant boundary conditions were adopted from literature as follows29,30: polymer density = 0.598 g/cm3, polymer viscosity 38.37 Pa-s, initial polymer velocity = 0.049 m/s, attenuating air velocity = 110 m/s, and surface tension coefficient = 0.7 N/m. The solution to this multiphase flow model was approximated as in section 3.3. Polymer velocity streamline data was isolated to estimate the fiber diameter. Fiber diameters that were estimated from the multiphase CFD simulations were compared to the corresponding ones obtained experimentally by us and to the ones reported in literature. A linear regression was fit to the predicted vs. actual fiber diameter data for both validation approaches and the coefficient of determination, R2, is being reported.
Figure 4.
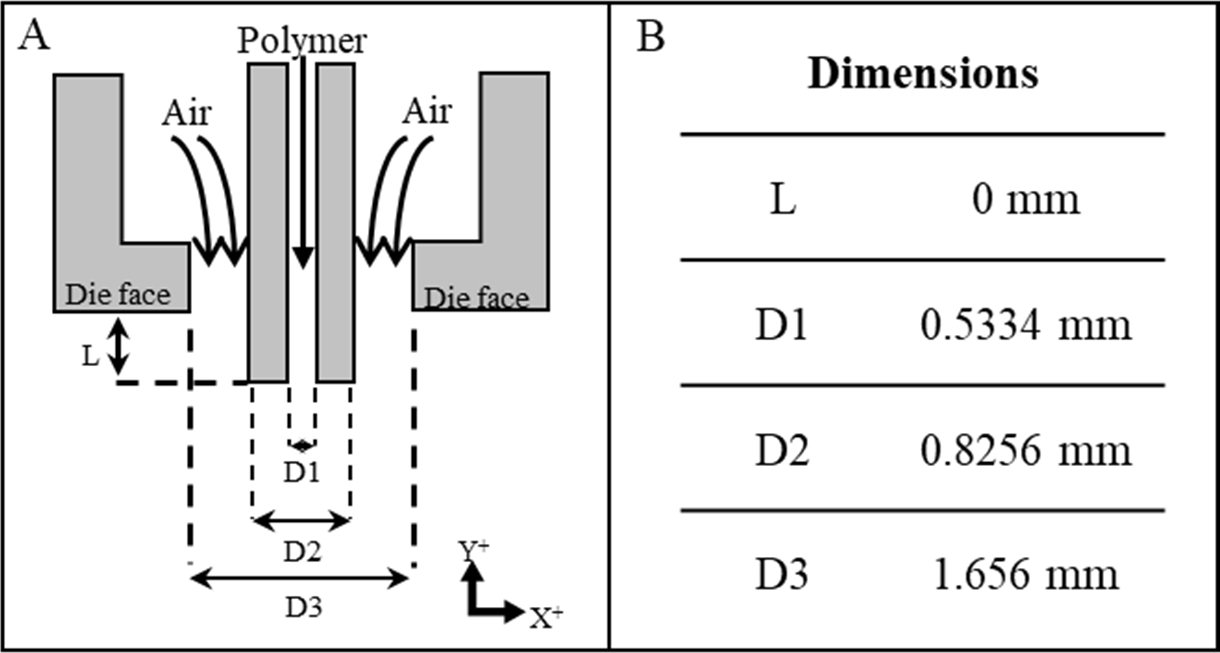
(A) Geometry, and (B) dimensions of the melt blowing fiber formation die20,29 used in the second validation study
5. Results and Discussion
5.1. Simulated multiphase jet characteristics
CFD simulations were employed to model the multiphase air and polymer flow fields through a representative 10 × 50 mm melt blowing domain. Representative air jet velocity contours isolated from the multiphase models for each combination of attenuating air velocity, polymer velocity, and viscosity (Table 1) are shown in Figure 5. In all simulations, the air was issued from the inlets at the respective boundary condition velocity and traveled along the polymer nozzle. The air jets displayed varying degrees of convergence below the nozzle, with little convergence observed in the lowest air velocity (Figure 5A). Increasing the air velocity produced greater air jet convergence and impingement of the polymer jet beneath the nozzle (Figure 5B, C). This is critical for melt blowing, as polymer jet deformation and acceleration are primarily modulated by drag forces imparted by the attenuating air. The modeled air jets were asymmetric about an axis through the polymer nozzle from the polymer and air jets’ convergence point to the bottom outlet, resultant from polymer jet interaction. Such interactions between the polymer jet and the airflow field were noted in each simulation, which highlights the importance of using a multiphase model to analyze the process. While native and inherent to the multiphase model, these interactions would otherwise be challenging to fully capture in other approaches such as the aforementioned spring-damper model. In the spring-damper model, the air flow field is solved via CFD, exported, and used to model the fiber motion through a numerical model, neglecting to capture the effect of the polymer fiber on the air flow.
Figure 5.
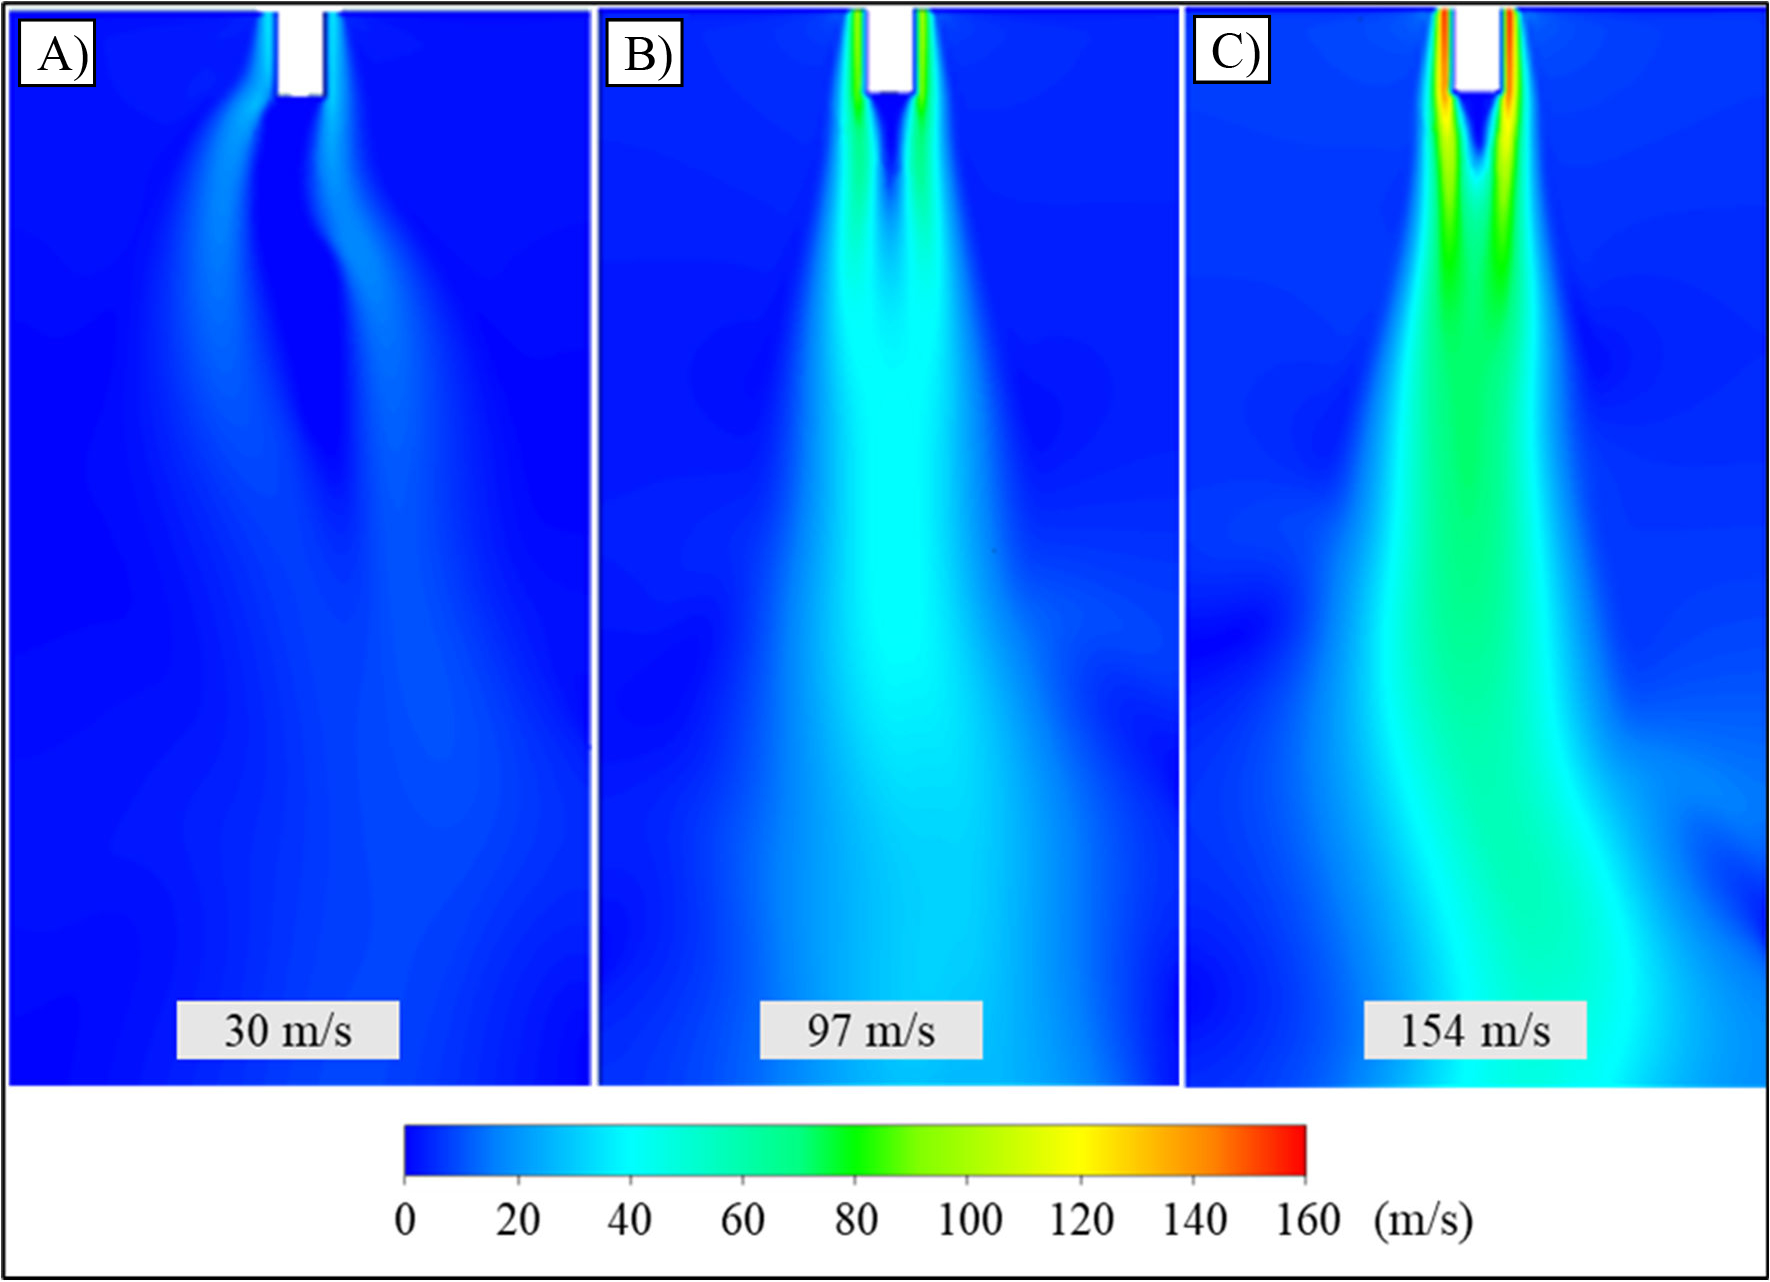
Representative CFD air jet velocity contours for three levels of air velocity – A) 30 m/s, B) 97 m/s, C) 154 m/s – near the melt blowing nozzle with initial polymer velocity and viscosity of 0.02 m/s and 10 Pa-s, respectively
Polymer jet velocity streamlines (representative examples in Figure 6) were isolated from multiphase models for further analysis. The polymer was issued from the respective inlet, and to various degrees, subsequently accelerated across the domain dependent upon the processing conditions. Velocity decompositions were isolated from the polymer velocity streamlines in the principal X- and Y-directions. Various degrees of whipping instability were observed in the X-velocity plots, wherein the values oscillated between positive and negative across the domain. Positive X-velocity corresponded to movement along the positive X-axis and vice-versa.
Figure 6.
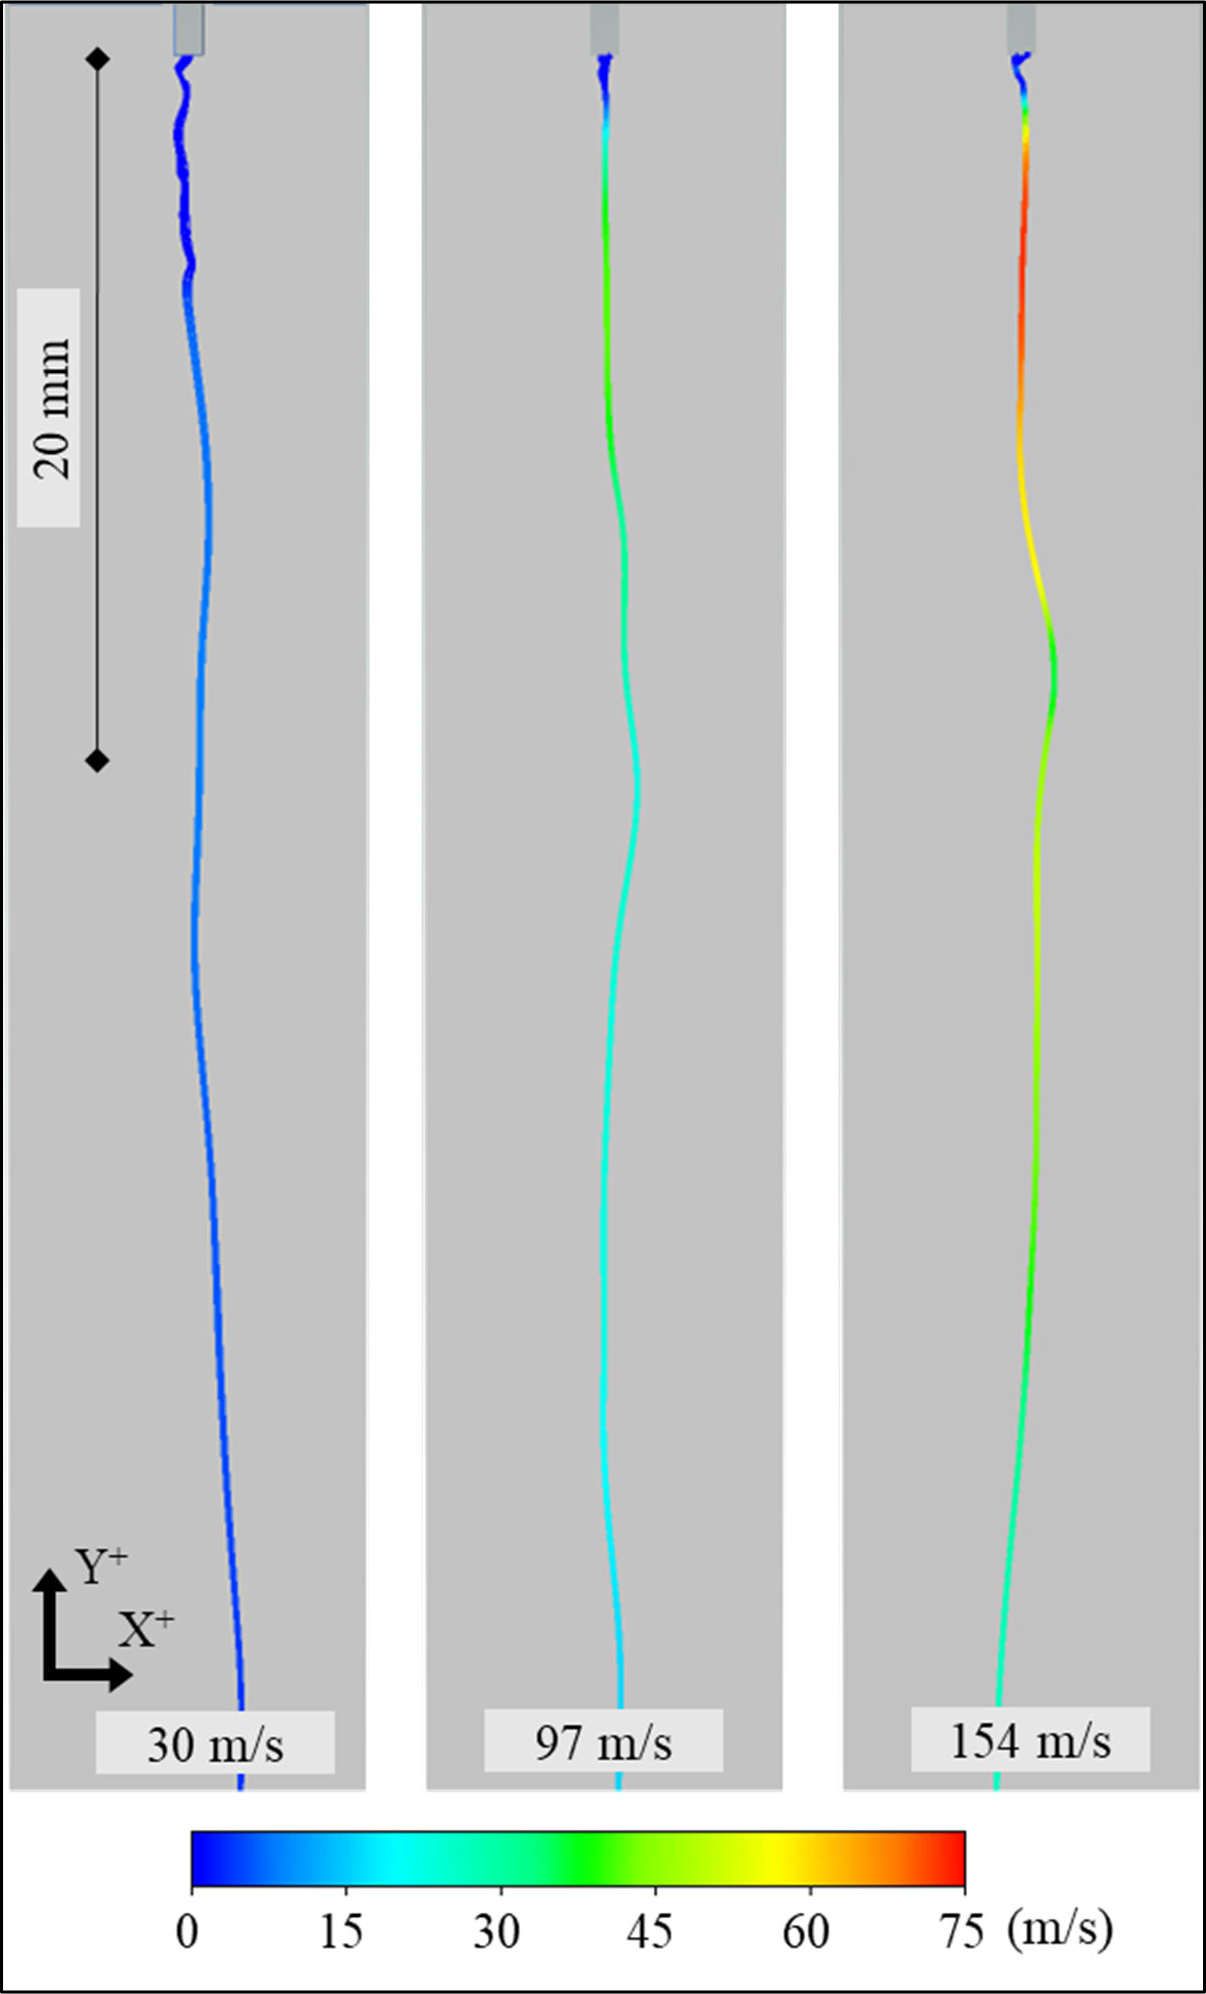
Representative polymer jet streamlines for three levels of air velocity (30, 97, 154 m/s) with initial polymer velocity and viscosity of 0.02 m/s and 10 Pa-s, respectively
Given that the polymer material was issued through the nozzle at a constant flow rate and assumed constant density, mass balance can be applied to estimate the polymer jet diameter at a given position by rearranging Eq. (13):
| (13) |
where is the polymer jet diameter, is the polymer velocity, and is the polymer flow rate. This equation was solved for polymer jet diameter based on the maximum polymer streamline Y-velocity in the region 20 mm below the polymer nozzle, which is the region of polymer jet acceleration characterized by polymer jet isothermal stability17.
5.2. Effect of processing conditions on simulated polymer jet whipping instability
As previously mentioned, polymer jet whipping instability is a fundamental phenomenon in the melt blowing process that affects fiber entanglement and microarchitecture of the final melt blown web. In theory, the critical velocity, 12, required to produce perturbation of coalescent free liquid jets and initiate whipping instability is defined by Eq. (14):
| (14) |
where is the jet surface-tension coefficient, is the air density, and is the radius of the unperturbed jet. For this study, was approximated for PCL at 120°C as 0.1 kg/m2 27, , and , the radius of the polymer nozzle in this study. for this system was was calculated to be 23 m/s, suggesting an increasing magnitude of whipping instability for attenuating air velocities above this value.
Figure 7 shows the polymer jet X-velocities (i.e., velocities along the X-axis) for processing conditions comprising different combinations of polymer viscosity (8, 10, 12 Pa-s), initial polymer velocity (0.01, 0.02, 0.03 m/s), and attenuating air velocity (30, 97, 154 m/s). Whipping instability presented in these simulations by way of polymer streamline oscillation between positive and negative X-velocities (i.e., movement right and movement left with some periodicity). The magnitude of whipping instability was approximated by the X-velocity whipping amplitude, or the difference in the most positive and most negative X-velocity achieved by the polymer. Various degrees of whipping instability were noted across the ranges of processing parameters. Parameter combinations with 30 m/s attenuating air velocity produced the least whipping instability, aligning with the theory that limited whipping instability would be observed for air velocities near 23 m/s as previously calculated.
Figure 7.
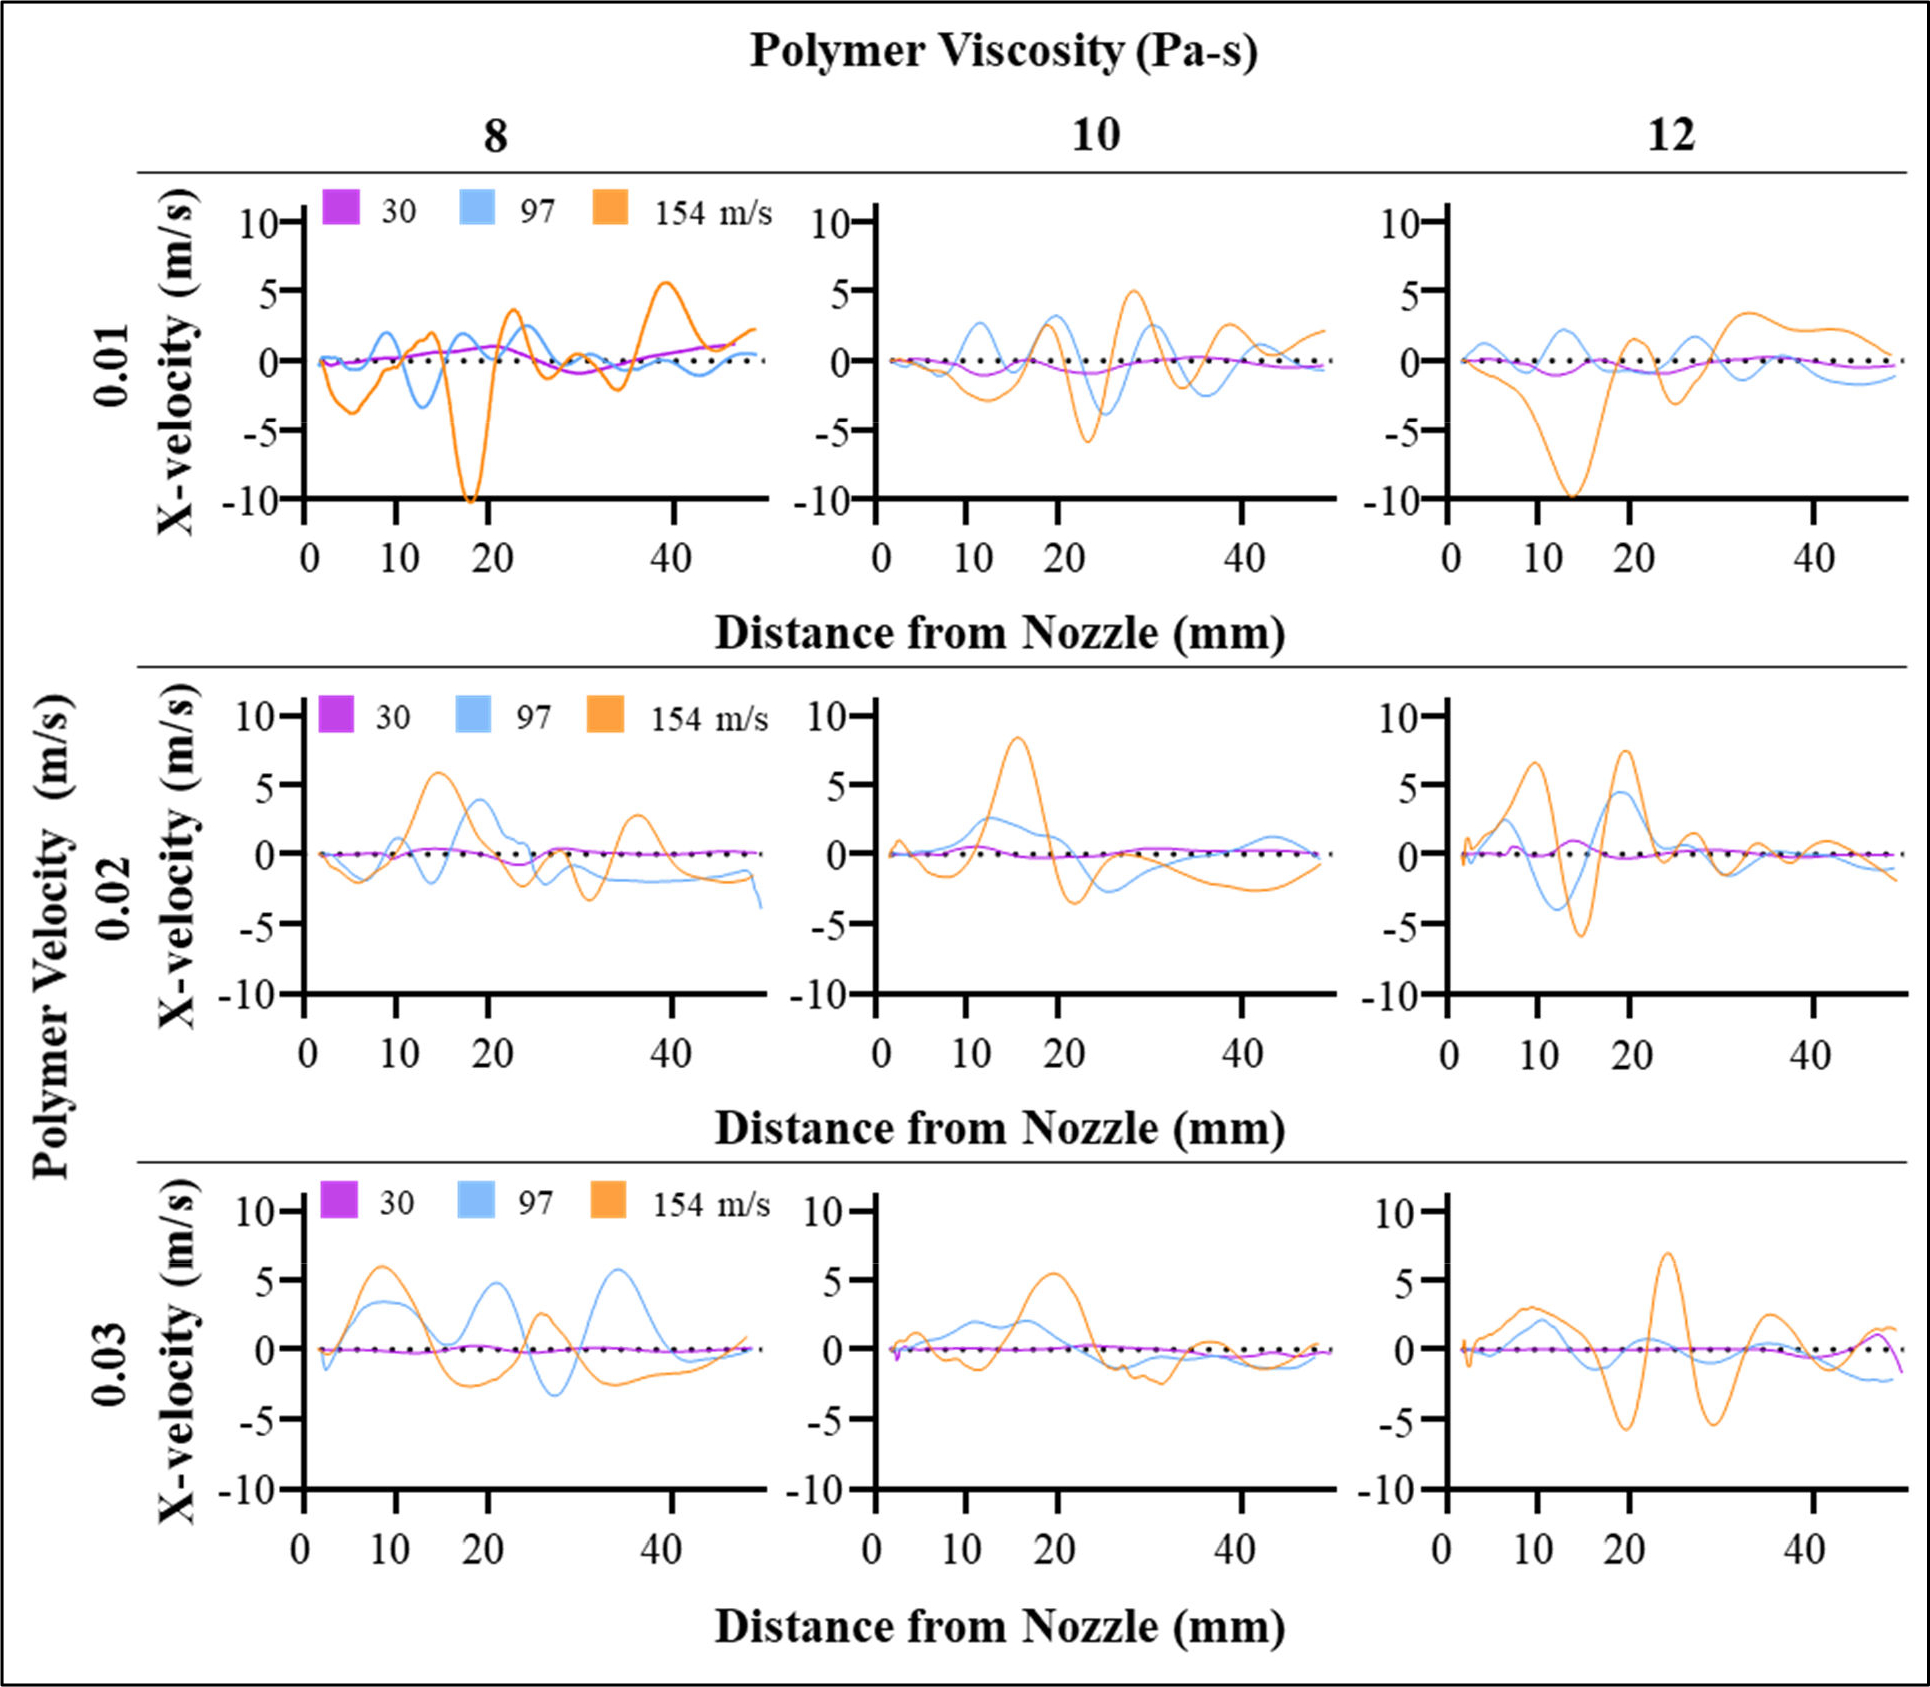
Simulated polymer jet X-velocities grouped by processing conditions
Accordingly, increasing X-velocity whipping amplitude was observed uniformly across all processing parameters as the attenuating air velocity increased from 30 m/s to 97 and 154 m/s (Figure 8). This trend can be attributed to the increase in drag forces imparted by the attenuating air due to increasing velocity differential between the air and polymer, resulting in increased whipping instability as velocity increases above . Minor differences in the primary whipping regions’ length were observed in simulations with appreciable whipping instability. Lower viscosities produced longer whipping regions as the rheological forces resisting deformation decrease with decreasing viscosity, particularly for simulations with initial polymer velocity of 0.02 m/s. However, these effects were generally mixed when holistically considering all simulations. Future sensitivity studies can model more contrasting levels of polymer viscosity to study the effect of this parameter on whipping region length. Initial polymer velocity did not appear to affect the resultant polymer jet whipping instability. This suggests that this parameter did not modulate the primary drag forces between the air and polymer jets, confirming that the primary processing parameter driving the onset of whipping instability is the air jet velocity.
Figure 8.
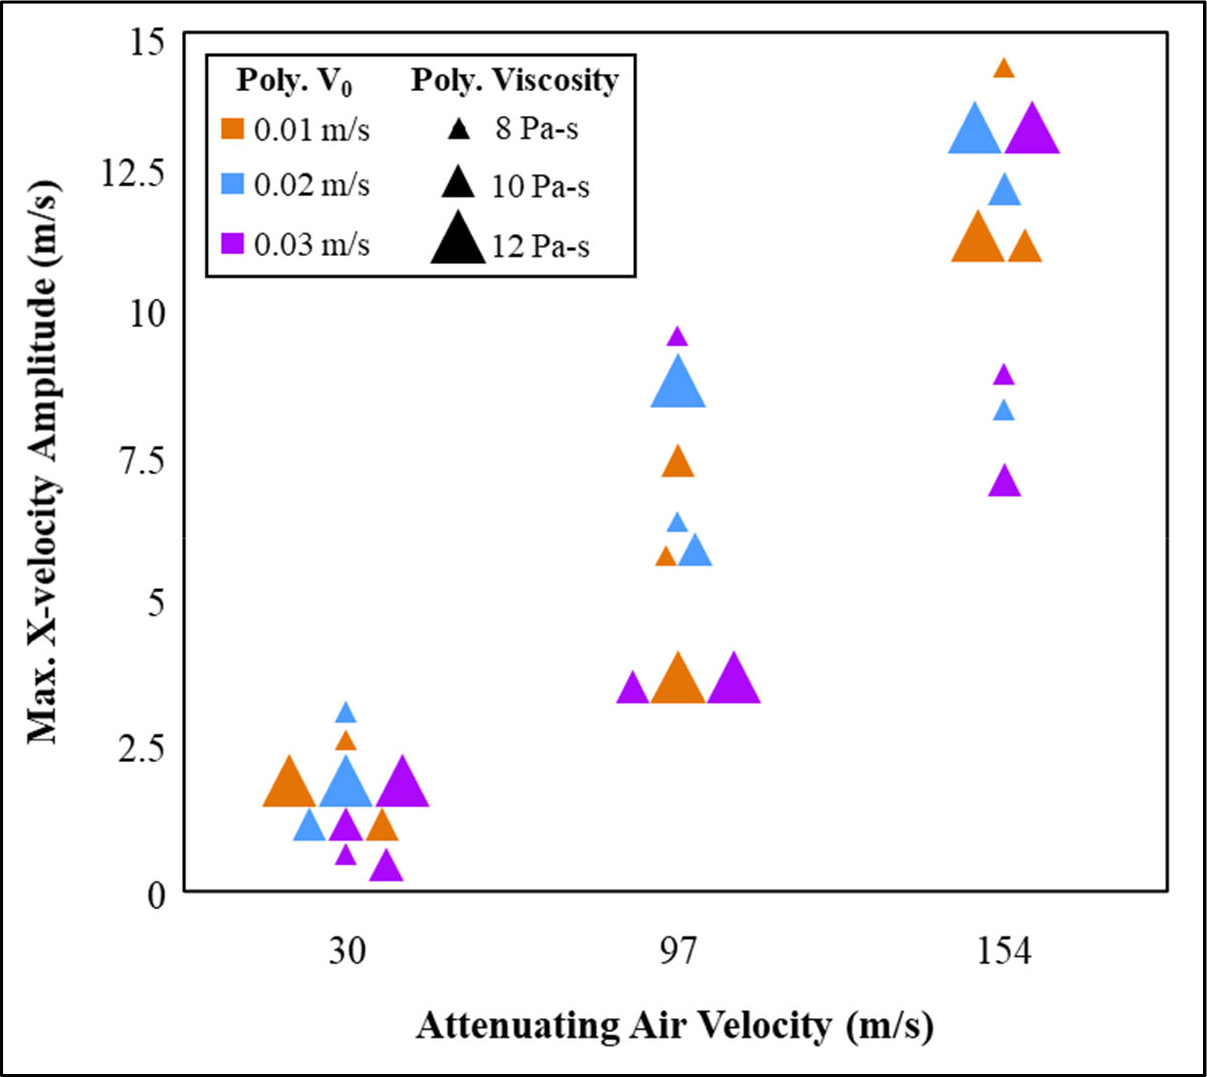
Maximum peak-to-peak X-velocity whipping amplitude for all simulations
5.3. Effect of processing conditions on estimated fiber diameter
Figure 9 shows the estimated fiber diameters, as calculated from Eq. (13), mapped across different combinations of polymer viscosity (8, 10, 12 Pa-s), initial polymer velocity (0.01, 0.02, 0.03 m/s), and attenuating air velocity (30, 97, 154 m/s). From this plot, the initial polymer velocity through the polymer capillary and the attenuating air velocity were identified to be the primary factors governing the resultant fiber diameter. Reducing the polymer velocity (i.e., reducing the polymer mass throughput through the capillary) produced finer fiber diameters for a given air velocity due to the same drag force from the air acting on a smaller fiber mass, the result of which was greater drawing and diameter reduction. Likewise, increasing the accelerating air velocity (i.e., increasing the attenuating air throughput) produced finer fibers. This can be attributed to the increase in the drag forces acting upon the polymer jet due to the increase in velocity differential between air and polymer, resulting in greater polymer acceleration and more diameter reduction. Accordingly, the largest fiber diameters were observed at the highest polymer velocity, 0.03 m/s (0.15 g/nozzle/min), and the lowest attenuating air velocity, 30 m/s(35 L/min). In the similar vein, the finest fibers were produced at the lowest polymer velocity, 0.01 m/s(0.05 g/nozzle/min), and the highest attenuating air velocity, 154 m/s (175 L/min). No observable trends in fiber diameter were attributable to changes in the polymer viscosity, but future studies may consider levels of this parameter with greater contrast to elucidate such effects.
Figure 9.
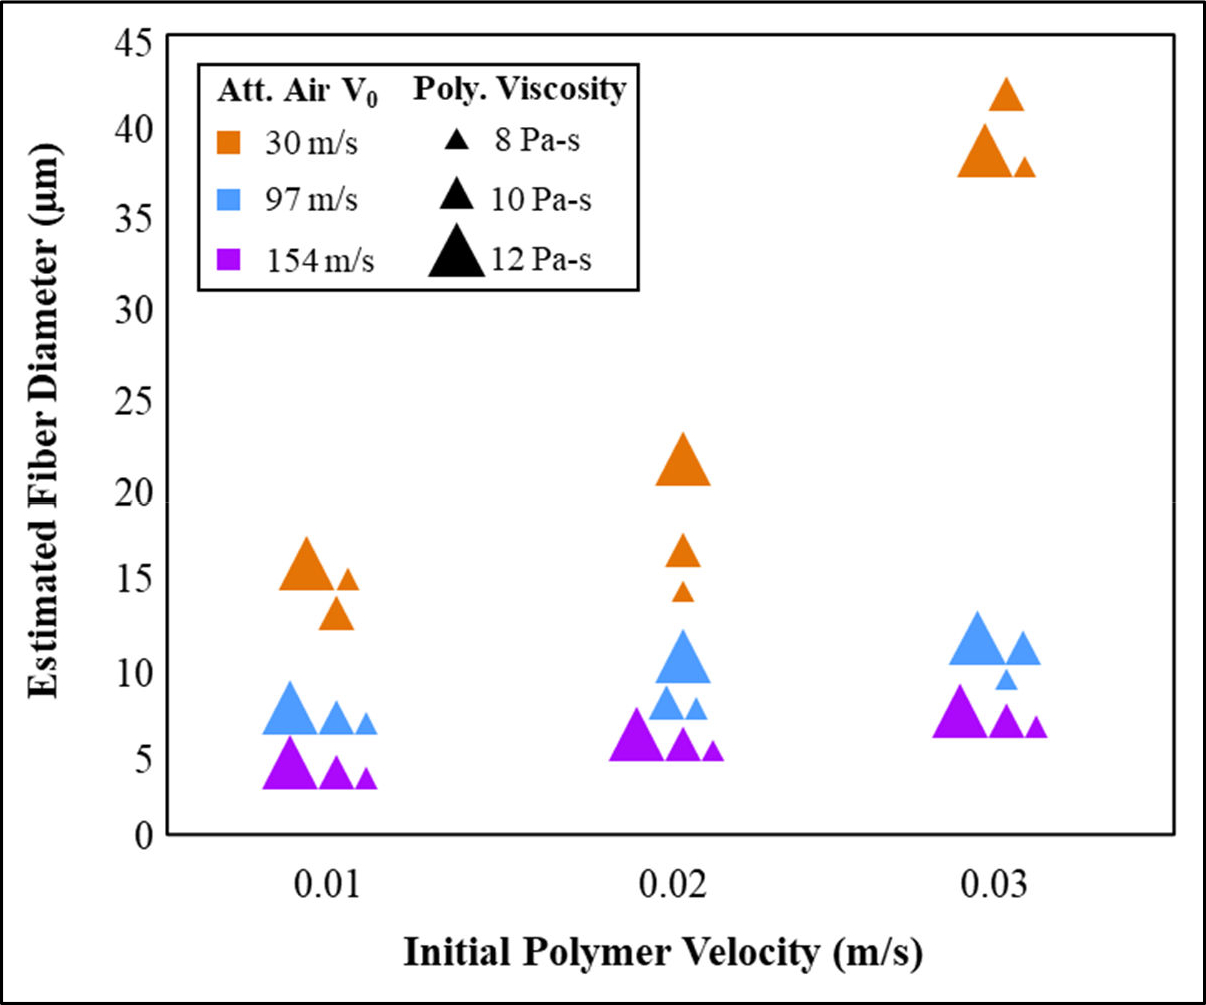
Estimated fiber diameters for all processing conditions
5.4. Model validation
The annular Biax die (Figure 2) was used to analyze the trends in whipping instability of the PCL fibers produced by modulating attenuating air throughputs at a constant polymer throughput. In the CFD simulations and actual experiments, the whipping instability was represented by the oscillation of polymer streamline along the X-axis in the simulations and the actual melt blown fibers. Figure 10, shows a snapshot of representative fiber motion and whipping action at different air throughputs. As the fibers move along the Y-axis-direction, they also get displaced in the X-direction to form a cone18,31. It was observed that the width of the cone in the X-Y plane increased with increasing air throughput. The smallest whipping instability, incidated by the narrowest cone, was observed at 35 L/min air throughput, while the most whipping instability was observed at the greatest air throughput (175 L/min), all other parameters remaining constant. This reflects the trends highlighted by the CFD model (Figure 8).
Figure 10.
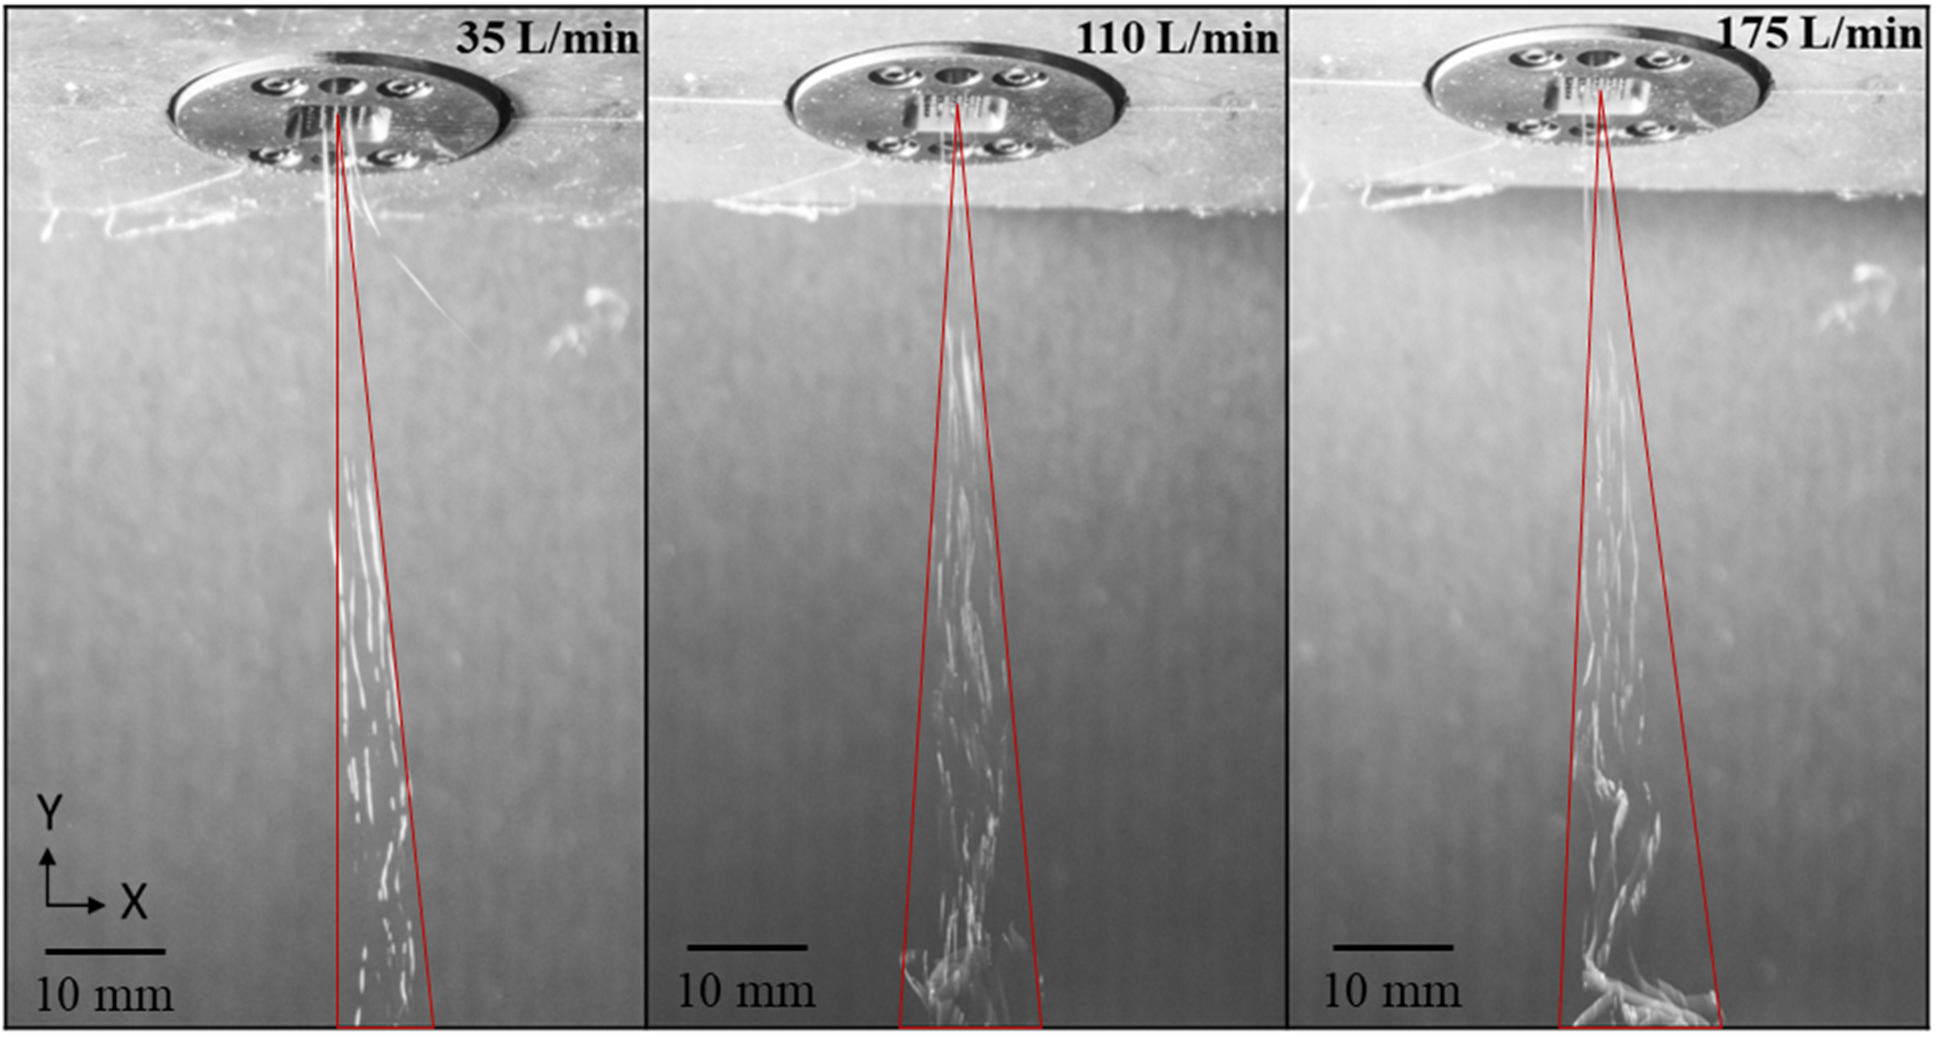
Representative experimental polymer jet streamlines for three levels of air velocity (35, 110, 175 L/min) at a polymer throughput 0.1 g/nozzle/min
Two different annular melt blowing die geometries – one from our experimental setup (Figure 2) and one from literature (Figure 4) – were used to validate the model estimates for fiber diamater. The experimental setup produced unique fibrous-porous microarchitectures at different processing conditions, as highlighted by the SEM micrographs in Figure 11.
Figure 11.
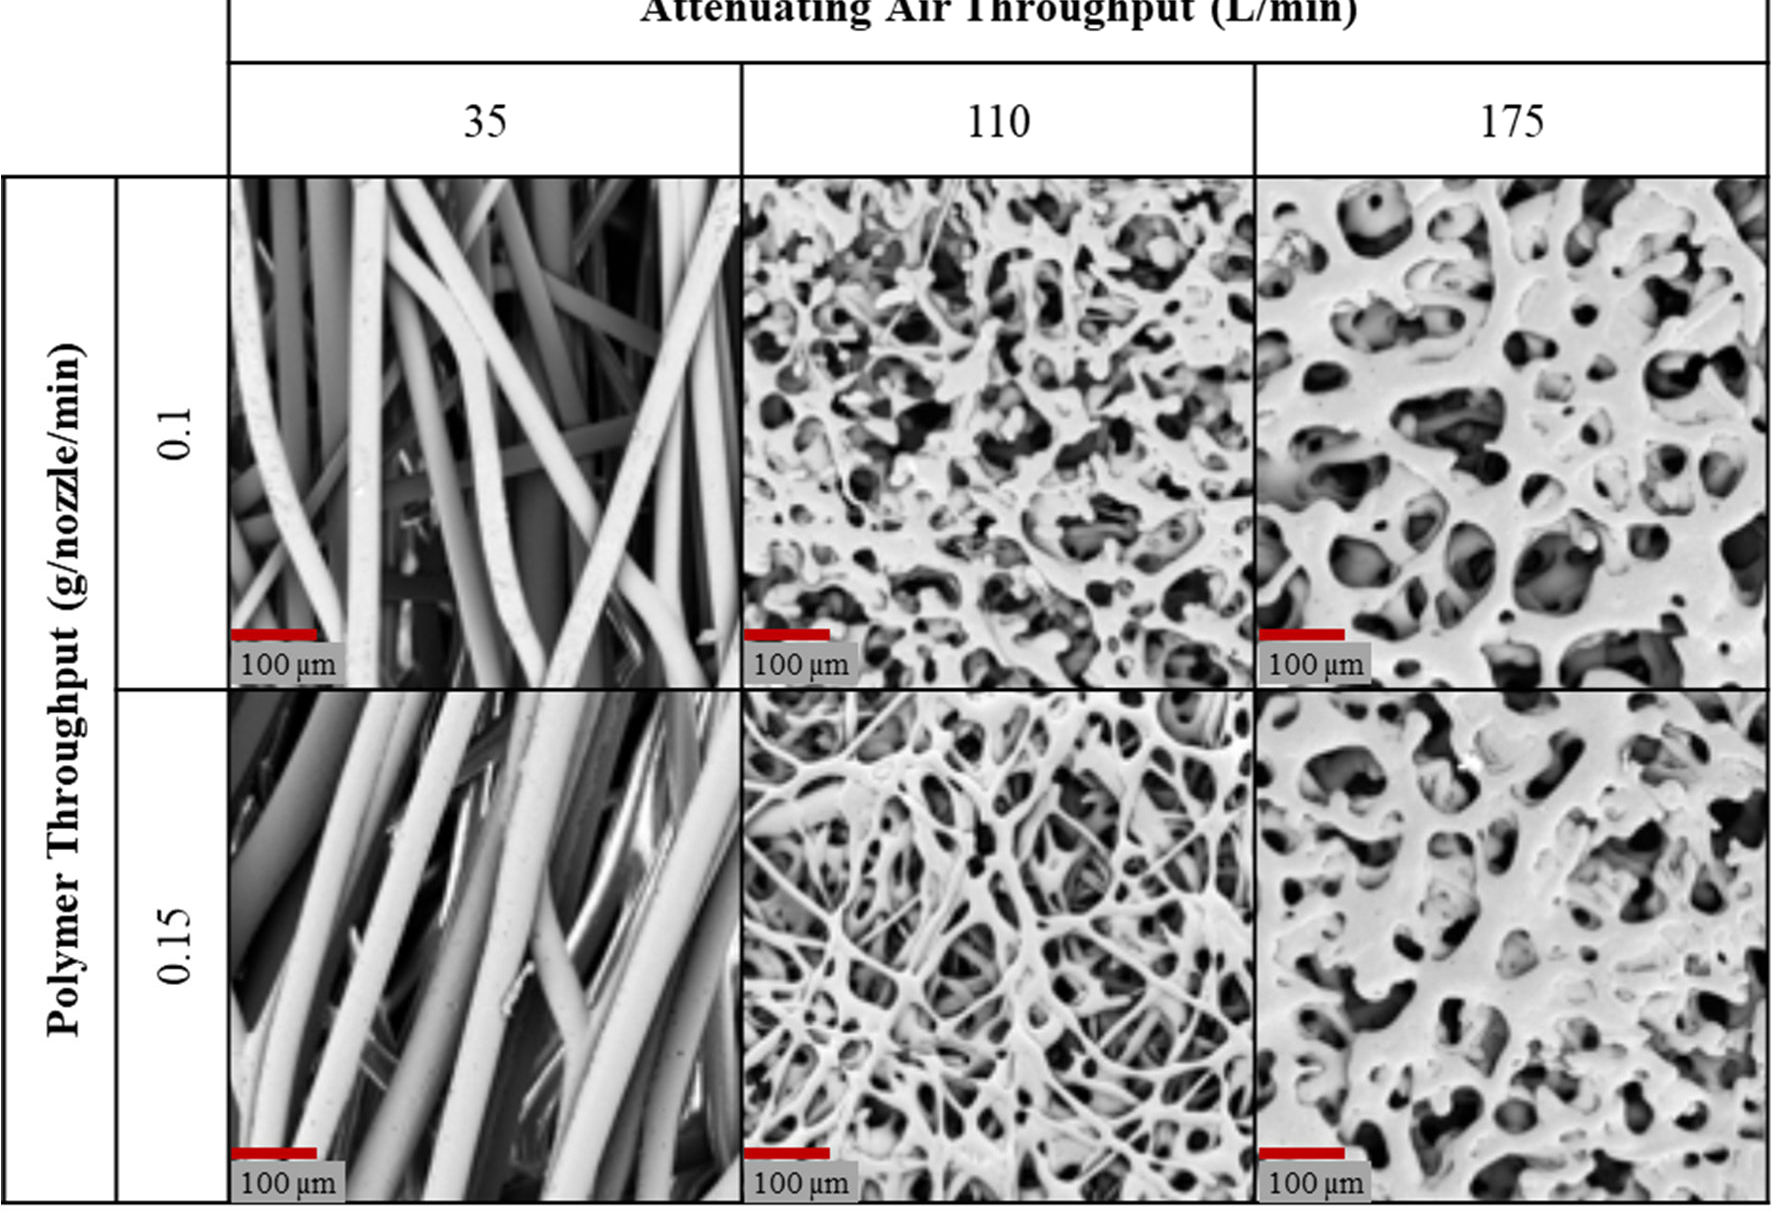
SEM images of melt blown microarchitectures from our melt blowing system
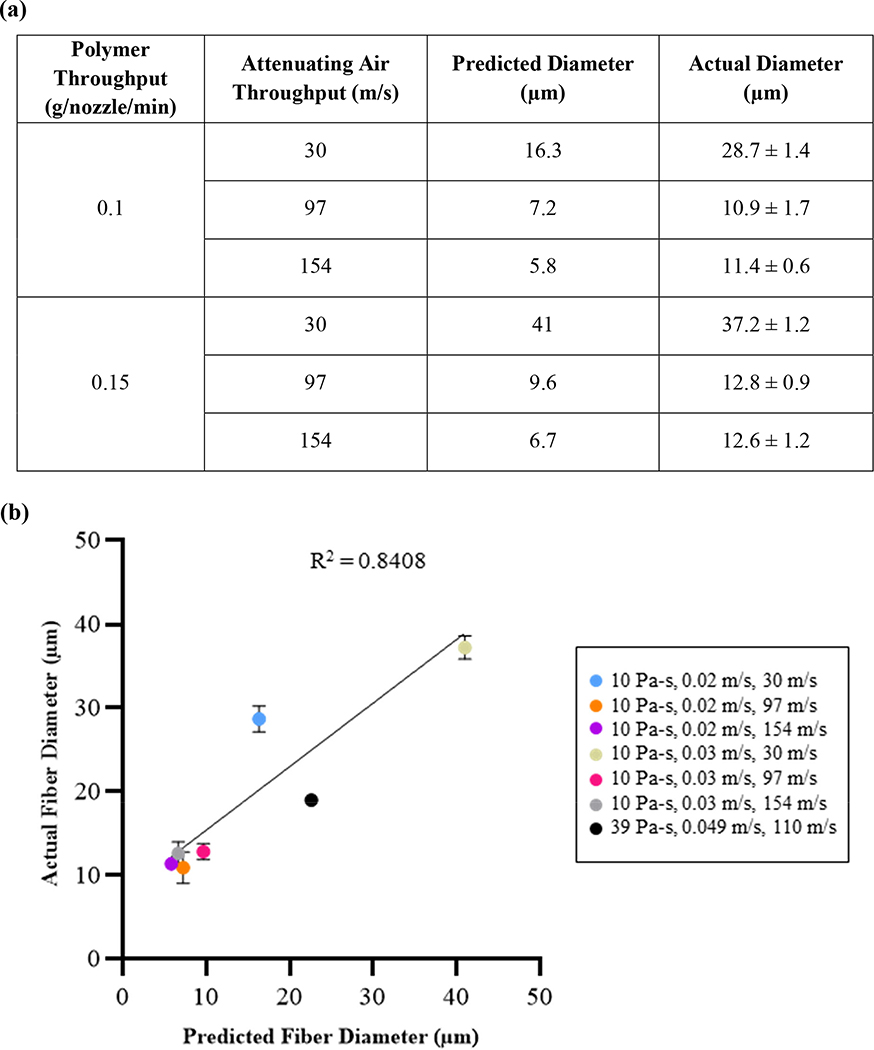
Figure 12a summarizes the fiber diameters predicted by the CFD model and those obtained experimentally using our melt blowing system. These experimental conditions produced fiber diameters ranging from 10.52 – 38.66 μm, while the corresponding CFD model estimates ranged from 5.8–41 μm. The model estimates and corresponding experimental values matched closely across the processing conditions. The CFD model estimated the fiber diameter to be 22.6 μm for the die geometry and processing conditions sourced from literature, while empirically, these processing conditions produced fibers with an approximate diameter of 19 μm in the original article28.
Figure. 12.
(a) Fiber diameters predicted by CFD model and measured experimentally, (b) Predicted vs. actual fiber diameters. Error bars show 1 standard deviation. Note that standard deviation was not provided in the literature methoderence28 for the 39 Pa-s,0.049 m/s,110 m/s data point.
Overall, the simulation results correlated closely with empirical data gathered from the two die geometries (R2=0.8408), indicating high fidelity of the CFD model (Figure 12b).
In summary, isothermal multiphase models were developed and solved to estimate fiber diameters fabricated at experimentally relevant melt blowing parameters. Model derived and empirically observed fiber diameter values closely matched. The model provided further insight into the interactions between polymer and air flows in the melt blowing process; highlighting that the attenuating air velocity and polymer throughput ultimately govern the microarchitectures of fabricated mats. In future studies, this model can be expanded further to a multiphase multi-nozzle die model to more closely capture the multi-nozzle melt blowing system. Ideally, a multimodal CFD model that captures the fiber formation and collection process wholistically would be the basis of future research.
6. Conclusions
This study describes a new multiphase CFD model for the melt blowing process, which accounts for the critical interactions at the interface of polymer and air jets emerging from the nozzle. The model comprised simultaneous solution of constitutive CFD equations representing free surface jets of polymer and air in two dimensions. The effects of processing conditions on the amplitude of fiber X-velocity whipping instability and fiber diameter were estimated from the model simulations using experimentally relevant boundary conditions. The velocity differential between the air and polymer jet was found to be correlated positively with the magnitude of fiber whipping instability. Further, it was observed that the polymer mass throughput and attenuating air velocity primarily modulated the fiber diameter. Comparisons of model estimates to actual fiber diameter were made using experimental data from two different melt blowing die geometries. Modeled fiber diameters and whipping instability trends correlated well with new experimental data and observations as well as with data presented in literature, confirming the robustness of the model. In future, this model can be expanded to a more holistic numerical model of the multinozzle melt blowing process including incorporating melting and solidification or energy considerations to capture the effects of heat transfer through the spinline and fiber collection in a multi-scale three-dimensional domain.
Acknowledgements
This work was supported by grants from the NC State University Game-Changing Research Incentive Program (GRIP) and the National Institutes of Health (R21 AR075261 and R01 AR078245).
References
- [1].Shirwaiker RA, Fisher MB, Anderson B, Schuchard KG, Warren PB, Maze B, Grondin P, Ligler FS, Pourdeyhimi B. High-throughput manufacture of 3D fiber scaffolds for regenerative medicine. Tissue Eng Part C Methods. 2020;26(7):364–374. doi: 10.1089/ten.TEC.2020.0098. [DOI] [PMC free article] [PubMed] [Google Scholar]
- [2].Tuin SA, Pourdeyhimi B, Loboa EG. Creating tissues from textiles: scalable nonwoven manufacturing techniques for fabrication of tissue engineering scaffolds. Biomed Mater. 2016;11(1):015017. doi: 10.1088/1748-6041/11/1/015017. [DOI] [PubMed] [Google Scholar]
- [3].Liu L, Xu Z, Song C, Gu Q, Sang Y, Lu G, Hu H, Li F. Adsorption-filtration characteristics of melt-blown polypropylene fiber in purification of reclaimed water. Desalination, 2006;201:198–206. doi: 10.1016/j.desal.2006.02.014. [DOI] [Google Scholar]
- [4].Yue Z, Vakili A, Wang J. Activated carbon fibers from meltblown isotropic pitch fiber webs for vapor phase adsorption of volatile organic compounds. Chem Eng J. 2017;330:183–190. doi: 10.1016/j.cej.2017.07.150. [DOI] [Google Scholar]
- [5].Guo M, Liang H, Luo Z, Chen Q, Wei W. Study on melt-blown processing, web structure of polypropylene nonwovens and its BTX adsorption. Fibers Polym. 2016;17:257–265. doi: 10.1007/s12221-016-5592-y [DOI] [Google Scholar]
- [6].Zhang H, Liu J, Zhang X, Huang C, Jin X. Design of electret polypropylene melt blown air filtration material containing nucleating agent for effective PM2.5 capture. RSC Adv. 2018;8:7932–7941. doi: 10.1039/C7RA10916D. [DOI] [PMC free article] [PubMed] [Google Scholar]
- [7].Hassan MA, Yeom BY, Wilkie A, Pourdeyhimi B, Khan SA. Fabrication of nanofiber meltblown membranes and their filtration properties. J Memb Sci. 2013;427:336–344. doi: 10.1016/j.memsci.2012.09.050 [DOI] [Google Scholar]
- [8].Lee Y, Wadsworth LC. Structure and filtration properties of melt blown polypropylene webs. Polym Eng Sci. 1990;30:1413–1419. doi: 10.1002/pen.760302202. [DOI] [Google Scholar]
- [9].Lee Y, Wadsworth LC. Effects of melt-blowing process conditions on morphological and mechanical properties of polypropylene webs. Polymer. 1992;33(6):1200–1209. doi: 10.1016/0032-3861(92)90764-N. [DOI] [Google Scholar]
- [10].Renukarn R, Takarada W, Kikutani T. Melt-blowing conditions for preparing webs consisting of fine fibers. AIP Conference Proceedings 1779, 120002 (2016). doi: 10.1063/1.4965578 [DOI] [Google Scholar]
- [11].Bresee RR, Ko W-C. Fiber Formation during Melt Blowing. Int Nonwovens J. 2003;0s-12(2):21–28. doi: 10.1177/1558925003os-1200209. [DOI] [Google Scholar]
- [12].Entov VM, Yarin AL. The dynamics of thin liquid jets in air. J Fluid Mech. 1984;140:91–111. doi: 10.1017/S0022112084000525. [DOI] [Google Scholar]
- [13].Xie S, Han W, Xu X, Jiang G, Shentu B. Lateral diffusion of a free air jet in slot-die melt blowing for microfiber whipping. Polymers. 2019;11(5):788. doi: 10.3390/polym11050788 [DOI] [PMC free article] [PubMed] [Google Scholar]
- [14].Hao X, Zeng Y. A review on the studies of air flow field and fiber formation process during melt blowing. Ind Eng Chem Res. 2019;58(27): 11624–11637. doi: 10.1021/acs.iecr.9b01694 [DOI] [Google Scholar]
- [15].Xie S, Han W, Jiang G, Chen C. Turbulent air flow field in slot-die melt blowing for manufacturing microfibrous nonwoven materials. J Mater Sci. 2018;53:6991–7003. doi: 10.1007/s10853-018-2008-y [DOI] [Google Scholar]
- [16].Xie S, Jiang G, Ye B, Shentu B. Particle image velocimetry (PIV) investigation of the turbulent airflow in slot-die melt blowing. Polymers. 2020;12(2):279. doi: 10.3390/polym12020279. [DOI] [PMC free article] [PubMed] [Google Scholar]
- [17].Uyttendaele MAJ, Shambaugh RL. Melt blowing: General equation development and experimental verification. AIChE J. 1990;36(2):175–186. doi: 10.1002/aic.690360203. [DOI] [Google Scholar]
- [18].Rao RS, Shambaugh RL. Vibration and stability in the melt blowing process. Ind Eng Chem Res. 1993;32(12):3100–3111. doi: 10.1021/ie00024a020. [DOI] [Google Scholar]
- [19].Marla VT, Shambaugh RL. Three-dimensional model of the melt-blowing process. Ind Eng Chem Res. 2003;42(26):6993–7005. doi: 10.1021/ie030517u [DOI] [Google Scholar]
- [20].Han W; Wang X Modeling melt blowing fiber with different polymer constitutive equations. Fibers Polym. 2016, 17, 74, DOI: 10.1007/s12221-016-5721-7. [DOI] [Google Scholar]
- [21].Hübsch F; Marheineke N; Ritter K; Wegener R Random Field Sampling for a Simplified Model of Melt-Blowing Considering Turbulent Velocity Fluctuations. J. Stat. Phys. 2013, 150, 1115, DOI: 10.1007/s10955-013-0715-y [DOI] [Google Scholar]
- [22].Krutka HM, Shambaugh RL, Papavassiliou DV. Analysis of a melt-blowing die: Comparison of CFD and experiments. Ind Eng Chem Res. 2002;41(20):5125–5138. doi: 10.1021/ie020366f. [DOI] [Google Scholar]
- [23].Krutka HM, Shambaugh RL, Papavassiliou DV. Effects of the polymer fiber on the flow field from an annular melt-blowing die. Ind Eng Chem Res. 2007;46(2):655–666. doi: 10.1021/ie061021q. [DOI] [Google Scholar]
- [24].Sun GW, Song J, Xu L, Wang XH. Numerical modelling of microfibers formation and motion during melt blowing. J Text Inst. 2018;109(3):300–306. doi: 10.1080/00405000.2017.1342522 [DOI] [Google Scholar]
- [25].Wieland M, Arne W, Marheineke N, Wegener R. Melt-blowing of viscoelastic jets in turbulent airflows: Stochastic modeling and simulation. Appl Math Model. 2019;76:558–577. doi: 10.1016/j.apm.2019.06.023. [DOI] [Google Scholar]
- [26].Lou H, Han W, Wang X. Numerical study on the solution blowing annular jet and its correlation with fiber morphology. Ind Eng Chem Res. 2014;53(7):2830–2838. doi: 10.1021/ie4037142. [DOI] [Google Scholar]
- [27].Arraiza AL, Sarasua JR, Verdu J, Colin X. Rheological behavior and modeling of thermal degradation of poly(ε-caprolactone) and poly(L-lactide). Int Polym Process. 2007;22(5):389–394. doi: 10.3139/217.2067. [DOI] [Google Scholar]
- [28].Sauer BB, Dipaolo NV. Surface tension and dynamic wetting on polymers using the Wihelmy method: Applications to high molecular weights and elevated temperatures. J Colloid Interface Sci. 1991;144(2):527–537. doi: 10.1016/0021-9797(91)90418-8. [DOI] [Google Scholar]
- [29].Kayser JC, Shambaugh RL. The manufacture of continuous polymeric filaments by the melt-blowing process. Polym Eng Sci. 1990;30(19):1237–1251. doi: 10.1002/pen.760301908 [DOI] [Google Scholar]
- [30].Zeng YC, Sun YF, Wang XH. Numerical approach to modeling fiber motion during melt blowing. J Appl Polym Sci. 2011;119(4):2112–2123. doi: 10.1002/app.32921. [DOI] [Google Scholar]
- [31].Xie S, Zeng Y. Turbulent air flow field and fiber whipping motion in the melt blowing process: experimental study. Ind Eng Chem Res. 2012;51(14):5346–5352. doi: 10.1021/ie202938b [DOI] [Google Scholar]


