

Abstract
Objective
Separate meta-analyses based on case–control and cohort studies have reported different results on the relationship between coffee consumption and colorectal cancer risk. To clarify the effect of coffee intake on colorectal cancer risk, we performed a meta-analysis based on both case–control and cohort studies.
Design
Review study.
Setting
We identified case–control and cohort studies related to coffee consumption and colorectal cancer risk listed on MEDLINE, the Cochrane Controlled Trials Register, EMBASE, Science Citation Index and PubMed (until May 2011).
Subjects
Research literature on the relationship between coffee consumption and colorectal cancer risk.
Results
Twenty-five case–control (15 522 cases) and sixteen cohort studies (10 443 cases) were included in the meta-analysis. Comparing the highest v. the lowest/non category of coffee consumption, the combined results from case–control studies showed a significant relationship with colorectal cancer (OR = 0·85, 95 % CI 0·75, 0·97) and colon cancer (OR = 0·79, 95 % CI 0·67, 0·95), but not rectal cancer (OR = 0·95, 95 % CI 0·79, 1·15). For cohort studies, there was a slight suggestion of an inverse association with colorectal cancer (relative ratio = 0·94; 95 % CI 0·88, 1·01) and colon cancer (OR = 0·93, 95 % CI 0·86, 1·01), rather than rectal cancer (OR = 0·98, 95 % CI 0·88, 1·09). In subgroup analyses using case–control studies, significant inverse associations were found in females for colorectal cancer and in Europe for colorectal and colon cancer, while the subgroup analyses of cohort studies found that coffee drinks substantially decreased risk of colon cancer only in Asian women.
Conclusions
Results from case–control studies suggest coffee consumption can significantly decrease the risks of colorectal cancer and colon cancer, especially in Europe and for females.
Keywords: Colorectal cancer, Coffee, Meta-analysis, Observational studies
Colorectal cancer is the third most common cancer in men and the second most common in women worldwide, with over 1·2 million new cancer cases and 608 700 deaths occurring in 2008( 1 ). It is well known that obesity, smoking and physical inactivity are important risk factors for colorectal cancer. However, nutritional factors such as alcohol, tea, coffee, etc. have also been considered to play an important role in the development of colorectal cancer( 2 ).
Coffee is a complex mixture of more than a thousand chemicals, and these constituents have potential genotoxic and mutagenic properties, antioxidant and antimutagenic activities to affect colorectal cancer risk( 3 ). Over the last four decades, the relationship between coffee consumption and colorectal cancer risk has been extensively examined( 4 ). In 1990, a Working Group of the International Agency for Research on Cancer reviewed the data on coffee consumption and colorectal cancer risk and concluded that in man ‘there is some evidence of an inverse relation between coffee drinking and cancer of the large bowel’( 3 ). However, the relationship between coffee intake and colorectal cancer risk appears inconsistent in case–control studies and cohort studies. To clarify the relationship between coffee consumption and colorectal cancer risk, Giovannucci performed a meta-analysis in 1998 and reported an overall OR/relative ratio (RR) for high v. low coffee intake of 0·72 (95 % CI 0·61, 0·84) and 0·97 (95 % CI 0·73, 1·29) after combining the results of twelve case–control studies and five cohort studies, respectively( 5 ). A subsequent meta-analysis( 6 ) and a pooled analysis( 7 ) for cohort studies showed no significant inverse associations; however, another meta-analysis in 2011 reported a statistically significant relationship between coffee consumption and colorectal cancer (RR = 0·89, 95 % CI 0·80, 0·97)( 8 ). Moreover, the newest meta-analysis of case–control studies by Galeone et al. found a significantly positive effect when comparing the highest with non/low coffee intake( 9 ).
Although most of the data from case–control studies are relatively consistent, they may be subject to recall bias with respect to coffee consumption and selection bias with respect to the control group. Additional prospective cohort studies excluding those biases would be more useful to see coffee–colorectal cancer associations. Since the meta-analysis conducted in 1998 which included case–control studies and cohort studies, no meta-analysis clarifying the relationship of coffee consumption and colorectal cancer risk using both types of studies has been reported. Plenty of case–control and cohort studies on coffee consumption and colorectal cancer have been published since then. To identify the relationship of coffee consumption and colorectal cancer risk systematically and comprehensively, we performed a meta-analysis combining all available data of both case–control studies and cohort studies.
Materials and methods
Search strategy
MEDLINE, the Cochrane Controlled Trials Register, EMBASE, Science Citation Index and PubMed were used to search for articles (in English, until May 2011) that described case–control studies and/or cohort studies investigating the relationship between coffee consumption and risk of colorectal cancer. Titles, abstracts and subject headings in the database were investigated, using the string ‘coffee or caffeine’ and ‘cancer or carcinoma or neoplasm or tumor’ and ‘colon or rectum or colorectal’. We carried out a broad search for all studies with the Boolean phrases ‘diet’ and (‘colon’ or ‘cancer’). We also examined all references of related reviews and papers retrieved by the search. Additionally, we tried to contact the experts to obtain unpublished data. Unfortunately, we did not obtain any response from them.
Inclusion criteria
In the meta-analysis, no studies were excluded for weakness of design or data quality. No quality score was assigned. Forty-nine studies including thirty-two case–control studies and seventeen cohort studies were considered. Studies were selected for analysis if they met all of the following criteria: (i) a quantitative estimate of the relationship; and (ii) at least one of the 95 % confidence interval or the standard error or the distribution of cases and controls in coffee consumption categories. If the study sample was found to overlap with that in another article or if two articles described aspects of the same study, only the publication with the largest sample was used( 10 – 18 ). If a study provided several OR/RR, we extracted the one reflecting the greatest degree of control for potential confounders( 17 , 19 – 29 ). To assess a summary OR/RR for colorectal cancer in both sexes, we used combined estimates if provided. Otherwise, we included all estimates according to sex and/or cancer site in the analysis as if obtained from different studies( 11 , 19 , 20 , 22 , 25 , 27 , 30 – 38 ). Some studies reported estimates for caffeinated coffee, decaffeinated coffee and/or caffeine; we chose the first one( 11 , 15 , 31 , 34 , 36a , 36b ). For case–control studies, if both hospital and population controls were used for comparison separately, the result of the population control was chosen for analysis( 39 , 40 ). For cohort studies, when a study provided RR for both colorectal cancer and invasive colorectal cancer, we used the former because it included more cases( 22 ). Larsson et al. presented pooled estimates from two large cohorts, the Swedish Mammography Cohort (SMC, 1987–2004) and the Cohort of Swedish Men (COSM, 1998–2004), and reported additional pooled estimates by starting follow-up in 1998 for the SMC; we extracted the latter pooled estimates (1998–2004 for both cohorts)( 21 ). We also included a study conducted on the same cohort (SMC) because it was performed during a different period (1987–2003)( 17 ). Michels et al. ( 36 ) reported separate RR from two large US cohorts in their study, the Nurses’ Health Study (NHS)( 36a ) and the Health Professionals Follow-up Study (HPFS)( 36b ); we counted the report as two prospective studies. Finally, our meta-analysis included twenty-five case–control( 11 , 15 , 20 , 26 , 28 – 31 , 33 – 35 , 38 – 51 ) and sixteen cohort studies( 17 , 19 , 21 – 25 , 27 , 32 , 36a , 36b , 37 , 52 – 55 ).
Data extraction
Two researchers (G.L. and W.Z.) extracted data independently. A data collection form was designed and data were entered into the form twice to reduce input errors. The items in the form included: first author's last name; year of publication; country of origin; years of study/follow-up period; number of cases/controls; age at baseline; OR/RR and 95 % CI for the association between coffee consumption and colorectal cancer incidence, considering two exposure levels (highest v. lowest/non); type of controls; and control of confounding factors. If OR and/or 95 % CI were not reported, but numbers of cases and controls in highest v. lowest/non categories of coffee consumption were provided, these data were used to calculate crude OR and unadjusted CI( 28 , 31 , 33 – 35 , 39 , 40 , 42 , 46 , 48 , 49 ).
Statistical analysis
The generic inverse variance method was used to pool the overall OR/RR with the STATA statistical software package version 11·0 software (Stata Corporation, College Station, TX, USA) for highest v. lowest/non category of coffee intake and risk of colorectal cancer. To assess the heterogeneity, we conducted a test based on χ 2 distribution and quantified the inconsistency using the I 2 statistic( 56 ) (P < 0·05 or I 2 > 50 % is considered significant( 57 )). A random effect method that does not assume homogeneity of relative risks (i.e. uniformity of the association) across studies was used as the method of combination for all the analyses showing significant heterogeneity. To examine the magnitude of the combined OR/RR in each stratum and its respective test of heterogeneity, we conducted subgroup analyses by the following variables, one at a time: geographic region (America, Asia or Europe); cancer site (colon or rectum); sex; type of controls (population-based or hospital-based, only for case–control studies); and follow-up period (using 10 years as a cut-off according to the mean of follow-up time of the sixteen cohort studies included in the meta-analysis; only for cohort studies). If heterogeneity in one or more subgroup analyses was observed, then meta-regression was conducted to test variations in OR/RR across strata. In addition, sensitivity analyses were performed by limiting the analysis to studies that had adjusted for smoking, alcohol and physical activity and to those providing ratios for decaffeinated coffee. The funnel plots with Begg's rank correlation and Egger regression tests were performed to detect publication bias.
Results
Table 1 shows the characteristics of the twenty-five case–control studies (15 522 cases) that were potentially eligible for inclusion in the meta-analysis. Nine of these studies were conducted in America, whereas six were in Asia and ten in Europe. Fourteen of these studies were used for colon cancer (9191 cases) and twelve were used for rectal cancer (4996 cases). Of these studies, eleven and ten provided OR for colorectal cancer in men and women, respectively. Fourteen studies provided the OR using population-based controls and eleven studies using hospital-based controls. We combined OR for colorectal cancer by comparing the highest v. the lowest/non category of coffee consumption, and the summarized result showed a significant relationship between coffee consumption and colorectal cancer risk (OR = 0·85, 95 % CI 0·75, 0·97; P for heterogeneity < 0·001; I 2 = 64 %; Fig. 1). The OR were 0·73 (95 % CI 0·57, 0·93), 0·78 (95 % CI 0·63, 0·97) and 0·82 (95 % CI 0·73, 0·93) when combining ten studies conducted in Europe, eleven studies using hospital-based controls and ten studies performed in females for colorectal cancer, respectively. These was no significant relationship between coffee consumption and rectal cancer risk (overall OR = 0·95, 95 % CI 0·79, 1·15; P for heterogeneity = 0·02; I 2 = 53 %); however, there were statistically significant associations between coffee consumption and colon cancer (overall OR = 0·79, 95 % CI 0·67, 0·95; P for heterogeneity <0·001; I 2 = 68 %), especially in Europe (OR = 0·68; 95 % CI 0·57, 0·81; P for heterogeneity = 0·33; I 2 = 9 %; Table 2).
Table 1.
Characteristics of case–control studies of coffee consumption and colorectal, colon and rectal cancer risk
| First author (year) | Years of study | Country | No. of cases/controls | Type of control | OR | 95 % CI | Coffee (‘highest’ v. ‘lowest/non’) | Adjustment factors |
|---|---|---|---|---|---|---|---|---|
| Higginson (1966)( 47 ) | Not indicated | USA | 340 CRC (196 M, 144 F)/1020 CON (588 M, 432 F) | Hospital | CRC: 0·60 | 0·37, 0·97 | ‘≥3 cups/d’ v. ‘never or irregularly’ | NR |
| Bjelke (1974)( 48 ) | 1967–1968 | Norway | 169 CC/442 CON | Hospital | For M, CC: 0·60 | 0·39, 0·93 | ‘≥5 cups/d’ v. ‘<3 cups/d’ | Age, sex |
| Macquart-Moulin (1986)( 49 ) | 1979–1984 | France | 399 CRC (188 M, 211 F)/399 CON (188 M, 211 F) | Hospital | CRC: 0·55 | 0·32, 0·94 | ‘top quartile’ v. ‘bottom quartile’ | Age, sex, energy, body weight |
| Jarebinski (1989)( 39 ) | 1984–1986 | Yugoslavia | 98 RC/98 CON | Population | RC: 0·8 | 0·3, 2·2 | ‘>3 cups/d’ v. ‘none’ | NR |
| Lee (1989)( 50 ) | 1985–1987 | Singapore | 203 CRC (132 CC, 71 RC)/425 CON | Hospital | CRC: 0·72 | 0·46, 1·12 | ‘high’ v. ‘low’ | Age, sex, dialect, occupation |
| CC: 0·69 | 0·41, 1·17 | |||||||
| RC: 0·71 | 0·36, 1·38 | |||||||
| Rosenberg (1989)( 51 ) | 1978–1986 | USA | 717 CC (313 M, 404 F), 538 RC (267 M, 271 F)/3883 CON | Hospital | For CC, M: 0·7 | 0·4, 1·2 | ‘≥ 5 cups/d’ v. ‘1 cup/d’ | Age, sex, year of interview, education, race, religion, residence, smoking, alcohol |
| For CC, F: 0·5 | 0·3, 0·8 | |||||||
| For RC, M: 1·5 | 0·8, 2·7 | |||||||
| For RC, F: 1·0 | 0·6, 1·7 | |||||||
| Benito (1990)( 40 ) | 1984–1988 | Spain | 286 CRC (151 M, 135 F)/295 CON (158 M, 137 F) | Population | CRC: 0·78 | 0·45, 1·35 | ‘highest’ v. ‘lowest’ | Age, sex, weight 10 years prior to interview |
| Kato (1990)( 30 ) | 1986–1990 | Japan | 221 CRC (130 CC, 89 RC, 2 CRC)/578 CON | Population | CC: 0·43 | 0·25, 0·73 | ‘daily’ v. ‘none’ | Age, sex, region |
| RC: 0·53 | 0·27, 1·03 | |||||||
| Slattery (1990)( 34 ) | 1979–1983 | USA | 231 CC (112 M, 119 F)/391 CON (185 M, 206 F) | Population | For CC, M: 2·2 | 1·2, 4·0 | ‘≥2·5 cups/d’ v. ‘none’ | NR |
| For CC, F: 0·9 | 0·5, 1·7 | |||||||
| Hoshiyama (1993)( 20 ) | 1984–1990 | Japan | 181 CRC (79 CC, 102 RC)/653 CON (343 M, 310 F) | Population | CC: 0·5 | 0·2, 1·0 | ‘highest’ v. ‘lowest’ | For CC: age, sex alcohol, smoking status, salty food, seaweed, vegetables, meat; for RC: age, sex |
| RC: 0·8 | 0·4, 1·4 | |||||||
| Olsen (1993)( 26 ) | 1986–1990 | Denmark | 49 CRC (21 M, 28 F)/362 CON (157 M, 205 F) | Population | CRC: 1·1 | 0·3, 3·6 | ‘≥8 cups/d’ v. ‘0–3 cups/d’ | Age, sex, dietary fibre |
| Baron (1994)( 43 ) | 1986–1988 | Sweden | 569 CRC (352 CC, 217 RC)/512 CON (236 M, 276 F) | Population | CRC: 0·60 | 0·36, 1·00 | ‘≥ 6 cups/d’ v. ‘0–1 cup/d | Age, sex, fat, fibre, BMI, exercise |
| CC: 0·48 | 0·27, 0·86 | |||||||
| RC: 0·86 | 0·43, 1·73 | |||||||
| Centonze (1994)( 29 ) | 1987–1989 | Italy | 119 CRC (66 M, 53 F)/119 CON (64 M, 55 F) | Population | CRC: 0·48 | 0·22, 1·02 | ‘> 2 cups/d’ v. ‘0 cup/d’ | Age, sex, level of education, smoking status, various dietary factors |
| Shannon (1996)( 33 ) | 1985–1989 | USA | 424 CC (238 M, 186 F) 414 CON (224 M, 190 F) | Population | For CC, M: 1·21 | 0·70, 2·08 | ‘>4 servings/d’ v. ‘0 serving/d’ | Age, total energy |
| For CC, F: 1·04 | 0·55, 1·97 | |||||||
| Tavani (1997)( 15 ) | 1985–1996 | Italy | 3530 CRC (2166 CC, 1364 RC)/7057 CON (3984 M, 3109 F) | Hospital | CC: 0·73 | 0·60, 0·89 | ‘≥4 cups/d’ v. ‘0 cup/d’ | Age, region, education, BMI, smoking, number of meals, alcohol, meat, vegetables, fruit, energy |
| RC: 1·00 | 0·78, 1·27 | |||||||
| CRC: 0·82 | 0·69, 0·96 | |||||||
| Inoue (1998)( 46 ) | 1990–1995 | Japan | 628 CRC (362 CC, 266 RC)/ 21128 CON (6307 M, 14821 F) | Hospital | CC: 0·87 | 0·56, 1·35 | ‘≥3 cups/d’ v. ‘rarely’ | Sex, year and season at first hospital visit, smoking, PA, alcohol, tea, rice, fruit, meat |
| RC: 0·46 | 0·26, 0·81 | |||||||
| Munoz (1998)( 41 ) | 1993–1997 | Argentina | 190 CRC (146 CC, 44 RC)/393 CON (192 M, 201 F) | Hospital | CRC: 0·9 | 0·7, 1·3 | ‘≥1 cup/d’ v. ‘0 cup/d’ | Age, sex, social class, BMI, mate and tea |
| Boutron-Ruault (1999)( 45 ) | 1985–1990 | France | 171 CRC (106 CC, 65 RC)/309 CON (159 M, 150 F) | Population | CRC: 1·9 | 1·1, 3·4 | ‘>220 g coffee/d’ v. ‘0 g coffee/d’ | Age, sex, energy |
| Levi (1999)( 44 ) | 1992–1997 | Switzerland | 223 CRC (119 CC, 104 RC)/491 CON (211 M, 280 F) | Hospital | CRC: 0·44 | 0·26, 0·74 | ‘>21 servings/week’ v. ‘<7·5 servings/week’ | Age, sex, education, smoking, alcohol, BMI, PA, meat, vegetables, total energy |
| Slattery (1999)( 11 ) | 1991–1994 | USA | 1993 CC (1089 M, 904 F)/2410 CON (1284 M, 1126 F) | Population | CC: 0·88 | 0·68, 1·13 | ‘>6 servings/d’ v. ‘none’ | Age, BMI, PA, total energy, sucrose, usual number of cigarettes smoked, alcohol |
| M: 0·79 | 0·57, 1·09 | |||||||
| F: 1·02 | 0·78, 1·35 | |||||||
| Woolcott (2002)( 42 ) | 1992–1994 | Canada | 1826 CRC (969 CC, 857 RC)/ 2089 CON (1322 M, 767 F) | Population | CC: 0·70 | 0·52, 0·94 | ‘≥5 cups/d’ v. ‘<1 cup/d’ | Age, education level, BMI, Ca, fibre |
| RC: 0·84 | 0·62, 1·14 | |||||||
| Zhang (2002)( 38 ) | 1996–1998 | China | 102 CRC (57 M, 45 F)/99 CON (55 M, 44 F) | Hospital | For CRC, M: 3·80 | 0·97, 14·96 | ‘current drinkers’ v. ‘non-drinkers’ | NR |
| For CRC, F: 0·50 | 0·14, 1·81 | |||||||
| Yeh (2003)( 28 ) | 1995–1999 | China | 727 CRC (352 CC, 375 RC)/736 CON (409 M, 327 F) | Hospital | For M, CC: 2·24 | 1·19, 4·21 | ‘yes’ v. ‘no’ | For M: age, education, PA, smoking, alcohol, meat, vegetables, fruit, fish, shrimp; for F: age |
| For M, RC: 2·72 | 1·57, 4·72 | |||||||
| For F, CC: 1·88 | 0·86, 4·10 | |||||||
| For F, RC: 1·03 | 0·41, 2·63 | |||||||
| Murtaugh (2004)( 31 ) | 1997–2001 | USA | 952 RC (559 M, 393 F)/1205 CON (673 M, 532 F) | Population | For RC, M: 0·97 | 0·72, 1·31 | For M, ‘>17·5 servings/week’ v. ‘never’; for F, ‘>14 servings/week’ v. ‘never’ | Energy, fibre, Ca, PA, age |
| For RC, F: 0·95 | 0·68, 1·33 | |||||||
| Wei (2004)( 35 ) | 1996–2000 | USA | 636 CC (331 M, 305 F)/1042 CON (515 M, 527 F) | Population | CC: 0·80 | 0·62, 1·03 | ‘5+ times/week’ v. ‘never’ | NR |
CRC, colorectal cancer; M, males; F, females; CON, control; CC, colon cancer; RC, rectal cancer; NR, not reported; PA, physical activity.
Fig. 1.
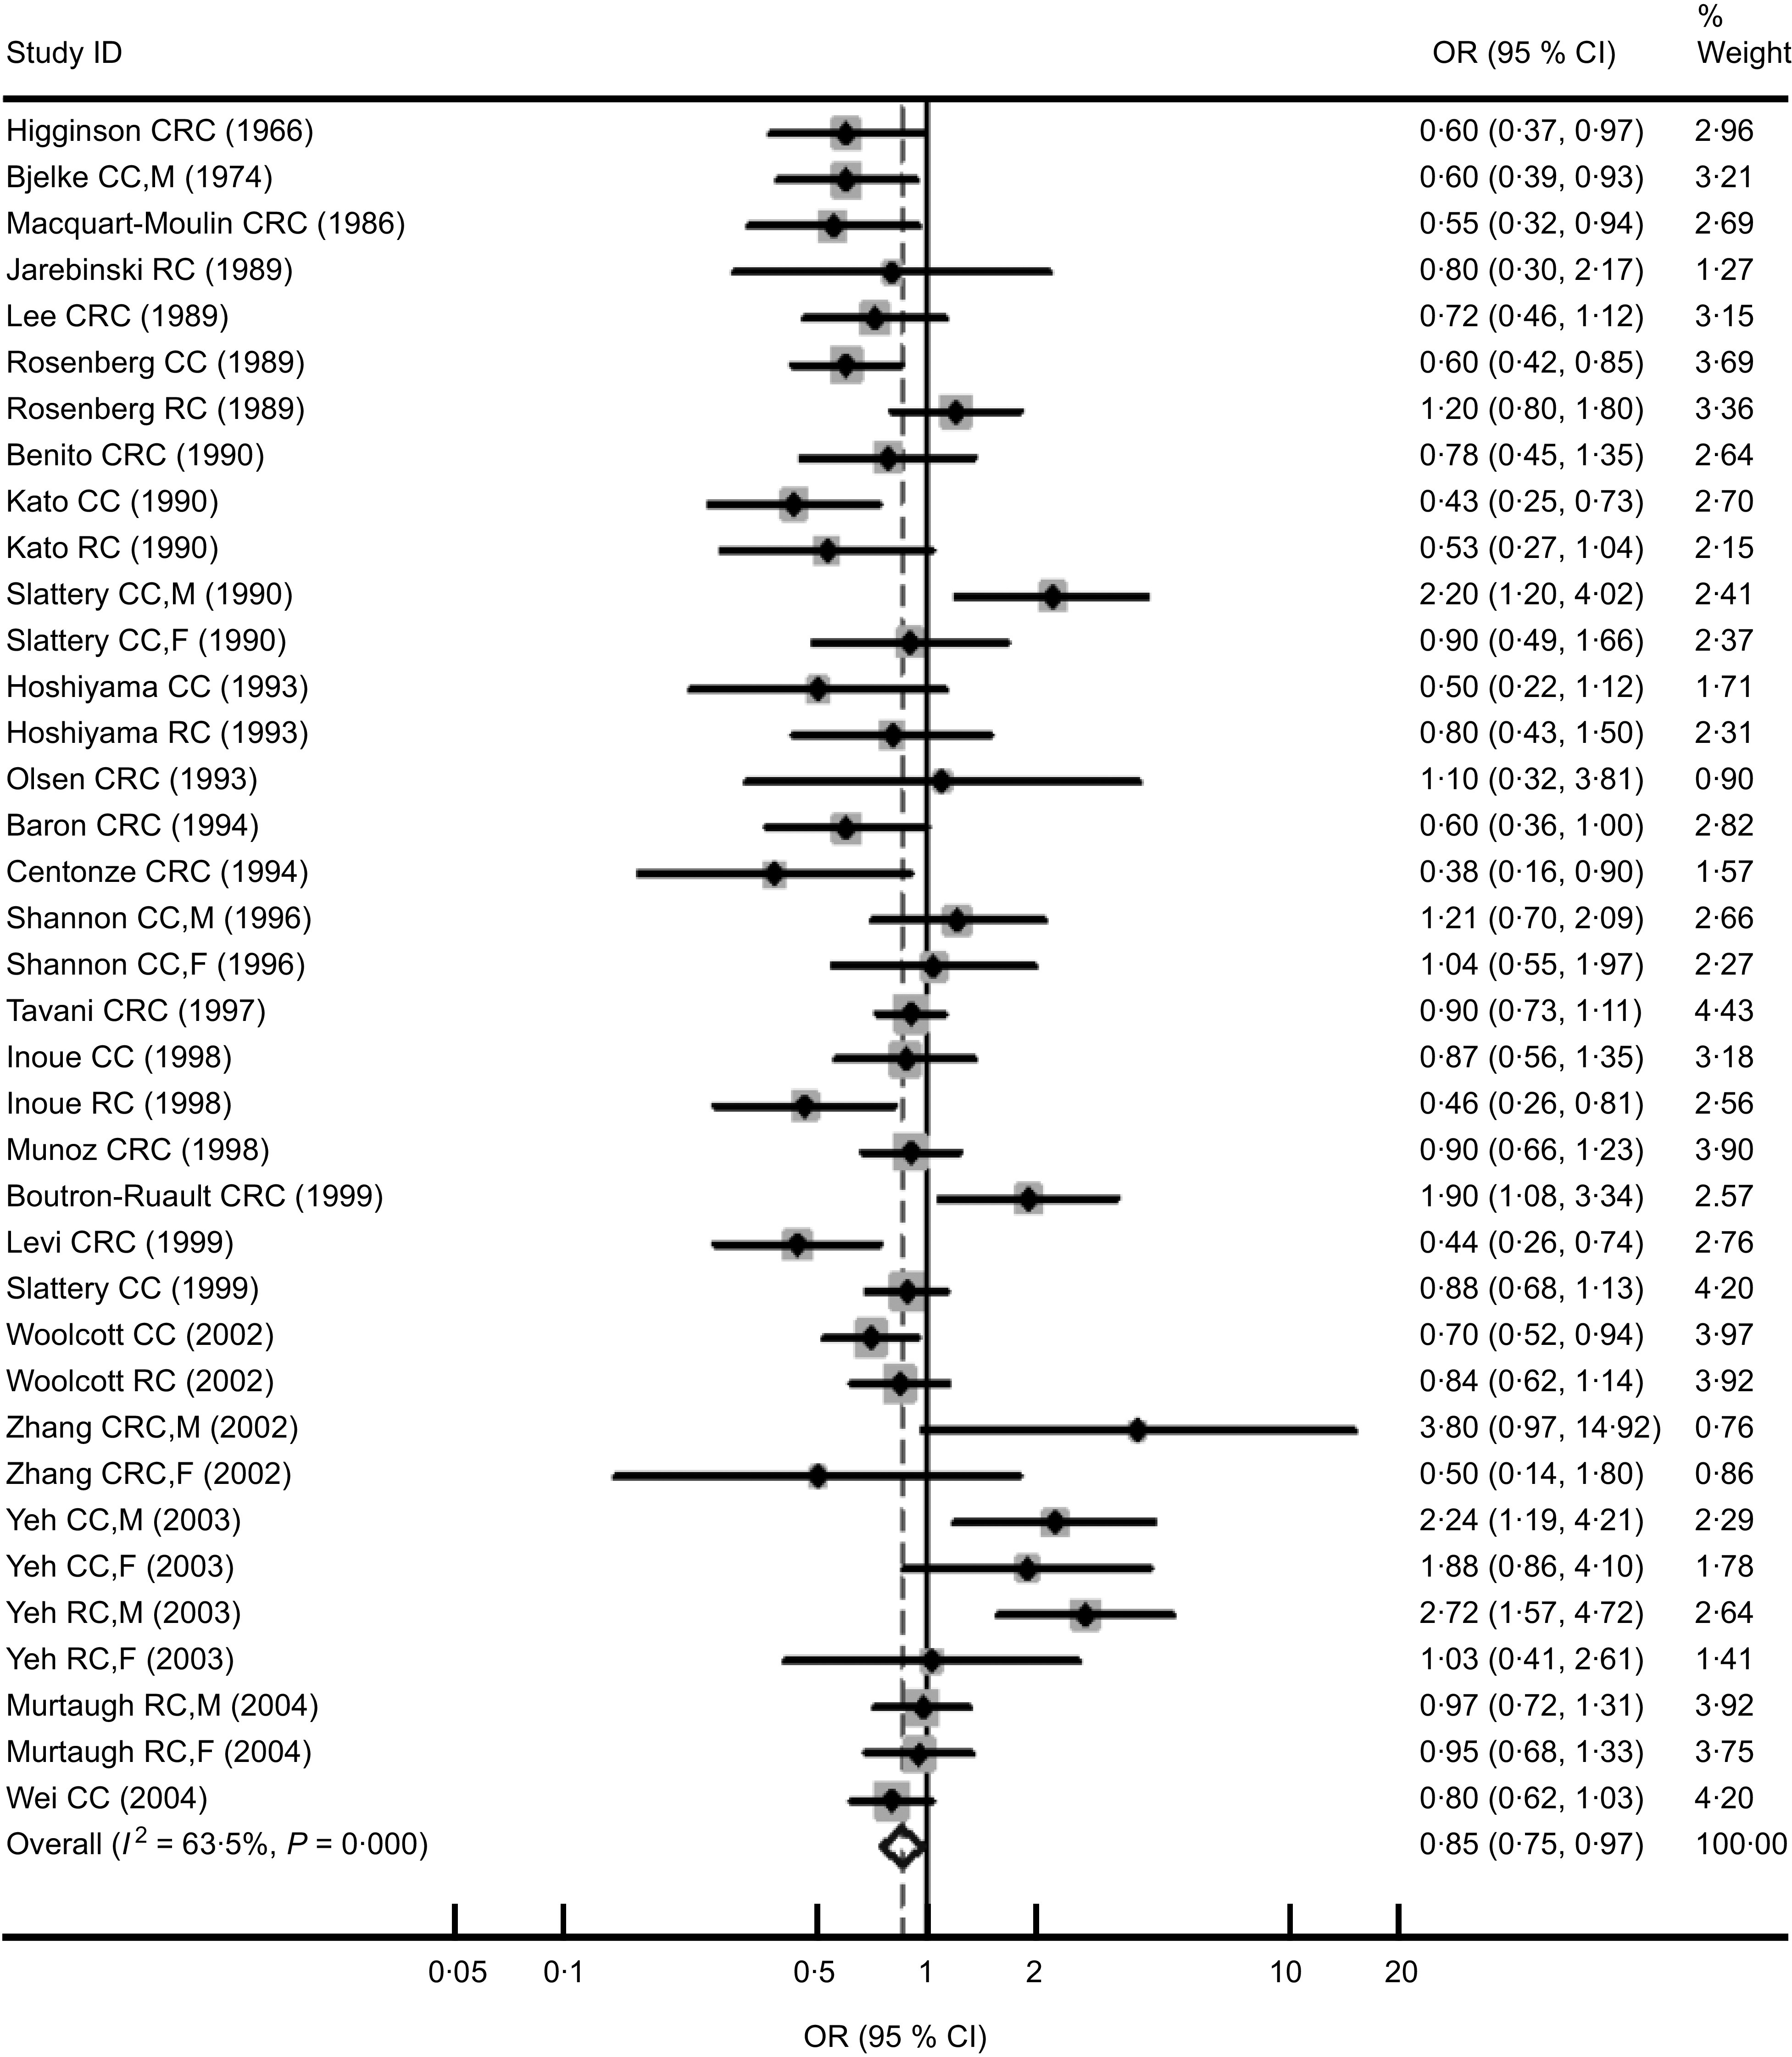
Forest plot of case–control studies of the risk of colorectal cancer (CRC, colorectal cancer; CC, colon cancer; RC, rectal cancer; M, males; F, females) for the highest v. the lowest/non coffee consumption. The size of the data markers (squares) for the odds ratios corresponds to the weight of the study in the meta-analysis; the horizontal lines correspond to the 95 % confidence intervals
Table 2.
Summary odds ratios/relative ratios and 95 % confidence intervals of colorectal, colon and rectal cancer for the highest v. the lowest/non coffee consumption in strata of geographic area, sex and/or type of controls and/or follow-up period
| Colorectal cancer | Colon cancer | Rectal cancer | ||||||||||||||||
|---|---|---|---|---|---|---|---|---|---|---|---|---|---|---|---|---|---|---|
| No. of comparisons/studies | No. of cases | OR/RR | 95 % CI | P* | I 2 (%)† | No. of comparisons/studies | No. of cases | OR/RR | 95 % CI | P* | I 2 (%)† | No. of comparisons/studies | No. of cases | OR/RR | 95 %CI | P* | I 2 (%)† | |
| Case–control studies | ||||||||||||||||||
| Overall effect | 37/25 | 15 522 | 0·85 | 0·75, 0·97 | <0·001 | 64 | 17/14 | 9191 | 0·79 | 0·67, 0·95 | <0·001 | 68 | 14/12 | 4996 | 0·95 | 0·79, 1·15 | 0·02 | 53 |
| Geographic area | ||||||||||||||||||
| America | 14/9 | 7847 | 0·90 | 0·77, 1·05 | 0·01 | 58 | 8/6 | 4970 | 0·88 | 0·70, 1·10 | 0·02 | 64 | 4/3 | 2347 | 1·00 | 0·85, 1·18 | 0·34 | 8 |
| Asia | 13/6 | 2062 | 0·75 | 0·49, 1·16 | <0·001 | 80 | 6/5 | 1534 | 0·77 | 0·46, 1·29 | <0·001 | 79 | 6/5 | 905 | 0·77 | 0·45, 1·33 | 0·002 | 77 |
| Europe | 10/10 | 5613 | 0·73 | 0·57, 0·93 | 0·009 | 59 | 3/3 | 2687 | 0·68 | 0·57, 0·81 | 0·33 | 9 | 4/4 | 1744 | 1·03 | 0·84, 1·25 | 0·40 | 0 |
| Type of controls | ||||||||||||||||||
| Hospital | 17/11 | 7768 | 0·78 | 0·63, 0·97 | <0·001 | 74 | 7/6 | 4273 | 0·80 | 0·60, 1·08 | 0·004 | 71 | 6/5 | 2614 | 0·97 | 0·71, 1·33 | 0·009 | 67 |
| Population | 20/14 | 7754 | 0·84 | 0·71, 1·00 | <0·001 | 60 | 10/8 | 4918 | 0·79 | 0·61, 1·01 | 0·002 | 69 | 8/7 | 2382 | 0·95 | 0·82, 1·10 | 0·25 | 24 |
| Sex | ||||||||||||||||||
| Males | 13/11 | 7046 | 0·96 | 0·73, 1·25 | <0·001 | 78 | 9/9 | 4033 | 0·86 | 0·62, 1·18 | <0·001 | 77 | 5/5 | 1754 | 1·13 | 0·69, 1·86 | <0·001 | 80 |
| Females | 12/10 | 5530 | 0·82 | 0·73, 0·93 | 0·11 | 35 | 8/8 | 3350 | 0·80 | 0·63, 1·03 | 0·02 | 56 | 5/5 | 1234 | 0·87 | 0·71, 1·08 | 0·74 | 0 |
| Cohort studies | ||||||||||||||||||
| Overall effect | 27/16 | 10 443 | 0·94 | 0·88, 1·01 | 0·85 | 0 | 16/13 | 4838 | 0·93 | 0·86, 1·01 | 0·51 | 0 | 16/13 | 2740 | 0·98 | 0·88, 1·09 | 0·46 | 0 |
| Geographic area | ||||||||||||||||||
| America | 6/4 | 1853 | 0·92 | 0·82, 1·03 | 0·83 | 0 | 3/3 | 1380 | 0·93 | 0·81, 1·06 | 0·48 | 0 | 3/3 | 327 | 1·17 | 0·71, 1·92 | 0·16 | 42 |
| Asia | 7/4 | 2794 | 0·93 | 0·82, 1·05 | 0·18 | 33 | 6/4 | 1848 | 0·89 | 0·76, 1·03 | 0·16 | 38 | 4/3 | 950 | 1·02 | 0·83, 1·26 | 0·95 | 0 |
| Europe | 14/8 | 5796 | 0·96 | 0·88, 1·06 | 0·94 | 0 | 7/6 | 1610 | 0·98 | 0·86, 1·11 | 0·71 | 0 | 9/7 | 1463 | 0·98 | 0·84, 1·14 | 0·38 | 7 |
| Sex | ||||||||||||||||||
| Males | 11/9 | 3562 | 0·97 | 0·87, 1·08 | 0·97 | 0 | 7/7 | 1543 | 0·99 | 0·85, 1·14 | 0·81 | 0 | 7/7 | 1026 | 1·02 | 0·85, 1·23 | 0·44 | 0 |
| Females | 10/9 | 3707 | 0·93 | 0·81, 1·05 | 0·49 | 3 | 7/7 | 1935 | 0·91 | 0·77, 1·07 | 0·21 | 29 | 7/7 | 939 | 1·02 | 0·83, 1·25 | 0·29 | 19 |
| Follow-up periods | ||||||||||||||||||
| <10 years | 12/7 | 2675 | 0·92 | 0·85, 1·01 | 0·35 | 10 | 6/5 | 1582 | 0·90 | 0·81, 1·00 | 0·30 | 17 | 4/4 | 774 | 0·92 | 0·78, 1·08 | 0·54 | 0 |
| ≥10 years | 15/9 | 7771 | 0·96 | 0·88, 1·05 | 0·98 | 0 | 10/8 | 3256 | 0·98 | 0·87, 1·09 | 0·62 | 0 | 12/9 | 1969 | 1.03 | 0.90, 1.19 | 0.40 | 5 |
RR, relative ratio.
*P value for heterogeneity.
†I 2 is interpreted as the proportion of total variation across studies due to heterogeneity rather than chance.
The characteristics of the sixteen cohort studies including 953 669 participants and 10 443 cases for colorectal cancer are shown in Table 3. In the sixteen studies, we found thirteen studies that offered information on colon cancer (4838 cases) and thirteen studies on rectal cancer (2740 cases). Eight studies were performed in Europe and four in Asia. Other studies were conducted in America. Nine of the sixteen cohort studies reported data for men and women separately. No significant differences were found between highest v. lowest/non coffee consumption from cohort studies, which was different to what was found from case–control studies. However, there was a slight suggestion of an inverse association between coffee consumption and colorectal cancer (RR = 0·94, 95 % CI 0·88, 1·01; P for heterogeneity = 0·85; I 2 = 0 %; Fig. 2) and colon cancer (RR = 0·93, 95 % CI 0·86, 1·01; P for heterogeneity = 0·51; I 2 = 0 %), but not for rectal cancer (RR = 0·98, 95 % CI 0·88, 1·09; P for heterogeneity = 0·46; I 2 = 0 %). There was no statistically significant heterogeneity in all the subgroup analyses. No significant associations were found when subgroup analyses were conducted by geographic regions. Compared with men, women tended to show a lower risk of colorectal cancer (RR = 0·93, 95 % CI 0·81, 1·05) and colon cancer (RR = 0·91, 95 % CI 0·77, 1·07). For duration of follow-up, we applied 10 years of follow-up as a cut-off because the mean of follow-up time for all sixteen cohort studies was roughly 10·5 years( 6 ) and there were nine and seven studies whose follow-up periods were over and less than 10 years, respectively. Results of analyses in stratum of follow-up period indicated that studies with shorter follow-up time (<10 years) tended to show marginally inverse relationships between coffee intake and the risks of colorectal (RR = 0·92, 95 % CI 0·85, 1·01) and colon caner (RR = 0·90, 95 % CI 0·81, 1·00; Table 2).
Table 3.
Characteristics of cohort studies of coffee consumption and colorectal, colon and rectal cancer risk
| First author (year) | Years of study* | Country | No. of subjects | No. of cases | RR | 95 % CI | Coffee (‘highest’ v. ‘lowest/non’) | Adjustment factors |
|---|---|---|---|---|---|---|---|---|
| Jacobsen (1986)( 53 ) | 1967–1978 (11·5) | Norway | 16 555 (13 664 M, 2891 F) | 97 CC, 63 RC | CC: 0·54 | 0·22, 1·30 | ‘≤2 cups/d’ v. ‘≥7 cups/d’ | Age, sex, alcohol for CC, residence |
| RC: 1·07 | 0·41, 2·79 | |||||||
| Wu (1987)( 55 ) | 1981–1985 (4·5) | USA | 11 644 | 146 CRC (58 M, 68 F) | For CRC, M: 1·54 | 0·6, 3·7 | ‘4 cups/d’ v. ‘1cup/d’ | Age |
| For CRC, F: 1·17 | 0·4, 3·1 | |||||||
| Klatsky (1988)( 54 ) | 1978–1984 | USA | 106 203 | 203 CC, 66 RC | CC: 0·92 | 0·80, 1·06 | Continuous variable (cups/d) | Age, sex, alcohol, smoking, BMI, race, education, serum cholesterol |
| RC: 0·84 | 0·66, 1·07 | |||||||
| Stensvold (1994)( 37 ) | 1977–1990 (10·1) | Norway | 42 973 (21 735 M, 21 238 F) | 130 CC, 79 RC | For CC, M: 0·90 | 0·35, 2·39 | Continuous variable (cups/d) | Age, smoking, residence |
| For CC, F: 0·82 | 0·22, 3·05 | |||||||
| For RC, M: 0·66 | 0·18, 2·49 | |||||||
| For RC, F: 0·47 | 0·10, 2·19 | |||||||
| Hartman (1998)( 19 ) | 1985–1993 (8·0) | Finland | 27 111 M smokers | 106 CC, 79 RC | CC: 0·84 | 0·50, 1·40 | ‘>6 cups/d’ v. ‘≤4 cups/d’ | Age, BMI, Ca, PA, intervention group for both CC and RC, serum cholesterol, tea for RC |
| RC: 0·74 | 0·40, 1·36 | |||||||
| Michels (2005)( 36a ) | 1980–1998 | USA | 87 794 F | 886 CRC (731 CC, 155 RC) | CRC: 0·94 | 0·63, 1·40 | For CRC and CC: ‘>5 cups/d’ v. ‘never’; for RC: ‘≥4 cups/d’ v. ‘never’ | Age, BMI, height, alcohol, smoking, PA, family history of CRC, sigmoidoscopy, aspirin use, vitamin supplement, energy, red meat, menopausal status, postmenopausal hormone use |
| CC: 0·85 | 0·55, 1·32 | |||||||
| RC: 1·80 | 0·94, 3·44 | |||||||
| Michels (2005)( 36b ) | 1986–1998 | USA | 46 099 M | 552 CRC (446 CC, 106 RC) | CRC: 1·09 | 0·55, 2·17 | For CRC and CC: ‘>5 cups/d’ v. ‘never’; for RC: ‘≥4 cups/d’ v. ‘never’ | Age, BMI, height, alcohol, smoking, PA, family history of CRC, sigmoidoscopy, aspirin use, vitamin supplement, energy, red meat |
| CC: 1·39 | 0·69, 2·78 | |||||||
| RC: 1·33 | 0·69, 2·56 | |||||||
| Larsson (2006)( 21 ) | 1998–2004 | Sweden | 81 922 (45 306 M, 36 616 F) | 723 CRC (469 CC, 256 RC) | CRC: 1·06 | 0·74, 1·52 | ‘≥6 cups/d’ v. ‘<1 cup/d’ | Age, BMI, smoking, PA, family history of CRC and diabetes, aspirin use, multivitamin use, energy, red meat, fruits, vegetables, milk, for women postmenopausal hormone use |
| CC: 1·16 | 0·73, 1·85 | |||||||
| RC: 0·92 | 0·51, 1·65 | |||||||
| Mucci (2006)( 17 ) | 1987–2003 | Sweden | 61 467 F | 741 CRC (504 CC, 237 RC) | CRC: 1·0 | 0·7, 1·3 | ‘≥4 cups/d’ v. ‘≤1 cup/d | Age at screening, BMI, education, alcohol, energy, saturated fat, fibre |
| CC: 1·1 | 0·8, 1·5 | |||||||
| RC: 0·9 | 0·6, 1·4 | |||||||
| Oba (2006)( 25 ) | 1993–2000 | Japan | 30 221 (13 894 M, 16 327 F) | 213 CC (111 M, 102 F) | For CC, M: 0·81 | 0·46, 1·42 | ‘≥1 cup/d’ v. ‘<1 cup/month’ | Age, BMI, height, alcohol, smoking, PA, black/green tea |
| For CC, F: 0·43 | 0·22, 0·85 | |||||||
| Lee (2007)( 22 ) | 1990–2002 (10) | Japan | 96 162 (46 023 M, 50 139 F) | 1163 CRC (763 CC, 400 RC) | For CRC, M: 1·10 | 0·82, 1·47 | ‘≥3 cups/d’ v. ‘almost never’ | Age, BMI, alcohol, smoking, PA, study area, family history of CRC, beef, pork, green vegetables, black/green tea, Chinese tea |
| For CRC, F: 0·68 | 0·40, 1·15 | |||||||
| Naganuma (2007)( 23 ) | 1990–2001 (11·0) | Japan | 38 701 (18 867 M, 19 834 F) | 457 CRC (281 CC, 180 RC) | CRC: 0·95 | 0·65, 1·39 | ‘≥3 cups/d’ v. ‘never’ | Age, sex, BMI, alcohol, smoking, walking time, family history, education, energy, fruits, vegetables, meat, tea; for F, menopausal status, numbers of pregnancies and deliveries, age at menarche, age at first delivery |
| CC: 0·96 | 0·58, 1·59 | |||||||
| RC: 0·94 | 0·53, 1·66 | |||||||
| Bidel (2010)( 52 ) | 1972–2006 (18) | Finland | 60 041 (29 159 M, 30 882 F) | 538 CRC (304 CC, 234 RC) | CRC: 1·03 | 0·58, 1·83 | ‘≥10 cups/d’ v. ‘0 cup/d’ | Age, sex, study year, education, cigarette smoking, alcohol consumption, leisure-time PA, history of diabetes, tea consumption, BMI |
| CC: 0·72 | 0·35, 1·47 | |||||||
| RC: 0·99 | 0·71, 5·55 | |||||||
| Nilsson (2010)( 24 ) | 1992–2007 (6) | Sweden | 64 603 (32 425 M, 32 178 F) | 321 CRC (174 M, 147 F) | CRC: 1·43 | 0·86, 2·38 | ‘≥4 cups/d’ v. ‘<1 cup/d | Age, sex, BMI, smoking, education, recreational PA |
| Peterson (2010)( 32 ) | 1993–2005 (9·8) | Singapore | 61 321 | 591 CC, 370 RC | CC: 0·90 | 0·73, 1·11 | ‘≥2 cups/d’ v. ‘<1 cup/d | Age, sex, dialect group, year of recruitment, education, BMI, smoking, alcohol and tea, PA, history of diabetes, family history of CRC |
| RC: 1·06 | 0·81, 1·37 | |||||||
| Simons (2010)( 27 ) | 1986–1999 (13·3) | Holland | 120 852 (58 279 M, 62 573 F) | 2899 CRC (1260 M, 939 F)/ 3877 CON | For CRC, M: 1·00For CRC, F: 1·07 | 0·74, 1·360·74, 1·55 | ‘>6 cups/d’ v. ‘≤2 cups/d’ | Age, family history of CRC, PA, smoking, educational, BMI, ethanol, meat, processed meat, folate, vitamin B6, fibre, fluid |
RR, relative ratio; M, males; F, females; CC, colon cancer; RC, rectal cancer; CRC, colorectal cancer; CON, control; PA, physical activity.
*Mean or median duration of follow-up in parentheses.
Fig. 2.
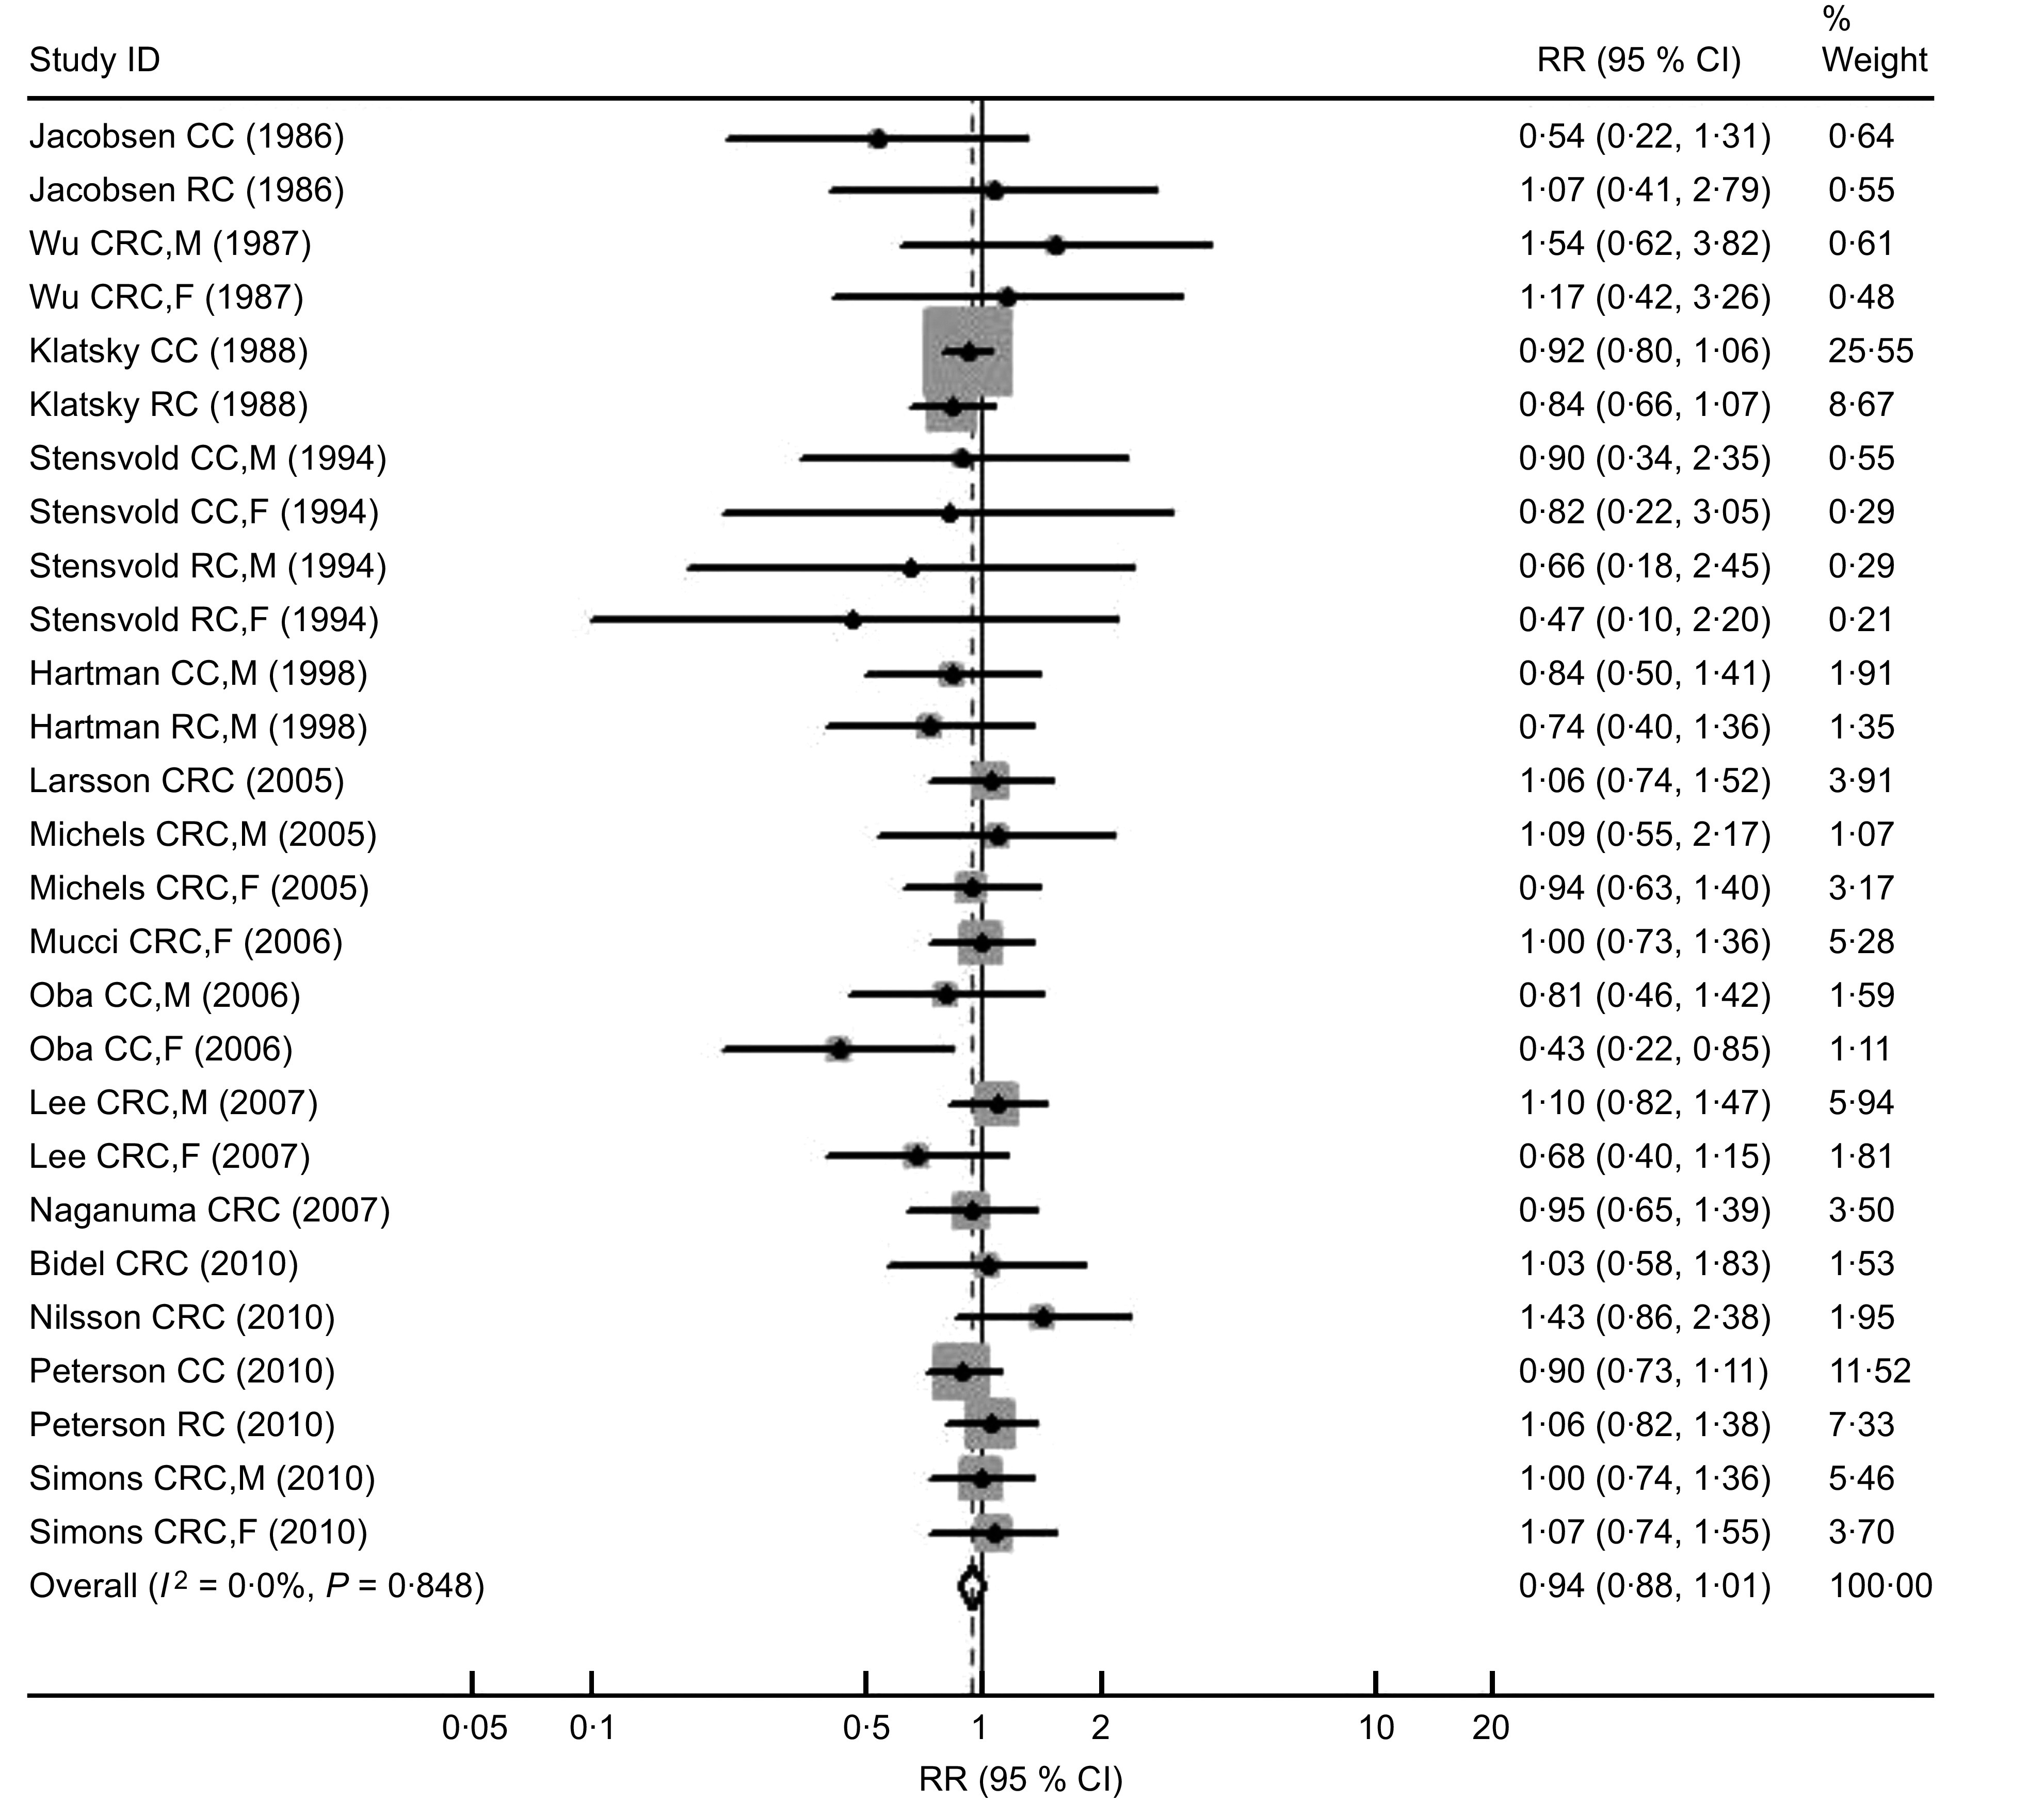
Forest plot of cohort studies of the risk of colorectal cancer (CRC, colorectal cancer; CC, colon cancer; RC, rectal cancer; M, males; F, females) for the highest v. the lowest/non coffee consumption. The size of the data markers (squares) for the relative ratios (RR) corresponds to the weight of the study in the meta-analysis; the horizontal lines correspond to the 95 % confidence intervals
Table 4 demonstrates the relationship by sex between coffee intake and coloroectal, colon and rectal cancer in strata of geographic regions in case–control and cohort studies. A significant association was found in Asian females for colon cancer from three cohort studies (OR = 0·61, 95 % CI 0·40, 0·93; P for heterogeneity = 0·23; I 2 = 32 %).
Table 4.
Sex-specific summary odds ratios/relative ratios and 95 % confidence intervals of colorectal, colon and rectal cancer for the highest v. the lowest/non coffee consumption in strata of geographic area
| Males | Females | |||||||||
|---|---|---|---|---|---|---|---|---|---|---|
| No. of comparisons/studies | RR | 95 % CI | P* | I 2 (%)† | No. of comparisons/studies | RR | 95 % CI | P* | I 2 (%)† | |
| Case–control studies | ||||||||||
| Colorectal cancer | ||||||||||
| America | 8/6 | 1·00 | 0·77, 1·28 | 0·02 | 57 | 8/6 | 0·88 | 0·76, 1·02 | 0·42 | 1 |
| Asia | 3/3 | 0·87 | 0·66, 1·15 | <0·001 | 94 | 3/3 | 0·76 | 0·36, 1·61 | 0·05 | 67 |
| Europe | 2/2 | 0·72 | 0·58, 0·90 | 0·33 | 0 | 1/1 | 0·65 | 0·48, 0·88 | – | – |
| Colon cancer | ||||||||||
| America | 5/5 | 0·95 | 0·63, 1·43 | 0·008 | 71 | 5/5 | 0·87 | 0·72, 1·05 | 0·18 | 36 |
| Asia | 2/2 | 0·76 | 0·51, 1·12 | <0·001 | 95 | 2/2 | 0·92 | 0·24, 3·59 | 0·007 | 86 |
| Europe | 2/2 | 0·72 | 0·58, 0·90 | 0·33 | 0 | 1/1 | 0·65 | 0·48, 0·88 | – | – |
| Rectal cancer | ||||||||||
| America | 3/3 | 1·05 | 0·82, 1·33 | 0·47 | 0 | 3/3 | 0·90 | 0·71, 1·13 | 0·68 | 0 |
| Asia | 2/2 | 1·14 | 0·21, 6·27 | <0·001 | 95 | 2/2 | 0·74 | 0·42, 1·30 | 0·38 | 0 |
| Europe | 0 | – | – | – | – | 0 | – | – | – | – |
| Cohort studies | ||||||||||
| Colorectal cancer | ||||||||||
| America | 2/2 | 1·23 | 0·71, 2·14 | 0·56 | 0 | 2/2 | 0·97 | 0·66, 1·40 | 0·71 | 0 |
| Asia | 3/3 | 1·00 | 0·80, 1·28 | 0·58 | 0 | 3/3 | 0·70 | 0·42, 1·18 | 0·12 | 53 |
| Europe | 6/4 | 0·95 | 0·83, 1·08 | 0·95 | 0 | 5/4 | 0·97 | 0·83, 1·13 | 0·88 | 0 |
| Colon cancer | ||||||||||
| America | 1/1 | 1·39 | 0·69, 2·78 | – | – | 1/1 | 0·85 | 0·55, 1·32 | – | – |
| Asia | 3/3 | 1·02 | 0·78, 1·33 | 0·54 | 0 | 3/3 | 0·61 | 0·40, 0·93 | 0·23 | 32 |
| Europe | 3/3 | 0·95 | 0·80, 1·14 | 0·73 | 0 | 3/3 | 1·00 | 0·82, 1·22 | 0·61 | 0 |
| Rectal cancer | ||||||||||
| America | 1/1 | 1·33 | 0·69, 2·56 | – | – | 1/1 | 1·80 | 0·94, 3·44 | – | – |
| Asia | 2/2 | 0·98 | 0·65, 1·48 | 0·84 | 0 | 2/2 | 0·94 | 0·50, 1·76 | 0·70 | 0 |
| Europe | 4/4 | 1·00 | 0·81, 1·25 | 0·16 | 42 | 4/4 | 0·96 | 0·76, 1·20 | 0·27 | 23 |
RR, relative ratio.
*P value for heterogeneity.
†I 2 is interpreted as the proportion of total variation across studies due to heterogeneity rather than chance.
We performed the analyses of meta-regression to clarify the heterogeneity in the subgroup analyses (i.e. geographic regions, sex, types of control and cancer sites) and to explore the influence factors of coffee consumption on colorectal cancer risk using case–control studies. Results from the meta-regression analyses confirmed that geographic region was independently associated with the positive association between coffee consumption and colorectal cancer risk (P values = 0·02). Geographic region was therefore proven to be a significant and independent predictor for heterogeneity, strengthening the results of the subgroup analyses.
When the analysis was limited to the studies that had adjusted for potential confounders (i.e. smoking, alcohol and physical activity), the summary OR for case–control studies of colorectal and colon cancer decreased to 0·62 (95 % CI 0·41, 0·93)( 11 , 44 , 46 ) and 0·56 (95 % CI 0·31, 1·02)( 11 , 46 ), respectively. In addition, the summary RR for cohort studies of colon cancer declined to 0·88 (95 % CI 0·76, 1·02)( 22 , 23 , 25 , 32 , 52 ). After combining three case–control studies( 11 , 15 , 31 ) providing OR for decaffeinated coffee, we found no relationship between colorectal cancer and decaffeinated coffee consumption (OR = 0·97, 95 % CI 0·86, 1·10; P for heterogeneity = 0·12; I 2 = 45 %).
The potential for publication bias was examined by the construction of a ‘funnel plot’ showing the relationship between OR/RR and the standard error of logarithmic OR/RR, the Begg's rank correlation and Egger's regression tests. There was no evidence of publication bias in the studies of coffee consumption and colorectal, colon or rectal cancer in different geographic areas or sex. As shown in Fig. 3, for the analysis of colorectal cancer in cohort studies, the symmetric funnel plot suggested no evidence of publication bias. Egger's test and Begg's test yielded similar results to funnel plots: colorectal cancer (Begg P = 0·63; Eegger P = 0·69), colon cancer (Begg P = 0·40; Eegger P = 0·61), rectal cancer (Begg P = 0·54; Eegger P = 0·55) for case–control studies, and colorectal cancer (Begg P = 0·17; Eegger P = 0·49), colon caner (Begg P = 0·57; Eegger P = 0·84), rectal cancer (Begg P = 0·53; Eegger P = 0·86) for cohort studies.
Fig. 3.

Funnel plot indicating publication bias in cohort studies of the risk of colorectal cancer for the highest v. the lowest/non coffee consumption (RR, relative ratio)
Discussion
In the present analysis, there were twenty-five case–control studies and sixteen cohort studies that reported the association between coffee consumption and colorectal cancer risk. The combined results of case–control studies indicated that the risk of colorectal and colon cancer for the highest coffee drinkers was approximately 15 % and 21 % lower than for the lowest/non drinkers, respectively. Significant inverse associations were also found in females for colorectal cancer and in Europe for colorectal and colon cancer. However, the results of cohort studies were inconclusive and coffee drinks were found to be correlated with marginally lower risks of colorectal and colon cancer. Substantially decreased risk of colon cancer was found only in Asian women. These results are similar to the other meta-analysis that presented a summary RR of colorectal cancer of 0·97 (95 % CI 0·73, 1·29) for cohort studies and 0·72 (95 % CI 0·61, 0·84) for case–control studies for high v. low categories of coffee consumption( 5 ). The discrepancy between the results of case–control studies and cohort studies may partly be related to the different time exposures considered. Case–control studies tend to examine the effect of coffee intake shortly before diagnosis, while many cohort studies, especially those with very long follow-up time, tend to examine more distant exposure. This is supported by the subgroup analysis according to follow-up period of the cohort studies conducted here, which indicated that studies with shorter follow-up time (<10 years) are more likely to show an inverse association between coffee intake and the risk of colorectal cancer (RR = 0·92, 95 % CI 0·85, 1·01), colon cancer (RR = 0·90, 95 % CI 0·81, 1·00) and rectal cancer (RR = 0·92, 95 % CI 0·78, 1·08) than those with longer follow-up time (>10 years).
The mechanism of the possible protection of coffee against large bowel cancer is not well understood. It has been interpreted in terms of the antioxidant, antimutagenic and anticarcinogenic effects by coffee's complicated compounds. Coffee contains phenolic compounds (such as chlorogenic, caffeic and cumaric acids), melanoidins and diterpenes (such as cafestol and kahweol), which have been confirmed to eliminate several carcinogens and reduce the oxidant effect of polycyclic aromatic hydrocarbons( 3 , 58 ). In addition, coffee intake might also decrease colon cancer risk by reducing the risk of type 2 diabetes( 59 , 60 ), which is a known risk factor for colorectal cancer( 61 , 62 ). Wu et al. found lower concentrations of C-peptide, a marker of insulin secretion, in women who drank more than four cups of caffeinated or decaffeinated coffee daily compared with non-drinkers( 63 ).
A recent meta-analysis of cohort studies based on twelve studies found no significant effect of coffee consumption on colorectal cancer risk (RR = 0·91; 95 % CI 0·81, 1·02). However, there was a slight suggestion of an inverse association between coffee consumption and colon cancer in women (RR = 0·79; 95 % CI 0·60, 1·04)( 6 ). Our findings confirmed these previous results. We also observed apparently stronger inverse relationships in women from case–control studies and cohort studies in colorectal cancer and colon cancer. Nevertheless, the difference between sexes was not statistically significant, which was similar to the results of other analyses( 7 , 9 ). When we performed geographic subgroup analysis combining case–control studies, a significant inverse association between coffee consumption and risk of colorectal cancer could be observed in Europe but not in Asia or America. The significant difference between geographic areas was also confirmed by the results of meta-regression of region-stratified analyses. In the Northern European countries, coffee is usually prepared by boiling ground coffee beans with water and decanting the fluid without filtration. It is now known that cafestol and kahweol, both lipid components of coffee beans, are removed by filtration( 64 ). Cafestol and kahweol can reduce the oxidant effect of polycyclic aromatic hydrocarbons and several other carcinogens( 58 ). In addition, the categories of the low and high drinkers varied across the studies included in the present meta-analysis, as coffee drinking is more frequent in Europe than in America and even less common in Asia.
In the present meta-analysis, the significant positive effect of coffee consumption was found in colon cancer but not in rectal cancer. This is because coffee has been reported to reduce the synthesis and secretion of bile acid (a promoter of colon cancer) into the colon by down-regulating the expression of bile acid homeostatic genes( 65 ); eliminate several carcinogens by the action of cafestol and kahweol; and increase colonic motility limited to the rectosigmoid region by both regular and decaffeinated coffee, seen predominantly in women( 66 ).
Several studies have reported that coffee consumption tends to be strongly associated with smoking, alcohol and physical inactivity, which may attenuate the association of coffee with colorectal cancer( 4 – 6 , 34 , 37 ). In the current meta-analysis there were three case–control( 11 , 44 , 46 ) and seven cohort studies( 22 – 25 , 27 , 32 , 52 ) providing risk estimates adjusted for smoking status, alcohol intake and physical activity. Our results from the analysis limited to studies that had adjusted for all three potential confounders showed a stronger inverse association between coffee intake and colorectal and colon cancer in case–control studies, and for colon cancer in cohort studies. This result was similarly confirmed elsewhere( 6 ). Most of the articles included in the present analysis did not offer information on coffee type, brewing method or serving size. There were only three case–control( 11 , 15 , 31 ) studies presenting OR for decaffeinated coffee. A significant relationship between decaffeinated coffee consumption and colorectal cancer risk was not displayed after combining these decaffeinated coffee data (OR = 0·97, 95 % CI 0·86, 1·10), which was different from that of regular coffee (OR = 0·86; 95 % CI 0·75, 0·97) but not significantly (P = 0·66). The results indicated that there were not significant differences between regular and decaffeinated coffees.
Observational studies included in the current meta-analysis may have various sources of bias, such as selection and report bias of case–control studies and confounding. However, the consistency of results between types of controls (population- and hospital-based), sex and cancer sites argues against it. Although we only included studies in English and could not take unpublished studies into account, null results (thirty studies reporting negative results, fifteen for case–control and fifteen for cohort studies) have been published, thus limiting the scope for publication bias in our meta-analysis. After forty of null results appearing in the analysis were added randomly, the pooled OR/RR changed little. This suggests that unpublished studies, like published ones with non-significant results, do not seem to influence the combined estimate of this relationship over a large range.
Conclusions
The current systematic meta-analysis of case–control studies and cohort studies provided quantitative evidence of an inverse relationship between coffee drinking and colorectal cancer risk. A strong inverse association was suggested in women, in studies of colon rather than rectal cancer, in studies performed in Europe, and in studies with shorter follow-up time. Future studies need to better account for long-term coffee drinking, carefully control for potential confounders, account for potential sex- and site-specific differences, and offer information on coffee type, brewing method or serving size.
Acknowledgements
This research was supported in part by a grant from the National Natural Science Foundation of China (No. 30671759) to P.W. There is no conflict of interest that could inappropriately influence (bias) the present work. G.L. and D.M. searched the databases, analysed the data and wrote the manuscript; W.Z. searched the databases and analysed the data; Y.Z. and P.W. reviewed the manuscript.
References
- 1. Ahmedin Jemal D, Bray F, Center MM et al. (2011) Global cancer statistics. CA Cancer J Clin 61, 69–90. [DOI] [PubMed] [Google Scholar]
- 2. Wiseman M (2008) The second World Cancer Research Fund/American Institute for Cancer Research expert report. Food, nutrition, physical activity, and the prevention of cancer: a global perspective. Proc Nutr Soc 67, 253–256. [DOI] [PubMed] [Google Scholar]
- 3. International Agency for Research on Cancer (1991) Coffee, Tea, Mate, Methylxanthines and Methylglyoxal. IARC Monographs on the Evaluation of Carcinogenic Risks to Humans no. 51. Lyon: IARC. [PMC free article] [PubMed] [Google Scholar]
- 4. Tavani A & La Vecchia C (2004) Coffee, decaffeinated coffee, tea and cancer of the colon and rectum: a review of epidemiological studies, 1990–2003. Cancer Causes Control 15, 743–757. [DOI] [PubMed] [Google Scholar]
- 5. Giovannucci E (1998) Meta-analysis of coffee consumption and risk of colorectal cancer. Am J Epidemiol 147, 1043–1052. [DOI] [PubMed] [Google Scholar]
- 6. Je Y, Liu W & Giovannucci E (2009) Coffee consumption and risk of colorectal cancer: a systematic review and meta-analysis of prospective cohort studies. Int J Cancer 124, 1662–1668. [DOI] [PubMed] [Google Scholar]
- 7. Zhang X, Albanes D, Beeson WL et al. (2010) Risk of colon cancer and coffee, tea, and sugar-sweetened soft drink intake: pooled analysis of prospective cohort studies. J Natl Cancer Inst 102, 771–783. [DOI] [PMC free article] [PubMed] [Google Scholar]
- 8. Yu X, Bao Z, Zou J et al. (2011) Coffee consumption and risk of cancers: a meta-analysis of cohort studies. BMC Cancer 11, 96. [DOI] [PMC free article] [PubMed] [Google Scholar]
- 9. Galeone C, Turati F, La Vecchia C et al. (2010) Coffee consumption and risk of colorectal cancer: a meta-analysis of case–control studies. Cancer Causes Control 21, 1949–1959. [DOI] [PubMed] [Google Scholar]
- 10. Slattery ML, Anderson K, Curtin K et al. (2001) Lifestyle factors and Ki-ras mutations in colon cancer tumors. Mutat Res 483, 73–81. [DOI] [PubMed] [Google Scholar]
- 11. Slattery ML, Caan BJ, Anderson KE et al. (1999) Intake of fluids and methylxanthine-containing beverages: association with colon cancer. Int J Cancer 81, 199–204. [DOI] [PubMed] [Google Scholar]
- 12. Slattery ML, Kampman E, Samowitz W et al. (2000) Interplay between dietary inducers of GST and the GSTM-1 genotype in colon cancer. Int J Cancer 87, 728–733. [PubMed] [Google Scholar]
- 13. Favero A, Franceschi S, La Vecchia C et al. (1998) Meal frequency and coffee intake in colon cancer. Nutr Cancer 30, 182–185. [DOI] [PubMed] [Google Scholar]
- 14. Tavani A, Fioretti F, Franceschi S et al. (1999) Education, socioeconomic status and risk of cancer of the colon and rectum. Int J Epidemiol 28, 380–385. [DOI] [PubMed] [Google Scholar]
- 15. Tavani A, Pregnolato A, La Vecchia C et al. (1997) Coffee and tea intake and risk of cancers of the colon and rectum: a study of 3,530 cases and 7,057 controls. Int J Cancer 73, 193–197. [DOI] [PubMed] [Google Scholar]
- 16. Bidoli E, Franceschi S, Talamini R et al. (1992) Food consumption and cancer of the colon and rectum in north-eastern Italy. Int J Cancer 50, 223–229. [DOI] [PubMed] [Google Scholar]
- 17. Mucci LA, Adami H-O & Wolk A (2006) Prospective study of dietary acrylamide and risk of colorectal cancer among women. Int J Cancer 118, 169–173. [DOI] [PubMed] [Google Scholar]
- 18. Terry P, Bergkvist L, Holmberg L et al. (2001) Coffee consumption and risk of colorectal cancer in a population based prospective cohort of Swedish women. Gut 49, 87–90. [DOI] [PMC free article] [PubMed] [Google Scholar]
- 19. Hartman TJ, Tangrea JA, Pietinen P et al. (1998) Tea and coffee consumption and risk of colon and rectal cancer in middle-aged Finnish men. Nutr Cancer 31, 41–48. [DOI] [PubMed] [Google Scholar]
- 20. Hoshiyama Y, Sekine T & Sasaba T (1993) A case–control study of colorectal cancer and its relation to diet, cigarettes, and alcohol consumption in Saitama Prefecture, Japan. Tohoku J Exp Med 171, 153–165. [DOI] [PubMed] [Google Scholar]
- 21. Larsson SC, Bergkvist L, Giovannucci E et al. (2006) Coffee consumption and incidence of colorectal cancer in two prospective cohort studies of Swedish women and men. Am J Epidemiol 163, 638–644. [DOI] [PubMed] [Google Scholar]
- 22. Lee K-J, Inoue M, Otani T et al. (2007) Coffee consumption and risk of colorectal cancer in a population-based prospective cohort of Japanese men and women. Int J Cancer 121, 1312–1318. [DOI] [PubMed] [Google Scholar]
- 23. Naganuma T, Kuriyama S, Akhter M et al. (2007) Coffee consumption and the risk of colorectal cancer: a prospective cohort study in Japan. Int J Cancer 120, 1542–1547. [DOI] [PubMed] [Google Scholar]
- 24. Nilsson LM, Johansson I, Lenner P et al. (2010) Consumption of filtered and boiled coffee and the risk of incident cancer: a prospective cohort study. Cancer Causes Control 21, 1533–1544. [DOI] [PubMed] [Google Scholar]
- 25. Oba S, Shimizu N, Nagata C et al. (2006) The relationship between the consumption of meat, fat, and coffee and the risk of colon cancer: a prospective study in Japan. Cancer Lett 244, 260–267. [DOI] [PubMed] [Google Scholar]
- 26. Olsen J & Kronborg O (1993) Coffee, tobacco and alcohol as risk factors for cancer and adenoma of the large intestine. Int J Epidemiol 22, 398–402. [DOI] [PubMed] [Google Scholar]
- 27. Simons CCJM, Leurs LJ, Weijenberg MP et al. (2010) Fluid intake and colorectal cancer risk in the Netherlands Cohort Study. Nutr Cancer 62, 307–321. [DOI] [PubMed] [Google Scholar]
- 28. Yeh C-C, Hsieh L-L, Tang R et al. (2003) Risk factors for colorectal cancer in Taiwan: a hospital-based case–control study. J Formos Med Assoc 102, 305–312. [PubMed] [Google Scholar]
- 29. Centonze S, Boeing H, Leoci C et al. (1994) Dietary habits and colorectal cancer in a low-risk area. Results from a population-based case–control study in southern Italy. Nutr Cancer 21, 233–246. [DOI] [PubMed] [Google Scholar]
- 30. Kato I, Tominaga S, Matsuura A et al. (1990) A comparative case–control study of colorectal cancer and adenoma. Jpn J Cancer Res 81, 1101–1108. [DOI] [PMC free article] [PubMed] [Google Scholar]
- 31. Murtaugh MA, Ma K-N, Caan BJ et al. (2004) Association of fluids from beverages with risk of rectal cancer. Nutr Cancer 49, 25–31. [DOI] [PubMed] [Google Scholar]
- 32. Peterson S, Yuan J-M, Koh W-P et al. (2010) Coffee intake and risk of colorectal cancer among Chinese in Singapore: the Singapore Chinese Health Study. Nutr Cancer 62, 21–29. [DOI] [PMC free article] [PubMed] [Google Scholar]
- 33. Shannon J, White E, Shattuck AL et al. (1996) Relationship of food groups and water intake to colon cancer risk. Cancer Epidemiol Biomarkers Prev 5, 495–502. [PubMed] [Google Scholar]
- 34. Slattery ML, West DW, Robison LM et al. (1990) Tobacco, alcohol, coffee, and caffeine as risk factors for colon cancer in a low-risk population. Epidemiology 1, 141–145. [DOI] [PubMed] [Google Scholar]
- 35. Wei JT, Connelly AE, Satia JA et al. (2004) Eating frequency and colon cancer risk. Nutr Cancer 50, 16–22. [DOI] [PubMed] [Google Scholar]
- 36. Michels KB, Willett WC, Fuchs CS et al. (2005) Coffee, tea, and caffeine consumption and incidence of colon and rectal cancer. J Natl Cancer Inst 97, 282–292. [DOI] [PMC free article] [PubMed] [Google Scholar]
- 37. Stensvold I & Jacobsen BK (1994) Coffee and cancer: a prospective study of 43,000 Norwegian men and women. Cancer Causes Control 5, 401–408. [DOI] [PubMed] [Google Scholar]
- 38. Zhang B, Li X, Nakama H et al. (2002) A case–control study on risk of changing food consumption for colorectal cancer. Cancer Invest 20, 458–463. [DOI] [PubMed] [Google Scholar]
- 39. Jarebinski M, Adanja B & Vlajinac H (1989) Case–control study of relationship of some biosocial correlates to rectal cancer patients in Belgrade, Yugoslavia. Neoplasma 36, 369–374. [PubMed] [Google Scholar]
- 40. Benito E, Obrador A, Stiggelbout A et al. (1990) A population-based case–control study of colorectal cancer in Majorca. I. Dietary factors. Int J Cancer 45, 69–76. [DOI] [PubMed] [Google Scholar]
- 41. Munoz SE, Navarro A, Lantieri MJ et al. (1998) Alcohol, methylxanthine-containing beverages, and colorectal cancer in Cordoba, Argentina. Eur J Cancer Prev 7, 207–213. [DOI] [PubMed] [Google Scholar]
- 42. Woolcott CG, King WD & Marrett LD (2002) Coffee and tea consumption and cancers of the bladder, colon and rectum. Eur J Cancer Prev 11, 137–145. [DOI] [PubMed] [Google Scholar]
- 43. Baron JA, Gerhardsson de Verdier M & Ekbom A (1994) Coffee, tea, tobacco, and cancer of the large bowel. Cancer Epidemiol Biomarkers Prev 3, 565–570. [PubMed] [Google Scholar]
- 44. Levi F, Pasche C, La Vecchia C et al. (1999) Food groups and colorectal cancer risk. Br J Cancer 79, 1283–1287. [DOI] [PMC free article] [PubMed] [Google Scholar]
- 45. Boutron-Ruault MC, Senesse P, Faivre J et al. (1999) Foods as risk factors for colorectal cancer: a case–control study in Burgundy (France). Eur J Cancer Prev 8, 229–235. [DOI] [PubMed] [Google Scholar]
- 46. Inoue M, Tajima K, Hirose K et al. (1998) Tea and coffee consumption and the risk of digestive tract cancers: data from a comparative case–referent study in Japan. Cancer Causes Control 9, 209–216. [DOI] [PubMed] [Google Scholar]
- 47. Higginson J (1966) Etiological factors in gastrointestinal cancer in man. J Natl Cancer Inst 37, 527–545. [PubMed] [Google Scholar]
- 48. Bjelke E (1974) Letter: Colon cancer and blood-cholesterol. Lancet 1, 1116–1117. [DOI] [PubMed] [Google Scholar]
- 49. Macquart-Moulin G, Riboli E, Cornee J et al. (1986) Case–control study on colorectal cancer and diet in Marseilles. Int J Cancer 38, 183–191. [DOI] [PubMed] [Google Scholar]
- 50. Lee HP, Gourley L, Duffy SW et al. (1989) Colorectal cancer and diet in an Asian population – a case–control study among Singapore Chinese. Int J Cancer 43, 1007–1016. [DOI] [PubMed] [Google Scholar]
- 51. Rosenberg L, Werler MM, Palmer JR et al. (1989) The risks of cancers of the colon and rectum in relation to coffee consumption. Am J Epidemiol 130, 895–903. [DOI] [PubMed] [Google Scholar]
- 52. Bidel S, Hu G, Jousilahti P et al. (2010) Coffee consumption and risk of colorectal cancer. Eur J Clin Nutr 64, 917–923. [DOI] [PubMed] [Google Scholar]
- 53. Jacobsen BK, Bjelke E, Kvale G et al. (1986) Coffee drinking, mortality, and cancer incidence: results from a Norwegian prospective study. J Natl Cancer Inst 76, 823–831. [PubMed] [Google Scholar]
- 54. Klatsky AL, Armstrong MA, Friedman GD et al. (1988) The relations of alcoholic beverage use to colon and rectal cancer. Am J Epidemiol 128, 1007–1015. [DOI] [PubMed] [Google Scholar]
- 55. Wu AH, Paganini-Hill A, Ross RK et al. (1987) Alcohol, physical activity and other risk factors for colorectal cancer: a prospective study. Br J Cancer 55, 687–694. [DOI] [PMC free article] [PubMed] [Google Scholar]
- 56. Higgins JPT, Thompson SG, Deeks JJ et al. (2003) Measuring inconsistency in meta-analyses. BMJ 327, 557–560. [DOI] [PMC free article] [PubMed] [Google Scholar]
- 57. Higgins JPT & Thompson SG (2002) Quantifying heterogeneity in a meta-analysis. Stat Med 21, 1539–1558. [DOI] [PubMed] [Google Scholar]
- 58. Cavin C, Holzhaeuser D, Scharf G et al. (2002) Cafestol and kahweol, two coffee specific diterpenes with anticarcinogenic activity. Food Chem Toxicol 40, 1155–1163. [DOI] [PubMed] [Google Scholar]
- 59. McCarty MF (2005) A chlorogenic acid-induced increase in GLP-1 production may mediate the impact of heavy coffee consumption on diabetes risk. Med Hypotheses 64, 848–853. [DOI] [PubMed] [Google Scholar]
- 60. Otani T, Iwasaki M, Sasazuki S et al. (2007) Plasma C-peptide, insulin-like growth factor-I, insulin-like growth factor binding proteins and risk of colorectal cancer in a nested case–control study: the Japan public health center-based prospective study. Int J Cancer 120, 2007–2012. [DOI] [PubMed] [Google Scholar]
- 61. Giovannucci E (2007) Metabolic syndrome, hyperinsulinemia, and colon cancer: a review. Am J Clin Nutr 86, issue 3, s836–s842. [DOI] [PubMed] [Google Scholar]
- 62. Tsugane S & Inoue M (2010) Insulin resistance and cancer: epidemiological evidence. Cancer Sci 101, 1073–1079. [DOI] [PMC free article] [PubMed] [Google Scholar]
- 63. Wu T, Willett WC, Hankinson SE et al. (2005) Caffeinated coffee, decaffeinated coffee, and caffeine in relation to plasma C-peptide levels, a marker of insulin secretion, in US women. Diabetes Care 28, 1390–1396. [DOI] [PubMed] [Google Scholar]
- 64. George SE, Ramalakshmi K & Mohan Rao LJ (2008) A perception on health benefits of coffee. Crit Rev Food Sci Nutr 48, 464–486. [DOI] [PubMed] [Google Scholar]
- 65. Ricketts M-L, Boekschoten MV, Kreeft AJ et al. (2007) The cholesterol-raising factor from coffee beans, cafestol, as an agonist ligand for the farnesoid and pregnane X receptors. Mol Endocrinol 21, 1603–1616. [DOI] [PubMed] [Google Scholar]
- 66. Brown SR, Cann PA & Read NW (1990) Effect of coffee on distal colon function. Gut 31, 450–453. [DOI] [PMC free article] [PubMed] [Google Scholar]