

Abstract
In the absence of head-to-head trials, indirect treatment comparisons (ITCs) are often used to compare the efficacy of different therapies to support decision-making. Matching-adjusted indirect comparison (MAIC), a type of ITC, is increasingly used to compare treatment efficacy when individual patient data are available from one trial and only aggregate data are available from the other trial. This paper examines the conduct and reporting of MAICs to compare treatments for spinal muscular atrophy (SMA), a rare neuromuscular disease. A literature search identified three studies comparing approved treatments for SMA including nusinersen, risdiplam, and onasemnogene abeparvovec. The quality of the MAICs was assessed on the basis of the following principles consolidated from published MAIC best practices: (1) justification for the use of MAIC is clearly stated, (2) the included trials with respect to study population and design are comparable, (3) all known confounders and effect modifiers are identified a priori and accounted for in the analysis, (4) outcomes should be similar in definition and assessment, (5) baseline characteristics are reported before and after adjustment, along with weights, and (6) key details of a MAIC are reported. In the three MAIC publications in SMA to date, the quality of analysis and reporting varied greatly. Various sources of bias in the MAICs were identified, including lack of control for key confounders and effect modifiers, inconsistency in outcome definitions across trials, imbalances in important baseline characteristics after weighting, and lack of reporting key elements. These findings highlight the importance of evaluating MAICs according to best practices when assessing the conduct and reporting of MAICs.
Supplementary Information
The online version contains supplementary material available at 10.1007/s12325-023-02520-2.
Keywords: Best practices, Comparative effectiveness, Critical appraisal, Indirect treatment comparison, Matching-adjusted indirect comparison, Neuromuscular disease, Nusinersen, Onasemnogene abeparvovec, Risdiplam, Spinal muscular atrophy
Key Summary Points
| A matching-adjusted indirect comparison (MAIC), a type of indirect treatment comparison method, may be used to compare the efficacy of different therapies when direct head-to-head comparisons do not exist. |
| The quality of MAICs should be carefully evaluated according to best practices, various sources of bias should be identified, and the results of a MAIC should be interpreted in the context of potential biases present. |
| The quality of the conduct and reporting varied greatly in the three identified MAIC publications in spinal muscular atrophy (SMA). |
| Findings from a MAIC can be misleading because of cross-trial differences in inclusion/exclusion criteria, baseline characteristics, definitions and assessment schedules of outcomes, and key baseline confounders not balanced after weighting, especially in the context of SMA. |
Introduction
In the absence of randomized head-to-head trials directly comparing treatments, indirect treatment comparisons (ITCs) are increasingly used to understand the comparative efficacy of different treatments evaluated in separate trials [1, 2]. Comparing treatments originally evaluated in separate trials can be challenging because of differences in study design, characteristics of the trial populations, and outcome definitions and assessments.
ITC methods may be used when individual patient data (IPD) are available from one trial but only aggregate data (i.e., summary-level data such as means and proportions) are available from another trial. Some commonly used ITC methods include matching-adjusted indirect comparison (MAIC) [1–3] and simulated treatment comparison (STC) [4, 5]. Although there are advantages and disadvantages associated with each method [6], MAIC may be preferred over STC when working with time-to-event or other non-linear outcomes because of the bias incurred with STC when using non-linear regression models [7].
MAICs are a statistical method that attempts to account for cross-trial differences by applying a form of propensity score weighting to balance baseline covariate distributions across trial populations in an ITC [1, 3]. In brief, this method involves applying the inclusion/exclusion criteria and outcome definitions used in the comparator trial with aggregate data to the other trial with IPD. Individuals in the IPD population are then given a weight that reflects how likely they were to appear in the trial with aggregate data. The goal is that the weighted mean baseline characteristics of patients in the trial with IPD match the baseline characteristics reported for the trial with aggregate data. These steps can be implemented in either an anchored or unanchored MAIC. An anchored MAIC is an indirect comparison of treatments from two trials that have a connected network (i.e., share a common comparator such as a placebo arm) whereas an unanchored MAIC is one in which there is a lack of a connected network (i.e., no common comparator such as in single-arm studies). An anchored MAIC is preferred because it respects randomization within studies to remove confounding bias and enables researchers to detect cross-trial differences between the common control arms that indicate residual bias after MAIC weighting [6].
Given the increasing popularity of MAIC for comparative efficacy research, it is crucial to identify best practices and understand limitations of this methodology in practice. The quality of a MAIC analysis and reporting can be variable, especially in the context of rare disease with small patient populations, high levels of patient heterogeneity across trials, and frequent use of single-arm designs. MAIC has recently been used to compare the efficacy of disease-modifying treatments in spinal muscular atrophy (SMA), a rare degenerative neuromuscular disease characterized by progressive muscle atrophy and weakness in which key baseline characteristics (such as disease duration or motor function status) can be highly predictive of treatment response [8]. SMA is a clinically heterogeneous disease, often classified as infantile-onset (type I) and later-onset (type II and III) SMA, based on age at symptom onset and severity of symptoms [9]. Three therapies are currently approved by the US Food and Drug Administration and the European Medicines Agency for the treatment of SMA: nusinersen (intrathecally administered antisense oligonucleotide for children and adults) [10, 11], onasemnogene abeparvovec (intravenously administered gene therapy for pediatric patients) [12, 13], and risdiplam (orally administered survival of motor neuron 2 (SMN2) splicing modifier for children and adults) [14, 15].
A critical appraisal of publications using MAIC to compare therapies for SMA has not previously been done. This article aims to evaluate the conduct and reporting of previously published studies using MAIC to compare treatments in SMA based on published best practices using a newly developed, consolidated checklist.
Methods
To identify published guidelines on MAIC best practices, a literature search was conducted in both PubMed and Embase from inception until April 8, 2022, using a combination of the following search terms: indirect treatment comparison, matching-adjusted indirect treatment comparison, best practices, educating, consensus, guidelines, or standards (see Table S1 Supplementary Material). Given the rarity of SMA, it was assumed that a search of these two databases was sufficient to ensure that all relevant studies were captured. Results were limited to English publications only. A total of 138 records were first identified followed by 22 records after title and abstract review. Following full-text review, a total of nine publications were retained.
Case studies of MAICs in SMA were identified through a second literature search using the search terms of indirect treatment comparison and spinal muscular atrophy in PubMed and Embase from inception until April 8, 2022 (see Table S2 Supplementary Material). All types of SMA were included in the literature search for completeness. When both a full publication and conference abstract based on the same analysis were identified, only the full publication was retained. Results were limited to English publications only. We identified 268 records of which 265 were not relevant to the topic or, in cases of conference proceedings, the full text publication was available. A total of three records remained after review.
This article is based on previously conducted studies and does not contain any new studies with human participants or animals performed by any of the authors.
Results
Literature Searches
The literature search of guidelines in MAIC identified a total of nine full-text publications, covering both standards of analysis and reporting, and included recommendations from the International Society of Pharmacoeconomics and Outcomes Research (ISPOR) and the National Institute for Health and Care Excellence (NICE) [1–4, 6, 16–19]. We identified themes repeated across these nine publications that were highlighted as critical for the proper implementation and reporting of MAICs (Table S3 Supplementary Material). These were then consolidated into a checklist to inform our critiques on the conduct and reporting of MAICs in SMA: (1) justification for use of MAIC is clearly stated, (2) the included trials with respect to study population and design are comparable, (3) all known confounders and potential effect modifiers are adjusted for, (4) outcomes should be similar in definition and assessment, (5) baseline characteristics before and after adjustment are reported, along with weights, and (6) key details are reported.
The second search to identify MAICs in SMA yielded two full-text and one poster publication of three separate MAIC analyses [20–22]. Table 1 summarizes the MAICs including the treatments compared, trials included, whether an anchored/unanchored MAIC was used, and outcomes assessed in the MAIC. Table 2 summarizes the clinical trials compared in the MAICs with respect to their study design, treatment groups, sample size, and key inclusion/exclusion criteria. In a MAIC among the infantile-onset SMA population by Liao et al., IPD were from the randomized, sham-procedure controlled ENDEAR/SHINE trial (nusinersen) and aggregated data were from the single-arm STR1VE-US trial (onasemnogene abeparvovec) [20]. In a separate MAIC analysis among the infantile-onset population by Bischof et al., pooled IPD were taken from the STR1VE-US and START trials (onasemnogene abeparvovec) and aggregated data were taken from ENDEAR/SHINE (nusinersen) [21]. The third publication by Ribero et al. included both patient populations with infantile-onset and later-onset SMA [22]. For the infantile-onset SMA population, IPD from FIREFISH (risdiplam) were compared to aggregate data from ENDEAR (nusinersen); in the later-onset SMA population, IPD from SUNFISH Part 2 (risdiplam) were compared to aggregate data from CHERISH (nusinersen). Given that STR1VE-US, START, and FIREFISH did not have a comparator group, all MAICs for infantile-onset SMA were unanchored. For later-onset SMA, Ribero et al. were able to conduct an anchored MAIC because there was a common comparator group in SUNFISH Part 2 (placebo) and CHERISH (sham-procedure) [22].
Table 1.
Summary of MAICs identified in SMA
| Infantile-onset SMA | Later-onset SMA | |||
|---|---|---|---|---|
| Liao et al. [20] | Bischof et al. [21] | Ribero et al. [22] | Ribero et al. [22] | |
| Index treatment (trial with IPD) | Nusinersen (ENDEAR/SHINE) | Onasemnogene abeparvovec (STR1VE-US/START) | Risdiplam (FIREFISH) | Risdiplam (SUNFISH Part 2) |
| Comparator treatment (trial with aggregate data) | Onasemnogene abeparvovec (STR1VE-US) | Nusinersen (ENDEAR/SHINE) | Nusinersen (ENDEAR) | Nusinersen (CHERISH) |
| Type of MAIC | Unanchored | Unanchored | Unanchored | Anchored |
| Outcomes assessed in MAIC | Event-free survival (no death or permanent ventilation), overall survival, and permanent ventilation | Event-free survival (no death or permanent ventilation), overall survival, and achievement of motor milestones (i.e., independent sitting and walking) | Event-free survival (no death or permanent ventilation), overall survival, achievement of motor milestones, motor function, serious adverse events | Motor function and serious adverse events |
IPD individual patient data, MAIC matching-adjusted indirect comparison, SMA spinal muscular atrophy
Table 2.
Summary of clinical trials compared in the SMA MAICs
| Infantile-onset SMA | Later-onset SMA | |||||
|---|---|---|---|---|---|---|
| ENDEAR [35]/SHINE [36] | STR1VE-US [37] | START [38] | FIREFISH [39] | CHERISH [40] | SUNFISH Part 2 [41] | |
| Study design |
ENDEAR: randomized, double-blind, sham-procedure controlled study SHINE: open-label, 5-year extension study of ENDEAR participants |
Open-label, single-arm study | Open-label, single-arm study | Open-label study with two parts: (1) dose finding and (2) confirmatory, single-arm | Randomized, double-blind, sham-controlled study | Randomized, double-blind, placebo-controlled study |
| Treatment groups | Nusinersen vs. sham-procedure | Onasemnogene abeparvovec | Onasemnogene abeparvovec | Risdiplam | Nusinersen vs. sham-procedure | Risdiplam vs. placebo |
| Sample size | Nusinersen (n = 81)a, sham (n = 41) | n = 22 | n = 15 | n = 62 | Nusinersen (n = 84), sham (n = 42) | Risdiplam (n = 120), placebo (n = 60) |
| Key inclusion criteria |
Age ≤ 7 months at screening 2 SMN2 copies |
Age < 6 months at time of dosing 2 SMN2 copiesb |
Age at dosing < 9 months for first 9 patients; age at dosing < 6 months for the last six patients 2 SMN2 copies |
Age ≤ 7 months at enrollment 2 SMN2 copies |
Age 2–12 years at screening Can sit independently, but not walk independently |
Age 2–25 years at screening Type 2 or 3 SMA; non-ambulant but can sit independently |
| Key exclusion criteria | Hypoxemia at screening |
Tracheostomy or non-invasive ventilatory support ≥ 6 h per day over the 7 days prior to screening Pulse oximetry < 96% saturation at screening Signs of aspiration |
Invasive ventilatory support or pulse oximetry < 95% saturation Signs of aspiration |
Hospitalization for pulmonary event within the last 2 months Invasive ventilation or tracheostomy Awake non-invasive ventilation or with awake hypoxemia with or without ventilator support History of respiratory failure or severe pneumonia and had not fully recovered their pulmonary function at the time of screening |
HFMSE score < 10 Severe contractures or severe scoliosis Invasive or noninvasive ventilation for > 6 h during a 24-h period at screening Gastric feeding tube Hospitalization for surgery, pulmonary event, or nutritional support within 2 months of screening |
Hospitalization for pulmonary event within the last 2 months Surgery for scoliosis or hip fixation in the 1 year preceding screening or planned within next 18 months Invasive ventilation or tracheostomy |
HFMSE Hammersmith Functional Motor Scale Expanded, MAIC matching-adjusted indirect comparison, SMA spinal muscular atrophy, SMN2 survival motor neuron 2 gene
a81 participants were randomized to the nusinersen group but one infant withdrew from the trial before treatment; infant was not dosed in ENDEAR but was dosed in SHINE
bAlthough all enrolled participants had 2 copies of SMN2, inclusion criteria permitted enrollment of infants with 1 or 2 copies
Review of MAICs in SMA
A critical review of the identified MAICs in SMA was performed on the basis of six key items for assessing the conduct and reporting of MAICs that were consolidated from nine publications providing recommendations on best practices in indirect treatment comparisons such as MAIC.
Justification for Use of MAIC is Clearly Stated
Prior to conducting any analysis, the rationale for using MAIC, versus other methods of indirect comparison, should be provided. MAIC may be the optimal approach when there is a disjointed network, a single comparator group with many outcomes to be compared, and a non-linear outcome. In instances where a MAIC is chosen because IPD are available for one trial and aggregate-level data for another, it should be noted that this rationale alone does not assume that the MAIC is feasible and valid. The evaluation of MAICs should consider whether all six items on the best practices checklist were followed and the potential biases that may result from deviations.
Case study in SMA: The three identified MAIC publications in SMA provided justification for the choice of using MAIC (Table 1). Unanchored MAIC methodology was used in all MAICs for infantile-onset SMA trials because of the lack of a connected network.
The Included Trials with Respect to Study Population and Design Are Comparable
When selecting trials to include in a MAIC, assessing the comparability of trials is important. Although there is no quantitative way of testing for similarity between trials [18], trials may be considered comparable if they are similar in terms of their inclusion/exclusion criteria, baseline characteristics, standard of care in common comparator arms, background treatments, temporal setting, amongst others. To increase comparability of trials, the inclusion/exclusion criteria of the comparator trial with aggregate data can be applied to the trial with IPD. This can be done by excluding patients in the trial with IPD who could not have enrolled in the comparator trial with aggregate data as a result of the comparator trial's inclusion/exclusion criteria. For this to work, the inclusion/exclusion criteria in the trial with IPD should be equally or more inclusive than those of the trial providing aggregate data [2]. If the trial with IPD has more restrictive inclusion/exclusion criteria than the comparator trial with aggregate data, then it may not be possible to address differences in study populations, which may lead to biased comparisons. Further, variables available in each trial, along with their distributions should be presented. For baseline characteristics to be considered comparable, there should be overlap in the minimum and maximum values of a variable across trials. If there is limited/no overlap in the baseline characteristics of potential effect modifiers and confounders in comparisons across trial populations, then a MAIC may not be feasible.
Case study in SMA: There are important differences in the inclusion/exclusion criteria and baseline characteristics across trials in SMA to consider. For example, there is a lack of comparability in the exclusion criteria between trials regarding pulmonary events and pulmonary function, which are key factors influencing main outcomes of interest in SMA trials (e.g., permanent ventilation-free survival and overall survival in infantile-onset SMA). These differences are particularly notable for FIREFISH and ENDEAR, where greater exclusions were made in FIREFISH (e.g., excluded patients with hospitalization for pulmonary event within the last 2 months; with invasive ventilation or tracheostomy; requiring non-invasive ventilation or hypoxemia with or without ventilator support; and history of respiratory failure or severe pneumonia and had not fully recovered their pulmonary function at time of screening) than in ENDEAR (i.e., excluded patients with hypoxemia at screening) (Table 2). Incomparable exclusion criteria used in FIREFISH and ENDEAR may have enriched for a population in FIREFISH with less pulmonary burden compared to patients in ENDEAR that cannot be resolved through MAIC weighting, thus hindering a valid comparison of risdiplam and nusinersen, especially for the outcomes of permanent ventilation-free survival and overall survival [22].
All Known Confounders and Effect Modifiers Are Identified A Priori and Accounted for in the Analysis
In unanchored MAICs, where the evidence is disconnected because of the lack of a common comparator, both confounders and effect modifiers need to be accounted for in the MAIC weights. In anchored MAICs using randomized trials where the evidence is connected by a common comparator, only effect modifiers need to be accounted for in the MAIC weights (as there is expected to be no confounding due to randomization). Effect modifiers impact the generalizability of the treatment effects to the target population and therefore need to be balanced across trials. All potential confounders and effect modifiers need to be pre-specified, clinically plausible, measured, and defined similarly across trials [2, 6]. Evidence and assessment for effect modifier status should be provided. Not including key confounders and effect modifiers in MAIC weighting precludes the ability to fully account for cross-trial differences and therefore increases the possibility of residual confounding and lack of generalizability. The reporting of the analyses should describe how potential confounders and effect modifiers were identified a priori, and whether these variables were available in the studies being compared. MAICs using small trials in rare disease may be limited by the number of variables that can be included in the weighting model. In this situation, it may be preferable to prioritize including as many of the most important confounders and effect modifiers as possible. In the case where key variables were not available, an assessment of the potential biasing impact due to the lack of adjustment for key variables should be given.
Case study in SMA: Table 3 summarizes the baseline characteristics, along with factors known to impact treatment outcomes in SMA [8], for each MAIC identified in the review. Liao et al. included six confounders and effect modifiers in MAIC weighting while Bischof et al. used two and Ribero et al. used three in each of their two MAICs. While Liao et al. included the most comprehensive list of variables with similar definitions in the analysis, ventilatory and nutritional support were not included as weighting factors because of different definitions between trials (see Table S4 Supplementary Material) [20]. Notably, Bischof et al. did not include age at first dose or age at symptom onset as a weighting factor, which are the strongest predictors of treatment response in SMA [23], which may be an important source of bias. Although Bischof et al. weighted on nutritional support as defined by feeding tube, there may still be residual confounding as this may not have captured the full extent of baseline differences in swallowing and feeding difficulties across the trial populations (see Table S4 Supplementary Material). In the later-onset SMA MAIC by Ribero et al., known effect modifiers of SMA treatment such as age at symptom onset or disease duration at baseline were not included despite their availability in the data, which may lead to biased comparisons.
Table 3.
Baseline characteristics used for weighting in MAIC analyses in SMA

CHOP-INTEND Children’s Hospital of Philadelphia Infant Test of Neurological Disorders, HFMSE Hammersmith Function Motor Scale-Expanded, MAIC matching-adjusted indirect comparison, RULM revised upper limb module, SMA spinal muscular atrophy, SMN2 survival motor neuron 2 gene
aDisease duration at baseline was used in lieu of age at symptom onset
bAge at screening is not needed if age at first dose/age at symptom onset are included in MAIC weights
cSee Table S4 Supplementary Material for how these variables were defined differently across trials
dBaseline HFMSE or RULM score is only relevant for analyses of patients with later-onset SMA
eAll analyses for infantile-onset included patients with 2 SMN2 copies
Outcomes Should Be Similar in Definition and Assessment
The determination of which outcomes of interest to compare should be justified and may be based on key primary and secondary outcomes evaluated in the trials [19]. All included outcomes should be comparable and measured consistently across trials including their definition, schedule of assessment, statistical analysis method, length of follow-up, and potential loss to follow-up [2]. When outcome definitions and timing of assessments are not comparable, it is recommended not to make comparisons across trials [6]. It is important to consider both the direction and magnitude of the potential bias due to differences in outcome definitions and assessments on results.
Case study in SMA: Table 4 highlights key differences in outcome definitions and assessments across the trials included in the MAICs. In infantile-onset SMA, overall survival was defined similarly with comparable assessment schedules across trials. However, permanent ventilation was defined differently across studies with respect to duration required (Table 4), which may also impact the outcome of event-free survival. In addition, motor milestone outcomes assessed in MAICs were not consistently defined or assessed at different times across trials. For example, START/STR1VE did not report a 24-month timepoint for walking independently or sitting unassisted. To make a comparison with the 24-month timepoint, Bischof et al. carried the 18-month results of STR1VE forward, which may be inappropriate as a greater number of patients could have achieved motor milestones if there was longer follow-up. Although this difference in outcome assessment between ENDEAR/SHINE and START/STR1VE may have led to underestimation of the proportion of patients who achieved motor milestones in START/STR1VE, cross-trial differences in baseline characteristics and poor confounding control in the MAIC conducted by Bischof et al. may have potentially led to overestimation of treatment effects. The resulting net bias from all possible sources of bias remains unclear. In another example, motor milestone outcomes were assessed at 12 months in FIREFISH whereas ENDEAR ended early with an average length of 9 months of follow-up based on a positive benefit–risk assessment of a prespecified interim analysis. However, Ribero et al. did not use follow-up data from the extension study SHINE, biasing the observed results. Differences in the timing of assessment in SMA can impact the validity of a MAIC analysis as the achievement of motor milestones, such as sitting unassisted, are time dependent.
Table 4.
Outcome definitions and assessments in clinical trials used in SMA MAICs
| Infantile-onset SMA | Later-onset SMA | |||||
|---|---|---|---|---|---|---|
| ENDEAR [35]/SHINE [36] | STR1VE-US [37] | START [38] | FIREFISH [39] | CHERISH [40] | SUNFISH Part 2 [42] | |
| Event-free survival (death or permanent ventilation) | Permanent ventilation: Tracheostomy or ventilatory support ≥ 16 h/day for > 21 continuous days in the absence of an acute reversible event on days 91, 182, 273, 364, 394, up to day 1814 | Permanent ventilation: Tracheostomy or ≥ 16 h/day of non-invasive ventilatory support for ≥ 14 days in the absence of an acute reversible event at 14 months of age | Permanent ventilation: ≥ 16 h per day of non-invasive ventilatory support for ≥ 14 days in the absence of an acute reversible illness, excluding perioperative ventilation; assessed up to 13.6 months of age | Permanent ventilation: ≥ 16 h per day of non-invasive ventilation or intubation for > 21 consecutive days in the absence of, or following the resolution of, an acute reversible event; or tracheostomy; assessed up to 24 months | N/A | N/A |
| Motor milestones/function | Measured by HINE-2a and CHOP-INTENDb at days 64, 183, 302, 394, up to day 1814 |
Measured by the gross motor subtest of the BSID-IIIc at the 18 months of age study visit (STR1VE) or 24 months post-dose (START) The 18-month results from STR1VE-US were imputed as an estimate of the number of patients who achieved motor milestones at 24 months of follow-up in the MAIC by Bischof et al. [21] |
Measured by HINE-2a at days 119, 245, 364, and 490 and CHOP-INTENDb at days 119, 182, 245, 301, 364, 427, and 490 | Measured by HFMSEd and RULMe at month 15. Ribero et al. [22] extracted outcomes at 12 months from CHERISH figures | Measured by HFMSEd and RULMe at month 12 | |
BSID-III Bayley Scales of Infant and Toddler Development, third edition, CHOP-INTEND Children’s Hospital of Philadelphia Infant Test of Neuromuscular Disorders, HFMSE Hammersmith Functional Motor Scale-Expanded, HINE-2 Hammersmith Infant Neurological Examination Section 2, MAIC matching-adjusted indirect comparison, N/A not applicable, RULM Revised Upper Limb Module, SMA spinal muscular atrophy
aThe HINE is a three-section, 37-item, quantifiable assessment of overall neurologic function in infants. The second section of HINE (HINE-2) assesses the development of motor function through the achievement of motor milestones. Scores on the HINE-2 range from 0 to 26, with higher scores indicative of better motor function. The HINE-2 evaluates eight motor milestone categories including voluntary grasp, kicking, head control, rolling, sitting, crawling, standing, and walking [43, 44]
bThe CHOP-INTEND is a 16-item measure of motor function in infants and children with neuromuscular disorders. CHOP-INTEND scores range from 0 to 64, and higher scores indicate better motor function [45]
cThe BSID-III assesses developmental functioning in infants and toddlers across five domains, cognition, language, social-emotional, and motor and adaptive behavior [46]
dThe HFMSE is a 33-item measure of motor function that is validated for use in patients with SMA to assess activities related to daily living. The total HFMSE score ranges from 0 to 66 points, and higher scores indicate an improvement in motor function. A change in the HFMSE score of at least 3 points is deemed clinically meaningful [47, 48]
eThe RULM measures upper limb function, with scores ranging from 0 to 37 (higher scores indicate better function) [49]
Baseline Characteristics Before and After Adjustment Are Reported, Along with Weights
MAIC weighting is similar to inverse propensity score weighting and involves assigning weights to patients in the trial with IPD that correspond to their odds of being enrolled in the comparator trial with aggregate data as compared to the trial with IPD [6]. MAIC uses inverse propensity score weighting to form weighted mean estimators of the expected mean outcomes of the treatments of interest, where the propensity scores are found using a method of moments [3]. After weighting on baseline confounders and effect modifiers, trial populations should be balanced such that the weighted means of the baseline characteristics in the trial with IPD match the baseline characteristics reported in the trial with aggregate data [2]. In addition, after weighting, the distribution of the weights should be reported to assess population overlap and to identify any overly influential individuals. When the trial populations are similar to begin with, each patient in the IPD trial would get a weight close to 1. Extreme weights indicate that the two populations are highly imbalanced across one or more baseline characteristics [2]. Thus, population characteristics before and after weighting, including means as well as standard deviations and/or ranges, should be reported to understand how well the populations are balanced. The distributions of other key prognostic factors and effect modifiers that were not included in the weighting model should also be reported to understand the extent of imbalance in these variables between the weighted trial with individual patient data and the trial with aggregate data. When calculating an estimate in a weighted sample, the effective sample size (ESS) reflects the number of independent non-weighted individuals that would be required to give an estimate with the same precision as the weighted sample estimate. While assessment of the sufficiency of an ESS is subjective, a small ESS may indicate widely imbalanced variables or little overlap between baseline characteristics, and can lead to low statistical power to detect differences between treatments [6]. Extreme weights, along with a small ESS, are indicative of possible lack of population overlap and decreased precision with corresponding increased uncertainty in the effect estimates.
Case study in infantile-onset SMA: Table 5 summarizes the baseline covariates before and after weighting, as reported in the publications of MAICs for infantile-onset SMA. Liao et al. restricted the populations by using a subpopulation of 48 patients from ENDEAR/SHINE that met the key inclusion/exclusion criteria of STR1VE US for age at first treatment (< 6 months); these 48 patients were all included in the final weighted population [20]. Liao et al. reported the pre- and post-weighting distributions of all six variables included in the weighting model. In addition, the distributions of important baseline variables (e.g., ventilatory and nutritional support) that were not used in weighting because of differences in their definitions across trials were also reported to assess whether the patient populations were likely balanced with respect to these additional variables after MAIC weighting. In contrast, Bischof et al. reported the pre- and post-weighting values of only the two covariates used to calculate weights, thus making it difficult to assess whether weighting achieved balanced trial populations in other important prognostic factors and effect modifiers. Despite using an unanchored MAIC, Ribero et al. weighted the baseline characteristics of the pooled FIREFISH data to both arms of ENDEAR and not just those who received nusinersen. Notably, although the inclusion/exclusion criteria of FIREFISH may have enriched a population with less pulmonary burden, the percentage of patients with ventilatory support are reported to be higher in FIREFISH than ENDEAR. This is most likely due to the different uses/purposes of pulmonary support at baseline across trials; of the infants in pooled FIREFISH receiving ventilatory or pulmonary care, over 88% were receiving it prophylactically instead of receiving it because of breathing problems that necessitated ventilatory support [24, 25]. Following weighting, the pooled FIREFISH sample had a greater mean age at first dose, higher proportion of female patients, higher mean CHOP-INTEND score, and lower proportion of patients with ventilatory support than the nusinersen arm of ENDEAR, as reflected in the before weighting section of Table 5. Ribero et al. presented the distribution of the weights following balancing of the population in the supplemental materials; these were, however, skewed towards low values suggesting lack of trial population overlap.
Case study in later-onset SMA: Table 6 summarizes the baseline covariates before and after weighting, as reported in the publications of MAICs for later-onset SMA. While Ribero et al. excluded patients who would not have been enrolled in CHERISH when creating the SUNFISH Part 2 subset, differences remained post-weighting in key variables, including sex, age at symptom onset, and disease duration [22]. Post-weighting, the placebo arm in SUNFISH had better HFMSE outcomes than the sham arm in CHERISH. Since the two trial populations were not comparable, inferences on relative efficacy on HFMSE endpoints could not be drawn [22]. Moreover, there was limited ability to make valid statistical inferences given small sample sizes. For instance, the reported 95% confidence interval (95% CI) for the odds ratio for the relative efficacy of risdiplam vs. nusinersen for RULM responders ranged from 0 to 117.94 [22]. When comparing risdiplam with nusinersen for the incidence of any serious adverse event, the reported 95% CI for the odds ratio was 0.88 to 37.6 million [22]. These examples of highly imprecise results further underscore the fundamental challenge of conducting MAICs in rare disease.
Table 5.
Summary of baseline covariates before and after weighting, as reported in published MAICs of infantile-onset SMA
| Liao et al. [20] | Bischof et al. [21] | Ribero et al. [22] | ||||||
|---|---|---|---|---|---|---|---|---|
| Nusinersen (IPD from ENDEAR/SHINE) n = 80a |
Onasemnogene abeparvovec (aggregate data from STR1VE US) n = 22 |
Onasemnogene abeparvovec (IPD from START/STR1VE pooled) n = 34 |
Nusinersen (aggregate data from ENDEAR/SHINE) n = 81b |
Risdiplam (IPD from FIREFISH pooled) n = 58 |
Nusinersen (aggregate data from ENDEAR) n = 80 |
Sham control (aggregate data from ENDEAR) n = 41 |
||
| Before weighting | ||||||||
| Mean age at first dose, days (range) | 163.0 (52.0–242.0) | 112.6 (15.2–179.6) | 108.6 (15.2–240.3) | 164.3 (60.8–456.3) | 163 (68–212) | 163 (52–242) | 181 (30–262) | |
| Mean age at symptom onset, weeks (range) | 7.9 (2.0–18.0) | 8.3 (0–17.4) | 7.5 (0–17.1)c | 7.0 (0–17.4)c | 7.2 (4–13) | 7.9 (2–18) | 9.6 (1–20) | |
| Mean disease duration at screening, weeks (range) | NR | NR | NR | NR | 13.0 (1.0–23.3) | 13.2 (0–25.9) | 13.9 (0–23.1) | |
| Female, % | 54% | 55% | 56% | 54% | 57% | 54% | 59% | |
| Mean weight, kg (range) | 6.6 (4.7–9.3) | 5.8 (4.0–8.0) | 5.8 (3.6–8.4) | NR | 6.8 (4.1–10.6) | NR | NR | |
| Mean length at baseline, cm (range) | 64.1 (55.0–75.3) | 61.0 (51.0–70.0) | NR | NR | NR | NR | NR | |
| Mean CHOP-INTEND score (range) | 26.6 (8.0–48.5) | 32.0 (18.0–52.0) | 30.8 (12–52) | 26.7 (8.1)d | 22.47 (8–37) | 26.63 (8.13)d | 28.43 (7.56)d | |
| Patients with ventilatory support, %e | 26% | 0% | 6% | 26% | 29%f | 26% | 15% | |
| Patients with nutritional support, %g | 9% | 0% | 15% | 9% | 9% | 9% | 12% | |
| After weighting | ||||||||
| Mean age at first dose, days (range) | 112.6 (52.0–181.0) | 112.6 (15.2–179.6) | NR | 164.3 (60.8 - 456.3) | 169 (NR) | 169 (NR)h | ||
| Mean age at symptom onset, weeks (range) | 8.3 (2.0–16.0) | 8.3 (0–17.4) | NR | 7.0 (0 - 17.4)c | 7.9 (NR)c | 8.6 (NR)c,h | ||
| Mean disease duration at screening, days (range) | NR | NR | NR | NR | 94 (NR) | 94 (NR)h | ||
| Female, % | 55% | 55% | NR | 54% | 69% | 55%h | ||
| Mean weight, kg (range) | 5.8 (4.7–8.3) | 5.8 (4.0–8.0) | NR | NR | NR | NR | ||
| Mean length at baseline, cm (range) | 61.0 (55.0–71.1) | 61.0 (51.0–70.0) | NR | NR | NR | NR | ||
| Mean CHOP-INTEND score (range) | 32.0 (17.0–48.5) | 32.0 (18.0–52.0) | 26.7 (NR) | 26.7 (NR) | 27.24 (NR) | 27.24 (NR)h | ||
| Patients with ventilatory support, %e | 9% | 0% | NR | 26% | 18% | 22%h | ||
| Patients with nutritional support, %g | 3% | 0% | 9% | 9% | NR | NR | ||
| Effective sample size | 48i | 22 | 24.6 | 81 | 36.5 | 121 | ||
Characteristics in bold denote factors that were used for weighting in respective MAICs. Results are presented to the decimal place reported in each publication.
CHOP-INTEND Children’s Hospital of Philadelphia Infant Test of Neuromuscular Disorders, IPD individual patient data, MAIC matching-adjusted indirect comparison, NR not reported for specific values as stated in respective publication, SMA spinal muscular atrophy
aParticipants randomized to nusinersen in ENDEAR. Includes data from SHINE to better equate with survival endpoints in STR1VE US; ENDEAR ended early, with an average length of 9 months of follow-up based on positive results of a prespecified interim analysis
bOne infant randomized to receive nusinersen in ENDEAR was not dosed in ENDEAR but was dosed in SHINE
cConverted from days to weeks based on data in manuscript
dStandard deviation
eDefinition of ventilatory support differed across trials (see Table S4 Supplementary Material)
fOf the infants in pooled FIREFISH receiving ventilatory or pulmonary care, over 88% were receiving it prophylactically as reported in individual publications: Baranello NEJM 2021 and Darras NEJM 2021
gSwallowing and feeding difficulties were not specifically reported across trials (see Table S4 Supplementary Material)
hAverage of nusinersen and sham control used for weighting. Weighting based on average characteristics created more confounding as there were observed differences in the baseline characteristics (including those not used in MAIC weighting) between the two treatment arms in ENDEAR; this may have led to an overestimation of beneficial effects of risdiplam versus nusinersen
iBased on subpopulation of ENDEAR participants who met the STR1VE US inclusion criteria of age at first treatment <6 months
Table 6.
Summary of baseline covariates before and after weighting, as reported in the published MAIC of later-onset SMA [22]
| HFMSE analysis | RULM analysis | CHERISH | ||||
|---|---|---|---|---|---|---|
| Risdiplam (IPD from SUNFISH subseta) n = 43 |
Placebo control (IPD from SUNFISH subseta) n = 25 |
Risdiplam (IPD from SUNFISH subseta) n = 43 |
Placebo control (IPD from SUNFISH subseta) n = 25 |
Nusinersen (aggregate data from CHERISH) n = 84 |
Sham control (aggregate data from CHERISH) n = 42 |
|
| Before weighting | ||||||
| Mean age at screening, years | 5.0 | 5.3 | 5.0 | 5.3 | 3.8b | 3.4b |
| Mean age at symptom onset, months | 13.7 | 16.6 | 13.7 | 16.6 | 11.1b | 11.3b |
| Mean disease duration, months | 46.3 | 46.8 | 46.3 | 46.8 | 39.9b | 34.8b |
| Female, % | 53 | 44 | 53 | 44 | 55 | 50 |
| Mean HFMSE baseline score | 24.21 | 23.12 | 24.21 | 23.12 | 22.4b | 19.9b |
| Mean RULM baseline score | 21.65 | 22.28 | 21.65 | 22.28 | 19.4b | 18.4b |
| Mean SMN2 copy number | 3.09 | 3.08 | 3.09 | 3.08 | 3.0b | 2.9b |
| After weighting | ||||||
| Mean age at screening, years | 4.1 | 3.7 | 3.7 | 3.7 | 3.7c,d | |
| Mean age at symptom onset, months | 12.9 | 13.5 | 12.7 | 13.4 | 10.3c | |
| Mean disease duration, months | 36.4 | 30.5 | 31.6 | 30.7 | 36.0c | |
| Female, % | 60 | 46 | 61 | 43 | 53 | |
| Mean HFMSE baseline score | 22.41 | 21.57 | 21.99 | 22.36 | 21.57d | |
| Mean RULM baseline score | 20.02 | 19.71 | 19.11 | 19.07 | 19.07d | |
| Mean SMN2 copy number | 3.00 | 2.94 | 3.00 | 2.94 | 2.94d | |
| Effective sample size | 34.2 | 9.2 | 28.3 | 8.8 | 126 | |
Characteristics in bold denote factors that were used for weighting in respective MAICs. Ranges are not reported in this table as Ribero et al. did not report ranges.
HFMSE Hammersmith Functional Motor Scale-Expanded, MAIC matching-adjusted indirect comparison, RULM revised upper limb module, SMA spinal muscular atrophy, SMN2 survival motor neuron 2 gene
aSubset from SUNFISH Part 2 who were ≤ 9 years of age at screening, with an HFMSE baseline score of ≥ 10 and no severe scoliosis in an effort to match the inclusion criteria of CHERISH
bThese mean values were calculated/taken from CHERISH data as reported in Mercuri et al. [50]
cRibero et al. used the average of the median values of these baseline characteristics across the nusinersen and sham arms of CHERISH as a proxy for the mean values since the mean values were not reported in the original CHERISH publication by Mercuri et al. [50]
dAverage of baseline characteristics of nusinersen and sham control arms of CHERISH was used for weighting. Weighting based on average of characteristics of the nusinersen and sham arms of CHERISH created more confounding as there were observed differences in the baseline characteristics between the two treatment arms in CHERISH; this may have led to an overestimation of beneficial effects of risdiplam versus nusinersen
Key Details of a MAIC Should Be Reported
Finally, key details should be reported to improve the transparency of the conduct of a MAIC analysis. For example, key details include how standard errors were calculated to provide measures of uncertainty alongside effect estimates, and pre- and post-weighting results to convey the impact of adjustment on effect estimates [6]. Of note, reporting unweighted and weighted effect estimates alongside one another can highlight the degree of confounding present, especially in unanchored settings (e.g., comparison of single-arm trials).
Case study in SMA: Table 7 summarizes the critical appraisal of published MAICs according to the checklist and describes whether these key details were reported in the MAICs in SMA.
Table 7.
Critical appraisal of published MAICs in SMA according to consolidated checklist
| Liao et al. ENDEAR/SHINE vs STR1VE-US [20] |
Bischof et al. STR1VE-US/START vs ENDEAR/SHINE [21] |
Ribero et al. FIREFISH Parts 1 and 2 pooled vs ENDEAR [22] |
Ribero et al. SUNFISH Part 2 vs CHERISH [22] |
|
|---|---|---|---|---|
| Justification for use of MAIC is clearly stated | ✓ Lack of connected network for unanchored MAIC; combination of IPD and aggregate data were available | ✓ Provided rationale for anchored MAIC; combination of IPD and aggregate data were available | ||
| The included trials with respect to study population and design are comparable | ✓ Addressed some differences in study design; key inclusion/exclusion criteria were noted | ✗ Differences in study design were noted but not addressed | ✗ Differences in inclusion/exclusion criteria with regards to pulmonary function were not noted | ✓ Addressed some differences in inclusion/exclusion criteria by creating SUNFISH Part 2 subset |
| All known confounders and effect modifiers are identified a priori and accounted for in the analysis | ✓ Six baseline variables used for weighting; all baseline characteristics with similar definitions included in analysis | ✗ Only two baseline variables were used for weighting; important variables such as age and disease duration were not included | ✗ Only three baseline variables were considered for weighting; notably did not include body weight | ✗ Only three baseline variables were considered for weighting; notably did not include age at symptom onset or disease duration |
| Outcomes should be similar in definition and assessment | ✓ Motor function outcomes that were different were not included for analysis | ✗ Outcomes definitions and timing of assessments differed between the trials for included motor endpoints | ✗ Schedule of assessments differed between the trials for included motor endpoints |
✓ Outcomes similar though the primary outcome in SUNFISH Part 2 was not assessed in CHERISH ✗ Schedule of assessments differed between the trials for included motor endpoints |
| Baseline characteristics before and after adjustment are reported, along with weights | ✓ Baseline characteristics before and after weighting presented; balance was achieved on all six weighting factors | ✗ Not all baseline characteristics were presented before and after weighting to demonstrate balance (e.g., age at symptom onset, HINE-2) | ✗ Imbalance in baseline variables post weighting was present (e.g., sex, age at symptom onset) |
✗ Imbalance in baseline variables post weighting was present ✗ Assumptions of anchored MAIC were violated; placebo arm HFMSE outcomes in the weighted SUNFISH subset were different from sham control HFMSE outcomes in CHERISH |
| Key details of a MAIC are reported |
✓ Variables available in each study were listed along with their distributions and covariate overlap ✓ Evidence for effect modifier status was given ✗ Distribution of weights was not presented ✓ Measures of uncertainty were presented alongside estimates ✗ Explanation of how 95% CIs were calculated was not provided ✓ Unadjusted and adjusted results were presented alongside one another |
✓ Variables available in each study were listed along with their distributions and covariate overlap ✓ Evidence for effect modifier status was given ✗ Distribution of weights was not presented ✓ Measures of uncertainty were presented alongside estimates ✗ Explanation of how 95% CIs were calculated was not provided ✗ Only adjusted results are presented |
✓ Variables available in each study were listed along with their distributions and covariate overlap ✓ Evidence for effect modifier status was given ✓ Distribution of weights was presented ✓ Measures of uncertainty were presented alongside estimates ✓ Provided explanation of how 95% CIs were calculated ✓ Unadjusted and adjusted results were presented alongside one another |
|
✓ meets best practices ✗ does not meet best practices
CI confidence interval, HFMSE Hammersmith Functional Motor Scale-Expanded, HINE-2 Hammersmith Infant Neurological Examination Section 2, IPD individual patient data, MAIC matching-adjusted indirect comparison, SMA spinal muscular atrophy
Discussion
To make valid inferences regarding the comparative efficacy of treatments evaluated in separate trials using MAIC methodology, it is paramount to follow best practices. Although MAICs can be a helpful tool to increase the comparability of different trials, they may lead to dubious results if conducted when key assumptions are violated, and best practices not followed. The current paper summarizes guidelines on MAIC best practices and critically evaluates the conduct and reporting of three MAICs in SMA using the consolidated checklist. However, as highlighted in this paper, findings from a MAIC can be misleading as a result of cross-trial differences in inclusion/exclusion criteria, baseline characteristics, definitions and assessment schedules of outcomes, and key baseline confounders and effect modifiers not balanced after weighting. Results of a MAIC should be interpreted in the context of potential biases present.
In the applied examples of the MAICs conducted in SMA, we found important differences between included trials that may decrease the validity of existing indirect treatment comparisons. Across SMA trials, different inclusion/exclusion criteria were used with respect to age and pulmonary event and function, and key baseline characteristics differed such as age at first dose, motor function, and ventilatory and nutritional support. Varied definitions and assessments of key SMA outcomes were also noted including permanent ventilation and motor function. Two of the three identified MAICs were unable to adequately account for differences in baseline covariates, and included only two or three variables in the weights, thus leaving open a large possibility of residual confounding. This is problematic because differences in baseline characteristics, even if seemingly small, such as age at treatment initiation [23], disease duration and baseline ventilatory support [26], can have important effects on key SMA outcomes. As observed in Fig. 1, weighting on a more comprehensive set of variables (as per Liao et al., Table 3) versus an unweighted analysis (which was based on a subpopulation restricted on age only to match the inclusion/exclusion criteria of the comparator trial) resulted in a large difference in the probability of event-free survival, moving the hazard ratio from < 1 to > 1.
Fig. 1.
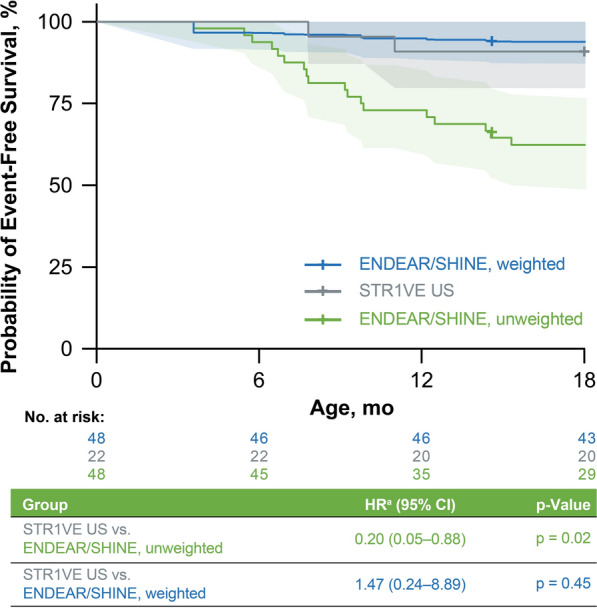
Example of reporting weighted and unweighted analyses [20]. Weighted analysis considered the factors highlighted in Table 3. Unweighted analysis was conducted in a subpopulation of ENDEAR/SHINE created on the basis of an age restriction to match the inclusion criteria used in STR1VE. aHR < 1.00 indicates a lower risk of an event in the STR1VE US cohort than in the ENDEAR/SHINE cohort. HR > 1.00 indicates a higher risk of an event in the STR1VE US cohort than in the ENDEAR/SHINE cohort. Shading denotes 95% CIs
Additionally, the considerations noted in this critical appraisal are aligned with those of multiple external and independently conducted health technology assessments, where the uncertainties regarding the observed treatment effects, as reported in Bischof et al. [21] and Ribero et al. [22], were noteworthy because of methodological issues including potential confounding due to differences in baseline characteristics that could not be adjusted for through MAIC. These assessments include, but are not limited to, the reimbursement reviews in Canada [27–30], France [31, 32], and Scotland [33, 34] (Table S5 Supplementary Material). Taken together, there are many potential sources of bias that should be considered when interpreting the results of existing MAICs, and it can be challenging to predict the direction and magnitude of the net bias when considering the totality of the issues. This underscores the importance of careful examination of the conduct and reporting of a MAIC to support evidence generation for decision-makers such as patients, clinicians, and regulatory and reimbursement agencies. MAICs may reduce observed cross-trial differences and provide decision-makers with comparative evidence when following and adhering to best practices.
Supplementary Information
Below is the link to the electronic supplementary material.
Acknowledgements
We thank Shirley Liao, PhD, for her contributions to the analysis of the infantile-onset portion of the case study in SMA.
Funding
This study was sponsored by Biogen (Cambridge, MA, US). The study sponsor is also responsible for the journal’s Rapid Service and Open Access fees.
Medical Writing and Editorial Assistance
Not applicable.
Authors Contributions
Tammy Jiang, Bora Youn, Angela D. Paradis, Rachel Beckerman, Lianne Barnieh and Nicole B. Johnson (all authors) made substantial contributions to the conception of the study design, analysis, and interpretation of the data. Tammy Jiang, Bora Youn, Angela D. Paradis, Rachel Beckerman, Lianne Barnieh and Nicole B. Johnson (all authors) contributed to the drafting of the manuscript and revised it critically for important intellectual content. Tammy Jiang, Bora Youn, Angela D. Paradis, Rachel Beckerman, Lianne Barnieh and Nicole B. Johnson (all authors) approved the version to be published and agree to be accountable for all aspects of the work.
Disclosures
Tammy Jiang, Bora Youn, Angela D. Paradis, Nicole B. Johnson are employees of and hold stock/stock options in Biogen. Lianne Barnieh and Rachel Beckerman have no conflicts to declare.
Compliance with Ethics Guidelines
Not applicable; all data was sourced from publicly available information. This article is based on previously conducted studies and does not contain any new studies with human participants or animals performed by any of the authors.
Data Availability
Data sharing not applicable to this article as no data sets were generated or analyzed during the current study.
References
- 1.Signorovitch JE, Sikirica V, Erder MH, et al. Matching-adjusted indirect comparisons: a new tool for timely comparative effectiveness research. Value Health. 2012;15(6):940–947. doi: 10.1016/j.jval.2012.05.004. [DOI] [PubMed] [Google Scholar]
- 2.Signorovitch JE, Wu EQ, Yu AP, et al. Comparative effectiveness without head-to-head trials: a method for matching-adjusted indirect comparisons applied to psoriasis treatment with adalimumab or etanercept. Pharmacoeconomics. 2010;28(10):935–945. doi: 10.2165/11538370-000000000-00000. [DOI] [PubMed] [Google Scholar]
- 3.Phillippo DM, Ades AE, Dias S, et al. NICE DSU technical support document 18: methods for population-adjusted indirect comparisons in submission to NICE. 2016. https://www.sheffield.ac.uk/nicedsu/tsds/population-adjusted
- 4.Ishak KJ, Proskorovsky I, Benedict A. Simulation and matching-based approaches for indirect comparison of treatments. Pharmacoeconomics. 2015;33(6):537–549. doi: 10.1007/s40273-015-0271-1. [DOI] [PubMed] [Google Scholar]
- 5.Caro JJ, Ishak KJ. No head-to-head trial? simulate the missing arms. Pharmacoeconomics. 2010;28(10):957–967. doi: 10.2165/11537420-000000000-00000. [DOI] [PubMed] [Google Scholar]
- 6.Phillippo DM, Ades AE, Dias S, et al. Methods for population-adjusted indirect comparisons in health technology appraisal. Med Decis Mak. 2018;38(2):200–211. doi: 10.1177/0272989X17725740. [DOI] [PMC free article] [PubMed] [Google Scholar]
- 7.Cheng D, Ayyagari R, Signorovitch J. The statistical performance of matching-adjusted indirect comparisons: estimating treatment effects with aggregate external control data. Ann Appl Stat. 2020;14(4):1806–1833. doi: 10.1214/20-AOAS1359. [DOI] [Google Scholar]
- 8.Kirschner J, Butoianu N, Goemans N, et al. European ad-hoc consensus statement on gene replacement therapy for spinal muscular atrophy. Eur J Paediatr Neurol. 2020;28:38–43. doi: 10.1016/j.ejpn.2020.07.001. [DOI] [PMC free article] [PubMed] [Google Scholar]
- 9.Darras BT, Markowitz JA, Monani UR, et al. Spinal muscular atrophies. In: Darras BT, Jones HR, Ryan MM, et al., editors. Neuromuscular disorders of infancy, childhood, and adolescence: a clinician’s approach. San Diego: Academic; 2015.
- 10.Food and Drug Administration. SPINRAZA (nusinersen) injection, for intrathecal use 2016. https://www.accessdata.fda.gov/drugsatfda_docs/label/2016/209531lbl.pdf. Accessed 22 Sep 2022.
- 11.European Medicines Agency. SPINRAZA (nusinersen) EMEA/H/C/004312 2017. https://www.ema.europa.eu/en/medicines/human/EPAR/spinraza. Accessed 22 Sep 2022.
- 12.Food and Drug Administration. ZOLGENSMA (onasemnogene abeparvovec-xioi) suspension for intravenous infusion 2021. https://www.fda.gov/media/126109/download. Accessed 22 Sep 2022.
- 13.European Medicines Agency. ZOLGENSMA (onasemnogene abeparvovec) EMEA/H/C/004750 2020. https://www.ema.europa.eu/en/medicines/human/EPAR/zolgensma. Accessed 22 Sep 2022.
- 14.Food and Drug Administration. EVRYSDI (risdiplam) for oral solution 2022. https://www.accessdata.fda.gov/drugsatfda_docs/label/2022/213535s003s005lbl.pdf. Accessed 22 Sep 2022.
- 15.European Medicines Agency. EVRYSDI (risdiplam) EMEA/H/C/005145 2021. https://www.ema.europa.eu/en/medicines/human/EPAR/evrysdi. Accessed 22 Sep 2022.
- 16.Jansen JP, Fleurence R, Devine B, et al. Interpreting indirect treatment comparisons and network meta-analysis for health-care decision making: report of the ISPOR Task Force on Indirect Treatment Comparisons Good Research Practices: part 1. Value Health. 2011;14(4):417–428. doi: 10.1016/j.jval.2011.04.002. [DOI] [PubMed] [Google Scholar]
- 17.Hoaglin DC, Hawkins N, Jansen JP, et al. Conducting indirect-treatment-comparison and network-meta-analysis studies: report of the ISPOR Task Force on Indirect Treatment Comparisons Good Research Practices: part 2. Value Health. 2011;14(4):429–437. doi: 10.1016/j.jval.2011.01.011. [DOI] [PubMed] [Google Scholar]
- 18.Alemayehu D, Cappelleri JC. Evaluating methodological assumptions in comparative effectiveness research: overcoming pitfalls. J Comp Eff Res. 2014;3(1):79–93. doi: 10.2217/cer.13.84. [DOI] [PubMed] [Google Scholar]
- 19.Samjoo IA, Worthington E, Haltner A, et al. The importance of considering differences in study and patient characteristics before undertaking indirect treatment comparisons: a case study of siponimod for secondary progressive multiple sclerosis. Curr Med Res Opin. 2020;36(7):1145–1156. doi: 10.1080/03007995.2020.1747998. [DOI] [PubMed] [Google Scholar]
- 20.Liao S, Bohn J, de Moor C, et al., editors. A cautionary tale for indirect treatment comparisons: an example from infantile-onset spinal muscular atrophy. In: Virtual ISPOR Europe; 2020. https://www.valueinhealthjournal.com/article/S1098-3015(20)34101-2/pdf
- 21.Bischof M, Lorenzi M, Lee J, et al. Matching-adjusted indirect treatment comparison of onasemnogene abeparvovec and nusinersen for the treatment of symptomatic patients with spinal muscular atrophy type 1. Curr Med Res Opin. 2021;37(10):1719–1730. doi: 10.1080/03007995.2021.1947216. [DOI] [PubMed] [Google Scholar]
- 22.Ribero VA, Daigl M, Martí Y, et al. How does risdiplam compare with other treatments for types 1–3 spinal muscular atrophy: a systematic literature review and indirect treatment comparison. J Comp Eff Res. 2022;11(5):347–70. [DOI] [PubMed]
- 23.Pechmann A, Behrens M, Dörnbrack K, et al. Effect of nusinersen on motor, respiratory and bulbar function in early-onset spinal muscular atrophy. Brain. 2023;146(2):668–77. [DOI] [PubMed]
- 24.Baranello G, Darras BT, Day JW, et al. Risdiplam in type 1 spinal muscular atrophy. N Engl J Med. 2021;384(10):915–923. doi: 10.1056/NEJMoa2009965. [DOI] [PubMed] [Google Scholar]
- 25.Darras BT, Masson R, Mazurkiewicz-Beldzinska M, et al. Risdiplam-treated infants with type 1 spinal muscular atrophy versus historical controls. N Engl J Med. 2021;385(5):427–435. doi: 10.1056/NEJMoa2102047. [DOI] [PubMed] [Google Scholar]
- 26.de Holanda MR, Jorge Polido G, Ciro M, et al. Clinical outcomes in patients with spinal muscular atrophy type 1 treated with nusinersen. J Neuromuscul Dis. 2021;8(2):217–224. doi: 10.3233/JND-200533. [DOI] [PubMed] [Google Scholar]
- 27.CADTH Reimbursement Review. Risdiplam (Evrysdi). Can J Health Technol. 2021;1(11). 10.51731/cjht.2021.185.
- 28.Institut National d’Excellence en Santé et en Services Sociaux. EVRYSDI: amyotrophie spinale 5q 2021. https://www.inesss.qc.ca/fileadmin/doc/INESSS/Inscription_medicaments/Avis_au_ministre/Juillet_2021/Evrysdi_2021_06.pdf. Accessed 4 Nov 2022.
- 29.CADTH Reimbursement Review. Onasemnogene abeparvovec (Zolgensma). Can J Health Technol. 2021;1(9).
- 30.Institut National d’Excellence en Santé et en Services Sociaux. ZOLGENSMA: amyotrophie spinale 5q 2020. https://www.inesss.qc.ca/fileadmin/doc/INESSS/Inscription_medicaments/Avis_au_ministre/Janvier_2021/Zolgensma_2020_12.pdf. Accessed 4 Nov 2022.
- 31.Haute Authorité de Santé. Commission de la Transparence: risdiplam 2021. https://www.has-sante.fr/upload/docs/evamed/CT-19266_EVRYSDI_PIC_AVIS%20DEF_CT19266.pdf. Accessed 4 Nov 2022.
- 32.Haute Authorité de Santé. Commission de la Transparence: onasemnogene abeparvovec 2020. https://www.has-sante.fr/upload/docs/evamed/CT-18743_ZOLGENSMA_PIC_INS_AvisDef_CT18743.pdf. Accessed 4 Nov 2022.
- 33.Scottish Medicines Consortium. risdiplam 0.75mg/mL powder for oral solution (Evrysdi) 2021. https://www.scottishmedicines.org.uk/media/6669/risdiplam-evrysdi-final-jan-2022-amended-270122-for-website.pdf. Accessed 4 Nov 2022.
- 34.Scottish Medicines Consortium. onasemnogene abeparvoved 2 × 10(13) vector genomes/mL solution for infusion (Zolgensma) 2021. https://www.scottishmedicines.org.uk/media/5813/onasemnogene-abeparvovec-zolgensma-final-feb-2021-amended-010321docx-for-website.pdf. Accessed 4 Nov 2022.
- 35.ClinicalTrials.gov. A study to assess the efficacy and safety of nusinersen (ISIS 396443) in infants with spinal muscular atrophy (ENDEAR). Identifier: NCT02193074. https://clinicaltrials.gov/ct2/show/NCT02193074. Accessed 23 Mar 2022.
- 36.ClinicalTrials.gov. A study for participants with spinal muscular atrophy (SMA) who previously participated in nusinersen (ISIS 396443) investigational studies (SHINE). Identifier: NCT02594124. https://clinicaltrials.gov/ct2/show/NCT02594124. Accessed 23 Mar 2022.
- 37.ClinicalTrials.gov. Gene replacement therapy clinical trial for participants with spinal muscular atrophy Type 1 (STR1VE). Identifier: NCT03306277. https://clinicaltrials.gov/ct2/show/NCT03306277. Accessed 23 Mar 2022.
- 38.ClinicalTrials.gov. Gene transfer clinical trial for spinal muscular atrophy Type 1. Identifier: NCT02122952. https://clinicaltrials.gov/ct2/show/NCT02122952. Accessed 23 Mar 2022.
- 39.ClinicalTrials.gov. Investigate safety, tolerability, PK, PD and efficacy of risdiplam (RO7034067) in infants with Type 1 spinal muscular atrophy (FIREFISH). Identifier: NCT02913482. https://clinicaltrials.gov/ct2/show/NCT02913482?id=NCT02913482&draw=2&rank=1&load=cart. Accessed 23 Mar 2022.
- 40.ClinicalTrials.gov. A study to assess the efficacy and safety of nusinersen (ISIS 396443) in participants with later-onset spinal muscular atrophy (SMA) (CHERISH). Identifier: NCT02292537. https://clinicaltrials.gov/ct2/show/NCT02292537. Accessed 23 Mar 2022.
- 41.ClinicalTrials.gov. A study to investigate the safety, tolerability, pharmacokinetics, pharmacodynamics and efficacy of risdiplam (RO7034067) in Type 2 and 3 spinal muscular atrophy (SMA) participants (SUNFISH). Identifier: NCT02908685. https://clinicaltrials.gov/ct2/show/NCT02908685. Accessed 23 Mar 2022.
- 42.Mercuri E, Deconinck N, Mazzone ES, et al. Safety and efficacy of once-daily risdiplam in type 2 and non-ambulant type 3 spinal muscular atrophy (SUNFISH part 2): a phase 3, double-blind, randomised, placebo-controlled trial. Lancet Neurol. 2022;21(1):42–52. doi: 10.1016/S1474-4422(21)00367-7. [DOI] [PubMed] [Google Scholar]
- 43.Haataja L, Mercuri E, Regev R, et al. Optimality score for the neurologic examination of the infant at 12 and 18 months of age. J Pediatr. 1999;135(2 Pt 1):153–161. doi: 10.1016/S0022-3476(99)70016-8. [DOI] [PubMed] [Google Scholar]
- 44.Bishop KM, Montes J, Finkel RS. Motor milestone assessment of infants with spinal muscular atrophy using the Hammersmith infant neurological exam-part 2: experience from a nusinersen clinical study. Muscle Nerve. 2018;57(1):142–146. doi: 10.1002/mus.25705. [DOI] [PubMed] [Google Scholar]
- 45.Glanzman AM, Mazzone E, Main M, et al. The Children's Hospital of Philadelphia infant test of neuromuscular disorders (CHOP INTEND): test development and reliability. Neuromuscul Disord. 2010;20(3):155–161. doi: 10.1016/j.nmd.2009.11.014. [DOI] [PMC free article] [PubMed] [Google Scholar]
- 46.Armstrong KH, Agazzi HC. Chapter 2—The Bayley-III cognitive scale. In: Weiss LG, Oakland T, Aylward GP, editors. Bayley-III clinical use and interpretation. San Diego: Academic; 2010. pp. 29–45. [Google Scholar]
- 47.O'Hagen JM, Glanzman AM, McDermott MP, et al. An expanded version of the Hammersmith Functional Motor Scale for SMA II and III patients. Neuromuscul Disord. 2007;17(9–10):693–697. doi: 10.1016/j.nmd.2007.05.009. [DOI] [PubMed] [Google Scholar]
- 48.Swoboda KJ, Scott CB, Crawford TO, et al. SMA CARNI-VAL trial part I: double-blind, randomized, placebo-controlled trial of L-carnitine and valproic acid in spinal muscular atrophy. PLoS ONE. 2010;5(8):e12140. doi: 10.1371/journal.pone.0012140. [DOI] [PMC free article] [PubMed] [Google Scholar]
- 49.Mazzone ES, Mayhew A, Montes J, et al. Revised upper limb module for spinal muscular atrophy: development of a new module. Muscle Nerve. 2017;55(6):869–874. doi: 10.1002/mus.25430. [DOI] [PubMed] [Google Scholar]
- 50.Mercuri E, Darras BT, Chiriboga CA, et al. Nusinersen versus sham control in later-onset spinal muscular atrophy. N Engl J Med. 2018;378(7):625–635. doi: 10.1056/NEJMoa1710504. [DOI] [PubMed] [Google Scholar]
Associated Data
This section collects any data citations, data availability statements, or supplementary materials included in this article.
Supplementary Materials
Data Availability Statement
Data sharing not applicable to this article as no data sets were generated or analyzed during the current study.