Abstract
PET imaging studies of AD patients show progressive increases of fibrillar Aβ- amyloid. Because current PET ligands underestimate non-fibrillar forms, we assayed soluble Aβ in AD and controls. To identify mechanisms responsible for soluble Aβ in AD brains, we examined lipid rafts (LR), where APP is enzymatically processed. Frontal cortex was compared with cerebellum, which has minimal AD pathology. Compared with cognitively normal controls (Braak 0–1), elevations of soluble Aβ40 and Aβ42 were similar for intermediate and later stage AD (Braak 2–3 and 4–6). Clinical grade AD had greater increase of soluble Aβ40 than Aβ42 relative to CTL. LR raft yield per gram AD frontal cortex was 20% below controls, while cerebellar LR did not differ by Braak score. The extensive overlap of soluble Aβ levels in controls with AD contrasts with the PET findings on fibrillar Aβ. These findings further support fibrillar Aβ as a biomarker for AD treatments and show the need for more detailed postmortem analysis of diverse soluble and insoluble Aβ aggregates in relation to PET.
Narrative.
Amyloidogenic peptides are strongly associated with AD neurodegeneration, but little is known about the relationships of these peptides to ‘normal brain aging’, which begins decades before signs of cognitive decline and dementia. Two hypotheses are proposed: 1) Because age-matched controls are shown here to have high levels of soluble Aβ, we hypothesize that non-fibrillar β-amyloid peptides increase decades before AD in the cognitively normal. Analysis of lipid rafts, the site of amyloid precursor protein (APP) processing [1], shows decreased β-amyloid peptide formation in AD frontal cortex relative to age-matched controls. 2) Because the β-amyloid peptide transporter low density lipoprotein receptor-related protein 1 (LRP1) is also decreased in AD [2,3], we further hypothesize that impaired β-amyloid peptide clearance, rather than increased synthesis is a key to the elevations of toxic amyloids in both normal aging and clinical dementia.
In 1854 Rudolph Virchow observed macroscopic structures in brain tissue resembling starch and named them amyloid derived from the Latin word amylum and Greek amylon [4]. These structures were soon resolved by Friedreich and Kekulé as protein rather than starch [5]. The six recent decades of research on brain amyloids definitively show fibrillary β-amyloid protein in senile plaques. The β-amyloid fibrils were then characterized as aggregates of so-named β-amyloid peptides containing 38–43 amino acids, primarily Aβ40 and Aβ42 [6]. Neurofibrillary tangles (NFT) from hyperphosphorylated tau aggregates also increase at later ages in association with cognitive decline [7].
Causal links of cognitive decline to fibrillar β-amyloid are elusive because immunotherapy to remove fibrillar β-amyloid did not consistently improve cognitive deficits in multiple clinical trials [8–10]. Moreover, only one-third of terminal cognitive decline was explained by postmortem levels of fibrillar β-amyloid and tau [11,12]. Both longitudinal studies documented a wide range of multiple pathologic lesions in older brains in addition to β-amyloid plaques and NFT, together with proteinopathies of aggregated a-synuclein (Lewy bodies) and TDP-43 protein, as well as cerebral vascular amyloid pathology and microbleeds. Clinical dementia at later ages indicative of AD rarely occurs with only amyloid plaques and NFT. Unresolved issues include how neuropathological heterogeneity changes with older ages and by ethnicity. The aging brain is a jungle.
We propose that a life course approach will help resolve relationships of β-amyloid peptides to cognitive declines and other brain aging changes. For starters, consider that levels of β-amyloid peptides Aβ40 and Aβ42 increase exponentially during normal aging in frontal cortex [13] (Fig. 1D,E). These individuals lacked AD-grade pathology or history of dementia. After age 60, Aβ42 was at least ten-fold higher than levels before 30 years. This extraction method and other [14] did not distinguish solubilized and aggregated β-amyloid peptides, which we further resolve. Age increases of β-amyloid peptides is also found in lab rodents without AD transgenes (Fig. 1A) [15,16], monkey (Fig. 1C), and domestic dogs [17].This commonality suggests that non-pathological increases of β-amyloid peptides is a broadly shared process of mammalian brain aging.
Figure 1:
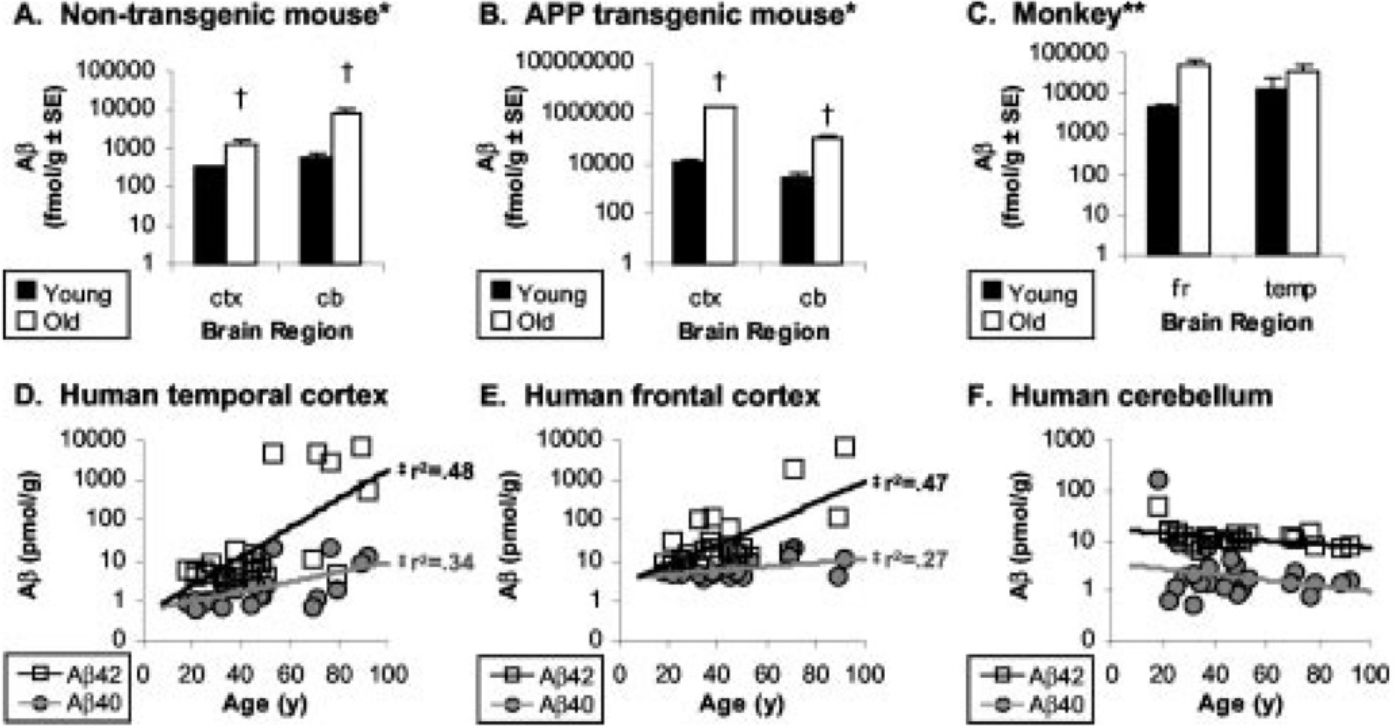
β-Amyloid peptides in cerebral cortex increase with age in mice (A,B), monkey (C) and cognitively normal humans (D,E), but not cerebellum (F). Reprinted from Fukumoto et al. 2004 [13]. No human brain had NFTs; 3 brains had “diffuse cortical amyloid deposits without cortical NFT”. The Aβ was extracted by formic acid from centrifuged pellets of an isotonic homogenate in Tris buffer with 0.1% Triton X-100; ELISA. The Tris-soluble fraction was not analyzed.
Concurrent with increasing β-amyloid peptides after age 30 years are slow declines in cognition processing and synapse density from young adulthood [18]. Longitudinal studies concur that cognitive skills entailing fluid reasoning or the ability to solve novel problems reach a peak by the mid 30s, followed by slow declines [19–21]. Underlying mechanism may be the progressively slowed processing of information [22,23] and the progressive loss of synapses in cerebral cortex [24] and basal ganglia [25]. Similar loss of monoamine receptors was shown by us for monoamine receptors 4 decades ago [26]. The loss of synapses in middle aged humans [27] and rodents are best attributed to atrophy of neuronal cell body and synaptic arbor, rather than death of neurons, as shown for cerebral cortex of cognitively healthy brains up to age 90 [28]. The blood-brain barrier also progressively weakens during middle-age, without amyloid or tau pathology, as observed by in vivo brain imaging [29,30]. We hypothesize that the accelerating risk of dementias after age 60 years arises at some critical threshold of elevated β-amyloid peptides during ‘normal aging’ when aging goes from ‘bad to worse’ with emergence of multifarious brain pathologies.
Consolidated Results:
Because of these gaps in consistent assay methods for soluble β-amyloid peptides, we measured soluble and insoluble brain β-amyloid peptides by a protocol similar to that for the above data on normal aging (Fig. 2A). The initial isotonic homogenate yielded data not reported for normal aging in comparison with clinical grade dementia. The level of neurodegeneration was categorized by Braak scores 0 to 6 for NFT density [31].
Figure 2:
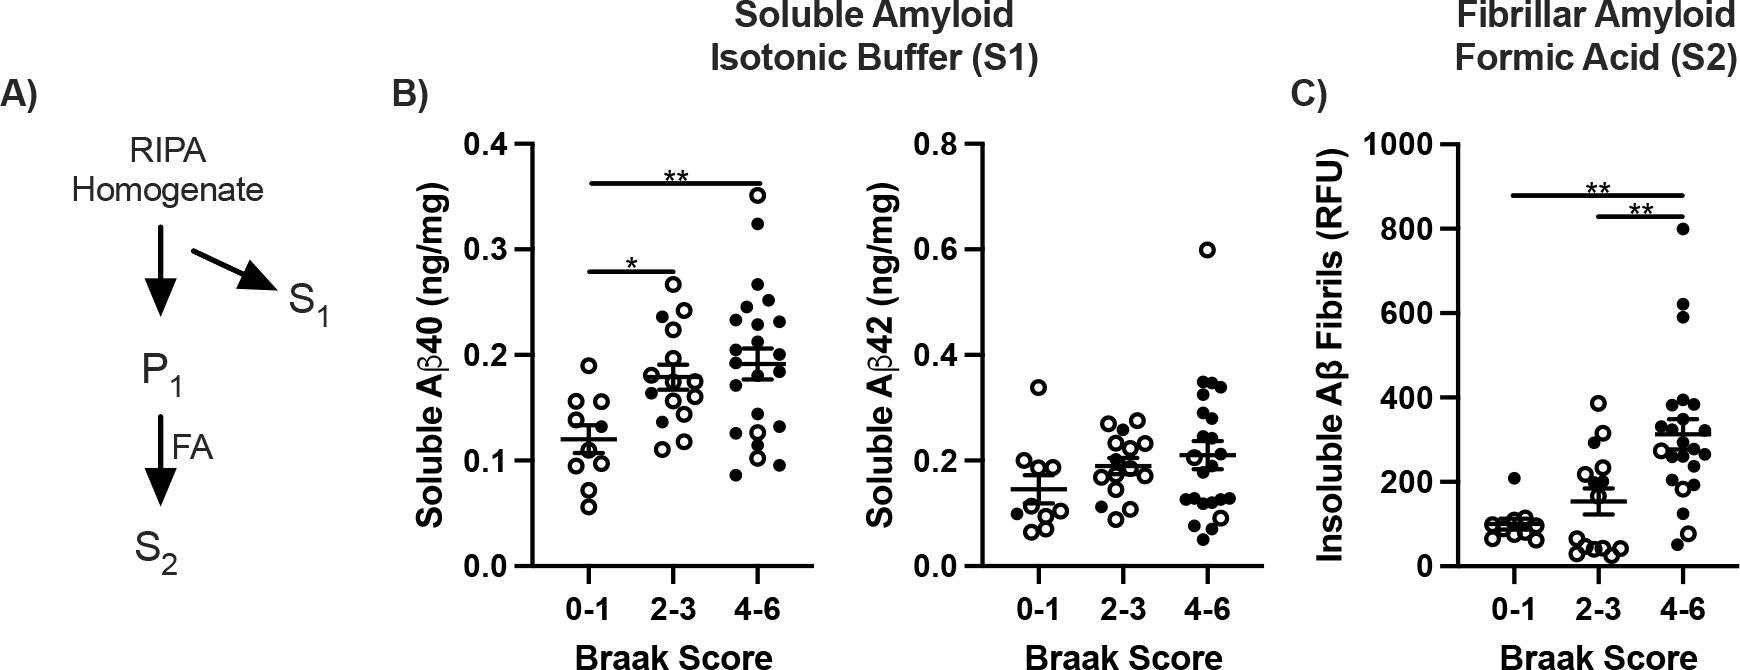
β-Amyloid in frontal cortex by Braak. A) Diagram of amyloid extraction and fractionation. S1, RIPA soluble amyloid; P1, insoluble pellet. S2, formic acid solubilized (FA). B) Values of Aβ40 and Aβ42 ng/mg per brain tissue in S1 calculated from internal standard curves and B) Fibrils as relative fluorescent units. One way ANOVA; *p<0.05, **p<0.01.
Soluble Aβ40 increased progressively by Braak score in frontal cortex; Aβ42 increased less (Fig. 2B). The 5-fold range of soluble β-amyloid peptides in cognitively normal elderly brain overlapped with the clinically demented cases. The wide range of Aβ40 and-42 peptides within all Braak scores was further validated by dot blot quantification with ‘internal standards’. As expected, fibrillar β-amyloid, extracted by formic acid (Fig. 2A), increased progressively with Braak score by 3-fold (Fig. 2C).
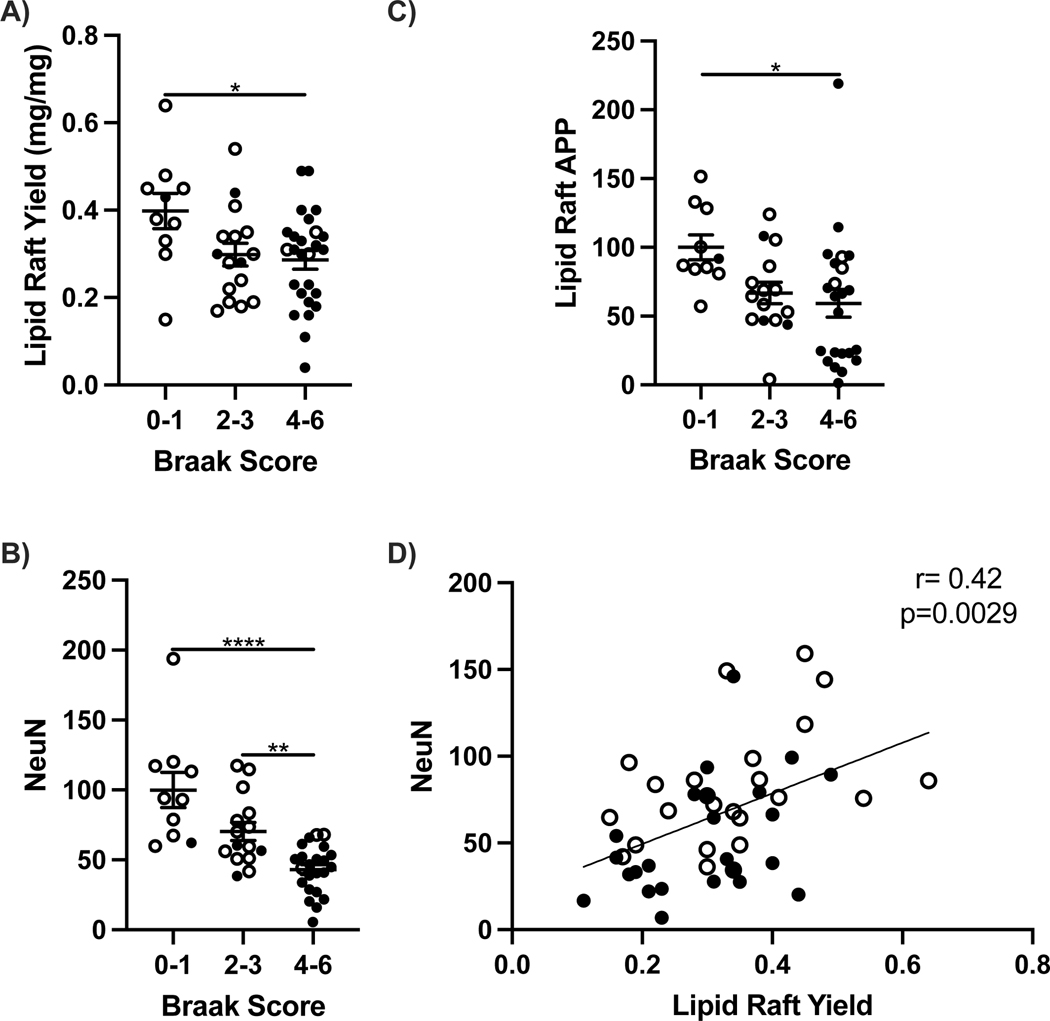
Possible causes of the elevated soluble peptides could include increased production and or decreased clearance mechanisms. β-Amyloid peptide production from the amyloid precursor protein APP was examined in lipid rafts (LR), a subcellular fraction containing the secretase enzymes BACE1 and PSEN 1 that cleave APP. Yields of LR wet weight from frontal cortex decreased at later stages of AD with higher Braak scores (Fig. 3A). The decreased yield was in proportion to neuronal loss on frontal cortex, assessed by the neuron marker NeuN (Fig. 3D). APP levels were 25% lower in clinical grade AD with Braak stages 4–6 (Fig. 3C). The cerebellum showed nonsignificant differences between AD and nondemented controls for soluble and fibrillar β-amyloid peptides, see below, consistent with this region’s minimal neurodegeneration [32] and was also relatively unaffected with aging in healthy brains (Fig. 1F).
Figure 3:
Lipid raft (LR) yield, amyloid precursor protein (APP) and NeuN by Braak score in frontal cortex and cerebellum of 65+ year old cognitively normal (open circles) and demented (closed circles). A) LR yield per mg tissue, B) APP, C) NeuN and D) coplot of NeuN and LR yield. One way ANOVA; *p<0.05, **p<0.01, ****p<0.0001. Spearman correlation; **p<0.05.
The clearance of Aβ peptides was evaluated with proteins that bind to Aβ and target it for degradation [2]. In AD frontal cortex, LRP1 decreased by 40% in correlation with ApoE levels (Fig. 4). Soluble Aβ40 varies inversely with LR yield, LRP1, and NeuN (Fig. 5).
Figure 4:

β-Amyloid clearance proteins in lipid rafts. Lipid raft A) LRP1, B) ApoE, and C) coplot of LRP1 and ApoE from frontal cortex. One way ANOVA; *p<0.05. Spearman correlation; *p<0.05.
Figure 5:
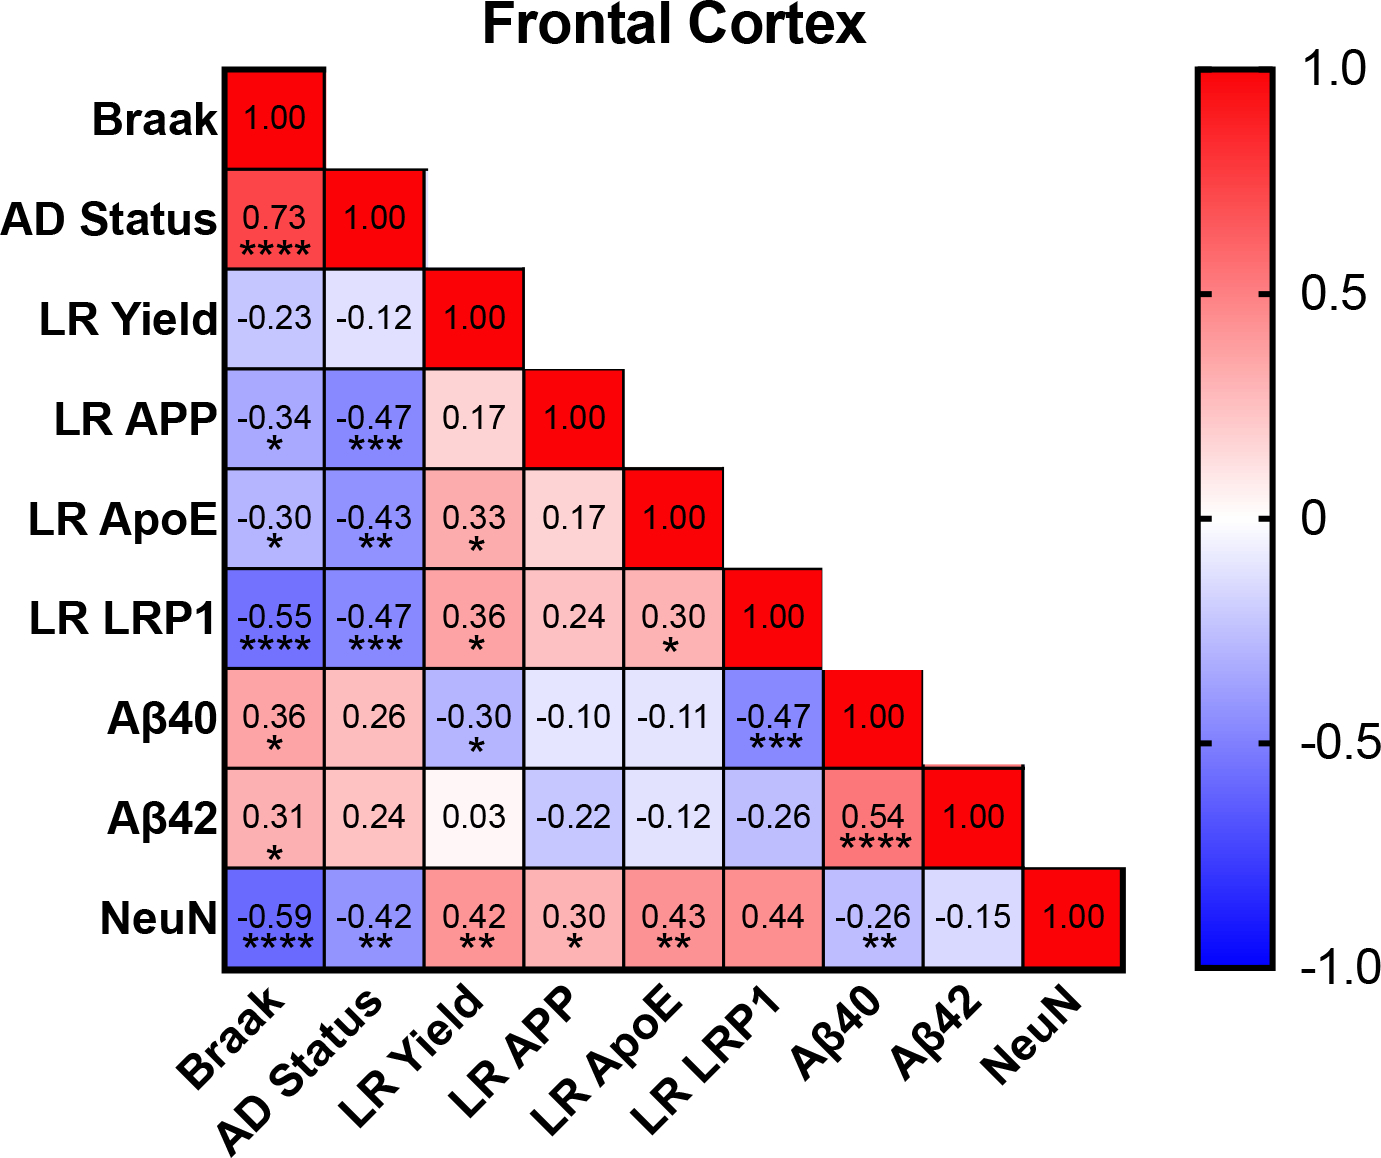
Correlation matrices examining relationships between soluble amyloid, LR, and amyloid clearance for frontal cortex. Spearman correlation; *p<0.05, **p<0.01, ***p<0.001, ****p<0.0001.
Discussion:
These findings document the wide range of soluble brain β-amyloid peptides Aβ40 and-42 in frontal cortex of nondemented control brain and their extensive overlap with levels observed in AD. A similarly wide range of concentrations were shown for formic acid soluble β-amyloid peptides in brains that had minimal histochemical amyloid by standard postmortem criteria (Fig. 1D,E). This is the first quantification of postmortem soluble Aβ peptides by Braak scores using an assay based on standard curves of Aβ peptides added to brain extracts, which showed linearity over a 100-fold range. This is also the first comparison of β-amyloid peptides with parallel extracts of bulk brain tissue in relation to lipid rafts.
We do not know the level of aggregation in β-amyloid peptides extracted by formic acid in these human brains, or in wild-type mice, across a wide age range (Fig 1A). Most soluble Aβ peptides are aggregated as oligomers in postmortem extracts [33] and in cerebrospinal fluid from living patients [34]. There is minimal neuron loss in non-demented cerebral cortex of ‘normal aging’ mice and humans, despite elevated Aβ. This fact is not incompatible with the decades of research showing the neurotoxicity of Aβ oligomers [35] because in vivo oligomers are complexed with ApoE, ApoJ (CLU), and other proteins [33,36,37]. The term ‘amyloid’ thus needs to be carefully defined.
Is soluble Aβ elevated in AD above normal aging because of increased synthesis, or clearance from the brain? Lipid rafts, the subcellular site of APP cleavage, are decreased in proportion to neuron loss in frontal cortex. While the enzymes of APP cleavage are unchanged in AD, APP levels are further decreased. Secretase enzymes of APP processing and APP levels did not statistically correlate with soluble Aβ40 and −42 in cerebral cortex and cerebellum. Neurons import Aβ through LRP1 for subsequent lysosomal degradation [38]. The large decrease of LRP1 suggests that impaired clearance rather than increased synthesis is a cause of increased soluble Aβ in AD. Multiple clearance mechanisms may differ by cell type and Braak stage [3].
Future studies could compare immunoassays with LC-MS for other β-amyloid peptides, and for correspondence with PET-imaging of amyloids. The aggregation state of Aβ and its complex with other proteins [33] may provide insights into the mechanisms underlying slow loss of synapses and cognitive processing during normal aging. Studies of APP processing in aging wild-type mice may be informative together modulators of APP processing [39]. Further analysis should include middle-aged brains and CSF for the roles of synthesis and clearance in Aβ elevations that precede AD pathology by decades. Amyloid futures may be sought in earlier development, when gene expression is established for β-amyloid peptide production and clearance.
Detailed Methods and Results
Methods:
Tissue.
Case-matched (Ctx;52, Cbl;58) frozen samples ages 85 ± 1; 66–99 years from University of Southern California (N=38), University of California Irvine (N=13), and University of Washington (N=8); equal sex distribution; cognition by MMSE, 93 ± 55 months pre-mortem (range 1–1,220 months; median 36 months); PMI, 6.6 ± 0.5 hours (range 0–19 hours; median 5.8 hours). The brain tissue used in this project was provided by the University of Southern California Alzheimer’s Disease Research Center, the University of California Irvine Alzheimer’s Disease Research Center (UCI-ADRC) and the Institute for Memory Impairments and Neurological Disorders, and the University of Washington’s Alzheimer’s Disease Research Center. Further information is presented in Table 1. All human subjects provided informed consent. IRB protocol #UP-20-00014-EXEMPT.
Table 1:
Patient information for brain tissues by source.
| Age | Sex | AD Status | Braak | ApoE Allele | PMI (hours) | Frontal Cortex | Cerebellum | Race | MMSE | MMSE Interval (Months) | ADRC |
|---|---|---|---|---|---|---|---|---|---|---|---|
| 99 | Female | CTL | 0 | 3,3 | 9 | x | x | White | 28 | 23.4 | USC |
| 91 | Female | CTL | 0 | 3,3 | 8.75 | x | x | White | 20 | 84 | USC |
| 85 | Female | CTL | 0 | 3,3 | 7 | x | x | White | N/A | N/A | USC |
| 95 | Female | CTL | 1 | 3,3 | 3.25 | x | x | White | N/A | N/A | USC |
| 87 | Female | CTL | 2 | 3,3 | 10.75 | x | x | White | 29 | 1 | USC |
| 95 | Female | CTL | 2 | 3,3 | 2.92 | x | x | Hispanic | N/A | N/A | UCI |
| 86 | Female | CTL | 3 | 3,3 | 6.17 | x | x | White | 30 | 35.5 | UCI |
| 90 | Female | CTL | 3 | 3,3 | 2.2 | x | x | White | N/A | N/A | UCI |
| 89 | Female | CTL | 3 | 3,3 | 3.58 | x | N/A | White | 24 | 5.9 | UCI |
| 94 | Female | AD | 4 | 3,3 | 10.5 | x | x | Black | N/A | N/A | USC |
| 81 | Female | AD | 5 | 3,3 | 7.5 | x | x | Hispanic | N/A | N/A | USC |
| 89 | Female | AD | 5 | 3,3 | 1.5 | x | x | White | N/A | N/A | USC |
| 66 | Female | AD | 6 | 3,3 | 17 | x | x | White | N/A | N/A | USC |
| 70 | Female | CTL | 1 | 3,4 | 4.17 | N/A | x | White | 28 | 20.1 | UW |
| 86 | Female | CTL | 3 | 3,4 | 9.33 | N/A | x | White | 29 | 12.3 | UW |
| 97 | Female | CTL | 3 | 3,4 | 0 | N/A | x | N/A | 26 | 6.6 | UW |
| 91 | Female | CTL | 3 | 3,4 | 11.2 | x | x | N/A | 23 | 10.1 | UW |
| 85 | Female | CTL | 3 | 3,4 | 4.2 | N/A | x | White | 29 | 37.9 | UW |
| 89 | Female | CTL | 3 | 3,4 | 3.5 | N/A | x | White | 27 | 28.7 | UW |
| 74 | Female | CTL | 3 | 3,4 | 4.5 | N/A | x | White | 30 | 44.3 | UW |
| 91 | Female | CTL | 3 | 3,4 | 3.33 | x | x | White | 27 | 42.5 | UCI |
| 87 | Female | CTL | 3 | 3,4 | 4.57 | x | x | White | 29 | 85.6 | UCI |
| 93 | Female | CTL | 5 | 3,4 | 4.15 | x | x | White | 30 | 81.6 | UCI |
| 81 | Female | AD | 5 | 3,4 | 5.5 | x | x | White | N/A | N/A | USC |
| 84 | Female | AD | 5 | 3,4 | 6 | x | x | White | N/A | N/A | USC |
| 80 | Female | AD | 5 | 3,4 | 19 | x | x | White | N/A | N/A | USC |
| 96 | Female | AD | 6 | 3,4 | 9 | N/A | x | Black | N/A | N/A | USC |
| 77 | Female | AD | 6 | 3,4 | 8.25 | x | x | White | N/A | N/A | USC |
| 87 | Female | AD | 6 | 3,4 | 4.5 | N/A | x | N/A | N/A | N/A | USC |
| 78 | Female | AD | 4 | 4,4 | 15.5 | x | x | White | N/A | N/A | USC |
| 81 | Female | AD | 5 | 4,4 | 4 | x | x | White | N/A | N/A | USC |
| 80 | Female | AD | 5 | 4,4 | 3.75 | x | x | White | N/A | N/A | USC |
| 76 | Female | AD | 5 | 4,4 | 5.25 | x | x | White | N/A | N/A | USC |
| 82 | Male | CTL | 0 | 3,3 | 9 | x | x | White | 28 | N/A | USC |
| 93 | Male | CTL | 0 | 3,3 | 12 | x | x | White | 30 | 1229.2 | USC |
| 93 | Male | CTL | 0 | 3,3 | 3.75 | x | x | White | N/A | N/A | USC |
| 76 | Male | CTL | 0 | 3,3 | 11.25 | x | x | Hispanic | N/A | N/A | USC |
| 86 | Male | CTL | 2 | 3,3 | 4.42 | x | x | White | 25 | 48.4 | UCI |
| 83 | Male | CTL | 2 | 3,3 | 3.18 | x | x | White | N/A | N/A | UCI |
| 86 | Male | CTL | 3 | 3,3 | 2.92 | x | x | White | 20 | 37 | UCI |
| 80 | Male | CTL | 3 | 3,3 | 4.05 | x | x | White | 26 | 95.1 | UCI |
| 97 | Male | AD | 3 | 3,3 | 5.25 | x | x | Hispanic | N/A | N/A | USC |
| 87 | Male | AD | 4 | 3,3 | 4.75 | x | x | White | N/A | N/A | USC |
| 76 | Male | AD | 5 | 3,3 | 9.75 | x | x | Hispanic | N/A | N/A | USC |
| 88 | Male | AD | 5 | 3,3 | 6.75 | x | x | Hispanic | N/A | N/A | USC |
| 92 | Male | CTL | 0 | 3,4 | 5.25 | x | x | White | N/A | N/A | USC |
| 87 | Male | CTL | 1 | 3,4 | 4 | N/A | x | White | 25 | 8.9 | UW |
| 90 | Male | CTL | 3 | 3,4 | 5.8 | x | x | White | N/A | N/A | UCI |
| 97 | Male | CTL | 4 | 3,4 | 5.83 | x | x | White | 26 | 7 | UCI |
| 87 | Male | CTL | 4 | 3,4 | 6.28 | x | x | White | 22 | 101.5 | UCI |
| 77 | Male | AD | 2 | 3,4 | 6 | x | x | White | N/A | N/A | USC |
| 81 | Male | AD | 3 | 3,4 | 7.25 | x | x | Hispanic | N/A | N/A | USC |
| 85 | Male | AD | 5 | 3,4 | 7.25 | x | x | Hispanic | N/A | N/A | USC |
| 72 | Male | AD | 6 | 3,4 | 9 | x | x | White | N/A | N/A | USC |
| 75 | Male | AD | 0 | 4,4 | 9.5 | x | x | White | N/A | N/A | USC |
| 88 | Male | AD | 5 | 4,4 | 5 | x | x | White | N/A | N/A | USC |
| 92 | Male | AD | 5 | 4,4 | 8.25 | x | x | White | N/A | N/A | USC |
| 70 | Male | AD | 5 | 4,4 | 3.5 | x | x | White | N/A | N/A | USC |
| 81 | Male | AD | 5 | 4,4 | 6.54 | N/A | x | Asian | N/A | N/A | USC |
ADRC; Alzheimer’s Disease Research Center, MMSE; Mini-Mental State Exam, PMI; Postmortem Interval, UW; University of Washington, UCI; University of California Irvine, USC; University of Southern California. Column headings of ethnicity (‘Race’) are shown as recorded by source.
Amyloid Extraction.
Full thickness sections were homogenized by motorized pestle in RIPA buffer (30 mg tissue:150 μL; [40]) containing 1% Nonidet P-40, and inhibitors of proteases and phosphatases (Fig. 6A). RIPA did not contain SDS which alters Aβ aggregation [41]. Homogenates were centrifuged at 10,000g for 1 hour at 4°C, yielding supernate (S1) with soluble amyloids. The pellet (P1) was resuspended in 70% formic acid [42] and sonicated (80% power/10s). After nutating for 2 hours at room temperature, the resulting S2 was fully solubilized, without visible pellets after 10,000g for 1 hour. S2 was neutralized with 20 volumes of 1M Tris and concentrated for 4 hours with a vacuum concentrator (Labconco, Kansas City, MO).
Figure 6:
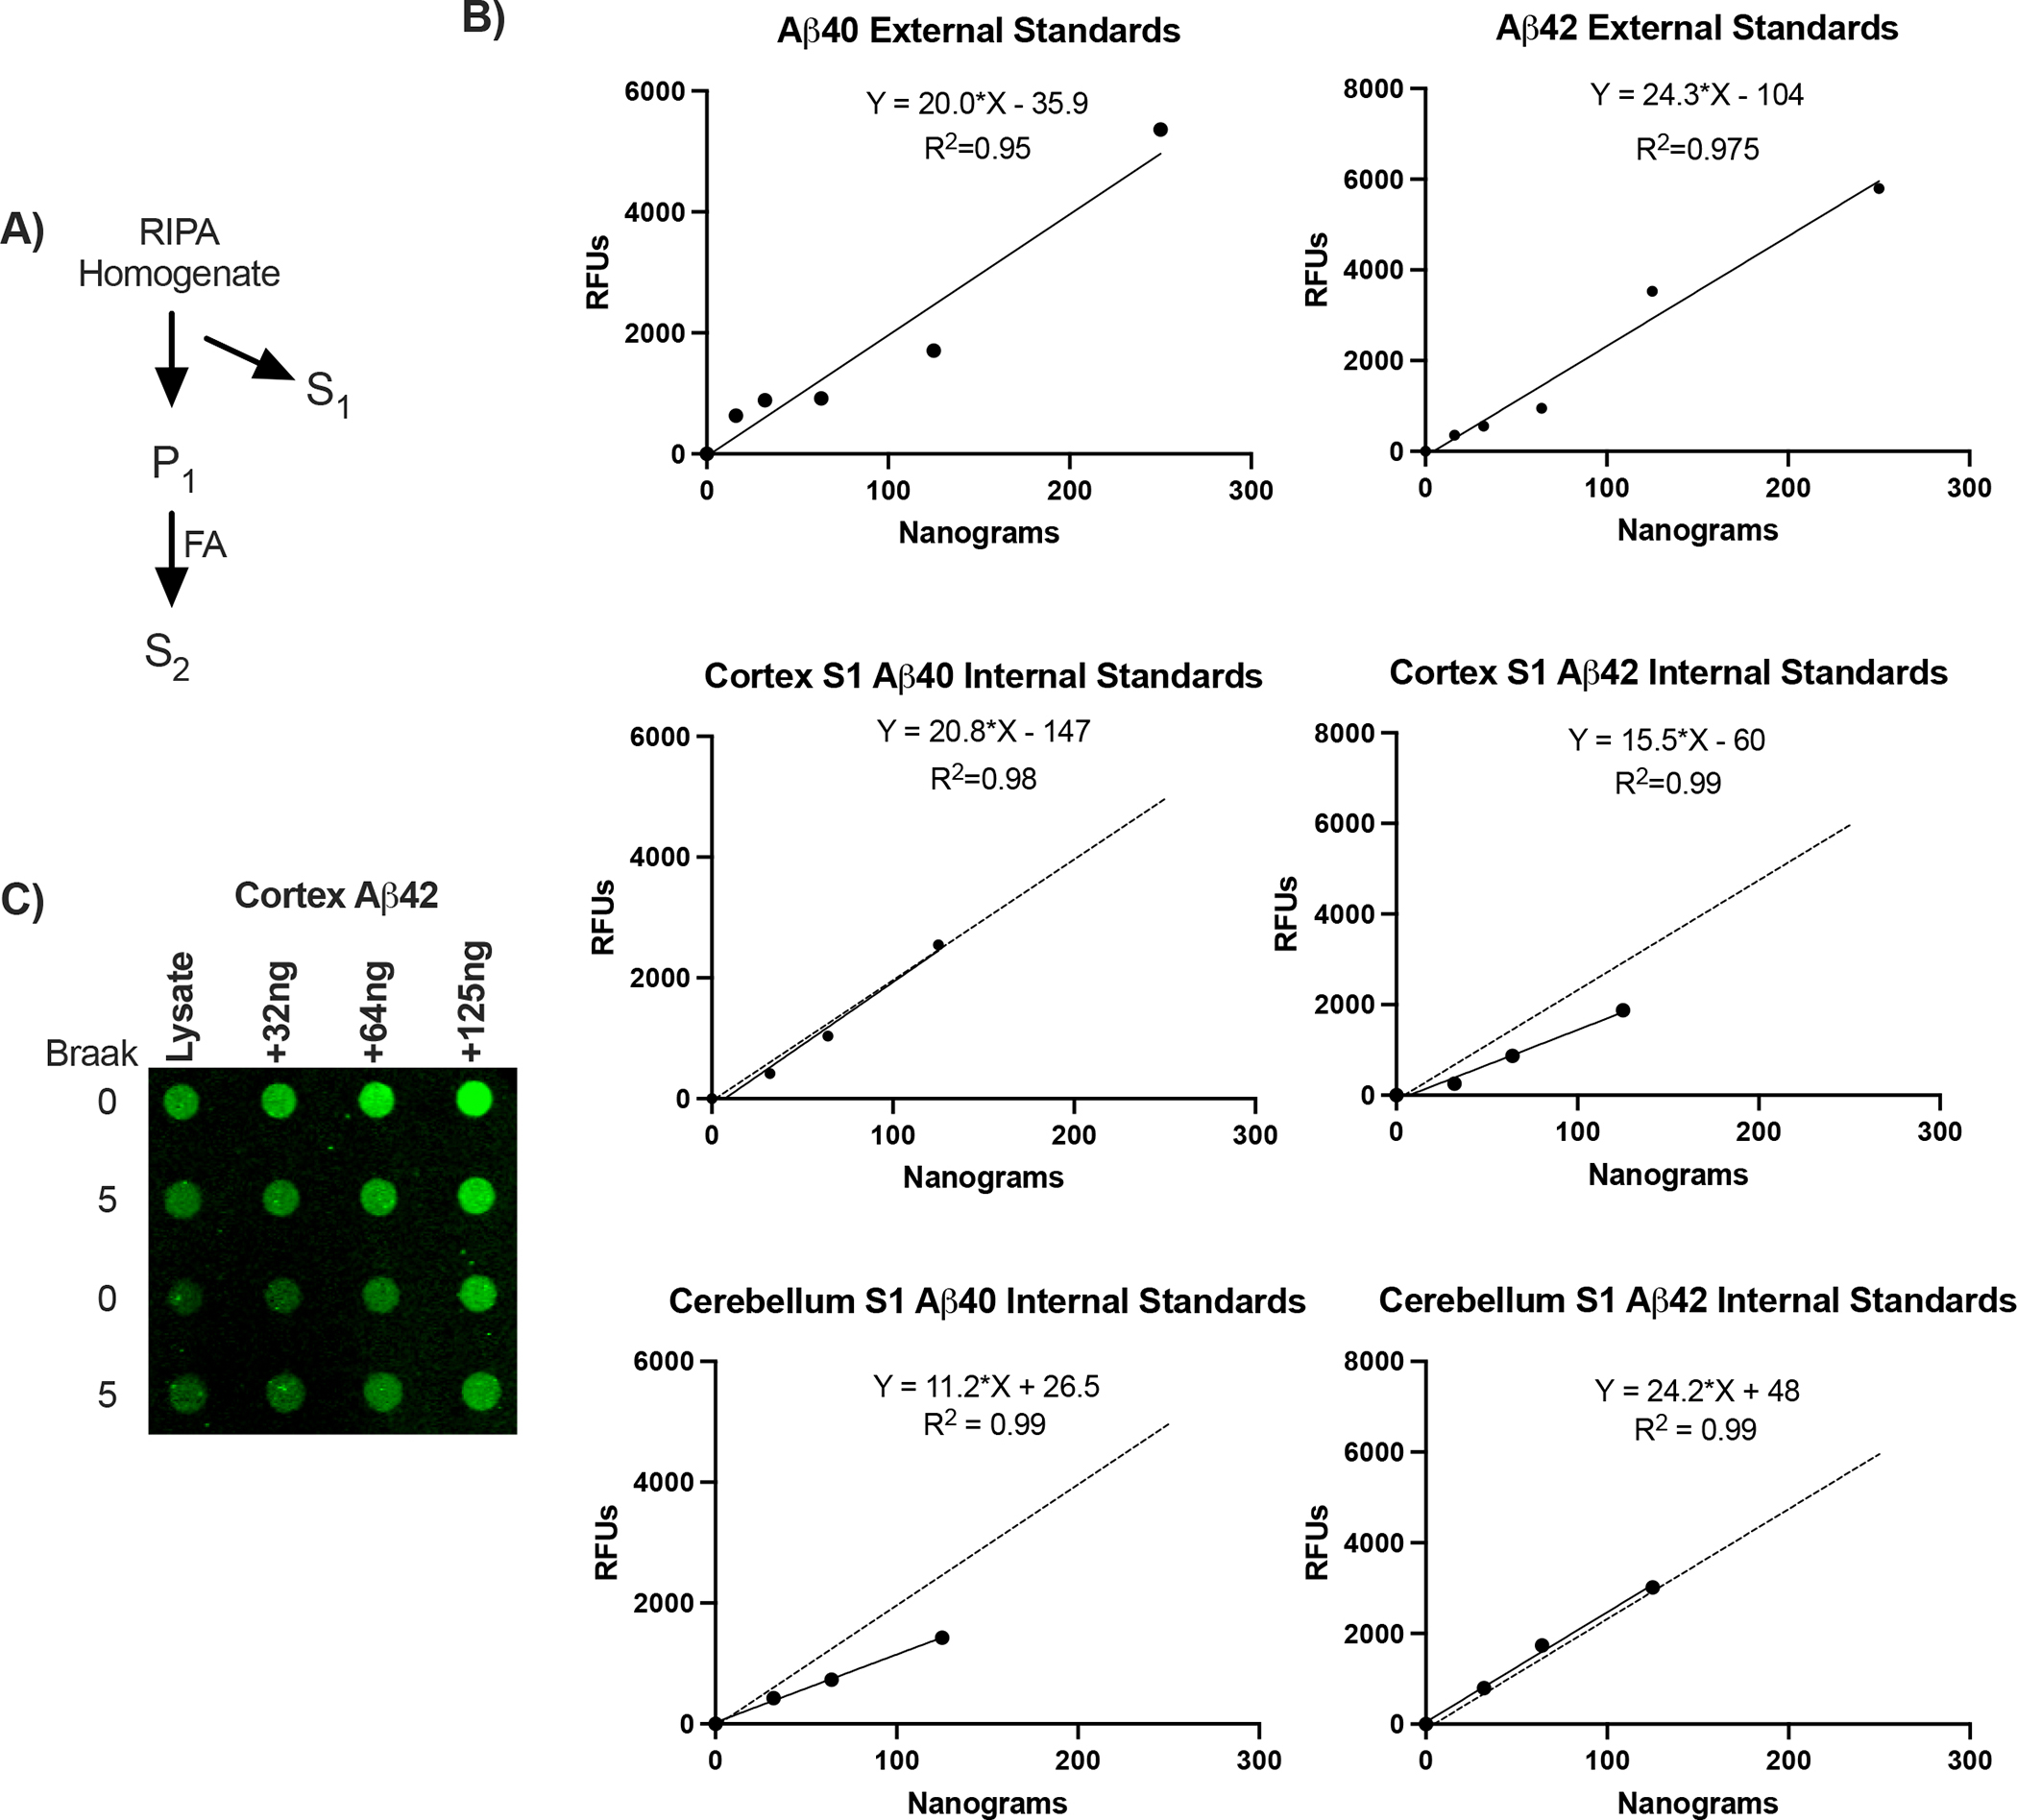
β-Amyloid peptide standard curves. A) Diagram of amyloid extraction and fractionation. S1, RIPA soluble amyloid; P1, insoluble pellet. S2, formic acid solubilized (FA). B) Standard curves for reagent Aβ40 and Aβ42 are linear for 100-fold range of relative fluorescence units (N, 6–8 per curve). C) Representative dot blot for internal standard curves of Aβ42 added to S1 lysates of cortex.
Lipid Raft Isolation.
Total LR was isolated from 40–60 mg of human frontal cortex and cerebellum by column chromatography (LR-039; Invent Biotechnologies, Plymouth, MN). LR yield was determined by weighing isolated rafts before resuspension in PBS+1% Triton and sonicated. Lipid rafts were assayed for cholesterol (Cell Biolabs, San Diego, CA) and used for western blotting. Lipid raft isolations were compared to Optiprep (Sigma Aldrich, St. Louis, MO) which were previously validated (Fig. 8C–F)[43].
Figure 8:
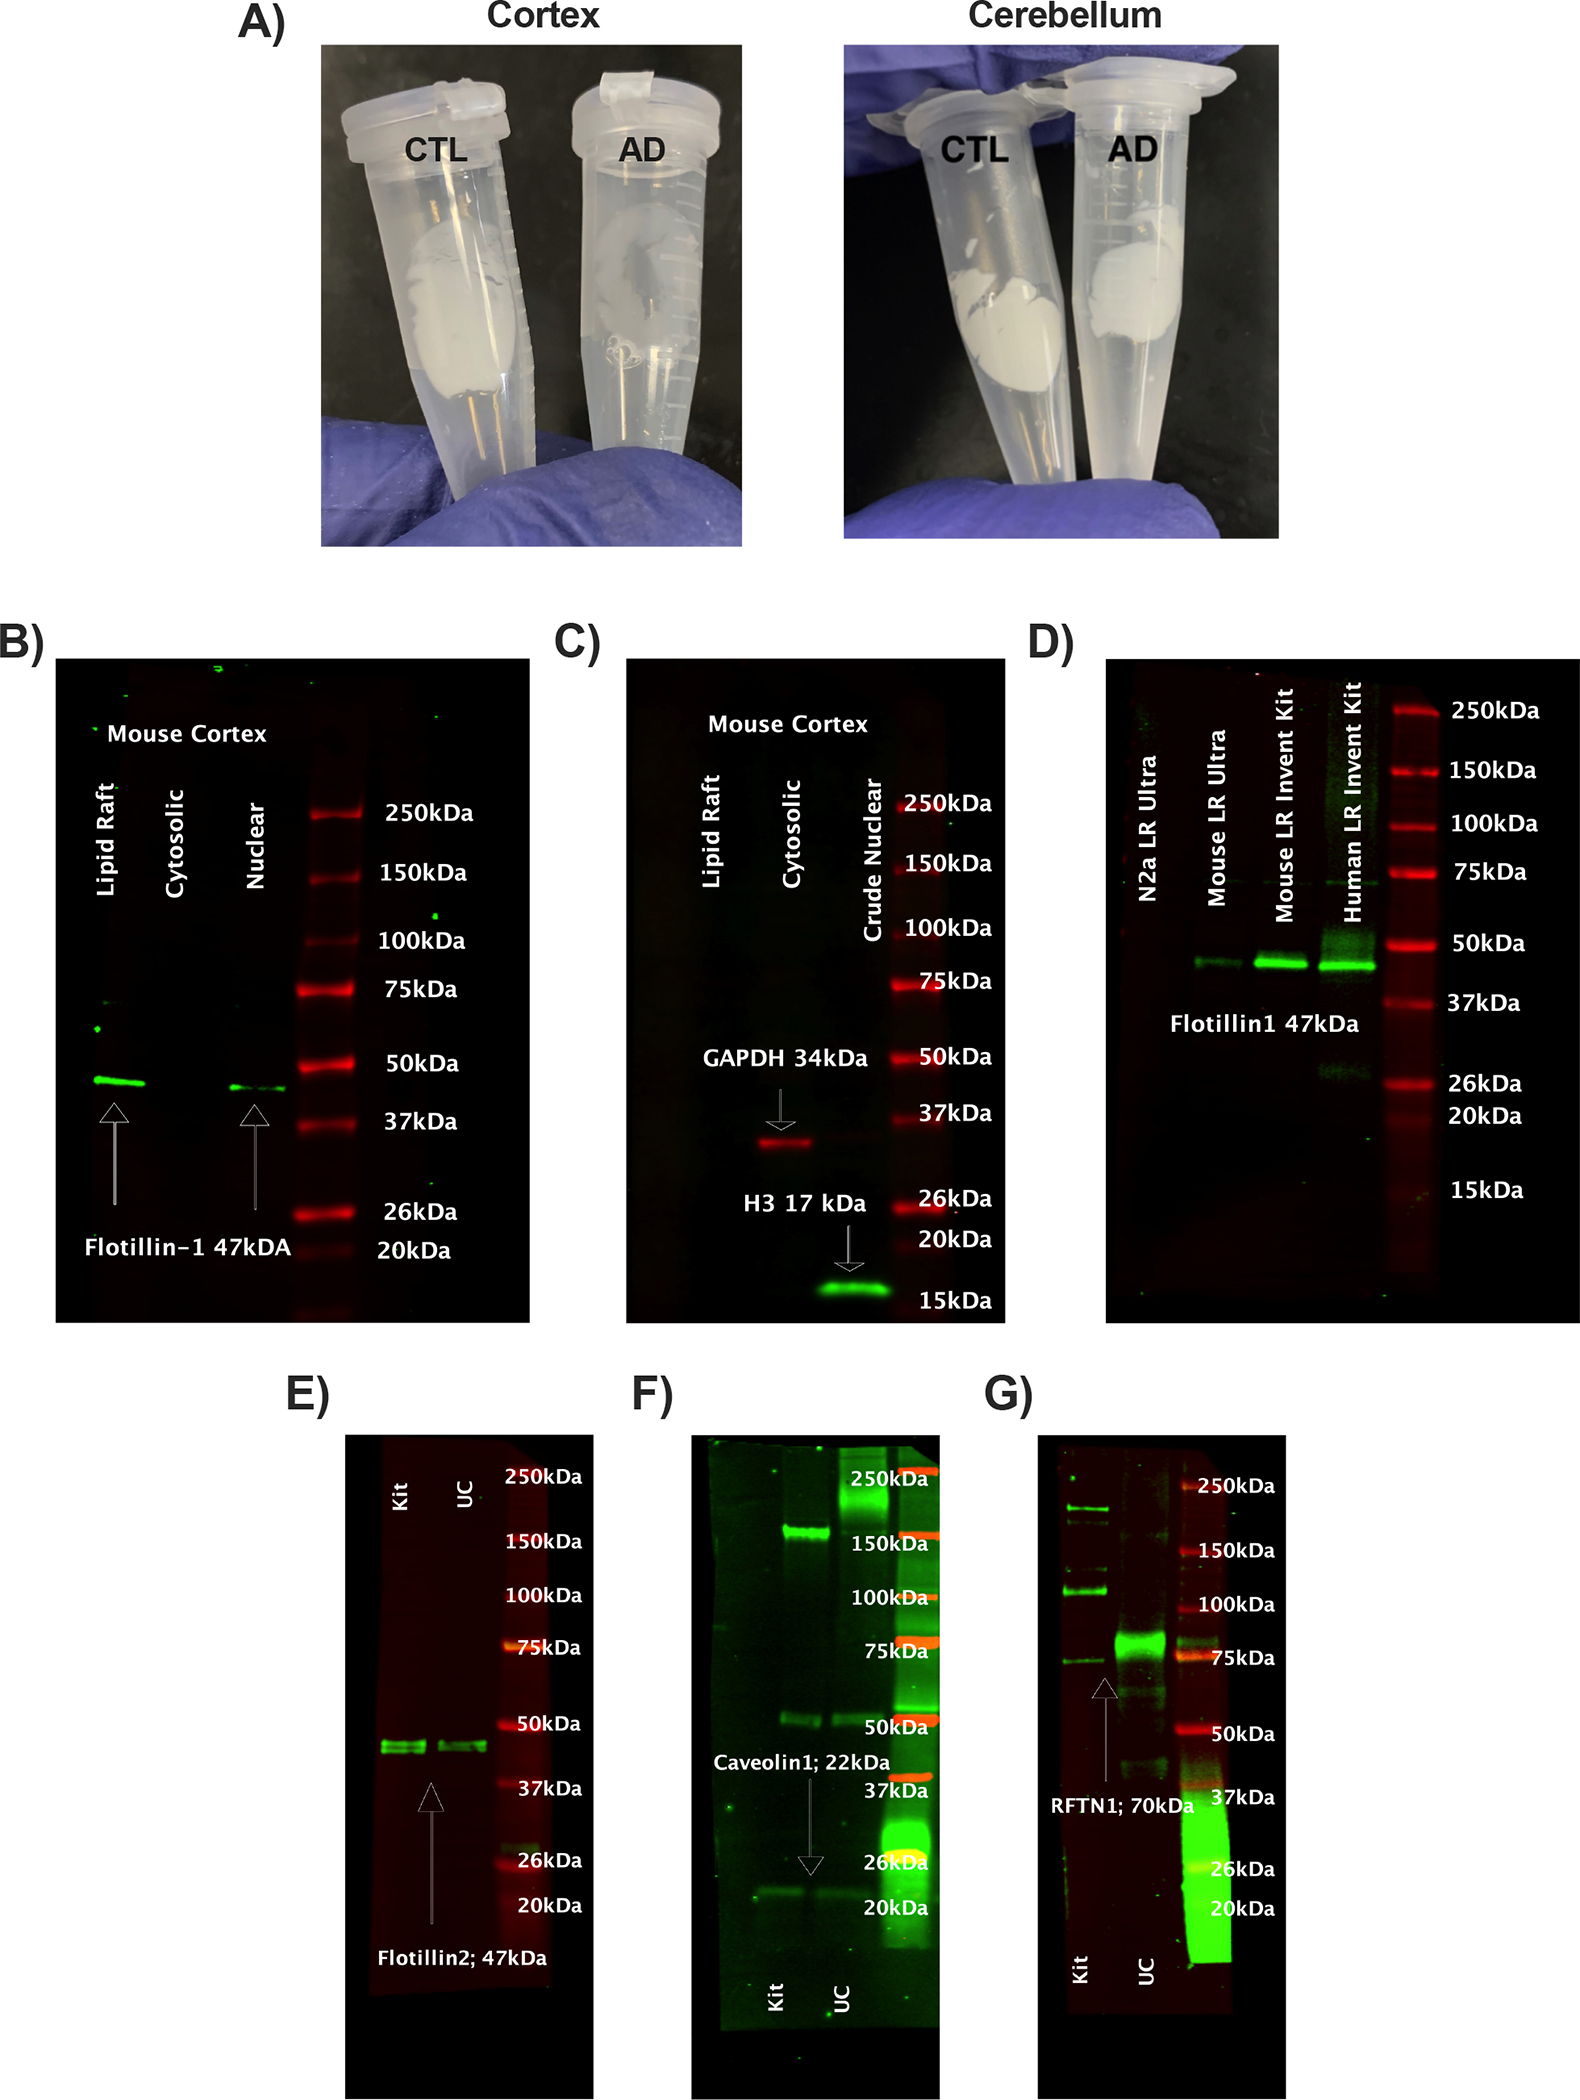
Validation of lipid rafts. A) Representative comparison of isolated human lipid rafts from cognitively normal and Alzheimer’s disease frontal cortex and cerebellum derived from Invent Biotechnologies’ kit (LR-039). Lipid raft, cytosolic, and nuclear fractions from the same extraction were probed for B) Flotillin1, a lipid raft marker, C) Histone 3 (nuclear), and GAPDH (cytosolic). D) LRs were compared with ultracentrifugation (UC) methods from mouse cortex and neuronal cells from and cortex for Flotillin1. Additional validations comparing kit and UC rafts for presence of D) Flotillin 2, E) Caveolin 1, and F) Lipid Raft Linker 1 (RFTN1).
Western Blots.
20μg of S1 or 5μg of lipid raft lysates were resolved on 4–15% gradient gels by Criterion Cell (Bio-Rad, Hercules, CA). Gels were transferred for 1 hour at 100V using a Criterion Blotter in an ice bath onto 0.45μm PVDF membranes. Total protein was stained (Revert 700, LI-COR Biosciences, Lincoln, NE), and imaged (LI-COR Odyssey 9120). Membranes were destained and incubated 1 hour with Intercept blocking buffer. Membranes were incubated with primary antibodies for 16 hours: GAPDH (Santa Cruz Biotechnology, Santa Cruz, CA), H3, BACE1, PSEN1, LRP1 (Cell Signaling Technology, Danvers, MA), APP, NeuN (Abcam, Waltham, MA), Flotillin1, Flotillin2, Caveolin1, RFTN1, ADAM10, PSD95, and β III tubulin (Proteintech, Rosemead, IL). Membranes were visualized using fluorescent-conjugated secondary antibodies for image analysis by ImageJ and corrected by total protein load.
Dot Blots.
25μg of S1 or S2 lysates were loaded onto a dot blot apparatus (Bio-Rad, Hercules, CA) and were filtered through 0.45μm PVDF for 2 hours by gravity filtration. Membranes were stained with Revert 700, imaged, and blocked for 1 hour with Intercept blocking buffer before incubation for 16 hours with primary antibodies. Antibodies against Aβ40, Aβ42 (Biolegend, San Diego, CA), and amyloid fibrils M78 (conformation specific for Aβ fibrils [44], gift of Dr. Charles Glabe, UCI) were used. Membranes were visualized using fluorescent-conjugated secondary antibodies for image analysis by ImageJ and corrected by total protein load. Aβ40 and Aβ42 were quantified with Aβ peptides (Biolegend, San Diego, CA). Standard curves were created by loading S1 lysates with known concentrations of Aβ peptides (Fig. 6B,C). Oligomeric Aβ was not assayed because of concerns for its stability during freezing and thawing of brain tissues, and lability to detergents used during extraction [45].
Statistics.
Groups were compared by one way ANOVA using Tukey’s HSD post hoc test for multiple comparisons. Significant differences for non-parametric data were calculated by Kruskal-Wallis with Dunn’s post hoc test. Correlation plots and matrices were constructed by Spearman correlation.
Results:
Aβ40 and Aβ42 in frontal cortex and cerebellum of elderly (≥ 65 y, N=48, equal sex) were analyzed by Braak scores: low neurodegeneration (0–1), medium (2–3), and high (4–6) (Fig. 6). Scores 0–3 mainly represent ‘normal’ patients without clinical grade cognitive deficits (open circles), with 8% exceptions (closed circles). Two fractions of tissue homogenates were analyzed for soluble Aβ by relative fluorescence and standard curve (Fig. 6B): S1, supernates of RIPA buffer homogenate with mild non-ionic detergent (S1/NP-40); S2, pellets of S1 solubilized by formic acid (S2/FA). Because of the wide range of Aβ42 levels within all Braak scores, we further validated dot blot quantification with ‘internal standards’ (Fig. 6B). The addition of Aβ peptides to S1 gave linear increments above sample fluorescence across a 100-fold range of values. Aβ fibrils are presented as S2 relative fluorescence units because no reagent standards are available for heterogeneous Aβ fibrils.
Aβ was assayed to determine if observations made by Fukumoto et al. 2004 [13] extended to soluble Aβ peptides which were not reported for their equivalent of fraction S1. Frontal cortex S1 Aβ40 increased progressively up to 50% across the Braak stages (P=0.02), while Aβ42 had a weak trend (P=0.4; Fig. 7): For the S2/FA, the Aβ40–42 peptides and fibrillary Aβ with Braak scores 4–6 were at least 100% above Braak stages 0–1. Cerebellum S1 Aβ40 and Aβ42 did not differ by Braak stage. The total extracted cortex Aβ40 and Aβ42 were 2-fold higher in AD brains (Braak 4–6) than controls (Braak 0–1) (Fig. 7A).
Figure 7:
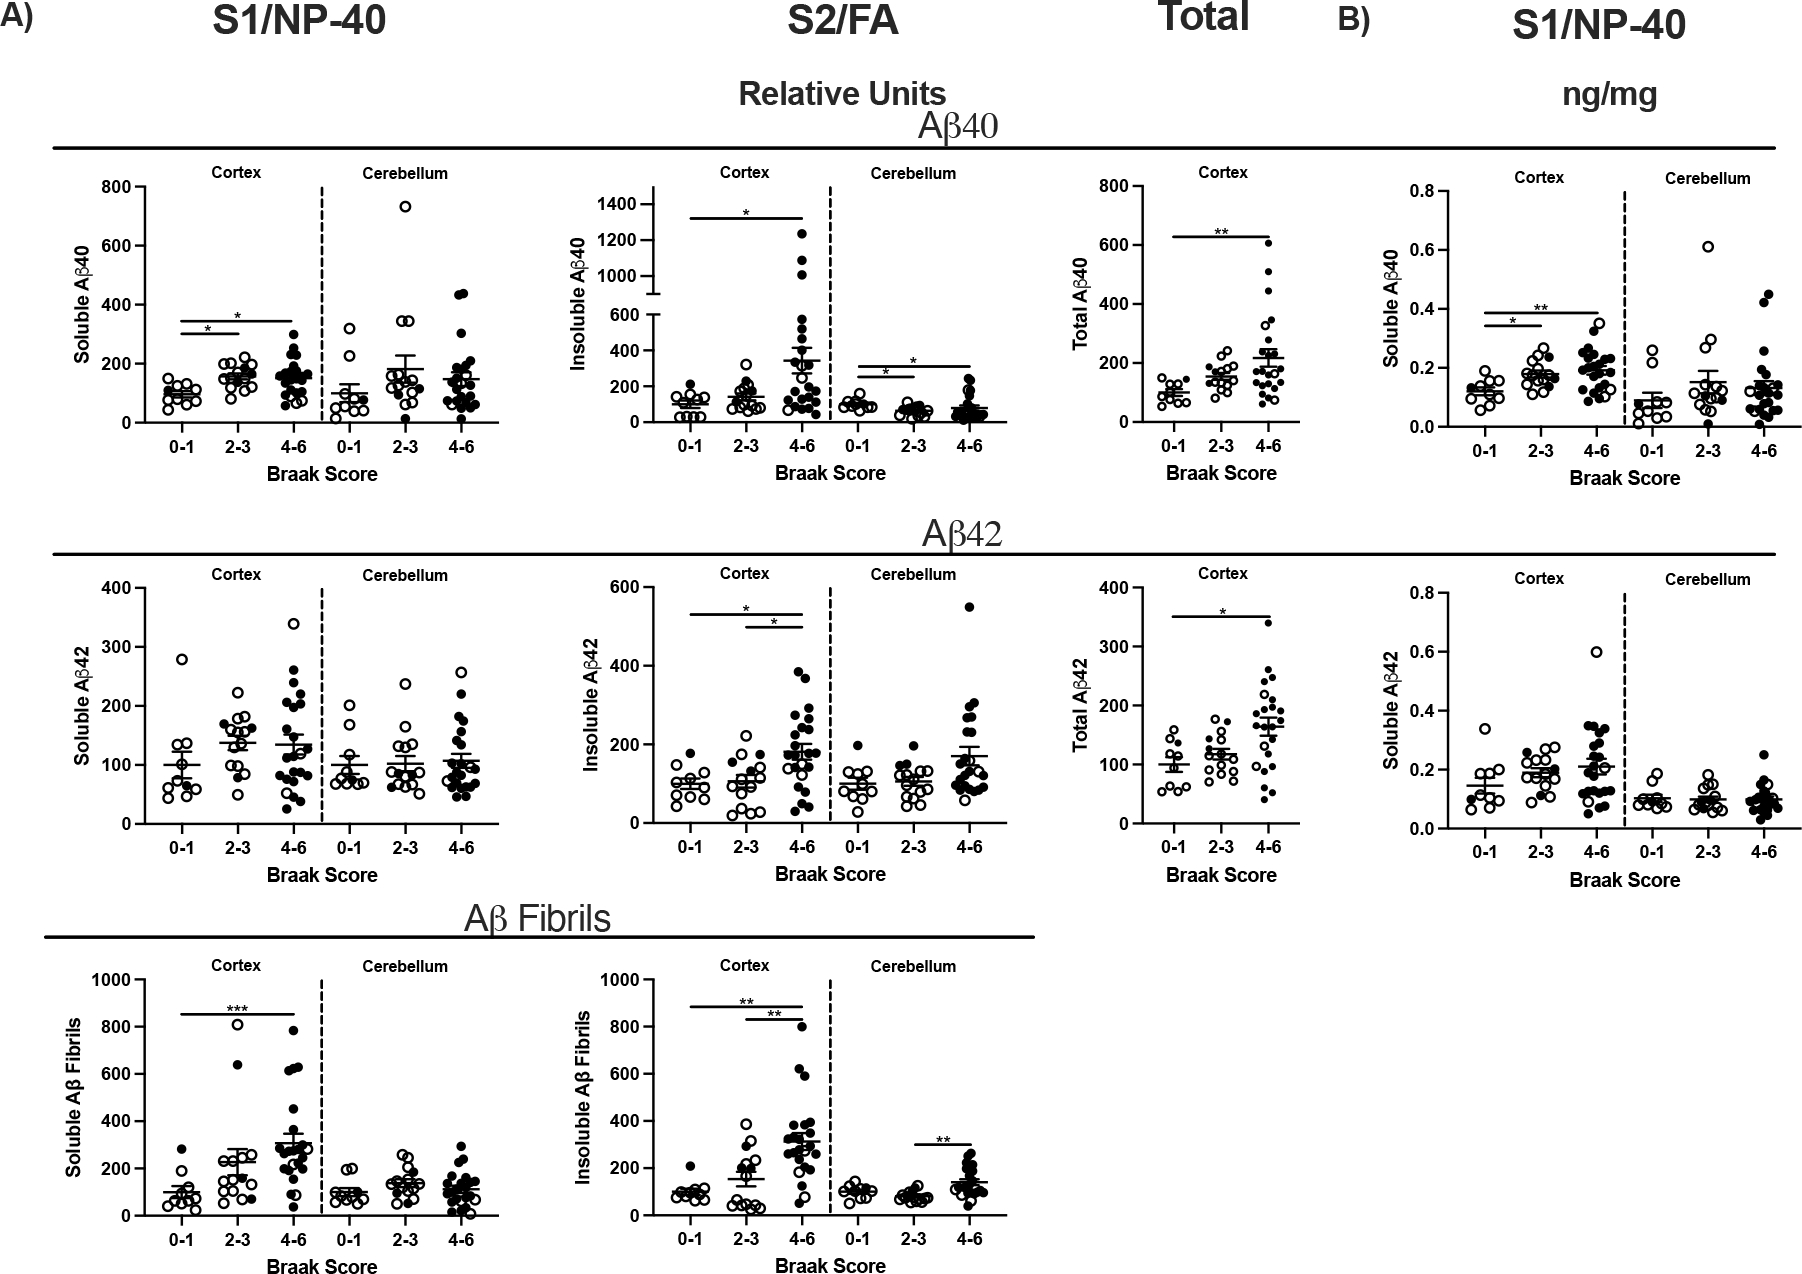
β-Amyloid in frontal cortex and cerebellum by Braak. A) β-Amyloid levels S1, S2, and fibrils shown as relative fluorescence units. B) Transformed values of Aβ40 and Aβ42 ng/mg brain tissue in S1 and S2, calculated from internal standard curves. One way ANOVA; *p<0.05, **p<0.01.
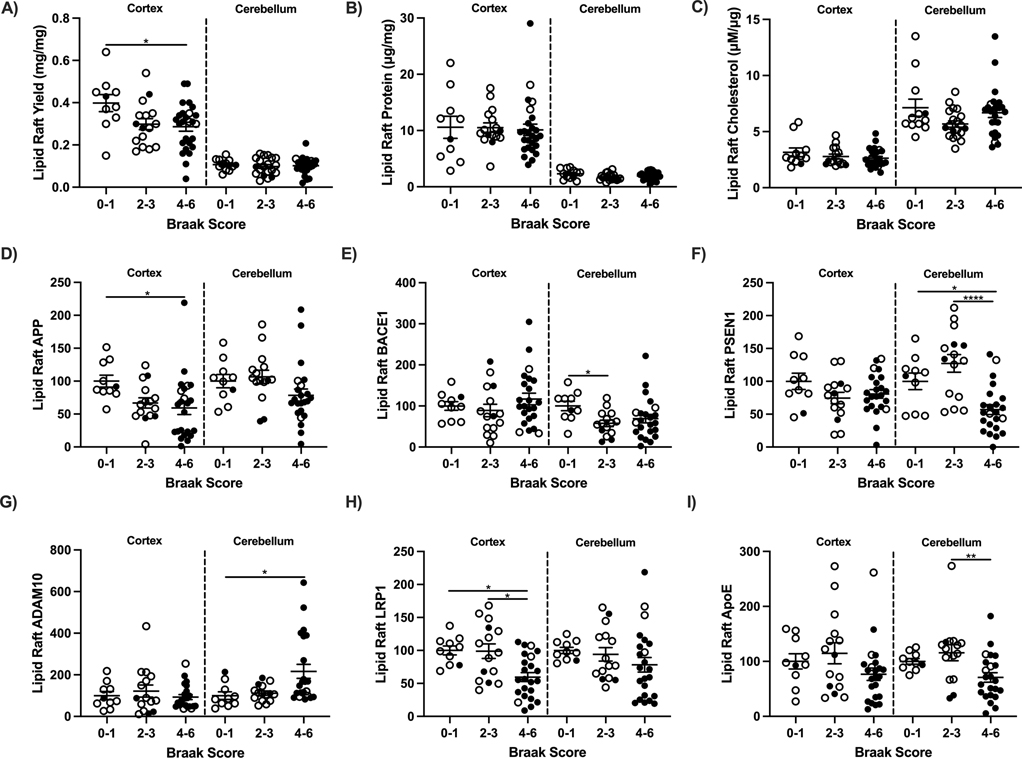
Possible causes of the elevated soluble peptides could include increased production and or decreased clearance. These same brains were characterized for lipid rafts (LR; Fig. 8A), the subcellular site of Aβ production from the secretase enzymes that cleave APP. LR isolations were initially validated by flotillin1, an LR protein in cytosolic and nuclear fractions obtained from the same extraction (Fig. 8B). LRs were void of cytosolic and nuclear contaminants (Fig. 8C). Isolations were then compared to LRs obtained by ultracentrifugation (UC) previously validated [43]. Flotillin1 was more abundant in the LR by chromatography kit compared to UC (Fig. 8D). Additional lipid raft markers flotillin2, caveolin1, and RFTN1 were used to validate kit LR’s (Fig. E-F). Yields of LR wet weight from frontal cortex of Braak 0–1 stages were 25% higher than Braak 4–6 stages (Fig. 9A). Cortex LR protein (Fig. 9B), LR cholesterol (Fig. 9C), and APP processing did not vary by Braak stage for frontal cortex (BACE1, PSEN1, ADAM10; Fig. 9E–G). APP levels were 25% lower for the higher Braak 4–6 stages (Fig. 9D). Cerebellum LR yield was 75% less than cerebral cortex by wet weight and protein, yet LR of both regions had similar levels of APP, BACE1, and PSEN1 by Braak stage. However, cerebellar ADAM10 increased 6-fold in Braak stages 4–6 brains compared to 0–1 (Fig. 9G). Amyloid clearance receptor LRP1 decreased in Braak stages 4–6 in frontal cortex from 0–1 and 2–3 groups; lipid raft ApoE was unchanged (Fig. 9H,I).
Figure 9:
Lipid raft (LR) composition, amyloid precursor protein (APP) and amyloid processing enzymes by Braak score in frontal cortex and cerebellum of 65+ year old cognitively normal (open circles) and demented (closed circles). A) LR yield per mg tissue, B) total protein, C) cholesterol, D) APP, E) BACE1, F) PSEN1, G) ADAM10, H) LRP1, and I) ApoE. One way ANOVA; *p<0.05, **p<0.01, ****p<0.0001.
Neuronal markers were used to assessed neuronal loss in relation to Braak score and brain region. The levels of NeuN, β III tubulin, and PSD95 decreased in showed parallel with for Braak 4–6 stages in frontal cortex compared to 0–1 but was unchanged in cerebellum (Fig. 10). Because NeuN is not found in cerebellar Purkinje neurons, β III tubulin was included [46].
Figure 10:

Neuronal markers in frontal cortex and cerebellum. A) NeuN, B) β III Tubulin, and C) PSD95 protein presented as relative fluorescent units. One way ANOVA One way ANOVA; *p<0.05, **p<0.01, ****p<0.0001.
Correlation matrices examined relationships between Aβ peptides, LRs, and LRP1 for amyloid clearance. Levels of Aβ peptides in bulk tissue (Fig. 7) had limited correlation of LR composition across Braak scores (Fig. 11). Cortex Aβ40 was inversely correlated with LR yield, NeuN, and LRP1. In both regions, LR APP protein varied inversely with Braak scores and AD clinical status. Cerebellar correlations with AD were generally weaker than frontal cortex (Fig. 11). Aβ42 and Braak score were strongly correlated in cortex but not cerebellum.
Figure 11:
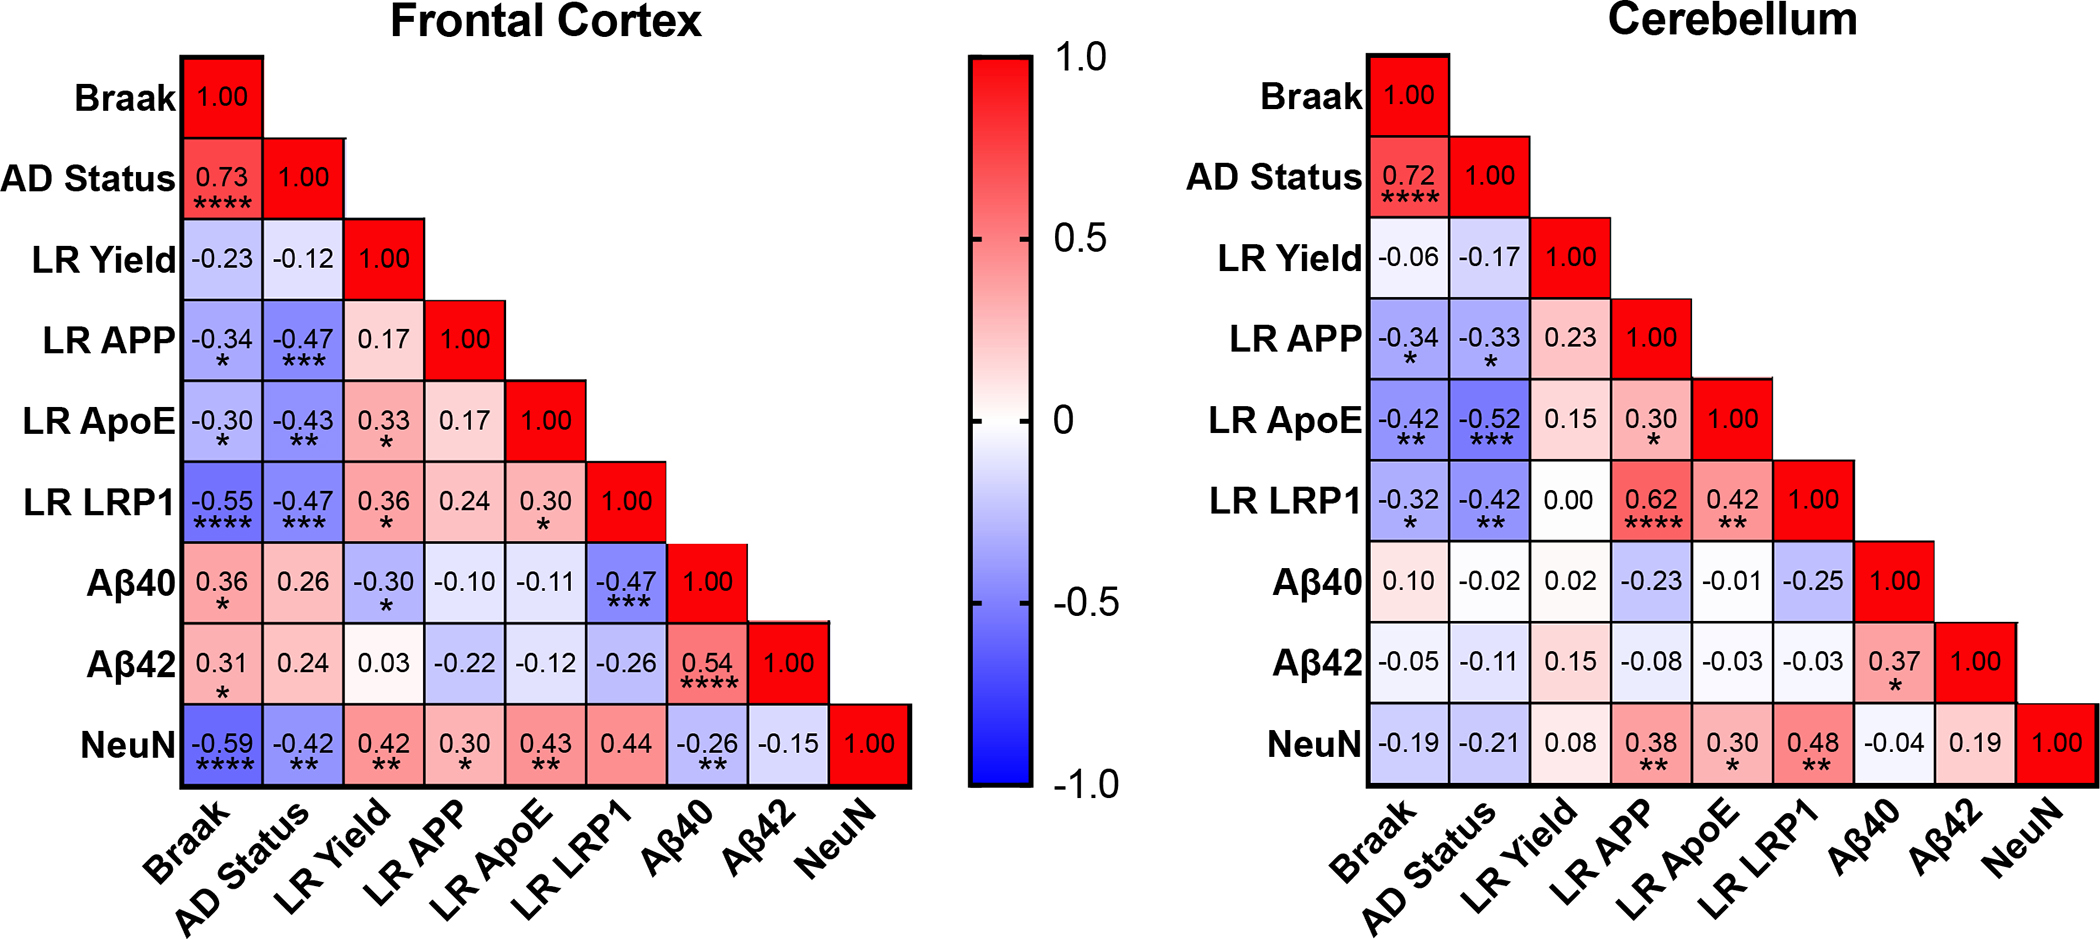
Correlation matrices examining relationships between soluble amyloid, LR, and amyloid clearance for frontal cortex and cerebellum. Aβ40, and −42 are transformed S1 values (Fig 7B). Spearman correlation; *p<0.05, **p<0.01, ***p<0.001, ****p<0.0001.
Research In Context.
Systematic Review:
Cited literature was found using PubMed. Soluble β-amyloid peptides (Aβ) are not well defined by the level of Alzheimer’s disease (AD) neuropathology.
Interpretation.
Elevations in soluble Aβ peptides in AD frontal cortex are attributable to impaired Aβ clearance rather than production.
Future Directions:
Differences by sex and Apolipoprotein E (ApoE) allele need analysis in expanded samples in relation to Braak stage and positron emission tomography (PET) amyloid. Younger ages merit analysis for the cause of progressive Aβ peptide elevations during middle-age, synthesis or clearance.
Acknowledgements.
We are grateful for funding from T32-AG000037 (E. Crimmins, USC). We appreciate the helpful discussions of brain samples with Carol Miller (USC), and C. Dirk Keene (U Washington). We thank Henry Jay Forman, Margaret Gatz, and Christian J. Pike for helpful discussions. Tissue for this study was obtained from the USC Alzheimer’s Disease Research Center Neuropathology Core, NIA AG066530. The UCI-ADRC is funded by NIH/NIA Grant P30AG066519.
Funding:
M.Thorwald was supported by T32-AG000037 (E. Crimmins, USC). J. Silva and E. Head were supported by P30AG066519. Lab studies were supported by NIH grants to CEF (R01-AG051521, P50-AG05142, P01-AG055367). Brain specimens were obtained from ADRC Tissue Cores: USC (P50-AG005142, AG066530); UCIrvine (P30-AG066519); U Washington (P30-AG066509; U01- AG006781).
Footnotes
Conflicts of Interest. The authors report no conflicts of interest.
References
- [1].Bouillot C, Prochiantz A, Rougon G, Allinquant B, Axonal amyloid precursor protein expressed by neurons in vitro is present in a membrane fraction with caveolae-like properties, J Biol Chem. 271 (1996) 7640–7644. 10.1074/jbc.271.13.7640. [DOI] [PubMed] [Google Scholar]
- [2].Zlokovic BV, Deane R, Sagare AP, Bell RD, Winkler EA, Low-density lipoprotein receptor-related protein-1: a serial clearance homeostatic mechanism controlling Alzheimer’s amyloid β-peptide elimination from the brain, Journal of Neurochemistry. 115 (2010) 1077–1089. 10.1111/j.1471-4159.2010.07002.x. [DOI] [PMC free article] [PubMed] [Google Scholar]
- [3].Kanekiyo T, Bu G, The low-density lipoprotein receptor-related protein 1 and amyloid-β clearance in Alzheimer’s disease, Front Aging Neurosci. 6 (2014) 93. 10.3389/fnagi.2014.00093. [DOI] [PMC free article] [PubMed] [Google Scholar]
- [4].Sipe JD, Cohen AS, Review: history of the amyloid fibril, J Struct Biol. 130 (2000) 88–98. 10.1006/jsbi.2000.4221. [DOI] [PubMed] [Google Scholar]
- [5].Kisilevsky R, Raimondi S, Bellotti V, Historical and Current Concepts of Fibrillogenesis and In vivo Amyloidogenesis: Implications of Amyloid Tissue Targeting, Front Mol Biosci. 3 (2016) 17. 10.3389/fmolb.2016.00017. [DOI] [PMC free article] [PubMed] [Google Scholar]
- [6].Glenner GG, Wong CW, Alzheimer’s disease: initial report of the purification and characterization of a novel cerebrovascular amyloid protein, Biochem Biophys Res Commun. 120 (1984) 885–890. 10.1016/s0006-291x(84)80190-4. [DOI] [PubMed] [Google Scholar]
- [7].Goedert M, Spillantini MG, Cairns NJ, Crowther RA, Tau proteins of alzheimer paired helical filaments: Abnormal phosphorylation of all six brain isoforms, Neuron. 8 (1992) 159–168. 10.1016/0896-6273(92)90117-V. [DOI] [PubMed] [Google Scholar]
- [8].Knopman DS, Jones DT, Greicius MD, Failure to demonstrate efficacy of aducanumab: An analysis of the EMERGE and ENGAGE trials as reported by Biogen, December 2019, Alzheimer’s & Dementia. 17 (2021) 696–701. 10.1002/alz.12213. [DOI] [PubMed] [Google Scholar]
- [9].Ackley SF, Zimmerman SC, Brenowitz WD, Tchetgen EJT, Gold AL, Manly JJ, Mayeda ER, Filshtein TJ, Power MC, Elahi FM, Brickman AM, Glymour MM, Effect of reductions in amyloid levels on cognitive change in randomized trials: instrumental variable meta-analysis, BMJ. 372 (2021) n156. 10.1136/bmj.n156. [DOI] [PMC free article] [PubMed] [Google Scholar]
- [10].Shi M, Chu F, Zhu F, Zhu J, Impact of Anti-amyloid-β Monoclonal Antibodies on the Pathology and Clinical Profile of Alzheimer’s Disease: A Focus on Aducanumab and Lecanemab, Frontiers in Aging Neuroscience. 14 (2022). 10.3389/fnagi.2022.870517 (accessed August 25, 2022). [DOI] [PMC free article] [PubMed] [Google Scholar]
- [11].Boyle PA, Wang T, Yu L, Wilson RS, Dawe R, Arfanakis K, Schneider JA, Bennett DA, To what degree is late life cognitive decline driven by age-related neuropathologies?, Brain. 144 (2021) 2166–2175. 10.1093/brain/awab092. [DOI] [PMC free article] [PubMed] [Google Scholar]
- [12].Robinson JL, Richardson H, Xie SX, Suh E, Van Deerlin VM, Alfaro B, Loh N, Porras-Paniagua M, Nirschl JJ, Wolk D, Lee VM-Y, Lee EB, Trojanowski JQ, The development and convergence of co-pathologies in Alzheimer’s disease, Brain. 144 (2021) 953–962. 10.1093/brain/awaa438. [DOI] [PMC free article] [PubMed] [Google Scholar]
- [13].Fukumoto H, Rosene DL, Moss MB, Raju S, Hyman BT, Irizarry MC, β-Secretase Activity Increases with Aging in Human, Monkey, and Mouse Brain, Am J Pathol. 164 (2004) 719–725. [DOI] [PMC free article] [PubMed] [Google Scholar]
- [14].Näslund J, Haroutunian V, Mohs R, Davis KL, Davies P, Greengard P, Buxbaum JD, Correlation between elevated levels of amyloid beta-peptide in the brain and cognitive decline, JAMA. 283 (2000) 1571–1577. 10.1001/jama.283.12.1571. [DOI] [PubMed] [Google Scholar]
- [15].Rosario ER, Chang L, Beckett TL, Carroll JC, Paul Murphy M, Stanczyk FZ, Pike CJ, Age-related changes in serum and brain levels of androgens in male Brown Norway rats, Neuroreport. 20 (2009) 1534–1537. 10.1097/WNR.0b013e328331f968. [DOI] [PMC free article] [PubMed] [Google Scholar]
- [16].Silverberg GD, Miller MC, Messier AA, Majmudar S, Machan JT, Donahue JE, Stopa EG, Johanson CE, Amyloid deposition and influx transporter expression at the blood-brain barrier increase in normal aging, J Neuropathol Exp Neurol. 69 (2010) 98–108. 10.1097/NEN.0b013e3181c8ad2f. [DOI] [PubMed] [Google Scholar]
- [17].Head E, Pop V, Sarsoza F, Kayed R, Beckett TL, Studzinski CM, Tomic JL, Glabe CG, Murphy MP, Amyloid β-Peptide and Oligomers in the Brain and CSF of Aged Canines, J Alzheimers Dis. 20 (2010) 637–646. 10.3233/JAD-2010-1397. [DOI] [PMC free article] [PubMed] [Google Scholar]
- [18].Finch CE, The neurobiology of middle-age has arrived, Neurobiol Aging. 30 (2009) 515–520; discussion 530–533. 10.1016/j.neurobiolaging.2008.11.011. [DOI] [PubMed] [Google Scholar]
- [19].McArdle JJ, Ferrer-Caja E, Hamagami F, Woodcock RW, Comparative longitudinal structural analyses of the growth and decline of multiple intellectual abilities over the life span, Dev Psychol. 38 (2002) 115–142. [PubMed] [Google Scholar]
- [20].Horn JL, Cattell RB, Age differences in fluid and crystallized intelligence, Acta Psychol (Amst). 26 (1967) 107–129. 10.1016/0001-6918(67)90011-x. [DOI] [PubMed] [Google Scholar]
- [21].Hartshorne JK, Germine LT, When does cognitive functioning peak? The asynchronous rise and fall of different cognitive abilities across the life span, Psychol Sci. 26 (2015) 433–443. 10.1177/0956797614567339. [DOI] [PMC free article] [PubMed] [Google Scholar]
- [22].Eckert MA, Keren NI, Roberts DR, Calhoun VD, Harris KC, Age-Related Changes in Processing Speed: Unique Contributions of Cerebellar and Prefrontal Cortex, Front Hum Neurosci. 4 (2010) 10. 10.3389/neuro.09.010.2010. [DOI] [PMC free article] [PubMed] [Google Scholar]
- [23].Salthouse TA, Aging and measures of processing speed, Biol Psychol. 54 (2000) 35–54. 10.1016/s0301-0511(00)00052-1. [DOI] [PubMed] [Google Scholar]
- [24].DeKosky ST, Scheff SW, Synapse loss in frontal cortex biopsies in Alzheimer’s disease: correlation with cognitive severity, Ann Neurol. 27 (1990) 457–464. 10.1002/ana.410270502. [DOI] [PubMed] [Google Scholar]
- [25].Severson JA, Marcusson J, Winblad B, Finch CE, Age-correlated loss of dopaminergic binding sites in human basal ganglia, J Neurochem. 39 (1982) 1623–1631. 10.1111/j.1471-4159.1982.tb07996.x. [DOI] [PubMed] [Google Scholar]
- [26].Severson JA, Finch CE, Reduced dopaminergic binding during aging in the rodent striatum, Brain Res. 192 (1980) 147–162. 10.1016/0006-8993(80)91015-x. [DOI] [PubMed] [Google Scholar]
- [27].Masliah E, Mallory M, Hansen L, DeTeresa R, Terry RD, Quantitative synaptic alterations in the human neocortex during normal aging, Neurology. 43 (1993) 192–197. 10.1212/wnl.43.1_part_1.192. [DOI] [PubMed] [Google Scholar]
- [28].Terry RD, DeTeresa R, Hansen LA, Neocortical cell counts in normal human adult aging, Ann Neurol. 21 (1987) 530–539. 10.1002/ana.410210603. [DOI] [PubMed] [Google Scholar]
- [29].Montagne A, Barnes SR, Sweeney MD, Halliday MR, Sagare AP, Zhao Z, Toga AW, Jacobs RE, Liu CY, Amezcua L, Harrington MG, Chui HC, Law M, Zlokovic BV, Blood-brain barrier breakdown in the aging human hippocampus, Neuron. 85 (2015) 296–302. 10.1016/j.neuron.2014.12.032. [DOI] [PMC free article] [PubMed] [Google Scholar]
- [30].Montagne A, Nation DA, Sagare AP, Barisano G, Sweeney MD, Chakhoyan A, Pachicano M, Joe E, Nelson AR, D’Orazio LM, Buennagel DP, Harrington MG, Benzinger TLS, Fagan AM, Ringman JM, Schneider LS, Morris JC, Reiman EM, Caselli RJ, Chui HC, Tcw J, Chen Y, Pa J, Conti PS, Law M, Toga AW, Zlokovic BV, APOE4 leads to blood–brain barrier dysfunction predicting cognitive decline, Nature. 581 (2020) 71–76. 10.1038/s41586-020-2247-3. [DOI] [PMC free article] [PubMed] [Google Scholar]
- [31].Braak H, Braak E, Neuropathological stageing of Alzheimer-related changes, Acta Neuropathol. 82 (1991) 239–259. 10.1007/BF00308809. [DOI] [PubMed] [Google Scholar]
- [32].Wood PL, The Cerebellum in AD, in: Wood PL (Ed.), Neuroinflammation: Mechanisms and Management, Humana Press, Totowa, NJ, 2003: pp. 295–300. 10.1007/978-1-59259-297-5_15. [DOI] [Google Scholar]
- [33].Lana E, Gellerbring A, Jung S, Nordberg A, Unger Lithner C, Darreh-Shori T, Homomeric and Heteromeric Aβ Species Exist in Human Brain and CSF Regardless of Alzheimer’s Disease Status and Risk Genotype, Front Mol Neurosci. 12 (2019) 176. 10.3389/fnmol.2019.00176. [DOI] [PMC free article] [PubMed] [Google Scholar]
- [34].Savage MJ, Kalinina J, Wolfe A, Tugusheva K, Korn R, Cash-Mason T, Maxwell JW, Hatcher NG, Haugabook SJ, Wu G, Howell BJ, Renger JJ, Shughrue PJ, McCampbell A, A Sensitive Aβ Oligomer Assay Discriminates Alzheimer’s and Aged Control Cerebrospinal Fluid, J. Neurosci. 34 (2014) 2884–2897. 10.1523/JNEUROSCI.1675-13.2014. [DOI] [PMC free article] [PubMed] [Google Scholar]
- [35].Lambert MP, Barlow AK, Chromy BA, Edwards C, Freed R, Liosatos M, Morgan TE, Rozovsky I, Trommer B, Viola KL, Wals P, Zhang C, Finch CE, Krafft GA, Klein WL, Diffusible, nonfibrillar ligands derived from Abeta1–42 are potent central nervous system neurotoxins, Proc Natl Acad Sci U S A. 95 (1998) 6448–6453. 10.1073/pnas.95.11.6448. [DOI] [PMC free article] [PubMed] [Google Scholar]
- [36].Wisniewski T, Golabek A, Matsubara E, Ghiso J, Frangione B, Apolipoprotein E: binding to soluble Alzheimer’s beta-amyloid, Biochem Biophys Res Commun. 192 (1993) 359–365. 10.1006/bbrc.1993.1423. [DOI] [PubMed] [Google Scholar]
- [37].Foster EM, Dangla-Valls A, Lovestone S, Ribe EM, Buckley NJ, Clusterin in Alzheimer’s Disease: Mechanisms, Genetics, and Lessons From Other Pathologies, Frontiers in Neuroscience. 13 (2019). 10.3389/fnins.2019.00164 (accessed January 27, 2022). [DOI] [PMC free article] [PubMed] [Google Scholar]
- [38].Li J, Kanekiyo T, Shinohara M, Zhang Y, LaDu MJ, Xu H, Bu G, Differential Regulation of Amyloid-β Endocytic Trafficking and Lysosomal Degradation by Apolipoprotein E Isoforms♦, J Biol Chem. 287 (2012) 44593–44601. 10.1074/jbc.M112.420224. [DOI] [PMC free article] [PubMed] [Google Scholar]
- [39].Rynearson KD, Ponnusamy M, Prikhodko O, Xie Y, Zhang C, Nguyen P, Hug B, Sawa M, Becker A, Spencer B, Florio J, Mante M, Salehi B, Arias C, Galasko D, Head BP, Johnson G, Lin JH, Duddy SK, Rissman RA, Mobley WC, Thinakaran G, Tanzi RE, Wagner SL, Preclinical validation of a potent γ-secretase modulator for Alzheimer’s disease prevention, J Exp Med. 218 (2021) e20202560. 10.1084/jem.20202560. [DOI] [PMC free article] [PubMed] [Google Scholar]
- [40].Wang H, Kulas JA, Wang C, Holtzman DM, Ferris HA, Hansen SB, Regulation of beta-amyloid production in neurons by astrocyte-derived cholesterol, Proc Natl Acad Sci U S A. 118 (2021) e2102191118. 10.1073/pnas.2102191118. [DOI] [PMC free article] [PubMed] [Google Scholar]
- [41].Shabestari MH, Meeuwenoord NJ, Dmitri.V. Filippov, M. Huber, Interaction of the amyloid β peptide with sodium dodecyl sulfate as a membrane-mimicking detergent, J Biol Phys. 42 (2016) 299–315. 10.1007/s10867-016-9408-5. [DOI] [PMC free article] [PubMed] [Google Scholar]
- [42].Youmans KL, Leung S, Zhang J, Maus E, Baysac K, Bu G, Vassar R, Yu C, LaDu MJ, Amyloid-β42 alters apolipoprotein E solubility in brains of mice with five familial AD mutations, J Neurosci Methods. 196 (2011) 51–59. 10.1016/j.jneumeth.2010.12.025. [DOI] [PMC free article] [PubMed] [Google Scholar]
- [43].Cacciottolo M, Morgan TE, Saffari A, Sioutas C, Forman HJ, Finch CE, OXIDATIVE STRESS FROM TRAFFIC-RELATED AIR POLLUTANTS (TRAP) INDUCES PRO-AMYLOIDOGENIC LIPID RAFT ALTERATION IN AD MODELS, Alzheimer’s & Dementia: The Journal of the Alzheimer’s Association. 14 (2018) P1124–P1125. 10.1016/j.jalz.2018.06.1505. [DOI] [Google Scholar]
- [44].Kayed R, Head E, Sarsoza F, Saing T, Cotman CW, Necula M, Margol L, Wu J, Breydo L, Thompson JL, Rasool S, Gurlo T, Butler P, Glabe CG, Fibril specific, conformation dependent antibodies recognize a generic epitope common to amyloid fibrils and fibrillar oligomers that is absent in prefibrillar oligomers, Mol Neurodegeneration. 2 (2007) 18. 10.1186/1750-1326-2-18. [DOI] [PMC free article] [PubMed] [Google Scholar]
- [45].Hayden EY, Teplow DB, Amyloid β-protein oligomers and Alzheimer’s disease, Alzheimers Res Ther. 5 (2013) 60. 10.1186/alzrt226. [DOI] [PMC free article] [PubMed] [Google Scholar]
- [46].Mullen RJ, Buck CR, Smith AM, NeuN, a neuronal specific nuclear protein in vertebrates, Development. 116 (1992) 201–211. 10.1242/dev.116.1.201. [DOI] [PubMed] [Google Scholar]


