

Abstract
CT images display anatomic structures across 3 dimensions and are highly quantitative; they are the reference standard for 3-dimensional geometric measurements and are used for 3-D printing of anatomic models and custom implants, as well as for radiation therapy treatment planning. The pixel intensity in CT images represents the linear x-ray attenuation coefficient of the imaged materials after linearly scaling the coefficients into a quantity known as CT numbers that is conveyed in Hounsfield Units. When measured with the same scanner model, acquisition, and reconstruction parameters, the mean CT number of a material is highly reproducible and quantitative applications of CT scanning that rely on the measured CT number, such as for assessing bone mineral density or coronary artery calcification, are well established. However, the strong dependence of CT numbers on x-ray beam spectra limits quantitative applications and standardization from robust widespread success. This paper reviews several quantitative applications of CT and the challenges they face, and describes the benefits brought by photon counting detector (PCD) CT technology. The discussed benefits of PCD-CT include that it is inherently multi-energy, expands material decomposition capabilities, and improves spatial resolution and geometric quantification. Further, the utility of virtual monoenergetic images to standardize CT numbers is discussed, as VMIs can be the default image type in PCD-CT due to the full-time spectral nature of the technology.
Keywords: Computed tomography, x-ray, photon counting detectors, quantitative imaging, standardization
Introduction
The first patient CT exam occurred on October 1, 1971 (1), forever changing the face of medicine. Since then, ongoing technical advances have made possible clinical applications originally only imagined by Godfrey Hounsfield, who with Alan Cormack, was awarded the Nobel Prize in Physiology and Medicine for their invention in 1979. In his first paper on CT imaging, Hounsfield foresaw the use of multiple energy spectra to perform dual-energy CT, noting that “tests carried out to date have shown that iodine (Z=53) can be readily distinguished from calcium (Z=20)” (2). In this paper, Hounsfield also described the quantitative nature of CT numbers, “The picture is built up in the form of an 80 × 80 matrix of picture points to each of which a numerical value is ascribed. Each of these points indicates the value of the absorption coefficient of the corresponding volume of material in the slice. …, the absolute values of absorption coefficient of various tissues are calculated to an accuracy of 1/2 percent” (2). Subsequent to this paper, in which a scaling factor of 500 was used, a standard scaling factor of 1000 was adopted by the CT community, and the unit of measure for CT numbers (Hounsfield Units) named in honor of Hounsfield.
where μ is the linear X-ray attenuation coefficient.
In the early years of CT, many studies explored the use of CT numbers to quantify tissue type and disease status (3–5). Rules were adopted to define tissue types according to CT numbers, such as to discern if a renal mass was or was not enhancing (6, 7). However, variations in CT numbers for the same tissue type or material have been repeatedly documented, requiring calibration procedures, which in the case of bone mineral density measurements, required the use of a reference phantom within the scan field of view (8–13). Even then, issues such as position in the field of view caused variations in CT numbers due to beam hardening effects (14). Quantitative applications, such as the assessment of coronary artery calcification, were most successful when limited to a specific scanner technology, such as electron beam CT, which operated at a single tube potential setting (15–17). As CT technology advanced and generator power increased, the use of tube potential values other than the 120 or 130 kV became commonplace, particularly for the purposes of dose reduction (e.g., using lower tube potential such as 80 kV) or scanning in morbidly obese patients (e.g., using higher tube potential such as 140 kV). The “standardization” achieved with use of 120 kV, even with its dependencies on beam filtration, was lost. To address this, parameters such as the Agatston score, were prescribed to be performed at 120 kV on multi-detector-row CT systems (16). Alternatively, phantom calibration was performed to allow assessment of calcium mass or density (16). However, with the large variety of scanner models in existence, and the even larger range of scan and reconstruction parameters, very few quantitative applications of CT imaging have been pursued.
In approximately 2006, dual-energy CT became clinically available for a second time, the first being a short window in the mid-1980s when Siemens sold a scanner capable of separating tissue, calcium, and iodine (18). Reintroduced first by Siemens using its dual-source scanner geometry (19–21), dual-energy CT eventually came to be offered by all major scanner manufacturers and clinical applications that exploit the ability to solve for effective atomic number and mass density have been adopted by many practices (22). One manner by which dual-energy or multi-energy data can be generated is the use of photon-counting detector (PCD) technology, which is the topic of this special issue. The remaining sections describe the improved abilities of PCD-CT to differentiate and/or identify specific tissue compositions and the impact of PCD-CT’s improved spatial resolution on geometric quantification. Further, a case is made for CT number standardization using virtual monoenergetic images (VMI) (23), which are images synthesized from dual- or multi-energy data that yield a standard CT number for a given density of material, completely independent of the scanner make, model, tube potential, or beam filtration.
PCD-CT is inherently multi-energy
In 2014, the first high-flux whole-body PCD-CT system was installed at the Mayo Clinic (24, 25), and in 2021, the first commercially available dual-source PCD-CT system was introduced for clinical use (26, 27). The technology is inherently spectral in nature, measuring temporally and spatially synchronous multi-energy data. As described in (28), PCDs measure very narrow (10–20 ns) electronic pulses that are compared to prescribed threshold, which have been calibrated in terms of photon energy. Those pulses exceeding a given threshold are counted and the number of counts above each threshold provides information about the energy-dependent attenuation of the imaged material. This energy-dependent information is used to perform material decomposition and synthesize material-specific density maps (Figure 1), VMIs, or images where materials of a specific atomic number are color coded to indicate their composition. Materials can also be subtracted from the data to form virtual non-contrast or virtual non-calcium images (22, 29), and its clinical utility has been demonstrated in multiple studies (30–38).
Figure 1.
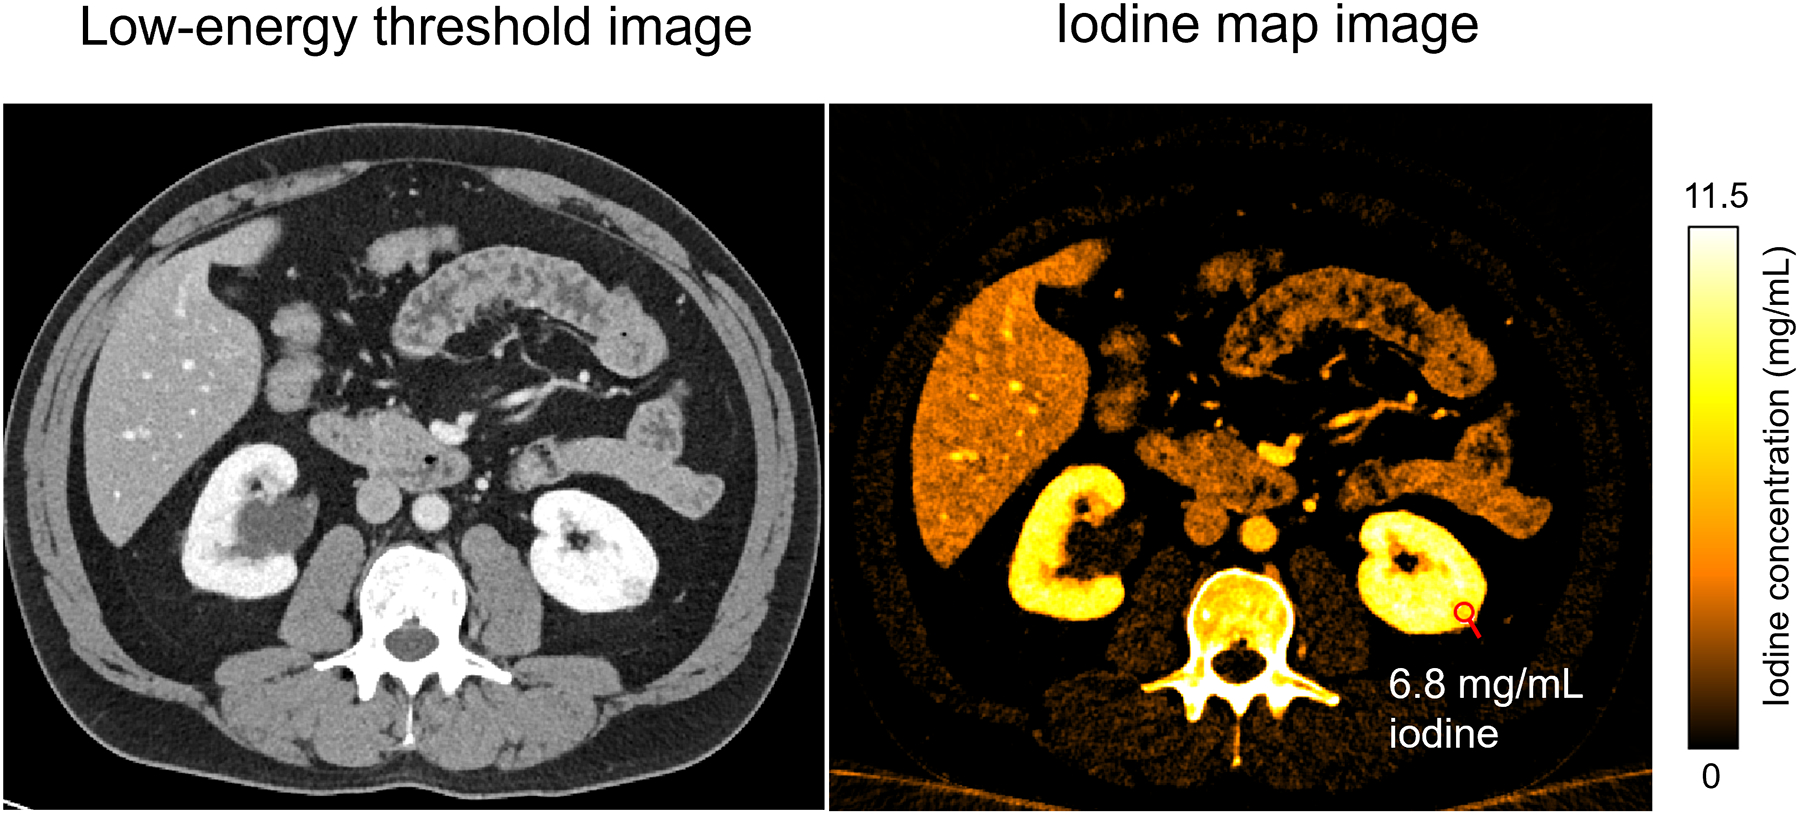
Example of a quantitative iodine map from a CT urogram of a 59-year-old male obtained using the multi-energy acquisition mode of a clinical PCD-CT system. The left renal mass showed internal nodular enhancement (measuring 6.8 mg/mL of iodine in the iodine map). Window/level: 40/400 for the low-energy threshold image and 0–11.5 mg/mL for the iodine map image.
Material maps are CT images representing the mass density of the material of interest (Figure 2). The pixel values are provided in terms of mg/cc or mg/mL, or in some scenarios, the values are given in CT numbers and a scale factor must be applied to determine the physical mass density. The complementary image to an iodine map is a virtual non-contrast image, in which the iodinated signal has been removed, leaving behind soft tissue or water maps. The complementary material types are established during the material decomposition process where the basis materials are defined. Common 2-material decomposition image types include iodine maps (with non-iodine-like materials removed) and virtual non-iodine images (with iodine-like materials removed). Common 3-material decomposition image types include iodine, water, and calcium maps or iodine, soft tissue, and fat maps. Since only two unique spectral measurements are made in dual-energy CT, the third material map is created by use of an additional assumption, typically that the volumes of the 3 materials are conserved during the decomposition process.
Figure 2.
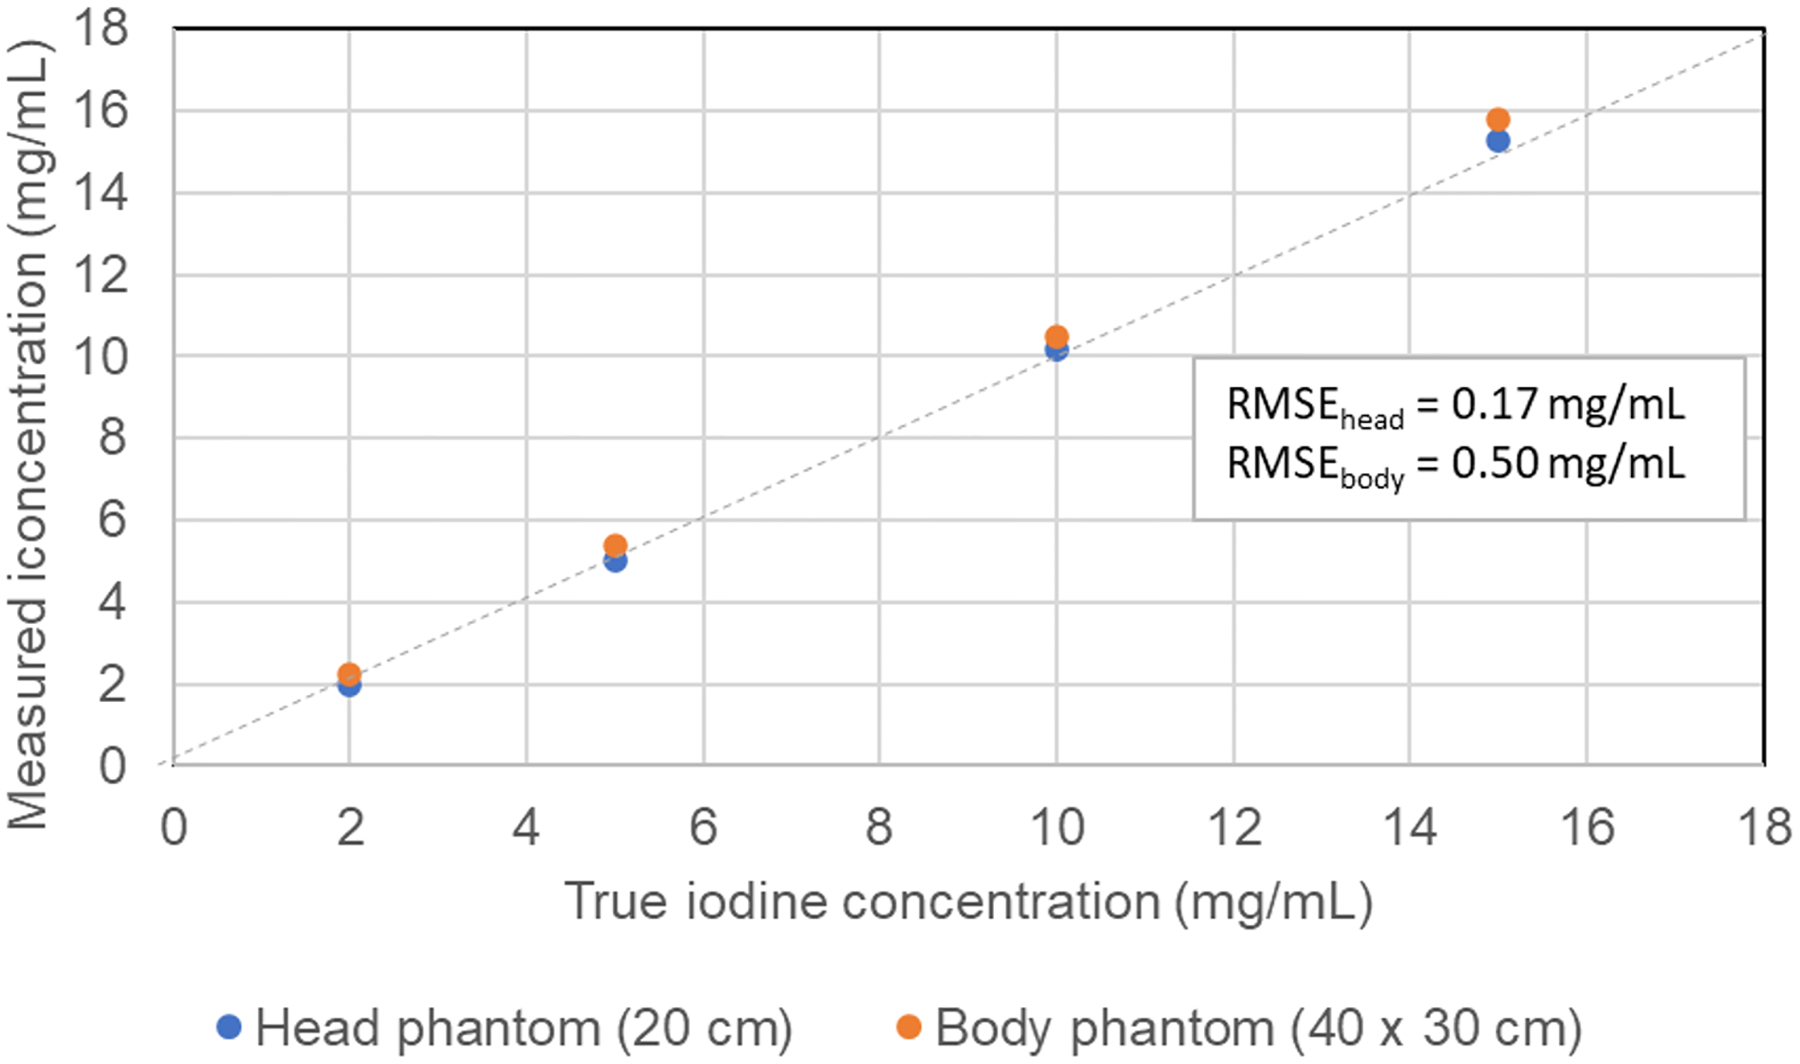
The concentration of iodine can be measured very accurately in both moderate to large phantom sizes using material decomposition and iodine maps.
It is essential to recognize that material maps are quantitative only for the basis materials specified in the decomposition algorithm. For example, in iodine (no water) and water (no iodine) images, a portion of bone signal – which contains predominantly calcium signal – will appear in both the iodine and water images because calcium is neither iodine or water, but rather is represented as a linear combination of iodine and water. It is thus incorrect to measure a region-of-interest over bone and assert that the numerical value represents the bone mineral (i.e., calcium) density in an iodine (no water) image. To measure calcium mass density, one must make measurements on a calcium map that is obtained using calcium as a basis material.
PCD-CT expands material decomposition capabilities
With dual-energy CT, the photoelectric and Compton interaction processes are used to describe the attenuation of materials to perform material decomposition. All materials can be described as a combination of these two processes, and thus no matter the number of energy measurements made, only two materials can be conveyed in the resulting material maps. The exception to this is in the presence of k-edges – energies at which the attenuation of a material markedly increases. The k-edges of most naturally occurring elements in the body, such as calcium (4 keV) and iron (7 keV), are too low to be directly measurable in diagnostic CT data, since there are few photons transmitted through a patient at energies below 30 keV. However, extrinsic contrast agents, such as iodine (k-edge at 33 keV), barium (k-edge at 37 keV), and gadolinium (k-edge at 50 keV) can be detected in measured CT data, providing an additional mechanism by which to decompose the CT signal. Thus, in additional to the photoelectric and Compton processes, k-edge materials can be decomposed with PCD-CT by setting energy thresholds adjacent to the k-edge values (39–43). This expands the type of imaging that can be performed.
Ren et al. studied the use of multi-contrast agents (i.e., iodine and gadolinium) to create distinct maps of the arteries and veins (Figure 3) from a single PCD-CT scan (44). The contrast agents were injected at two different times and the single scan was performed when the first injected material had reached the veins but the 2nd injected material remained in the arteries. Other work using PCD-CT to quantify the concentration of more than one contrast agent in abdominal and cardiovascular applications has been reported (45–49).
Figure 3.
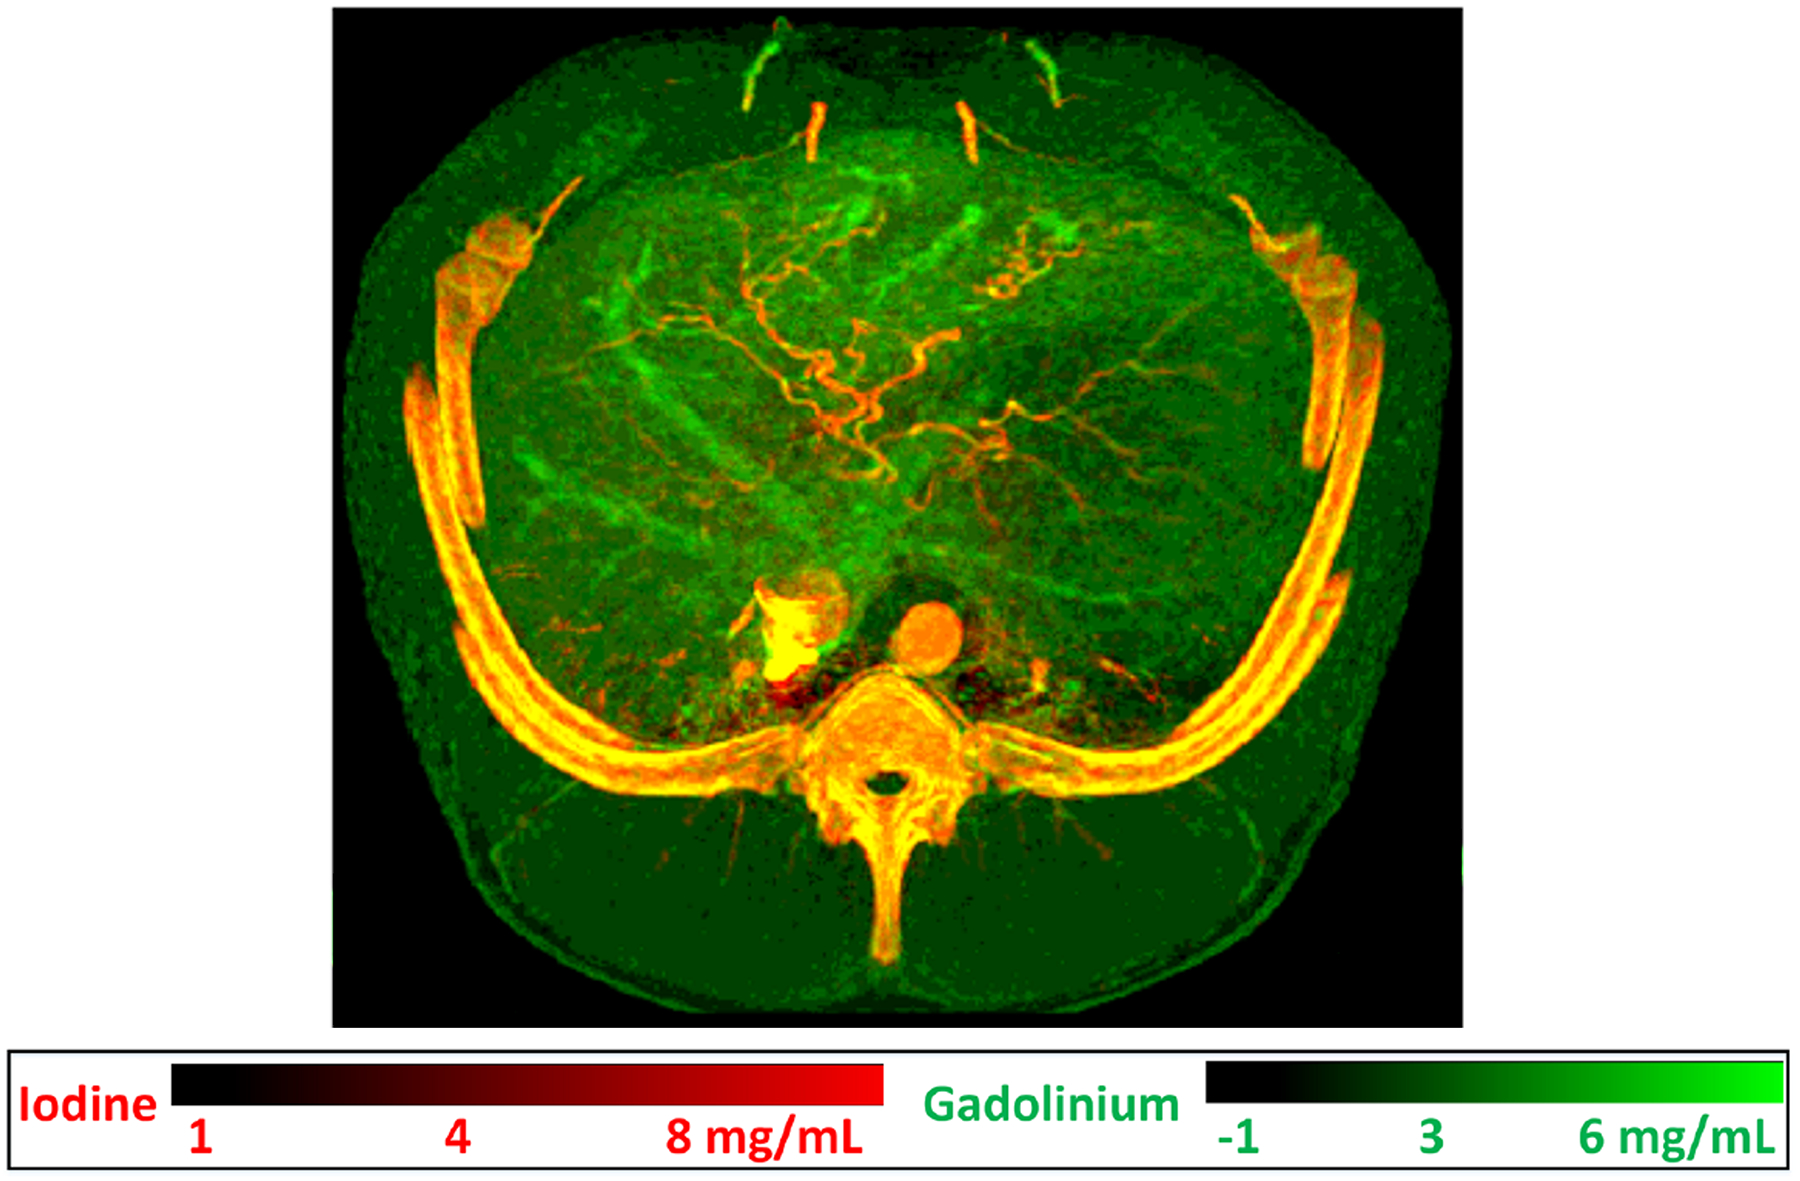
Dual-contrast imaging using gadolinium (k-edge = 50.2 keV) in venous vasculature and iodine in arterial vasculature in a swine study. Gadobutrol (Gadavist, Bayer Healthcare, NJ) contrast agent was first injected intravascularly, followed by an iohexol (Omnipaque 350, GE Healthcare, WI) injection 17.5 s from the initial injection. A single photon-counting-detector scan was performed to capture both contrast agents after the second injection, resulting in the dual-contrast fused material map of abdominal vasculature. Image reproduced from (44).
PCD-CT improves spatial resolution and geometric quantification at lower image noise
Conventional EIDs use a scintillating layer to convert the x-ray energy into light and then to convert the light into an electrical signal proportional to the total energy of the detected x-rays. In contrast, PCD technology directly converts each individual x-ray energy to an electrical signal whose amplitude is proportional to the energy of the detected x-ray (50–52). This use of direct conversion increases the active area of the PCD because reflector septa are not needed between detector elements. X-ray energy thresholding in PCDs enables suppression of electronic noise by setting a threshold above the electronic noise floor, a feature not possible in EIDs (50, 53). These factors and the fundamentally higher spatial resolution of the PCD-CT system enable higher dose-efficiency and reduction of noise compared to conventional EID-CT systems (50, 53).
The manner in which detector pixels are formed in PCDs enables markedly improved spatial resolution without loss of dose efficiency. The metallic anodes can be adhered onto the far side of the semi-conductor detector at extremely small spacings – 100 microns or smaller. No dicing of the detector is required and because no light is formed, optical reflectors are not needed between detector pixels. This allows creation of images with a limiting spatial resolution of 125 to 150 microns (54–60). To date, the improved visualization and geometric quantitation afforded by this improved resolution has been applied to imaging of the inner ears, temporal bones, sinuses, lungs, musculoskeletal anatomy, blood vessels, and calcifications. In each case, geometric and attenuation measurements have become more accurate.
Inner ear, temporal bones, and sinuses
Neuroimaging tasks involving the inner ear, temporal bone, and sinus typically deal with delicate, sub-millimeter anatomic structures that are often challenging to image with conventional CT systems due to their limited spatial resolution. The use of attenuating comb or grid filters reduce the in-plane pixel aperture (61) to facilitate ultra-high-spatial resolution but comes at the cost of decreased geometric dose efficiency (55). Additionally, partial volume averaging in the longitudinal scan direction makes it challenging to image thin structures, including metallic prostheses in the inner ear (Figure 4). This occurs when the smallest CT image section thickness (e.g., 0.4 mm on 3rd generation DS-DECT system) is markedly larger than the dimension of the bone or metal implant surrounded by air. The resulting image voxel consists of an averaged attenuation of bone or metal and air leading to a blurry depiction of the bone or metal prosthesis.
Figure 4.
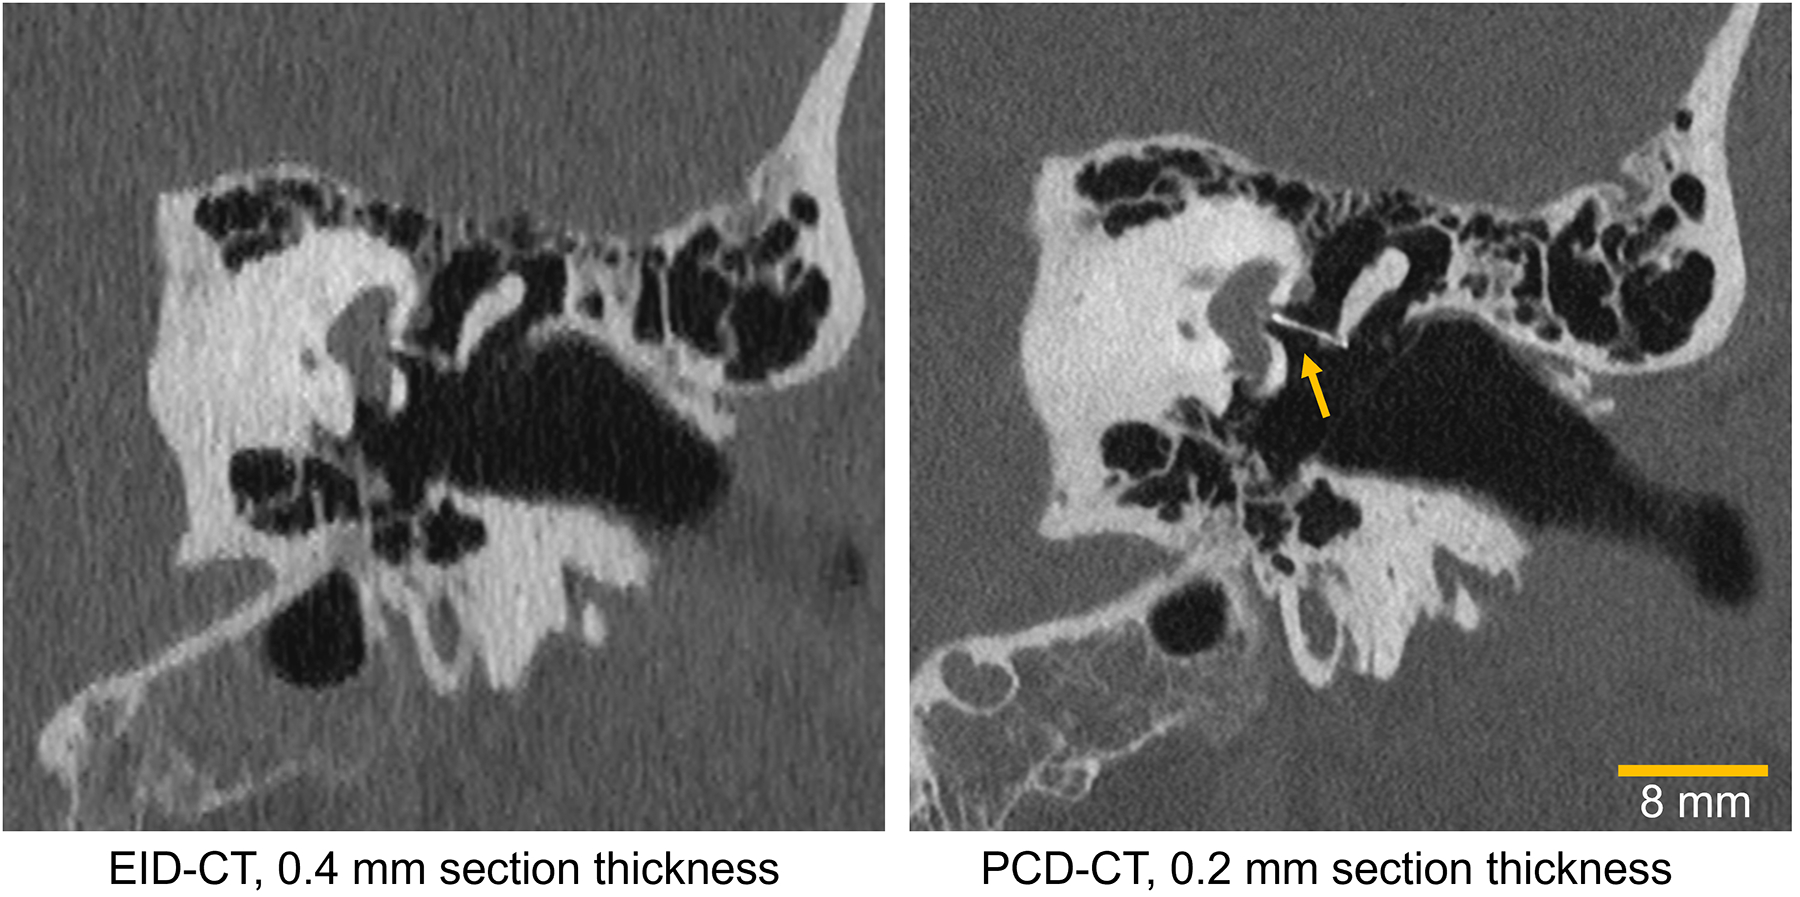
Images of a 53-year-old male patient’s inner ear imaged with an energy-integrating-detector (EID) CT (left) and a photon-counting-detector (PCD) CT (right). The yellow arrow points to a sub-mm metallic stapes prosthesis that is visualized much more clearly on PCD-CT. Window/level: 700/4000.
Spatially accurate representations of anatomic and pathologic features in the inner ear are possible with the ultra-high-resolution feature of PCD-CT (62). A section thickness of 0.2 mm on PCD-CT combined with a dedicated UHR kernel has led to reduced longitudinal partial volume averaging and superior depiction of stapes piston prosthesis (62). Since PCD-CT achieves UHR capability without the use of attenuating comb or grid filters, substantial dose reduction (30 to 85%) relative to current clinical EID-CT temporal bone protocols have been achieved (63). For sinus imaging, increased in-plane spatial resolution and reduced partial volume averaging from PCD-CT will enable improved systematic and quantitative grading of bony and septal fractures. CT is currently a gold standard modality for sinonasal tumor staging and tumor mapping but is performed at higher radiation doses (64). PCD-CT with its high spatial resolution and low dose imaging capabilities could further improve sinonasal tumor imaging in clinical practice. Alternatively, doses could be maintained at current levels to instead decrease noise, which will increase the precision of quantitative measurements.
Lungs
Lung cancer CT screening is used to detect lung nodules and estimate of their volumes are used clinically to assess the need for follow up and/or to monitor nodule growth (65). Additionally, high-resolution CT has been used to measure the dimensions of small structures such as airways for the purpose of monitoring for chronic obstructive pulmonary disease and asthma (66, 67).
High-resolution PCD-CT has been shown to improve nodule volume quantification, shape characterization, and image quality compared to standard-resolution PCD-CT (54, 58, 68, 69). PCD-CT has been applied to nodule volume, emphysema, and airway quantification (69–72). In the context of interstitial lung disease, PCD-CT technology maintained diagnostic performance at reduced dose compared to EID-CT (73, 74). Dunning et al. showed that PCD-CT improved nodule volume estimation (volume quantification error reduced from 11.4% to 3.1%) and airway wall thickness measurement (root mean-squared error reduced from 0.42 mm to 0.23 mm) compared to EID-CT, particularly at lower doses (75). Clinically, the use of PCD-CT for lung cancer screening or management of airway diseases will allow more accurate monitoring of nodule growth and airway wall thickening (75).
Musculoskeletal anatomy
In musculoskeletal imaging, PCD-CT has shown to improve the depiction of cortical and trabecular features (76), bone fractures and early callus formation (77), and improve detection of osteolytic lesions (78) at lower radiation doses and/or image noise levels. A study by Thomsen et al. (59) demonstrated that the effective spatial resolution of the clinical PCD-CT system for quantifying trabecular microstructures in excised spine are comparable to that of peripheral quantitative CT (pQCT). This approach enables quantitation of trabecular morphology such as trabecular thickness, spacing, number and bone volume fraction in central sites such as spine and large joints using PCD-CT, which were previously limited to extremities using pQCT. Bone CT numbers in PCD-CT are significantly higher than those obtained using EID-CT (76, 77), due to count weighting instead of energy weighting in PCDs. This increase in bone contrast, combined with decreased partial volume averaging from smaller detector pixels of PCD-CT leads to better depiction of fine trabecular structures and osseous pathology. PCD-CT also offers opportunistic bone mineral density (BMD) measurements using a single localizer (topogram) image. Typically, BMD is measured using a dual-energy absorptiometry (DEXA) technique where bone density is estimated using areal attenuation measured using two different x-ray energies. In PCD-CT, since the multi-energy data is acquired at the detector using a single tube potential, a DEXA-like BMD measurement is available using the localizer scan for opportunistic osteoporosis screening (79, 80). For cartilage imaging, PCD-CT has shown to facilitate quantitative mapping of glycosaminoglycans in the extracellular cartilage matrix (81) and grading of cartilage integrity and articular cartilage loss at high spatial resolution (82).
Blood vessels and calcifications
Coronary artery calcification (CAC) is an important indicator of coronary artery disease, but accurate quantification of CAC volume is challenging using CT due to calcium blooming, which is a consequence of limited spatial resolution. PCDs do not require interpixel septae and can therefore offer smaller detector pixels without losing geometric dose efficiency, which allows PCD-CT to achieve dose-efficient high spatial resolution relative to conventional EID-CT technology (83). Sharper convolution kernels and thinner image sections are also needed for PCD-CT to take advantage of the higher resolution data (27, 54, 55, 63).
Koons et al. (84) demonstrated accurate quantification of luminal stenosis in the presence of heavy calcifications in a phantom model using the ultra-high-resolution mode of the clinical PCD-CT system. In cases of severe stenosis (50–75% occlusion in a ring-shaped calcification) investigated using a calcific stenosis phantom, PCD-CT images were able to indicate that the lumen was not completely occluded, whereas EID-CT images of the same phantom showed near-complete or complete occlusion of lumen. The improvement in stenosis quantification from PCD-CT is attributed to the improved spatial resolution and reduced calcium blooming, resulting in better plaque-lumen delineation. In addition to the reduction of calcium blooming due to the high spatial resolution of PCDs, multi-energy imaging using dual-source PCD-CT can achieve 66-ms temporal resolution (27, 85), which is not possible with conventional dual-source CT systems without sacrificing the temporal resolution (DSCT offers single-tube-potential cardiac imaging at 66 ms temporal resolution without spectral capabilities, or dual-energy acquisitions with two different x-ray spectra at 125 ms temporal resolution). The high temporal resolution offered by dual source PCD-CT, and high spatial resolution and multi-energy capabilities, are beneficial for imaging of coronary plaques and quantitative CAC scoring based on calcium mass density and volume. Similarly, Marsh et al. (86) demonstrated that ultra-high-resolution imaging of CAC using a clinical PCD-CT yielded reduction in calcium blooming artifacts and improvements in calcification volume quantification accuracy relative to a state-of-the-art EID-CT system. Sandstedt et al. (87) similarly showed improved CAC volume quantification accuracy using an investigational PCD-CT relative to state-of-the-art EID CT. Calcification volume measurements overestimated micro-CT volumes (95% CI) by 9 ± 12% for clinical PCD-CT data, 18 ± 12% for the investigational PCD-CT data, and 24 ± 18% for the EID-CT data (86, 87). Mergen et al. (57) further demonstrated the spatial resolution benefits for cardiac imaging in patients scanned with the clinical PCD-CT system in UHR mode. Subjective image quality assessment with 2 readers showed that the readers favored PCD-CT images reconstructed with ultra-sharp kernels (Bv64 and Bv72) for assessing lumen and plaque characteristics.
Studies by Eberhard et al. and van der Werf et al. have also investigated CAC imaging on the clinical PCD-CT system, with an emphasis on assessing calcium scoring using the Agatston score (88, 89). The Agatston score is highly dependent on the maximum attenuation of a calcified plaque (15, 16, 90) and hence the tube potential or VMI photon energy level greatly impacts the CAC score. Independence from tube potential has been shown for CAC scoring using a dedicated reconstruction kernel that provides (90, 91) consistent attenuation of calcifications at varying tube potentials. However, due to the differences in how the detector signal is weighted (i.e., energy vs count weighting), polychromatic 120 kV PCD-CT images do not yield CAC scores identical to those measured with 120 kV on EID-CT. As described in the next section, to use the semi-quantitative Agatston score with PCD-CT, VMIs must be used. Eberhard et al. found a deviation of below 1% compared to a conventional EID-CT using VMIs at 70 keV (88). Using an investigational PCD-CT from a different manufacturer, van der Werf et al. also found that PCD-CT provided greater accuracy for volume quantitation as well as greater sensitivity to small calcifications (92). After optimization by the manufacturer to achieve comparable CT number values, they found comparable CAC scores between EID-CT and PCD-CT (92). In a later study using a commercially released PCD-CT scanner and a motion phantom, van der Werf et al. evaluated CAC scores as a function of heart rate and VMI energy level (89). They found differences in CAC score, volume, and mass at all heart rates and VMI energies, which they attributed primarily to motion (89). For heart rates < 60 bpm and VMI energies of 74 or 76 keV, CAC scores were comparable to the reference scanner (89).
Virtual monoenergetic images and the standardization of CT numbers
CT numbers, which represent x-ray attenuation, are energy dependent and their values are strongly affected by the characteristics of the Bremsstrahlung x-ray spectrum; CT numbers of the same material can vary substantially across scanner manufacturer and model, tube potential, and beam filtration. Acquisition of dual- or multi-energy CT data allows generation of VMIs (93–96). VMIs are used to increase iodine contrast-to-noise ratio (CNR) using low photon energy levels or reduce metal artifacts and calcium blooming with high photon energy levels (95, 97–99). In VMIs, the CT number of a material can be computed exactly for a specified photon energy level (keV) (Figure 5), ideally making the CT number of a material independent of scanner type, tube potential, and beam filtration (Figure 6). This allows for comparison of quantitative measurements across manufacturers and scanners, which is a significant benefit for clinical applications that require accurate and reproducible CT numbers (100). While, some studies have shown some dependence of VMI CT numbers on external factors (93, 101), more recent comparisons of VMI CT numbers across the range of dual- and multi-energy CT scanners have shown accurate and reproducible results (102–105).
Figure 5.
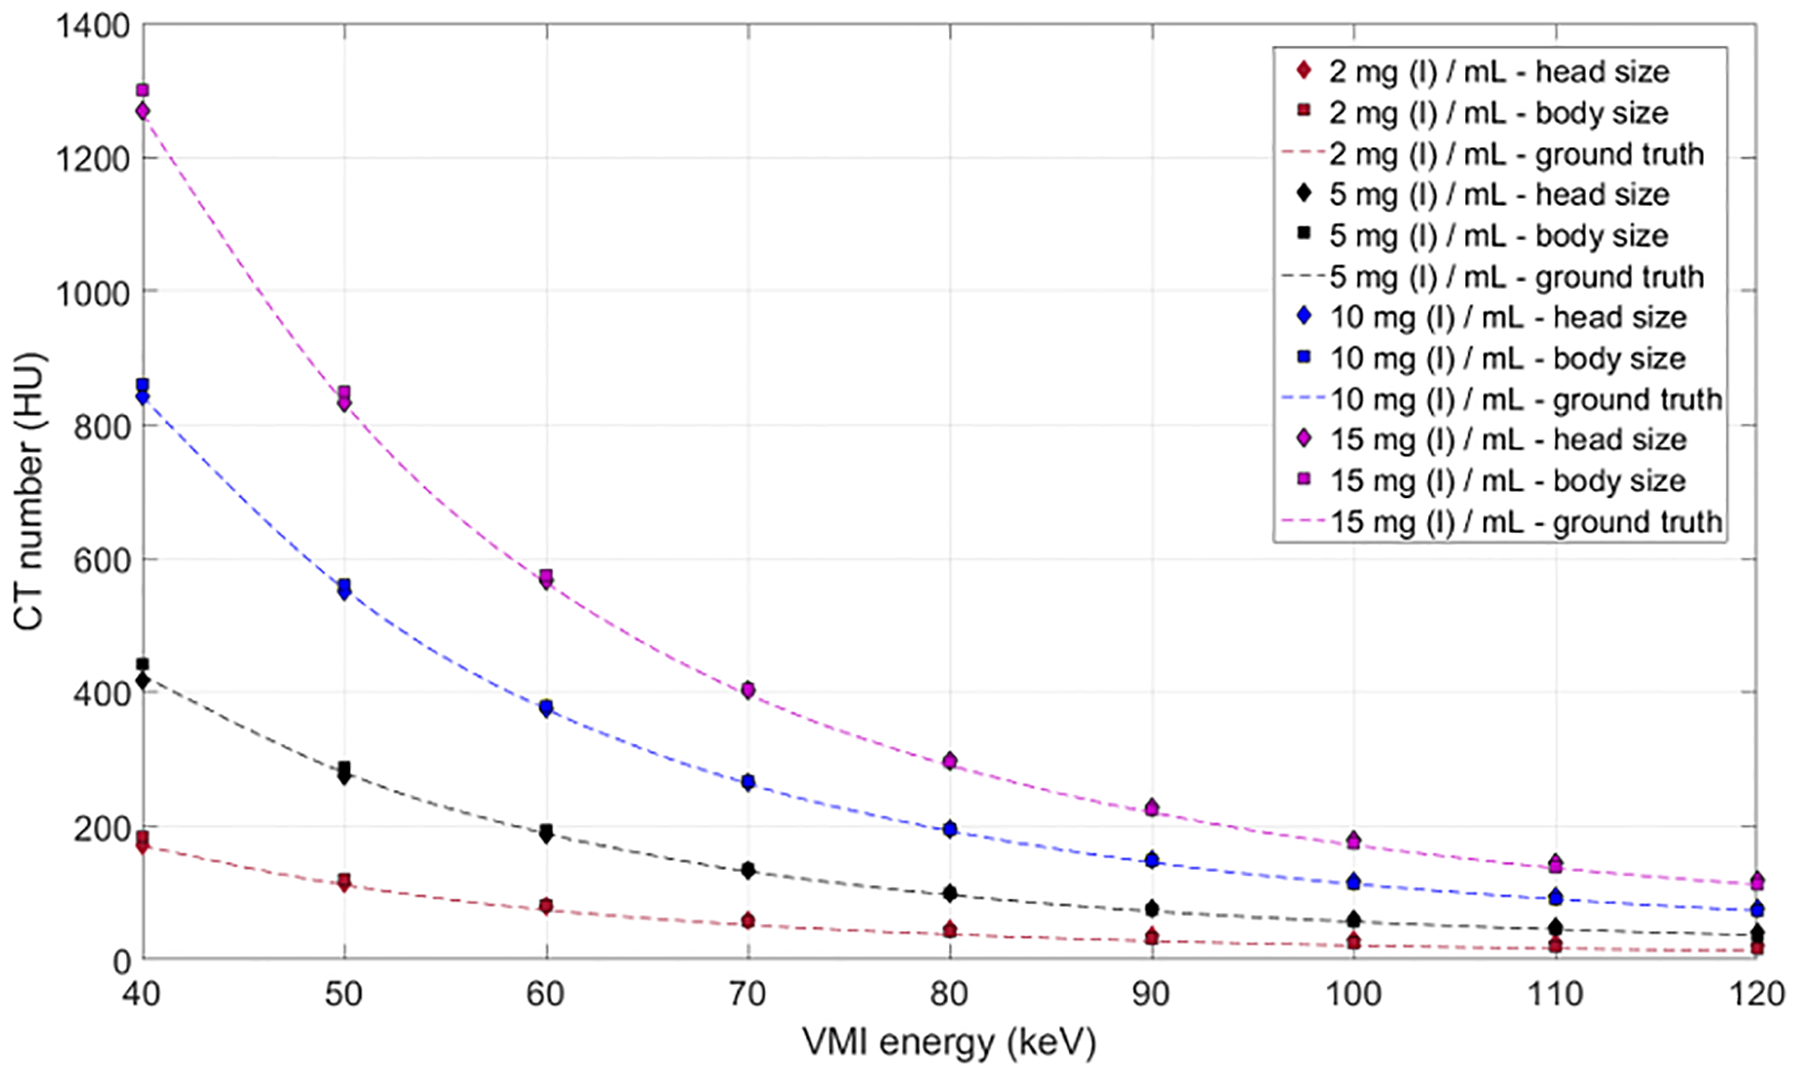
The CT numbers in virtual monoenergetic images (VMIs) are determined solely by the x-ray absorption coefficient of the evaluated material and the photon energy at which the image is made. This graph shows the agreement between ground truth and measurements for iodine solutions within a head (20-cm diameter) and body (40 × 30 cm) phantom. As shown in Figure 6, the values are a given energy level are independent of the tube potential used to acquire the data.
Figure 6.
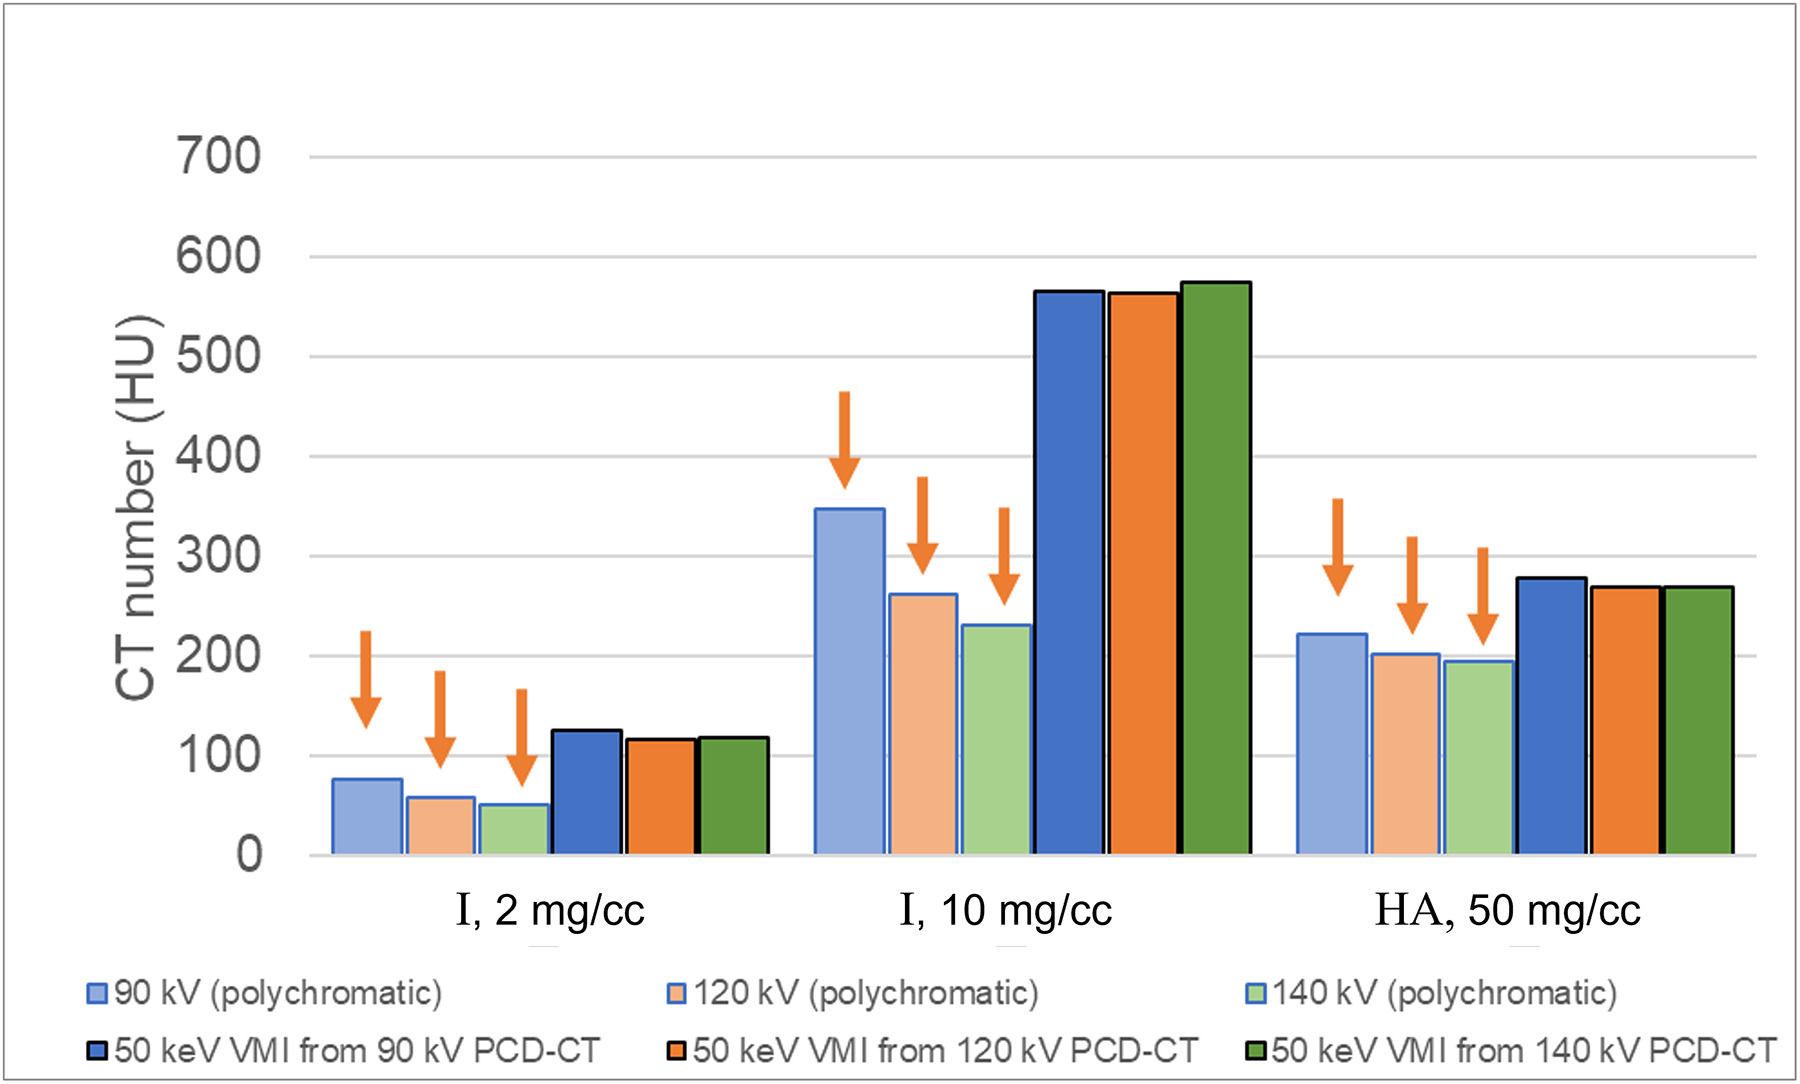
CT number dependence on tube potential for iodine (I, 2 and 10 mg/cc) and hydroxyapatite (HA, 50 mg/cc). Dimmer bars are from the low-energy threshold image and brighter bars are from virtual monoenergetic images (VMIs). For the polychromatic, low-energy threshold images, the CT numbers are highest at 90 kV and lowest at 140 kV (arrows), whereas the CT numbers corresponding to VMIs at 50 keV are independent of tube potential.
In conventional single-energy (SE) CT with energy integrating detectors (EIDs), the dependence of image quality and radiation dose on tube potential can be exploited, for example, to increase iodine signal and reduce dose at lower tube potential settings (e.g., 80 kV), which works well for children and small adults. For larger patients, a low tube potential protocol is not optimal and high tube potentials (e.g., 140 kV) are more appropriate (106). The most appropriate tube potential must be selected by the scanner operator based on both the patient size and the imaging task. While this can be accomplished with size-specific technique charts or automatic tube potential selection tools (106, 107), the task of selecting the optimal tube potential is challenging in practice and requires additional steps by the operator. So, in addition to causing a severe lack of standardization of CT numbers, the use of multiple tube potentials decreases workflow efficiency and opens the process to more potential errors.
Similar to SECT, the selection of optimal tube potential(s) and filters for DECT acquisition modes (e.g., tube potential pairs on dual-source systems) is dependent on patient size and imaging task. VMIs at low photon energies can increase the iodine contrast-to-noise ratio (CNR) (108, 109). If material-specific information is not needed, the scan could be performed with a SE protocol using the optimal tube potential or a DE protocol using the optimal energy VMI. The complexity of these decisions decreases practice efficiency. More importantly, inappropriate selection of tube potential in SECT, or tube potential pairs in dual-source DECT, can result in suboptimal exams. A simple and efficient workflow that provides optimal image quality, in terms of iodine CNR and lesion detectability, across different patient sizes is therefore highly desirable.
Just as in DECT, VMIs can be generated from PCD-CT (23, 26, 71, 110, 111). In addition to tube potential and tube current, PCD-CT systems require the selection of additional acquisition parameters, such as energy thresholds, which can further complicate clinical workflow. To simplify protocol decisions and scanning workflow, data acquired with a research, whole-body PCD-CT system has shown that the use of VMIs created at a pre-defined fixed energy from a data set acquired with a pre-defined fixed protocol (tube potential and energy thresholds) can provide optimal iodine CNR across the range of adult patient sizes (23). Further work found similar results for the detectability of low contrast lesions for different adult sizes using fixed energy VMIs acquired with a universal abdominal acquisition protocol. This is possible because of the count (and not energy) weighting of the detector signal and the universality of attenuation coefficients for a given material at a given photon energy (23). The ability to use a single scan protocol and VMI energy level for all imaging of a given body region could have great value for workflow standardization, and more importantly, for quantitative applications of CT and disease characterization (9). Further, in the rapidly emerging field of AI, algorithms validated for one scanner model are much more likely to work well on other scanner models if the CT numbers have been standardized.
Summary
CT scanners measure a defined physical quantity, x-ray attenuation, and are thus inherently quantitative. However, the strong dependence of CT numbers on the x-ray beam spectrum has limited quantitative applications due to the many variations in spectra between scanner manufacturers and specific models. The use of dual- or multi-energy CT offers a solution to this quandary, as the measured data can be represented in terms of the attenuation at a specified photon energy, eliminating the dependence on tube potential and filtration. These virtual monoenergetic images, VMIs, stand to usher in a new era of quantitative CT imaging. Toward this end, the first commercial PCD-CT scanner uses VMIs as the primary image type produced by the scanner.
In addition, PCD-CT offers ultra-high spatial resolution at an unprecedented dose efficiency. The 125-micron limiting spatial resolution substantially decreases partial volume averaging and allows clear delineation of sub-mm structures. Thus, quantitation of size, shape, and other geometric parameters is more accurate than in conventional EID-CT. Together, the increased accuracy of attenuation and size and the standardization of attenuation measurements opens the door for clinical adoption of generalizable radiomics and artificial intelligence algorithms, where the current variations amongst scanner models finally can be overcome.
Conflicts of Interest and Source of Funding:
Portions of the work presented were supported by the National Institutes of Health under award number R01 EB028590. The content is solely the responsibility of the authors and does not necessarily represent the official views of the National Institute of Health. Research support for Cynthia McCollough is provided to Mayo Clinic from Siemens Healthcare GmbH. The other authors have no relevant conflicts of interest to disclose.
References
- 1.Beckmann EC. CT scanning the early days. Br J Radiol. 2006;79(937):5–8. [DOI] [PubMed] [Google Scholar]
- 2.Hounsfield GN. Computerized transverse axial scanning (tomography). 1. Description of system. Br J Radiol. 1973;46(552):1016–22. [DOI] [PubMed] [Google Scholar]
- 3.Cann CE. Quantitative CT applications: comparison of current scanners. Radiology. 1987;162(1 Pt 1):257–61. [DOI] [PubMed] [Google Scholar]
- 4.McCullough EC. Factors affecting the use of quantitative information from a CT scanner. Radiology. 1977;124(1):99–107. [DOI] [PubMed] [Google Scholar]
- 5.Zerhouni EA, Boukadoum M, Siddiky MA, et al. A standard phantom for quantitative CT analysis of pulmonary nodules. Radiology. 1983;149(3):767–73. [DOI] [PubMed] [Google Scholar]
- 6.Wang ZJ, Coakley FV, Fu Y, et al. Renal cyst pseudoenhancement at multidetector CT: what are the effects of number of detectors and peak tube voltage? Radiology. 2008;248(3):910–6. [DOI] [PMC free article] [PubMed] [Google Scholar]
- 7.Maki DD, Birnbaum BA, Chakraborty DP, et al. Renal cyst pseudoenhancement: beam-hardening effects on CT numbers. Radiology. 1999;213(2):468–72. [DOI] [PubMed] [Google Scholar]
- 8.Cropp RJ, Seslija P, Tso D, Thakur Y. Scanner and kVp dependence of measured CT numbers in the ACR CT phantom. J Appl Clin Med Phys. 2013;14(6):4417. [DOI] [PMC free article] [PubMed] [Google Scholar]
- 9.Bryant JA, Drage NA, Richmond S. CT number definition. Radiation Physics and Chemistry. 2012;81(4):358–61. [Google Scholar]
- 10.Goodsitt MM, Chan HP, Way TW, et al. Accuracy of the CT numbers of simulated lung nodules imaged with multi-detector CT scanners. Med Phys. 2006;33(8):3006–17. [DOI] [PMC free article] [PubMed] [Google Scholar]
- 11.McCullough EC, Morin RL. CT-number variability in thoracic geometry. AJR Am J Roentgenol. 1983;141(1):135–40. [DOI] [PubMed] [Google Scholar]
- 12.Levi C, Gray JE, McCullough EC, Hattery RR. The unreliability of CT numbers as absolute values. AJR Am J Roentgenol. 1982;139(3):443–7. [DOI] [PubMed] [Google Scholar]
- 13.Cann CE, Genant HK. Precise measurement of vertebral mineral content using computed tomography. J Comput Assist Tomogr. 1980;4(4):493–500. [DOI] [PubMed] [Google Scholar]
- 14.Rosenthal DI, Ganott MA, Wyshak G, et al. Quantitative computed tomography for spinal density measurement. Factors affecting precision. Invest Radiol. 1985;20(3):306–10. [DOI] [PubMed] [Google Scholar]
- 15.Agatston AS, Janowitz WR, Hildner FJ, et al. Quantification of coronary artery calcium using ultrafast computed tomography. J Am Coll Cardiol. 1990;15(4):827–32. [DOI] [PubMed] [Google Scholar]
- 16.McCollough CH, Ulzheimer S, Halliburton SS, et al. Coronary artery calcium: a multi-institutional, multimanufacturer international standard for quantification at cardiac CT. Radiology. 2007;243(2):527–38. [DOI] [PubMed] [Google Scholar]
- 17.Wexler L, Brundage B, Crouse J, et al. Coronary artery calcification: pathophysiology, epidemiology, imaging methods, and clinical implications. A statement for health professionals from the American Heart Association. Writing Group. Circulation. 1996;94(5):1175–92. [DOI] [PubMed] [Google Scholar]
- 18.Klotz E, Kalender W, Henschke F, Bayer T. Dual Energy CT and Morphometric Analysis of High Resolution CT Images for the Diagnosis of Bone Mineral Diseases. In: Lemke H, Rhodes ML, Jaffee CC, Felix R, eds. Computer Assisted Radiology / Computergestützte Radiologie, 1985//1985. Berlin, Heidelberg. Springer Berlin Heidelberg: 438–42. [Google Scholar]
- 19.Flohr TG, McCollough CH, Bruder H, et al. First performance evaluation of a dual-source CT (DSCT) system. Eur Radiol. 2006;16(2):256–68. [DOI] [PubMed] [Google Scholar]
- 20.Graser A, Johnson TR, Bader M, et al. Dual energy CT characterization of urinary calculi: initial in vitro and clinical experience. Invest Radiol. 2008;43(2):112–9. [DOI] [PubMed] [Google Scholar]
- 21.Graser A, Johnson TR, Chandarana H, Macari M. Dual energy CT: preliminary observations and potential clinical applications in the abdomen. Eur Radiol. 2009;19(1):13–23. [DOI] [PubMed] [Google Scholar]
- 22.McCollough CH, Boedeker K, Cody D, et al. Principles and applications of multienergy CT: Report of AAPM Task Group 291. Med Phys. 2020;47(7):e881–e912. [DOI] [PubMed] [Google Scholar]
- 23.Zhou W, Michalak GJ, Weaver JM, et al. A Universal Protocol for Abdominal CT Examinations Performed on a Photon-Counting Detector CT System: A Feasibility Study. Invest Radiol. 2020;55(4):226–32. [DOI] [PMC free article] [PubMed] [Google Scholar]
- 24.Gutjahr R, Halaweish AF, Yu Z, et al. Human Imaging With Photon Counting-Based Computed Tomography at Clinical Dose Levels: Contrast-to-Noise Ratio and Cadaver Studies. Invest Radiol. 2016;51(7):421–9. [DOI] [PMC free article] [PubMed] [Google Scholar]
- 25.Yu Z, Leng S, Jorgensen SM, et al. Evaluation of conventional imaging performance in a research whole-body CT system with a photon-counting detector array. Phys Med Biol. 2016;61(4):1572–95. [DOI] [PMC free article] [PubMed] [Google Scholar]
- 26.Euler A, Higashigaito K, Mergen V, et al. High-Pitch Photon-Counting Detector Computed Tomography Angiography of the Aorta: Intraindividual Comparison to Energy-Integrating Detector Computed Tomography at Equal Radiation Dose. Invest Radiol. 2022;57(2):115–21. [DOI] [PubMed] [Google Scholar]
- 27.Rajendran K, Petersilka M, Henning A, et al. First Clinical Photon-counting Detector CT System: Technical Evaluation. Radiology. 2022;303(1):130–8. [DOI] [PMC free article] [PubMed] [Google Scholar]
- 28.Flohr T, Schmidt B. Technical Basics and Clinical Benefits of Photon Counting CT. Invest Radiol. 2023;(In Press). [DOI] [PMC free article] [PubMed] [Google Scholar]
- 29.McCollough CH, Leng S, Yu L, Fletcher JG. Dual- and Multi-Energy CT: Principles, Technical Approaches, and Clinical Applications. Radiology. 2015;276(3):637–53. [DOI] [PMC free article] [PubMed] [Google Scholar]
- 30.Allmendinger T, Nowak T, Flohr T, et al. Photon-Counting Detector CT-Based Vascular Calcium Removal Algorithm: Assessment Using a Cardiac Motion Phantom. Invest Radiol. 2022;57(6):399–405. [DOI] [PMC free article] [PubMed] [Google Scholar]
- 31.Decker JA, Huber A, Senel F, et al. Anemia Detection by Hemoglobin Quantification on Contrast-enhanced Photon-counting CT Data Sets. Radiology. 2022:220063. [DOI] [PubMed] [Google Scholar]
- 32.Emrich T, Aquino G, Schoepf UJ, et al. Coronary Computed Tomography Angiography-Based Calcium Scoring: In Vitro and In Vivo Validation of a Novel Virtual Noniodine Reconstruction Algorithm on a Clinical, First-Generation Dual-Source Photon Counting-Detector System. Invest Radiol. 2022;57(8):536–43. [DOI] [PubMed] [Google Scholar]
- 33.Jungblut L, Sartoretti T, Kronenberg D, et al. Performance of virtual non-contrast images generated on clinical photon-counting detector CT for emphysema quantification: proof of concept. Br J Radiol. 2022;95(1135):20211367. [DOI] [PMC free article] [PubMed] [Google Scholar]
- 34.Lennartz S, Schoenbeck D, Kröger JR, et al. Photon-counting CT Material Decomposition: Initial Experience in Assessing Adrenal Adenoma. Radiology. 2022:220919. [DOI] [PubMed] [Google Scholar]
- 35.Mergen V, Racine D, Jungblut L, et al. Virtual Noncontrast Abdominal Imaging with Photon-counting Detector CT. Radiology. 2022;305(1):107–15. [DOI] [PubMed] [Google Scholar]
- 36.Mergen V, Sartoretti T, Klotz E, et al. Extracellular Volume Quantification With Cardiac Late Enhancement Scanning Using Dual-Source Photon-Counting Detector CT. Invest Radiol. 2022;57(6):406–11. [DOI] [PMC free article] [PubMed] [Google Scholar]
- 37.Sartoretti T, Mergen V, Higashigaito K, et al. Virtual Noncontrast Imaging of the Liver Using Photon-Counting Detector Computed Tomography: A Systematic Phantom and Patient Study. Invest Radiol. 2022;57(7):488–93. [DOI] [PubMed] [Google Scholar]
- 38.Sartoretti T, Mergen V, Jungblut L, et al. Liver Iodine Quantification With Photon-Counting Detector CT: Accuracy in an Abdominal Phantom and Feasibility in Patients. Acad Radiol. 2022. [DOI] [PubMed] [Google Scholar]
- 39.Cormode DP, Roessl E, Thran A, et al. Atherosclerotic plaque composition: analysis with multicolor CT and targeted gold nanoparticles. Radiology. 2010;256(3):774–82. [DOI] [PMC free article] [PubMed] [Google Scholar]
- 40.Feuerlein S, Roessl E, Proksa R, et al. Multienergy photon-counting K-edge imaging: potential for improved luminal depiction in vascular imaging. Radiology. 2008;249(3):1010–6. [DOI] [PubMed] [Google Scholar]
- 41.Roessl E, Proksa R. K-edge imaging in x-ray computed tomography using multi-bin photon counting detectors. Phys Med Biol. 2007;52(15):4679–96. [DOI] [PubMed] [Google Scholar]
- 42.Schlomka JP, Roessl E, Dorscheid R, et al. Experimental feasibility of multi-energy photon-counting K-edge imaging in pre-clinical computed tomography. Phys Med Biol. 2008;53(15):4031–47. [DOI] [PubMed] [Google Scholar]
- 43.Si-Mohamed SA, Sigovan M, Hsu JC, et al. In Vivo Molecular K-Edge Imaging of Atherosclerotic Plaque Using Photon-counting CT. Radiology. 2021;300(1):98–107. [DOI] [PMC free article] [PubMed] [Google Scholar]
- 44.Ren L, Huber N, Rajendran K, et al. Dual-Contrast Biphasic Liver Imaging With Iodine and Gadolinium Using Photon-Counting Detector Computed Tomography: An Exploratory Animal Study. Invest Radiol. 2022;57(2):122–9. [DOI] [PMC free article] [PubMed] [Google Scholar]
- 45.Dangelmaier J, Bar-Ness D, Daerr H, et al. Experimental feasibility of spectral photon-counting computed tomography with two contrast agents for the detection of endoleaks following endovascular aortic repair. Eur Radiol. 2018;28(8):3318–25. [DOI] [PMC free article] [PubMed] [Google Scholar]
- 46.Muenzel D, Bar-Ness D, Roessl E, et al. Spectral Photon-counting CT: Initial Experience with Dual-Contrast Agent K-Edge Colonography. Radiology. 2017;283(3):723–8. [DOI] [PubMed] [Google Scholar]
- 47.Ren L, Rajendran K, Fletcher JG, et al. Simultaneous Dual-Contrast Imaging of Small Bowel With Iodine and Bismuth Using Photon-Counting-Detector Computed Tomography: A Feasibility Animal Study. Invest Radiol. 2020;55(10):688–94. [DOI] [PMC free article] [PubMed] [Google Scholar]
- 48.Si-Mohamed S, Thivolet A, Bonnot PE, et al. Improved Peritoneal Cavity and Abdominal Organ Imaging Using a Biphasic Contrast Agent Protocol and Spectral Photon Counting Computed Tomography K-Edge Imaging. Invest Radiol. 2018;53(10):629–39. [DOI] [PMC free article] [PubMed] [Google Scholar]
- 49.Symons R, Cork TE, Lakshmanan MN, et al. Dual-contrast agent photon-counting computed tomography of the heart: initial experience. Int J Cardiovasc Imaging. 2017;33(8):1253–61. [DOI] [PubMed] [Google Scholar]
- 50.Flohr T, Petersilka M, Henning A, et al. Photon-counting CT review. Phys Med. 2020;79:126–36. [DOI] [PubMed] [Google Scholar]
- 51.Taguchi K, Iwanczyk JS. Vision 20/20: Single photon counting x-ray detectors in medical imaging. Med Phys. 2013;40(10):100901. [DOI] [PMC free article] [PubMed] [Google Scholar]
- 52.Yu Z, Leng S, Kappler S, et al. Noise performance of low-dose CT: comparison between an energy integrating detector and a photon counting detector using a whole-body research photon counting CT scanner. J Med Imaging (Bellingham). 2016;3(4):043503. [DOI] [PMC free article] [PubMed] [Google Scholar]
- 53.Leng S, Bruesewitz M, Tao S, et al. Photon-counting Detector CT: System Design and Clinical Applications of an Emerging Technology. Radiographics. 2019;39(3):729–43. [DOI] [PMC free article] [PubMed] [Google Scholar]
- 54.Bartlett DJ, Koo CW, Bartholmai BJ, et al. High-Resolution Chest Computed Tomography Imaging of the Lungs: Impact of 1024 Matrix Reconstruction and Photon-Counting Detector Computed Tomography. Invest Radiol. 2019;54(3):129–37. [DOI] [PMC free article] [PubMed] [Google Scholar]
- 55.Leng S, Rajendran K, Gong H, et al. 150-mum Spatial Resolution Using Photon-Counting Detector Computed Tomography Technology: Technical Performance and First Patient Images. Invest Radiol. 2018;53(11):655–62. [DOI] [PMC free article] [PubMed] [Google Scholar]
- 56.Mannil M, Hickethier T, von Spiczak J, et al. Photon-Counting CT: High-Resolution Imaging of Coronary Stents. Invest Radiol. 2018;53(3):143–9. [DOI] [PubMed] [Google Scholar]
- 57.Mergen V, Sartoretti T, Baer-Beck M, et al. Ultra-High-Resolution Coronary CT Angiography With Photon-Counting Detector CT: Feasibility and Image Characterization. Invest Radiol. 2022. [DOI] [PMC free article] [PubMed] [Google Scholar]
- 58.Pourmorteza A, Symons R, Henning A, et al. Dose Efficiency of Quarter-Millimeter Photon-Counting Computed Tomography: First-in-Human Results. Invest Radiol. 2018;53(6):365–72. [DOI] [PubMed] [Google Scholar]
- 59.Thomsen FSL, Horstmeier S, Niehoff JH, et al. Effective Spatial Resolution of Photon Counting CT for Imaging of Trabecular Structures is Superior to Conventional Clinical CT and Similar to High Resolution Peripheral CT. Invest Radiol. 2022;57(9):620–6. [DOI] [PubMed] [Google Scholar]
- 60.von Spiczak J, Mannil M, Peters B, et al. Photon Counting Computed Tomography With Dedicated Sharp Convolution Kernels: Tapping the Potential of a New Technology for Stent Imaging. Invest Radiol. 2018;53(8):486–94. [DOI] [PubMed] [Google Scholar]
- 61.Flohr TG, Stierstorfer K, Süss C, et al. Novel ultrahigh resolution data acquisition and image reconstruction for multi-detector row CT. Med Phys. 2007;34(5):1712–23. [DOI] [PubMed] [Google Scholar]
- 62.Benson JC, Rajendran K, Lane JI, et al. A New Frontier in Temporal Bone Imaging: Photon-Counting Detector CT Demonstrates Superior Visualization of Critical Anatomic Structures at Reduced Radiation Dose. AJNR Am J Neuroradiol. 2022;43(4):579–84. [DOI] [PMC free article] [PubMed] [Google Scholar]
- 63.Rajendran K, Voss BA, Zhou W, et al. Dose Reduction for Sinus and Temporal Bone Imaging Using Photon-Counting Detector CT With an Additional Tin Filter. Invest Radiol. 2020;55(2):91–100. [DOI] [PMC free article] [PubMed] [Google Scholar]
- 64.Eggesbø HB. Imaging of sinonasal tumours. Cancer Imaging. 2012;12:136–52. [DOI] [PMC free article] [PubMed] [Google Scholar]
- 65.MacMahon H, Naidich DP, Goo JM, et al. Guidelines for Management of Incidental Pulmonary Nodules Detected on CT Images: From the Fleischner Society 2017. Radiology. 2017;284(1):228–43. [DOI] [PubMed] [Google Scholar]
- 66.Kosciuch J, Krenke R, Gorska K, et al. Relationship between airway wall thickness assessed by high-resolution computed tomography and lung function in patients with asthma and chronic obstructive pulmonary disease. J Physiol Pharmacol. 2009;60 Suppl 5:71–6. [PubMed] [Google Scholar]
- 67.Zhao Y, Hernandez AM, Boone JM, Molloi S. Quantification of airway dimensions using a high-resolution CT scanner: A phantom study. Med Phys. 2021;48(10):5874–83. [DOI] [PubMed] [Google Scholar]
- 68.Si-Mohamed S, Boccalini S, Rodesch PA, et al. Feasibility of lung imaging with a large field-of-view spectral photon-counting CT system. Diagn Interv Imaging. 2021;102(5):305–12. [DOI] [PubMed] [Google Scholar]
- 69.Zhou W, Montoya J, Gutjahr R, et al. Lung nodule volume quantification and shape differentiation with an ultra-high resolution technique on a photon-counting detector computed tomography system. J Med Imaging (Bellingham). 2017;4(4):043502. [DOI] [PMC free article] [PubMed] [Google Scholar]
- 70.Jungblut L, Bluthgen C, Polacin M, et al. First Performance Evaluation of an Artificial Intelligence-Based Computer-Aided Detection System for Pulmonary Nodule Evaluation in Dual-Source Photon-Counting Detector CT at Different Low-Dose Levels. Invest Radiol. 2022;57(2):108–14. [DOI] [PubMed] [Google Scholar]
- 71.Jungblut L, Kronenberg D, Mergen V, et al. Impact of Contrast Enhancement and Virtual Monoenergetic Image Energy Levels on Emphysema Quantification: Experience With Photon-Counting Detector Computed Tomography. Invest Radiol. 2022;57(6):359–65. [DOI] [PubMed] [Google Scholar]
- 72.Kopp FK, Daerr H, Si-Mohamed S, et al. Evaluation of a preclinical photon-counting CT prototype for pulmonary imaging. Sci Rep. 2018;8(1):17386. [DOI] [PMC free article] [PubMed] [Google Scholar]
- 73.Inoue A, Johnson TF, White D, et al. Estimating the Clinical Impact of Photon-Counting-Detector CT in Diagnosing Usual Interstitial Pneumonia. Invest Radiol. 2022. [DOI] [PubMed] [Google Scholar]
- 74.Jungblut L, Euler A, von Spiczak J, et al. Potential of Photon-Counting Detector CT for Radiation Dose Reduction for the Assessment of Interstitial Lung Disease in Patients With Systemic Sclerosis. Invest Radiol. 2022. [DOI] [PMC free article] [PubMed] [Google Scholar]
- 75.Dunning CAS, Marsh J Jr., Winfree T, et al. Accuracy of nodule volume and airway wall thickness measurement using low-dose chest CT on a photon-counting-detector (PCD) CT scanner. Invest Radiol. 2022;In Press. [DOI] [PMC free article] [PubMed] [Google Scholar]
- 76.Rajendran K, Baffour F, Powell G, et al. Improved visualization of the wrist at lower radiation dose with photon-counting-detector CT. Skeletal Radiol. 2022. [DOI] [PubMed] [Google Scholar]
- 77.Baffour FI, Rajendran K, Glazebrook KN, et al. Ultra-high-resolution imaging of the shoulder and pelvis using photon-counting-detector CT: a feasibility study in patients. Eur Radiol. 2022;32(10):7079–86. [DOI] [PMC free article] [PubMed] [Google Scholar]
- 78.Baffour FI, Huber NR, Ferrero A, et al. Photon-counting Detector CT with Deep Learning Noise Reduction to Detect Multiple Myeloma. Radiology. 2022:220311. [DOI] [PMC free article] [PubMed] [Google Scholar]
- 79.Euler A, Nowak T, Bucher B, et al. Assessment of Bone Mineral Density From a Computed Tomography Topogram of Photon-Counting Detector Computed Tomography-Effect of Phantom Size and Tube Voltage. Invest Radiol. 2021;56(10):614–20. [DOI] [PubMed] [Google Scholar]
- 80.Nowak T, Eberhard M, Schmidt B, et al. Bone Mineral Density Quantification from Localizer Radiographs: Accuracy and Precision of Energy-integrating Detector CT and Photon-counting Detector CT. Radiology. 2021;298(1):147–52. [DOI] [PubMed] [Google Scholar]
- 81.Rajendran K, Löbker C, Schon BS, et al. Quantitative imaging of excised osteoarthritic cartilage using spectral CT. Eur Radiol. 2017;27(1):384–92. [DOI] [PubMed] [Google Scholar]
- 82.Rajendran K, Murthy NS, Frick MA, et al. Quantitative Knee Arthrography in a Large Animal Model of Osteoarthritis Using Photon-Counting Detector CT. Invest Radiol. 2020;55(6):349–56. [DOI] [PMC free article] [PubMed] [Google Scholar]
- 83.Leng S, Yu Z, Halaweish A, et al. Dose-efficient ultrahigh-resolution scan mode using a photon counting detector computed tomography system. J Med Imaging (Bellingham). 2016;3(4):043504. [DOI] [PMC free article] [PubMed] [Google Scholar]
- 84.Koons E, VanMeter P, Rajendran K, et al. Improved assessment of coronary artery luminal stenosis with heavy calcifications using high-resolution photon-counting detector CT. Proc. SPIE 12031, Medical Imaging 2022: Physics of Medical Imaging, 2022. San Diego, California, United States. SPIE. [Google Scholar]
- 85.Ahmed Z, Rajendran K, Gong H, et al. Quantitative assessment of motion effects in dual-source dual energy CT and dual-source photon-counting detector CT. Proc. SPIE 12031, Medical Imaging 2022: Physics of Medical Imaging, 2022. San Diego, California, United States. SPIE. [DOI] [PMC free article] [PubMed] [Google Scholar]
- 86.Marsh J Jr., VanMeter P, Rajendran K, et al. Ex vivo coronary calcium volume quantification using a high-spatial-resolution clinical photon-counting-detector CT. J Med Imaging (Bellingham). 2022;Blinded. [DOI] [PMC free article] [PubMed] [Google Scholar]
- 87.Sandstedt M, Marsh J Jr., Rajendran K, et al. Improved coronary calcification quantification using photon-counting-detector CT: an ex vivo study in cadaveric specimens. Eur Radiol. 2021;31(9):6621–30. [DOI] [PMC free article] [PubMed] [Google Scholar]
- 88.Eberhard M, Mergen V, Higashigaito K, et al. Coronary Calcium Scoring with First Generation Dual-Source Photon-Counting CT-First Evidence from Phantom and In-Vivo Scans. Diagnostics (Basel). 2021;11(9). [DOI] [PMC free article] [PubMed] [Google Scholar]
- 89.van der Werf NR, Booij R, Greuter MJW, et al. Reproducibility of coronary artery calcium quantification on dual-source CT and dual-source photon-counting CT: a dynamic phantom study. Int J Cardiovasc Imaging. 2022. [DOI] [PMC free article] [PubMed] [Google Scholar]
- 90.Tao S, Sheedy E, Bruesewitz M, et al. Technical Note: kV-independent coronary calcium scoring: A phantom evaluation of score accuracy and potential radiation dose reduction. Med Phys. 2021;48(3):1307–14. [DOI] [PMC free article] [PubMed] [Google Scholar]
- 91.Vingiani V, Abadia AF, Schoepf UJ, et al. Low-kV coronary artery calcium scoring with tin filtration using a kV-independent reconstruction algorithm. J Cardiovasc Comput Tomogr. 2020;14(3):246–50. [DOI] [PubMed] [Google Scholar]
- 92.van der Werf NR, Si-Mohamed S, Rodesch PA, et al. Coronary calcium scoring potential of large field-of-view spectral photon-counting CT: a phantom study. Eur Radiol. 2022;32(1):152–62. [DOI] [PMC free article] [PubMed] [Google Scholar]
- 93.Goodsitt MM, Christodoulou EG, Larson SC. Accuracies of the synthesized monochromatic CT numbers and effective atomic numbers obtained with a rapid kVp switching dual energy CT scanner. Med Phys. 2011;38(4):2222–32. [DOI] [PubMed] [Google Scholar]
- 94.Matsumoto K, Jinzaki M, Tanami Y, et al. Virtual monochromatic spectral imaging with fast kilovoltage switching: improved image quality as compared with that obtained with conventional 120-kVp CT. Radiology. 2011;259(1):257–62. [DOI] [PubMed] [Google Scholar]
- 95.Yu L, Christner JA, Leng S, et al. Virtual monochromatic imaging in dual-source dual-energy CT: radiation dose and image quality. Med Phys. 2011;38(12):6371–9. [DOI] [PMC free article] [PubMed] [Google Scholar]
- 96.Yu L, Leng S, McCollough CH. Dual-energy CT-based monochromatic imaging. AJR Am J Roentgenol. 2012;199(5 Suppl):S9–s15. [DOI] [PubMed] [Google Scholar]
- 97.Leng S, Yu L, Fletcher JG, McCollough CH. Maximizing Iodine Contrast-to-Noise Ratios in Abdominal CT Imaging through Use of Energy Domain Noise Reduction and Virtual Monoenergetic Dual-Energy CT. Radiology. 2015;276(2):562–70. [DOI] [PMC free article] [PubMed] [Google Scholar]
- 98.Pinho DF, Kulkarni NM, Krishnaraj A, et al. Initial experience with single-source dual-energy CT abdominal angiography and comparison with single-energy CT angiography: image quality, enhancement, diagnosis and radiation dose. Eur Radiol. 2013;23(2):351–9. [DOI] [PubMed] [Google Scholar]
- 99.Zhang D, Li X, Liu B. Objective characterization of GE discovery CT750 HD scanner: gemstone spectral imaging mode. Med Phys. 2011;38(3):1178–88. [DOI] [PubMed] [Google Scholar]
- 100.Michalak G, Grimes J, Fletcher J, et al. Technical Note: Improved CT number stability across patient size using dual-energy CT virtual monoenergetic imaging. Med Phys. 2016;43(1):513. [DOI] [PubMed] [Google Scholar]
- 101.Mileto A, Barina A, Marin D, et al. Virtual Monochromatic Images from Dual-Energy Multidetector CT: Variance in CT Numbers from the Same Lesion between Single-Source Projection-based and Dual-Source Image-based Implementations. Radiology. 2016;279(1):269–77. [DOI] [PubMed] [Google Scholar]
- 102.Jacobsen MC, Cressman ENK, Tamm EP, et al. Dual-Energy CT: Lower Limits of Iodine Detection and Quantification. Radiology. 2019;292(2):414–9. [DOI] [PMC free article] [PubMed] [Google Scholar]
- 103.Jacobsen MC, Schellingerhout D, Wood CA, et al. Intermanufacturer Comparison of Dual-Energy CT Iodine Quantification and Monochromatic Attenuation: A Phantom Study. Radiology. 2018;287(1):224–34. [DOI] [PubMed] [Google Scholar]
- 104.Jacobsen MC, Thrower SL, Ger RB, et al. Multi-energy computed tomography and material quantification: Current barriers and opportunities for advancement. Med Phys. 2020;47(8):3752–71. [DOI] [PMC free article] [PubMed] [Google Scholar]
- 105.Leng S, Zhou W, Yu Z, et al. Spectral performance of a whole-body research photon counting detector CT: quantitative accuracy in derived image sets. Phys Med Biol. 2017;62(17):7216–32. [DOI] [PMC free article] [PubMed] [Google Scholar]
- 106.Yu L, Li H, Fletcher JG, McCollough CH. Automatic selection of tube potential for radiation dose reduction in CT: a general strategy. Med Phys. 2010;37(1):234–43. [DOI] [PubMed] [Google Scholar]
- 107.Li M, Feng S, Wu N, Zhang L. Scout-Based Automated Tube Potential Selection Technique (kV Assist) in Enhanced Chest Computed Tomography: Effects on Radiation Exposure and Image Quality. J Comput Assist Tomogr. 2017;41(3):442–5. [DOI] [PubMed] [Google Scholar]
- 108.Albrecht MH, Trommer J, Wichmann JL, et al. Comprehensive Comparison of Virtual Monoenergetic and Linearly Blended Reconstruction Techniques in Third-Generation Dual-Source Dual-Energy Computed Tomography Angiography of the Thorax and Abdomen. Invest Radiol. 2016;51(9):582–90. [DOI] [PubMed] [Google Scholar]
- 109.Lee SM, Kim SH, Ahn SJ, et al. Virtual monoenergetic dual-layer, dual-energy CT enterography: optimization of keV settings and its added value for Crohn’s disease. Eur Radiol. 2018;28(6):2525–34. [DOI] [PubMed] [Google Scholar]
- 110.Emrich T, O’Doherty J, Schoepf UJ, et al. Reduced Iodinated Contrast Media Administration in Coronary CT Angiography on a Clinical Photon-Counting Detector CT System: A Phantom Study Using a Dynamic Circulation Model. Invest Radiol. 2022. [DOI] [PubMed] [Google Scholar]
- 111.Racine D, Mergen V, Viry A, et al. Photon-Counting Detector CT With Quantum Iterative Reconstruction: Impact on Liver Lesion Detection and Radiation Dose Reduction. Invest Radiol. 2022. [DOI] [PubMed] [Google Scholar]