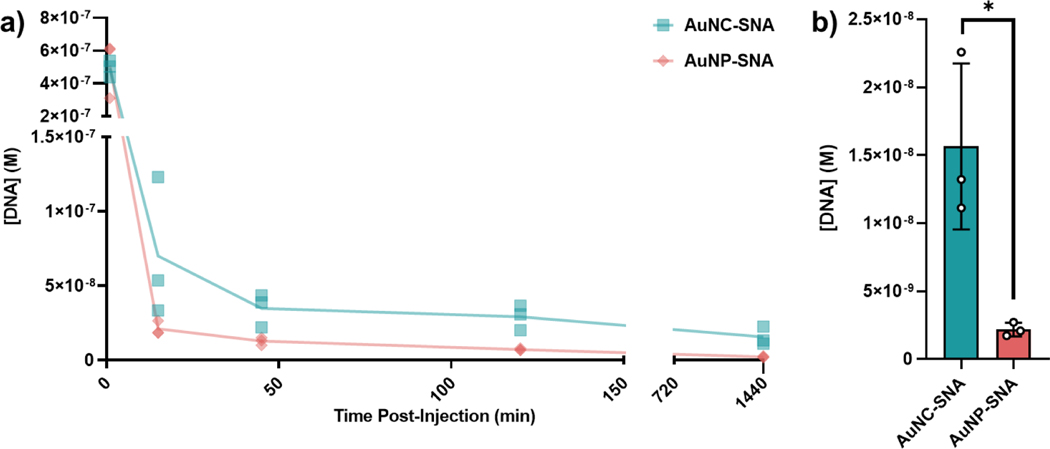
Figure 4. Blood circulation of AuNC-SNAs and AuNP-SNAs.
a) DNA blood concentration as a function of time post-IV injection when delivered as AuNC-SNAs (blue) or AuNP-SNAs (peach). Dots represent biological replicates. b) Final DNA blood concentration at 24 h post-injection. Error bars represent the standard deviation of 3 biological replicates. Statistical analysis was performed using an unpaired t-test, where “*” represents a P value of <0.05.

