

Abstract
In celiac disease (CeD), gastrointestinal CYP3A4 abundance and morphology is affected by the severity of disease. Therefore, exposure to CYP3A4 substrates and extent of drug interactions is altered. A physiologically‐based pharmacokinetic (PBPK) population for different severities of CeD was developed. Gastrointestinal physiology parameters, such as luminal pH, transit times, morphology, P‐gp, and CYP3A4 expression were included in development of the CeD population. Data on physiological difference between healthy and CeD subjects were incorporated into the model as the ratio of celiac to healthy. A PBPK model was developed and verified for felodipine extended‐release tablet in healthy volunteers (HVs) and then utilized to verify the CeD populations. Plasma concentration‐time profile and PK parameters were predicted and compared against those observed in both groups. Sensitivity analysis was carried out on key system parameters in CeD to understand their impact on drug exposure. For felodipine, the predicted mean concentration‐time profiles and 5th and 95th percentile intervals captured the observed profile and variability in the HV and CeD populations. Predicted and observed clearance was 56.9 versus 56.1 (L/h) in HVs. Predicted versus observed mean ± SD area under the curve for extended release felodipine in different severities of CeD were values of 14.5 ± 9.6 versus 14.4 ± 2.1, 14.6 ± 9.0 versus 17.2 ± 2.8, and 28.1 ± 13.5 versus 25.7 ± 5.0 (ng.h/mL), respectively. Accounting for physiology differences in a CeD population accurately predicted the PK of felodipine. The developed CeD population can be applied for determining the drug concentration of CYP3A substrates in the gut as well as for systemic levels, and for application in drug–drug interaction studies.
Study Highlights.
WHAT IS THE CURRENT KNOWLEDGE ON THE TOPIC?
It is known that celiac disease (CeD) results in the alteration of intestinal CYP3A4 expression as well as other physiological changes and may affect pharmacokinetics of drugs, such as felodipine.
WHAT QUESTION DID THIS STUDY ADDRESS?
This study tried to develop a thoroughly qualified and verified physiologically‐based pharmacokinetic (PBPK) model of celiac disease population to establish the model‐informed drug development for drugs that are CYP3A4 using a PBPK platform.
WHAT DOES THIS STUDY ADD TO OUR KNOWLEDGE?
This study establishes a verified CeD PBPK model along with a prototypical CYP3A4 substrate drug felodipine and helps us understand the extent of the CeD effect on the systemic as well as relevant local intestinal tissue concentrations.
HOW MIGHT THIS CHANGE DRUG DISCOVERY, DEVELOPMENT, AND/OR THERAPEUTICS?
The CeD PBPK model has several applications, especially in the prediction of, among others, CYP3A4 substrate drug concentrations at a local tissue site, such as gut as well as systemic, and would aid in the appropriate dose selections and study designs in the disease populations or proof of concept studies. Further, this CeD population PBPK model can also be used to predict any drug–drug interactions (DDIs), especially involving CYP3A or even other physiological changes which have been incorporated in this CeD population model as actual clinical DDI studies are not ethically feasible.
INTRODUCTION
Celiac disease (CeD) is an inflammatory autoimmune condition which occurs in people who become sensitive to a dietary protein called gluten. The worldwide prevalence of CeD has been shown to be 1.4% based on blood tests and 0.7% based on biopsy results. 1 According to the National Institute for Health and Care Excellence (NICE) guidelines, the only effective treatment for CeD is a strict, life‐long, gluten‐free diet. 2 CeD can reduce absorption of nutrients and orally administered drugs due to changes in gastrointestinal (GI) tract physiology. For example, the surface area available for absorption is substantially reduced due to villous atrophy. 3 A few studies report altered rate, extent of absorption and bioavailability for methyldopa, 4 propranolol and folic acid, 5 salicylate and indomethacin, 6 and simvastatin 7 in patients with CeD. Although villous atrophy is reversible with a gluten‐free diet, CYP3A4 enzyme expression is significantly reduced in severe atrophy. CYP3A4 is the most abundant enzyme in the small intestinal wall and is responsible for metabolism of many drugs. Chretien et al. 8 investigated the effect of CeD severity on the pharmacokinetics (PKs) of felodipine, a sensitive CYP3A4 substrate, in a clinical study and showed an increase in felodipine area under the curve (AUC)0–8 and maximum plasma concentration (C max) with increasing severity of disease.
Physiologically‐based pharmacokinetic (PBPK) models accounting for physiological differences between healthy and diseased populations, present a new opportunity to investigate the PKs, and drug–drug interaction (DDI) liability, and bioequivalence of drugs. Gorostiola González et al. 9 developed a virtual celiac population in Simcyp V14 and compared the absorption of four drugs with different physicochemical properties (desipramine, clozapine, digoxin, and warfarin) between healthy and celiac subjects. However, they did not focus on verification and performance of the population.
The aim of the current study is to develop a CeD population in Simcyp for different severities of CeD and to undertake performance verification of these populations using felodipine extended‐release tablets. For this, CeD populations and felodipine PBPKs were developed and verified. Further, this study investigates the potential applications of CeD populations including predicting and understanding drug interaction, requirement for dose adjustments, and local tissue concentrations in small the intestine for PK‐pharmacodynamic relationships.
METHODS
Literature search and database compilation for development of celiac population
A comprehensive literature search was carried out using PubMed and Google Scholar to identify the demographic and system parameters that are affected by CeD. The search criteria included “age,” “weight,” “height,” “sex,” “plasma protein,” “hematocrit,” “GFR,” “gastric pH,” “intestinal pH,” “gastric emptying time,” “small intestinal transit time,”, “villous height,” “crypt depth,” “pore radius,” “unstirred boundary thickness,” “CYP3A4 abundance,” “P‐glycoprotein expression,” and “gall bladder volume.” All the articles retrieved were screened for relevance and the reference lists scanned to identify additional applicable articles. Data were also collated where reported for treated and untreated CeD with a gluten‐free diet or different severities of disease based on the Marsh classification. 10 , 11 In the final analysis, and in order to simulate the study by Chretien et al. 8 patients with asymptomatic CeD or Marsh classification 0, were considered as healthy, treated patients with CeD with gluten‐free diet or Marsh classification 1, 2, and 3a were considered as treated (population B + C) and Marsh classification 3b and 3c were considered as untreated (population D).
For all physiological parameters for which difference between healthy and CeD subjects was reported, a ratio of the reported parameter in celiac to the healthy controls in that study was calculated. Where adequate data were available, a meta‐analysis was carried out on these ratios to calculate a weighted mean and standard deviation (SD) of the ratio for that parameter. The methodology for this meta‐analysis is explained by Howgate et al. 12 For consistency and feasibility of prediction comparison between healthy and celiac populations, the ratio of celiac versus healthy was applied to the mean values of Sim‐Healthy Volunteers library in Simcyp simulator V21 to obtain values for celiac subjects. To consider the impact of disease on interindividual variability, the ratio of celiac: healthy SD was applied to the coefficient of variance (CV) values of Sim‐Healthy Volunteers library.
Small intestine transit time was not directly reported in the literature for CeD subjects. The knowledge of gastric residence time was used combined with mouth to colon transit time to estimate the intestinal transit time.
Modeling strategy for development of felodipine extended release PBPK model
The exemplified learn and confirm approach 13 was used in development and verification of the felodipine PBPK model in healthy adults. Then, the model was used to verify the CeD population. The general approach is summarized in Figure 1.
FIGURE 1.
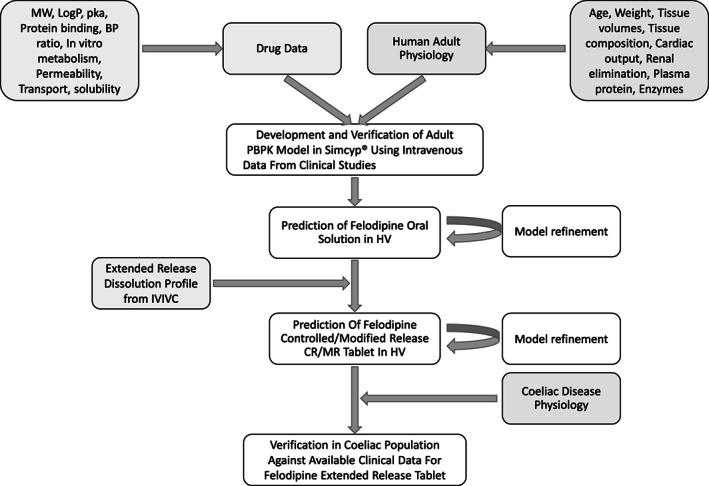
Modeling strategy for development and verification of a celiac disease population using felodipine extended‐release tablet PBPK model. BP, blood pressure; CR/MR, controlled/modified release; HV, healthy volunteer; IVIVC, in vitro‐in vivo correlation; MW, molecular weight; PBPK, physiologically‐based pharmacokinetic.
The rationale for selecting felodipine as a model drug was that it is a CYP3A4 substrate and several clinical data sets are available in healthy volunteers (HVs) as well as different severities of CeD. A literature search was performed to identify clinical studies reporting PK data for felodipine in the HV and celiac populations.
Compound file development
A PBPK model was developed and verified for intravenous felodipine in Simcyp V21. The physicochemical and model parameters used in the model are reported in Table 1.
TABLE 1.
Input parameters for development of felodipine PBPK model.
| Parameter | Value | References | |
|---|---|---|---|
| Physchem parameter | MW | 384.20 | 14 |
| Log P o:w | 4.18 | 14, 15 | |
| Compound type | Neutral | 16 | |
| B/P | 0.7 | 16, 17 | |
| Follow‐up | 0.0048 | 16 | |
| Main plasma binding protein | HSA | Assumed | |
| Absorption | ADAM | Consider extended‐release formulation option | |
| Fugut | 0.12 | Fitted to capture FG of around 0.4 d | |
| Log (Km:w) | 4.805 | Fitted in SIVA to solubility data (see Appendix S1) | |
| MechPeff model | Total concentration (Bound + Unbound) e | ||
| P trans,0 (10−6 cm/s) | 93,522 | LogP Method 2 | |
| Regional Permeability, P eff (10−4 cm/s) (no micelles) |
Duodenum = 12.0 Jejunum I = 19.0 Jejunum II = 13.1 Ileum I = 2.7 Ileum II = 2.7 Ileum III = 2.7 Ileum IV = 2.6 Colon = 0.83 |
Predicted with the MechPeff Model | |
| Absorption rate scalars, Global a | 5.68 | Based on lactulose: mannitol clinical studies | |
| Formulation | Monolith controlled/modified release (CR/MR) | ||
| Dissolution data | Dissolution profile | Estimated b | |
| Transit time | Segregated transit times c | Values related to CeD population is in Table S2 | |
| Distribution | Full PBPK | ||
| Vss (L/kg) (Landahl1988) | 2.41 | Predicted | |
| Kp method | Predicted with method 2 | ||
| Kp scalar estimated to fit i.v. infusion data | 0.6685 | Optimized for best fit with i.v. data | |
| Elimination | CLiv (L/h) | 49.4 | 18 |
| CLpo (L/h) | 619 | 19 | |
| CLint CYP3A4 (μL/min/pmol of CYP3A4) | 83.1485 | Predicted from CLiv | |
| fm CYP3A4 (%) | 100 | 20 | |
| Renal clearance (L/h) | 49.4 | 18 |
Abbreviations: ADAM, advanced dissolution, absorption, and metabolism; CeD, celiac disease; CL, clearance; IVIVC, in vitro‐in vivo correlation; MW, molecular weight; PBPK, physiologically‐based pharmacokinetic.
Applied only in severe CeD to account for leakiness of small intestine in moderate and severe villous atrophy. 21
Predicted through IVIVC in Simcyp V21 and presented in Table S3.
Updated in celiac disease.
Total concentration is used considering both free and bound drug to bile salt micelles.
Absorption
The advanced dissolution, absorption, and metabolism (ADAM) model 25 was used to predict felodipine oral absorption. Depending on the formulation and trial design, additional models, such as segregated transit time, fluid dynamic, and food staggering, within ADAM was applied. The diseased physiology was utilized in food staggering and fluid dynamic model. The model was initially developed for a solution formulation and then further developed to predict the absorption from the extended‐release tablet formulation.
Felodipine is a low solubility compound (aqueous solubility = 19.7 mg/L) but is freely soluble in DMSO (30 mg/mL) and ethanol (20 mg/mL). 26 It is a lipophilic compound with reported logP values ranging from 3.86 to 4.5 and has a high permeability. Apparent permeability for this compound has been reported in vitro for Caco‐2 (5.1 and 42 × 10−6 cm/s) and for Madin Darby canine kidney transfected with the human MDR1 gene (139 × 10−6 cm/s). 27 , 28 However, in the current study, permeability was predicted using the MechPeff model with P trans,0 of 93,522 × 10−6 cm/s predicted from LogP using method 2 in Simcyp V21. 29
Equation 1 was used in Mechpeff model for P eff,man prediction.
| (1) |
Selection of the MechPeff permeability model was based on the ability to include gut morphological differences between healthy subjects and patients with CeD (the model explicitly included villous dimensions (surface area enhancement) within its algorithm and therefore can be adjusted to account for villous atrophy in patients with CeD).
Partitioning into bile micelles (LogKm:w)
Felodipine is a lipophilic compound. Several studies report its solubility in biorelevant media (fasted and fed HIF, fasted state simulated intestinal fluid, and fed state simulated intestinal fluid). Table S1 summarizes the reported solubility in these media. Using these data at different pH values and bile salt concentrations, the micelle:water partition coefficient for the neutral species (Km:w) was estimated using SIVA V4 and input into Simcyp. Because felodipine is a neutral compound the ionized species Km:w is not relevant.
In vitro‐in vivo correlation to get the dissolution profile
Two stage in vitro‐in vivo correlation (IVIVC) was carried out to estimate the Weibull parameters (Fmax, alpha and beta) for an API release profile for a Monolithic system, the Controlled/Modified Release formulation option. HV's data for the extended‐release formulation from the study of Chretien et al. 8 were used to predict the in vivo dissolution profile. The in vitro data 30 are used in the IVIVC development. The estimated dissolution profile was directly input to the ADAM dissolution option for controlled/modified release formulations for making forward simulations.
Simulations' trial design
All simulations were undertaken using Simcyp V21.1 (Certara UK Limited). Simulations were carried out using a trial design matched as closely as possible to the clinical study for age range, number of individuals, proportion of males and female subjects, dose and dosing intervals and duration of study, formulation, and fasted or fed condition. For the prandial state, wherever the study design indicated, food was administered 4 h after dose using the food staggering model in the simulator. This required more complex models to be utilized, such as segregated transit time (STT), food staggering, advanced dynamic bile salt model, and advanced fluid volume dynamics. These models allow the simulations to include food effects dynamically during the simulation switching smoothly between fasted and fed states per the trial design. Also considered are the effect of partitioning of drug into bile salts micelles in different prandial states, and pH and blood flow changes after food ingestion. To assess population sampling issues, simulations are carried out using 10 repeat trials of the number of individuals specified in a clinical study. The observed mean and SD for plasma concentration‐time profiles were digitized from the literature references using Digit 1.0.4 and overlaid in the simulation results.
In CeD simulations, three populations with different severities of CeD were simulated according to the study by Chretien et al. 8 A modified Marsh‐Oberhuber classification: 0 = normal; 1 = increased intraepithelial lymphocytes (IELs) only; 2 = increased IELs with crypt hyperplasia; and 3a–c = increased IELs with mild (3a), marked (3b), or complete (3c) villous atrophy was used. 8 Populations A (normal, whose GI tract parameters were almost healthy), B + C (or treated with gluten‐free diet classes 1, 2, and 3a), and D (untreated with gluten‐free diet classes 3b and 3c).
Automated sensitivity analysis on system parameters
Automated sensitivity analysis was carried out on system parameters, including villi channel depth, villi channel width, villi mean thickness, mean gastric emptying time, gut unstirred boundary (mucus/water) layer (UBL) thickness, paracellular pore radius, gallbladder parameters, and gut CYP3A4 abundance in the untreated (population D) population to identify the most sensitive parameters that impact the PKs of felodipine. The range utilized to evaluate parameter sensitivity was based on the physiologically relevant minimum and maximum values in Simcyp V21. Sensitivity of AUC to the parameter was tested over 10 iterations.
Statistical methods
Meta‐analysis was carried out to calculate diseased:healthy ratio for system parameters. The ratios and their variability were multiplied by the mean and CV in Sim‐Healthy volunteer population in Simcyp. Simulated mean, and 5th and 95th percentiles of plasma concentration‐time profiles were compared with observed data and their variability. Predicted and observed AUC0–inf or AUC0–t , C max, time to C max (T max), and clearance (CL) values were plotted with two‐fold and 1.5‐fold intervals and compared.
For the predicted to observed ratios of these PK parameters, the SD was calculated using Equation 2.
| (2) |
Applications of developed CeD population
DDI: The most severe CeD population (classes 3b and 3c) was used to compare felodipine exposure in healthy subjects and patients with severe CeD in the presence and absence of a strong CYP3A4 inhibitor, such as itraconazole. A prospective simulation was carried in Sim‐Healthy Volunteers and CeD population D (20–50 years). Ten trials of 10 subjects were simulated with a 50% proportion of female subjects. Itraconazole 200 mg was administered daily for 6 days, and a felodipine extended‐release tablet 10 mg single dose was administered on day 6. AUC ratio was compared between the healthy and severe CeD populations for 5 days.
Exposure and dose adjustment: A CYP3A4 probe substrate concentration time profile in the portal vein, liver, enterocytes, and plasma were compared between population D and HVs to indicate the potential need for dose adjustment in the diseased population.
RESULTS
Development of celiac population
Meta‐analysis of fraction of male and female patients from clinical studies showed the disease is more prevalent in women with a fraction of men and women with CeD of 0.32 and 0.68, respectively.
GI tract physiology
The system parameters that are used in the development of moderate (populations B + C) and severe (population D) with the gluten‐free diet CeD population are reported in Figure 2 and Table S1. Jejunum UBL pH in patients with severe CeD is elevated, and, after gluten‐free diet, it is reduced but remains slightly higher than HVs after 6 months.
FIGURE 2.

Comparison of the gastrointestinal tract physiology differences among healthy, treated, and untreated patients with celiac disease with gluten‐free diet. The error bars show the coefficient of variation on parameters.
Figure 2 compares the physiology parameters in ADAM that are known to be affected in CeD. Gastric emptying time is delayed and is increased from 0.4 h in HVs to 0.6 h in patients with severe CeD. This scaling (×1.53 for severe and ×1.33 for patients with moderate CeD) was applied to gastric residence time in the STT model. A scaling of 1.34 and 1.11 was applied to Sim‐Healthy Volunteers for moderate and severe CeD, respectively, to increase the small intestinal residence time. The final value of small intestine residence time in STT for the monolithic product was 6.0 and 7.3 h for populations B + C and D, respectively. Colon transit time is reduced in both men and women in CeD. This parameter is scaled down in STT for both solution and monolithic forms.
The UBL is thicker in patients with untreated CeD than HVs and treated patients with CeD. The mean (CV) jejunum values used in populations B + C and D were 123 3 and 836, 6 respectively.
Intestinal CYP3A4 expression is reduced in CeD according to the severity of disease. Figure 2 shows the CYP3A4 expression in different M–O categories of celiac disease according to a gene expression study. Based on this classification, and assuming gene expression correlates directly with enzyme expression, intestinal CYP3A4 expression was 65.4, 31 17.45, and 3.85 pmol in groups A, B + C, and D.
Intestinal pore radius (tight junctions) is increased in patients with CeD making the small intestine leakier. Adjusted pore radius in different groups of patients with CeD is presented in Figure 2. Depending on the severity of disease, pore radius is measured to be 8.6, 14.02, and 16.79 in groups A, B + C, and D. Details of pore radius calculation are presented by Pade et al. 29
Gall bladder maximum volume is increased from 18.8 mL in HVs to 29.4 and 35.6 mL in populations B + C and D, respectively. The increase in maximum gall bladder volume in patients with CeD is considered in the model, however, this parameter is not sensitive in prediction of PK parameters.
Felodipine model verification in healthy volunteers
The HVs’ predicted and observed plasma concentration‐time data for intravenous and oral solution is shown in Figures S1 and S2. The simulated and observed mean concentration‐time data following intravenous and oral administration were comparable. For the individual studies, the predicted versus observed mean values of AUC, C max, T max, and CL were within two‐fold in all cases (Figure 3 and Table S4). The predicted PK parameters were within 1.5‐fold in 92% of the cases.
FIGURE 3.

Ratio of predicted to observed CL, AUC, Cmax, and Tmax for felodipine after intravenous, and oral solution and extended‐release tablet administration to healthy and celiac disease populations. Shaded area is two‐folds intervals and black dashed lines show 1.5‐folds. AUC, area under the curve; CL, clearance; C max, maximum plasma concentration; T max, time to maximum plasma concentration.
The estimated in vivo dissolution profile of felodipine extended‐release tablet using physiologically based IVIVC within Simcyp is shown in Figure 4. The figure also shows the low bioavailability of felodipine after oral administration. In this figure, just under 90% of extended release felodipine is dissolved during the first 8 h and is available for absorption.
FIGURE 4.

Predicted dissolution profile, fraction absorbed, portal vein fraction, and bioavailability versus time for felodipine after in vitro‐in vivo correlation in Simcyp V21.
The dissolution profile of felodipine using the deconvolution of the extended‐release tablet from Figure 4 is used to predict plasma concentration‐time profile of extended release formulation in HV and CeD populations (Figures 5 and 6). The fmCYP3A4 was optimized to the value of 0.8 based on a DDI study with itraconazole and verified with a DDI study for erythromycin. Figure S3 shows the observed plasma concentration–time profiles are within the 5% and 95% percentiles of predictions. Predicted versus observed AUC0–32, AUC0–inf, and C max ratios for the itraconazole DDI study were, 5.88 versus 5.43, 5.97 versus 6.34, and 5.50 versus 7.75, respectively. For the erythromycin DDI study, the predicted versus observed AUC and C max ratios were 1.56 versus 2.94 and 1.58 versus 2.43, respectively. The predicted AUC and C max ratios in both studies were within two‐folds of observed data.
FIGURE 5.
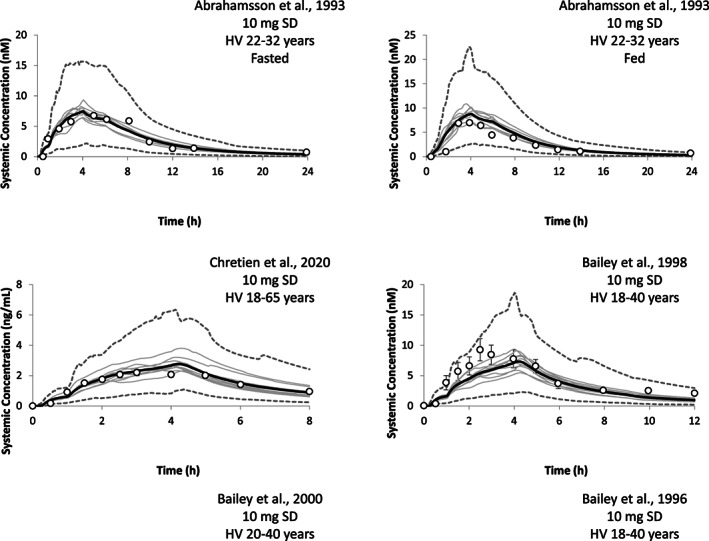
Plasma concentration‐time profile of extended release felodipine tablet in healthy volunteers using 10 trials. The black solid line is the mean of predictions, gray lines are the mean of each trial and dashed gray lines are the 5th and 95th percentiles of predictions. The white circles are the mean of observed data reported in clinical studies and the error bars are the SD. 8 , 22 , 23 , 24 , 32 Black dotted line and gray dotted lines are the mean and 5th and 95th percentiles after drug–drug interaction with erythromycin. HV, healthy volunteers.
FIGURE 6.

Plasma concentration‐time profile of felodipine after extended‐release tablet in celiac disease using 10 trials. The black solid line is the mean of predictions, gray lines are the mean of each trial and dashed gray lines are the 5th and 95th percentiles of predictions. The white circles are the mean of observed data reported in clinical studies and the error bars are the SD. 8
Celiac disease simulations
Plasma concentration‐time profiles of felodipine after oral administration of the extended‐release tablet in patients with CeD are presented Figure 6. The figure shows that the observed systemic concentrations in plasma are predicted well with all data points within the 5th and 95th percentiles. The predicted and observed CLs after intravenous administration are 56.92 ± 10.46 and 56.08 ± 17.28 (L/h) respectively. 19 Comparison of the predicted to observed PK parameters (Figure 3) shows all parameters are predicted within 1.5‐fold. Predicted to observed CLiv from this study gave a ratio of 1.01 and predicted to observed AUC ratio of 0.86 and 0.83 after intravenous and oral administration, respectively, which provides excellent verification and confidence in model applications. C max was predicted within twofold in all cases and within 1.5‐fold in 77% of cases. T max was predicted within twofold in all cases and within 1.5‐fold in 85% of cases.
Sensitivity analysis
The results of the sensitivity analysis are presented in Figures S4 and S5. The most important system parameter affecting the simulated PKs of felodipine was CYP3A4 abundance and UBL thickness. Depending on the physicochemical characteristics of the compound, the sensitivity of a model to different parameters may change. However, CYP3A4 and UBL thickness will remain the most sensitive parameters by impacting metabolism/FG (fraction of drug escaping gut metabolism) and effective permeability, respectively (data not shown).
Prospective simulations and potential applications of the CeD population
Figure S6 compares the concentrations in different tissues in the presence and absence of interaction. The figure shows the baseline concentrations of felodipine at a similar dose are expected to be lower in HVs compared to patients with severe CeD. The figure also shows there is almost no drug interaction via CYP3A inhibition/induction in the enterocytes in patients with severe CeD due to the reduced intestinal CYP3A4 expression. The AUC ratios in healthy subjects and patients with CeD are 18.70 and 15.96, respectively, which reflects a lower level of DDI in patients with CeD.
DISCUSSION
Incorporating data on physiological differences between healthy patients and patients with CeD in a PBPK system allowed successful prediction of felodipine PKs in mild, moderate, and severe CeD disease groups. CeD covers a spectrum of conditions and depending on the duration of a gluten‐free diet many of the system parameters show complete remission to HV values. Based on mucosal damage, CeD is often graded histologically, using established measures, such as the modified Marsh scale. 33 Group A in the study by Chritien et al. is HV‐like and group D subjects show severe celiac symptoms with complete villous atrophy. However, considering high interindividual variability, some physiological parameters could still overlap in some categories. In this study, the model was parametrized as much as possible based on the Marsh scale (CYP3A4, pore radius, gall bladder parameters, and colonic transit time) and the rest based on treated and untreated with gluten‐free diet.
There were no data for direct measurement of small intestine residence time in CeD populations. The mouth to colon data from the H2 breath test reported by Benni et al. was corrected for the reported gastric emptying time. The average values of mouth to colon without gastric emptying were calculated in HVs and each CeD population. The ratio of diseased to HVs was calculated and applied to small intestine residence time in Simcyp. Colon transit time is longer in female HVs. These data were reported in patients with CeD. However, due to the limited number of male subjects in the clinical data set, it was not possible to parametrize populations for men and women; therefore, all data were combined, and the same scaling was applied to both sexes. This parameter is scaled down in the STT model for both solution and monolithic forms.
Changes in GI tract physiology can impact the permeability and absorption of drugs. Inflamed small intestinal mucosa is characterized by villous atrophy and crypt hyperplasia that reduce the absorptive surface area. Limited data are available on villous height in different severities of CeD populations. For population D, complete villous atrophy is considered. 34
Increased UBL thickness can impair the absorption of drugs. The increase in UBL thickness in severe CeD reduces permeability of drugs for otherwise medium to high permeability drugs. The results of sensitivity analysis with felodipine suggests that UBL thickness is an important parameter affecting the absorption of this drug. Indirect measurement of jejunum UBL thickness indicates it is ~6.8 times thicker UBL in patients with CeD compared to HVs.
A variety of factors could account for less efficient luminal stirring in patients. For example, villous contractility could be important stirring mechanism that would be absent in patients with CeD with villous atrophy. 35 Other mechanisms could be altered secretion and turnover of mucus in patients with CeD. Intestinal permeability is increased as reported by urinary lactulose:mannitol ratio in treated and untreated patients with CeD compared to HVs. 36 , 37 In this study, gut wall permeability is predicted using the MechPeff model, which automatically considers transcellular permeability based on the morphology of the small intestine. However, lactulose:mannitol ratio studies of small intestine permeability in CeD show that despite decreased transcellular permeability of mannitol, transcellular permeability of lactulose significantly increases due to impaired barrier. Although pore sizes are increased to reflect the opening of the tight junctions in CeD, this phenomenon cannot be predicted mechanistically in the existing model. Because felodipine has a high P trans,0, the transcellular permeability is much higher and, therefore, parameters such as the pore size that is only affecting the paracellular permeability will no longer be a sensitive parameter. However, if P trans,0 was a small value, the paracellular permeation could be significant compared to the transcellular permeation. Because pore sizes are not sensitive to account for this leakiness, an absorption rate scalar based on data from lactulose studies has been applied in population D to increase the permeability in jejunum 1 and 2 by a factor of 5.68 in moderate to severe villous atrophy. 21 Reduced villous surface area (and therefore transcellular permeability) but increased paracellular permeability, can predict the absorption in the CeD population. In addition, by opening the tight junctions there will be by‐passing of enterocyte compartment and therefore FG may be increased due to less metabolism, in addition to less metabolism from reduced 3A4.
Intestinal CYP3A4 expression is reduced in CeD. CYP3A4 gene expression on biopsy samples was used as a diagnostic tool in suspected pediatric patients with CeD. 38 CYP3A4 is expressed in villi tips and villous atrophy in patients with CeD causes reduced activity and expression of CYP3A4. Higher expression levels from CYP3A4 gene were found in Marsh 0 and Marsh 2 mucosa, compared with Marsh 3A–3C mucosa, being consistent with the destruction of villi present in Marsh 3 mucosa. Johnson et al. 31 quantified CYP3A4 expression and activity using the Western blot and testosterone technique and showed 10.9‐fold reduction in untreated patients with CeD, whereas the expression and activity were like healthy patients in treated patients with CeD.
There is no direct comparison of serum albumin between healthy patients and patients with CeD. However, Tack et al. 39 reported concentration of albumin was lower in both refractory CeD subsets when compared to acute CeD. Concentrations of albumin were shown to be higher in active CeD and patients on a gluten‐free diet compared to more complicated forms of CeD.
Figure 4 shows that oral bioavailability of felodipine is low, which is consistent with the literature. The bioavailability of felodipine is reported to be around 15%. 18 , 19 , 40
An in vitro dissolution profile for the extended‐release tablet is available in non‐biorelevant media. In vitro dissolution profiles of felodipine powder, suspension, and disc formulations are available in biorelevant and non‐biorelevant media. However, none of these profiles can predict the dissolution/release of drug. Therefore, IVIVC is carried out to achieve the dissolution profile. The dissolution profile predicted with IVIVC is in agreement with the results of Yi et al. 41 for flow through cell where they showed that this method was able to reflect in vivo absorption profile adequately. Based on the results of the sensitivity analysis, for a CYP3A4 compound like felodipine it is expected the bioavailability of drug in CeD would increase.
The changes discussed above will impact oral absorption of drugs in different ways depending on the physicochemical properties and site of absorption in the GI tract. For example, depending on the drug pKa increased GI pH could increase or decrease the solubility of drug. Similarly, increased permeability due to leakiness of the GI barrier due to lose tight junctions could increase the rate of absorption in the upper GI tract but might not affect the absorption of the drug in distal parts of the intestine.
Prospective simulations and potential applications of CeD population
A verified virtual CeD population allows the investigation of scenarios where conducting a clinical study is not feasible. Using a PBPK model, additional to systemic exposure, drug concentration can be simulated and compared in lamina propria and enterocyte that are the potential site of action for GI tract modalities. Because the lamina propria is not a separate compartment in the Simcyp PBPK model, portal vein concentration was used as a surrogate. Figure S6 compares the local tissue concentrations between healthy patients and patients with CeD. This observation might not be relevant in felodipine, an antihypertensive drug, but could be relevant for toxicity risk of locally acting drugs in the GI tract.
Another important application of this model is to predict DDI liability in CeD for CYP3A4 substrates with strong inhibitors. The figure shows lack of CYP3A4 in CeD enterocytes causes a minimal interaction with a strong CYP3A4 inhibitor. This has implications for DDI risk assessment at the site of action. Felodipine is predominantly metabolized by CYP3A4, less than 0.1% is secreted in the bile and less than 0.5% is excreted unchanged in urine and metabolized to dehydrofelodipine. 42 , 43 In this model, fmCYP3A4 is assumed as 100% (worst case) to show the sensitivity of the diseased population to DDI predictions. However, a small change in fmCYP3A4 will hugely impact the AUC ratio and level of DDIs.
Other applications of the CeD population are to design the clinical study and predict PK parameters, dose prediction prior to clinical trial, assessment of drug bioequivalence in systemic circulation, and local tissues in the diseased population.
There are some limitations in the current study due to availability of measured data on all physiology parameters. Not all the parameters are reported in treated and untreated patients.
The comparison of predicted and observed plasma concertation‐time profiles and PK parameters in this study after i.v. and oral doses showed PBPK modeling can be used to predict PKs in the CeD population for extended‐release felodipine tablet. The model can be further refined by additional physiology data on both treated and untreated patients with CeD. However, more PK data on compounds with different physicochemical properties are always helpful to verify this model.
AUTHOR CONTRIBUTIONS
F.S. and K.S.T. wrote the manuscript. F.S. and K.S.T. designed the research. F.S. and J.M. performed the research. F.S., A.N., J.M., D.T., D.B.T. and J.B. analyzed the data.
FUNDING INFORMATION
No funding was received for this work.
CONFLICT OF INTEREST STATEMENT
The authors declared no competing interests for this work.
Supporting information
Appendix S1
Salem F, Nimavardi A, Mudunuru J, et al. Physiologically based pharmacokinetic modeling for development and applications of a virtual celiac disease population using felodipine as a model drug. CPT Pharmacometrics Syst Pharmacol. 2023;12:808‐820. doi: 10.1002/psp4.12954
References
- 1. Singh P, Arora A, Strand TA, et al. Global prevalence of celiac disease: systematic review and meta‐analysis. Clin Gastroenterol Hepatol. 2018;16:823‐36.e2. [DOI] [PubMed] [Google Scholar]
- 2. NICE. (National Institue for Health and Care Excellence) Coeliac disease . https://bnf.nice.org.uk/treatment‐summary/coeliac‐disease.html. Accessed 06/01/2022 2022.
- 3. Wang I, Hopper I. Celiac disease and drug absorption: implications for cardiovascular therapeutics. Cardiovasc Ther. 2014;32:253‐256. [DOI] [PubMed] [Google Scholar]
- 4. Renwick AG, Higgins V, Powers K, Smith CL, George CF. The absorption and conjugation of methyldopa in patients with coeliac and Crohn's diseases during treatment. Br J Clin Pharmacol. 1983;16:77‐83. [DOI] [PMC free article] [PubMed] [Google Scholar]
- 5. Kitis G, Lucas ML, Bishop H, et al. Altered jejunal surface pH in coeliac disease: its effect on propranolol and folic acid absorption. Clin Sci (Lond). 1982;63:373‐380. [DOI] [PubMed] [Google Scholar]
- 6. Parsons RL, Kaye CM, Raymond K. Pharmacokinetics of salicylate and indomethacin in coeliac disease. Eur J Clin Pharmacol. 1977;11:473‐477. [DOI] [PubMed] [Google Scholar]
- 7. Moron B, Verma AK, Das P, et al. CYP3A4‐catalyzed simvastatin metabolism as a non‐invasive marker of small intestinal health in celiac disease. Am J Gastroenterol. 2013;108:1344‐1351. [DOI] [PubMed] [Google Scholar]
- 8. Chretien ML, Bailey DG, Asher L, et al. Severity of coeliac disease and clinical management study when using a CYP3A4 metabolised medication: a phase I pharmacokinetic study. BMJ Open. 2020;10:e034086. [DOI] [PMC free article] [PubMed] [Google Scholar]
- 9. Gorostiola‐González M, García‐Sánchez MJ, Santos‐Buelga MD. In silico prediction of drug absorption in celiac disease. FarmaJournal. 2018;3:87‐97. [Google Scholar]
- 10. Marsh MN. Gluten, major histocompatibility complex, and the small intestine. A molecular and immunobiologic approach to the spectrum of gluten sensitivity (‘celiac sprue’). Gastroenterology. 1992;102:330‐354. [PubMed] [Google Scholar]
- 11. Oberhuber G. Histopathology of celiac disease. Biomed Pharmacother. 2000;54:368‐372. [DOI] [PubMed] [Google Scholar]
- 12. Howgate EM, Rowland Yeo K, Proctor NJ, Tucker GT, Rostami‐Hodjegan A. Prediction of in vivo drug clearance from in vitro data. I: impact of inter‐individual variability. Xenobiotica. 2006;36:473‐497. [DOI] [PubMed] [Google Scholar]
- 13. Leong R, Vieira MLT, Zhao P, et al. Regulatory experience with physiologically based pharmacokinetic modeling for pediatric drug trials. Clin Pharmacol Ther. 2012;91:926‐931. [DOI] [PubMed] [Google Scholar]
- 14. PubChem . https://pubchem.ncbi.nlm.nih.gov/compound/Felodipine. Accessed 15/03/2022 2022.
- 15. Scholz A, Abrahamsson B, Diebold SM, et al. Influence of hydrodynamics and particle size on the absorption of felodipine in labradors. Pharm Res. 2002;19:42‐46. [DOI] [PubMed] [Google Scholar]
- 16. Gertz M, Houston JB, Galetin A. Physiologically based pharmacokinetic modeling of intestinal first‐pass metabolism of CYP3A substrates with high intestinal extraction. Drug Metab Dispos. 2011;39:1633‐1642. [DOI] [PubMed] [Google Scholar]
- 17. Edgar B, Hoffmann KJ, Lundborg P, Regardh CG, Ronn O, Weidolf L. Absorption, distribution and elimination of felodipine in man. Drugs. 1985;29(Suppl 2):9‐15. [DOI] [PubMed] [Google Scholar]
- 18. Edgar B, Regårdh CG, Johnsson G, et al. Felodipine kinetics in healthy men. Clin Pharmacol Ther. 1985;38:205‐211. [DOI] [PubMed] [Google Scholar]
- 19. Landahl S, Edgar B, Gabrielsson M, et al. Pharmacokinetics and blood pressure effects of felodipine in elderly hypertensive patients. A comparison with young healthy subjects. Clin Pharmacokinet. 1988;14:374‐383. [DOI] [PubMed] [Google Scholar]
- 20. Cummins CL, Jacobsen W, Benet LZ. Unmasking the dynamic interplay between intestinal P‐glycoprotein and CYP3A4. J Pharmacol Exp Ther. 2002;300:1036‐1045. [DOI] [PubMed] [Google Scholar]
- 21. van Elburg RM, Uil JJ, Mulder CJ, Heymans HS. Intestinal permeability in patients with coeliac disease and relatives of patients with coeliac disease. Gut. 1993;34:354‐357. [DOI] [PMC free article] [PubMed] [Google Scholar]
- 22. Bailey DG, Bend JR, Arnold JM, Tran LT, Spence JD. Erythromycin‐felodipine interaction: magnitude, mechanism, and comparison with grapefruit juice. Clin Pharmacol Ther. 1996;60:25‐33. [DOI] [PubMed] [Google Scholar]
- 23. Bailey DG, Dresser GK, Kreeft JH, Munoz C, Freeman DJ, Bend JR. Grapefruit‐felodipine interaction: effect of unprocessed fruit and probable active ingredients. Clin Pharmacol Ther. 2000;68:468‐477. [DOI] [PubMed] [Google Scholar]
- 24. Bailey DG, Kreeft JH, Munoz C, Freeman DJ, Bend JR. Grapefruit juice‐felodipine interaction: effect of naringin and 6′,7′‐dihydroxybergamottin in humans. Clin Pharmacol Ther. 1998;64:248‐256. [DOI] [PubMed] [Google Scholar]
- 25. Jamei M, Turner D, Yang J, et al. Population‐based mechanistic prediction of oral drug absorption. AAPS J. 2009;11:225‐237. [DOI] [PMC free article] [PubMed] [Google Scholar]
- 26. Thoraipakkam C. Development and Evaluation of Felodipine Extended Release Tablet Formulation. MASTER OF PHARMACY IN PHARMACEUTICS, DEPARTMENT OF PHARMACEUTICS C.L.BAID METHA COLLEGE OF PHARMACY. 2014.
- 27. Berben P, Brouwers J, Augustijns P. Assessment of passive intestinal permeability using an artificial membrane insert system. J Pharm Sci. 2018;107:250‐256. [DOI] [PubMed] [Google Scholar]
- 28. Gertz M, Harrison A, Houston JB, Galetin A. Prediction of human intestinal first‐pass metabolism of 25 CYP3A substrates from in vitro clearance and permeability data. Drug Metab Dispos. 2010;38:1147‐1158. [DOI] [PubMed] [Google Scholar]
- 29. Pade D, Jamei M, Rostami‐Hodjegan A, Turner DB. Application of the MechPeff model to predict passive effective intestinal permeability in the different regions of the rodent small intestine and colon. Biopharm Drug Dispos. 2017;38:94‐114. [DOI] [PubMed] [Google Scholar]
- 30. Abinaya A. Development and Evaluation of Felodipine Extended Release Tablet Formulation Master of Pharmacy In Pharmaceutics, C. L. Baid Metha College of Pharmacy, Chennai‐600 097. 2014.
- 31. Johnson TN, Tanner MS, Taylor CJ, Tucker GT. Enterocytic CYP3A4 in a paediatric population: developmental changes and the effect of coeliac disease and cystic fibrosis. Br J Clin Pharmacol. 2001;51:451‐460. [DOI] [PMC free article] [PubMed] [Google Scholar]
- 32. Abrahamsson B, Alpsten M, Hugosson M, et al. Absorption, gastrointestinal transit, and tablet erosion of felodipine extended‐release (ER) tablets. Pharm Res. 1993;10:709‐714. [DOI] [PubMed] [Google Scholar]
- 33. Rostami K, Kerckhaert J, Tiemessen R, von Blomberg BM, Meijer JW, Mulder CJ. Sensitivity of antiendomysium and antigliadin antibodies in untreated celiac disease: disappointing in clinical practice. Am J Gastroenterol. 1999;94:888‐894. [DOI] [PubMed] [Google Scholar]
- 34. Adelman DC, Murray J, Wu TT, Maki M, Green PH, Kelly CP. Measuring change In small intestinal histology In patients with celiac disease. Am J Gastroenterol. 2018;113:339‐347. [DOI] [PubMed] [Google Scholar]
- 35. Strocchi A, Corazza G, Furne J, et al. Measurements of the jejunal unstirred layer in normal subjects and patients with celiac disease. Am J Physiol. 1996;270:G487‐G491. [DOI] [PubMed] [Google Scholar]
- 36. Johnston SD, Smye M, Watson RP. Intestinal permeability tests in coeliac disease. Clin Lab. 2001;47:143‐150. [PubMed] [Google Scholar]
- 37. Vilela EG, Torres HO, Ferrari ML, Lima AS, Cunha AS. Gut permeability to lactulose and mannitol differs in treated Crohn's disease and celiac disease patients and healthy subjects. Braz J Med Biol Res. 2008;41:1105‐1109. [DOI] [PubMed] [Google Scholar]
- 38. Bragde H, Jansson U, Jarlsfelt I, Soderman J. Gene expression profiling of duodenal biopsies discriminates celiac disease mucosa from normal mucosa. Pediatr Res. 2011;69:530‐537. [DOI] [PubMed] [Google Scholar]
- 39. Tack GJ, van Wanrooij RLJ, von Blomberg BME, et al. Serum parameters in the spectrum of coeliac disease: beyond standard antibody testing‐a cohort study. BMC Gastroenterol. 2012;12:159. [DOI] [PMC free article] [PubMed] [Google Scholar]
- 40. Edgar B, Lundborg P, Regardh CG. Clinical pharmacokinetics of felodipine. A Summary. Drugs. 1987;34(Suppl 3):16‐27. [DOI] [PubMed] [Google Scholar]
- 41. Yi HLF, Zhang G, Cheng Z. Evaluation of a modified flow‐through method for predictive dissolution and in vitro/in vivo correlations of immediate release and extended release formulations. J Nanomater. 2021;2021:1‐10. [Google Scholar]
- 42. AstraZeneca . Product Monograph‐ Plendil Extended Release Tablets 2.5 mg, 5 mg and 10 mg Antihypertensive Agent. AstraZeneca; 2000. [Google Scholar]
- 43. Sutfin TA, Lind T, Gabrielsson M, Regardh CG. Biliary secretion of felodipine metabolites in man after intravenous [14C]felodipine. Eur J Clin Pharmacol. 1990;38:421‐424. [DOI] [PubMed] [Google Scholar]
Associated Data
This section collects any data citations, data availability statements, or supplementary materials included in this article.
Supplementary Materials
Appendix S1