Abstract
S‐adenosyl methionine (SAM)–dependent methyl transferases (MTases) are a ubiquitous class of enzymes catalyzing dozens of essential life processes. Despite targeting a large space of substrates with diverse intrinsic reactivity, SAM MTases have similar catalytic efficiency. While understanding of MTase mechanism has grown tremendously through the integration of structural characterization, kinetic assays, and multiscale simulations, it remains elusive how these enzymes have evolved to fit the diverse chemical needs of their respective substrates. In this work, we performed a high‐throughput molecular modeling analysis of 91 SAM MTases to better understand how their properties (i.e., electric field [EF] strength and active site volumes) help achieve similar catalytic efficiency toward substrates of different reactivity. We found that EF strengths have largely adjusted to make the target atom a better methyl acceptor. For MTases that target RNA/DNA and histone proteins, our results suggest that EF strength accommodates formal hybridization state and variation in cavity volume trends with diversity of substrate classes. Metal ions in SAM MTases contribute negatively to EF strength for methyl donation and enzyme scaffolds tend to offset these contributions.
Keywords: cavity, descriptors, electrici field, high‐throughput molecular modeling, methyltransferases, statistical analysis
1. INTRODUCTION
S‐adenosyl methionine methyltransferases (SAM MTases) are a ubiquitous class of enzymes. SAM MTases are observed in a wide range of organisms including bacteria, fungus, plants, and humans (Bügl et al., 2000; Dhe‐Paganon et al., 2011; Nai et al., 2021; Zhang et al., 2018). SAM MTases catalyze SN2 methylation, using SAM as a methyl donor. Their functions are involved in many essential life processes, including gene expression (Katada & Sassone‐Corsi, 2010; Min et al., 2003; Moore et al., 2013), protein modification (Falnes et al., 2016; Paik et al., 2014; Winter et al., 2018), neurotransmitter degradation (Akil et al., 2003; Männistö & Kaakkola, 1999; Witte & Flöel, 2012), and natural product synthesis (Liscombe et al., 2012; Ohashi et al., 2017, 2023). SAM MTases target various types of atoms, including carbon, nitrogen, oxygen, and sulfur (Scheme 1). Enabled by advances in structural determination, kinetic studies, and multiscale molecular modeling (Patra et al., 2016; Ruggiero et al., 2004; Soriano et al., 2006; Zhang et al., 2015), the mechanistic details of SAM MTases have been unveiled (Horowitz et al., 2014; Roca & Williams, 2020; Świderek et al., 2018). The combination of binding isotope effect experiments and large‐scale quantum mechanical calculations shows the dependence of ground state donor‐acceptor distance on the catalytic efficiency of catechol‐O‐methyltransferase (Zhang et al., 2020; Zhang & Klinman, 2016; Zhang et al., 2015). Investigations into CH‐X (X = O, C, or N) hydrogen bonding have elucidated the role of these non‐bonding interactions in ensuring catalytic efficiency (Couture et al., 2006; Horowitz et al., 2013; Trievel et al., 2003; Yang et al., 2019). Analysis of charge transfer and electrostatics on four Class I SAM MTases has illustrated the ability of these enzymes to customize their electrostatic potentials to the intrinsic reactivity of their target substrates (Yang et al., 2019).
SCHEME 1.
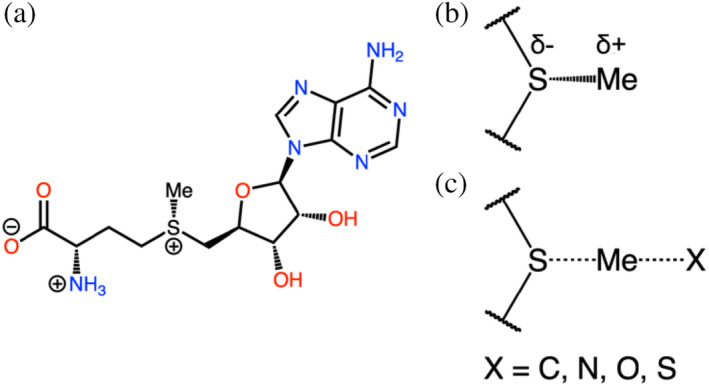
Chemical structure of S‐adenosyl methionine. The left side (a) shows the full molecule in the protonation state seen at a pH of 7.0. Top right (b) shows the relevant S–C bond broken during methyl donation by S‐adenosyl methionine. The negative partial charge of sulfur and positive partial charge of the methyl group are shown. Bottom right (c) shows a hypothetical SN2 transition state where the methyl group is being transferred to either a carbon, nitrogen, oxygen, or sulfur.
Although SAM MTases involve diverse substrate scope with a wide range of intrinsic methyl‐accepting capability, the kinetic properties of MTase‐catalyzed reactions are largely consistent. A survey of 15 unique MTases from IntEnzyDB shows an average activation barrier of 12.7 kcal/mol with a standard deviation of 1.9 kcal/mol (Table S1) (Yan et al., 2022, 2021). Similarity of turnover number across diverse substrates is not unique to SAM MTases and is observed in many classes of enzymes (Sousa et al., 2020). The combination of diverse substrates and functional roles with consistent kinetic output suggests that different SAM MTases address the specific characteristics of each catalyzed reaction. However, the molecular origins behind the substrate kinetic homogeneity remain largely unknown.
A high throughput analysis of SAM MTase electrostatic and topological properties is needed to rationalize how this diverse class of enzymes have adjusted to achieve a narrow distribution of kinetics. Existing studies have used different types of MTases but remained relatively low throughput, usually using one or two structures (Patra et al., 2016; Rod & Ryde, 2005; Ruggiero et al., 2004; Świderek et al., 2018). A notable exception is the structural survey conducted by the Trievel, which involves 46 different SAM MTases (Horowitz et al., 2013; Yang et al., 2019). Combined growth in computational resources and protein databank (PDB) entries makes a strong case for higher throughput studies that have greater potential to uncover more universal trends (Berman & Gierasch, 2021; Shao et al., 2022; Vasina et al., 2022).
Here, we present a computational analysis of 91 high‐quality SAM MTase structures that examines both enzyme interior electric field (EF) strength and cavity volume using EnzyHTP, a high‐throughput enzyme modeling software developed by our lab (Shao et al., 2022). Existing computational and experimental studies of SAM MTases (Yang et al., 2019) and other types of enzymes have elucidated interior enzyme electrostatics to be among the determining factors in mediating catalytic efficiency (Ji et al., 2022; Lameira et al., 2015; Oanca et al., 2020; Zheng et al., 2022). Volume of active site cavity (Petřek et al., 2006) represents a topological factor that informs the capability of SAM MTases in substrate binding. Measuring both an electrostatic and topological value provides a holistic view of how each MTase has evolved to the specific characteristics of their respective substrates to achieve strong catalytic efficiency. Our analyses of 91 unique SAM MTases have enabled us to evaluate how SAM MTases have evolved to specific characteristics of their substrates' target atoms, the diversity of their class of target substrates, and the presence of metal ions in their structures.
2. COMPUTATIONAL METHODS
2.1. Data curation
Structures were curated from the PDB on October 3, 2022 (Berman & Gierasch, 2021). Filtration criteria are: (1) resolution under 2.0 Å, (2) enzyme commission (EC) number of 2.1.1.X (i.e., SAM‐dependent methyltransferase), (3) inclusion of SAM, and (4) no RNA or DNA fragments. These criteria yielded 175 PDB entries. The PDB codes and corresponding search queries are listed in Supporting Information (Table S2 and Figure S1).
The biological assembly and FASTA sequence for each entry was downloaded from the PDB website. The curated enzymes consist of 80.2% monomers, 18.7% dimers and 1.1% trimers (Table S3). When alternative locations or ANISOU records were available, the first coordinates were used. All waters were removed from each structure. Co‐crystallizing ligands and ions were removed manually except Zn and Mg ions. Mg ions were only kept for catechol O‐methyltransferase (COMT) structures. Missing residues were added to each structure using the Modeller python package (Webb & Sali, 2014) by treating the incomplete sequence as a template and aligning it to the full sequence provided by the FASTA. All structures were protonated at a pH of 7.0 using the EnzyHTP (Shao et al., 2022) package and ligands were protonated using the molecular operating environment (MOE) software package (Chemical Computing Group ULC [CCG], 2022). Ligands missing heavy atoms were replaced with idealized models found in the PDB's chemical library. The structures were used as is from this point forward.
Each entry was clustered into one of 104 groups using edit distance with a cutoff of 95% sequence similarity and a maximum length difference of 5% (Text S1). Clustering was performed by iterating through the list of sequences and checking if the sequence has satisfied the criteria listed above. If it satisfied these criteria, it would be added. If not, a new cluster containing just that sequence would be created. A total of 21 clusters were identified to contain more than one sequence. The sequence from each cluster with the best resolution in angstroms (i.e., the smallest value) was selected by default. If a cluster contains a native version of the enzyme and versions with inhibitors, the native version was selected as the representative member from the cluster. PDB entries 3m6v and 3m6w were included due to being in different space groups as specified by their authors.
Numbers were sourced from PDB entries when available, and from the UniProtKB database when not listed in the PDB (Coudert et al., 2022). Information on substrate type and target heteroatom were derived from the BRENDA database entry corresponding to EC number (Chang et al., 2020). Substrate and heteroatom information was also derived from PDB entries when no EC number could be derived. We found 11 entries that have no corresponding EC number and removed them from the data set for analyses that focus on substrate and target atom specificity. We also removed 21 entries that have EC numbers other than 2.1.1.X. Complete enzymatic function data annotations are listed in the Supporting Information (Table S4).
2.2. Molecular mechanics minimization
The SAM MTase complexes were parameterized using the antechamber, parmchk2 and tleap utilities from AMBER19 (Kamenik et al., 2020). Non‐SAM ligands were removed from all structures. Each structure was minimized using molecular mechanics in Amber19's sander application with the initial x‐ray structure as a starting point. Minimization was run for a maximum of 20,000 steps and the remaining settings are listed in Supporting Information (Figure S2).
2.3. EF calculation
For each SAM‐MTase complex, the enzyme's interior EF strength was calculated along the S–C bond of SAM using the RESP charges for each atom as well as the coordinates of the minimized structure. The below equation was used to calculate the EF strength at the mid‐point of the S–C bond by summing over all atoms:
Here is the vector from each atom to the S–C bond mid‐point, is a unit vector pointing along the direction of the S–C bond from the center of the bond, is the charge of the atom in internal Amber units and is a conversion constant with a value of 332.4 kcal Å/ mol e2. When a structure was a dimer or trimer, EF strength was calculated for each active site and averaged. The resulting units of EF strength are MV/cm.
2.4. Dipole moment calculations
We used the Gaussian16 software package to perform density function theory (DFT) calculations and the Multiwfn package to calculate dipoles (Frisch et al., 2016; Lu & Chen, 2012). A set of 10 representative SAM structures were extracted from 10 PDB structures from the main set of 91 MTases. Each structure was first minimized with a maximum of 20,000 cycles using molecular mechanics. A structural cluster model was then constructed by taking the SAM cofactor and nearby amino acids within 3 Å from the surface of SAM. The truncated structural models were used for the Gaussian single‐point energy calculations. The B3LYP‐D3 method was used with a 6–311 g(d) basis set. Dipoles were generated using the wave function‐based localized molecular orbital analysis in Multiwfn. A table of PDB IDs, dipoles, and resulting are found in Table S5. When a structure was a dimer or trimer, the calculation was repeated for each active site and averaged.
2.5. Cavity volume calculation
We used the Mole2.0 software package to calculate the cavity volume of SAM‐binding pocket (Sehnal et al., 2013). A truncated version of each cavity was created by selecting residues containing at least one heavy atom that is within 8 Å of a heavy atom in SAM. Volume was calculated a total of 378 times for each cavity with the outer probe radius ranging from 3.0 to 6.5 Å by 0.3 Å, inclusive, and with inner probe values of 1.0–2.0 Å by 0.05 Å, inclusive. Coverage of SAM by each parameter set was calculated by exporting the cavity to a mesh and then counting the number of heavy atoms whose centers are inside the mesh using the pyvista python module. Each cavity was assigned the lowest volume with coverage greater than 0.95 or with the max coverage if none were greater than 0.95. When an enzyme was a dimer or trimer, this procedure was repeated for each cavity and the result was averaged.
3. RESULTS AND DISCUSSION
We curated 91 SAM MTases for analyses of enzyme interior EF and cavity size of active site. These two characteristics were chosen as they broadly describe enzyme substrate specificity and can be readily calculated in a high‐throughput manner.
EF strength plays a critical role in breaking the sulfur–carbon (S–C) bond of SAM via electrostatic stabilization energy (. As seen in Scheme 2a, , where and are the EF and dipole moment of the system measured along the S–C bond, respectively. Our study uses RESP charges from the AMBER force field to calculate . Both quantities are taken at the center of the S–C bond. The lower electronegativity of C versus S results in SAM's dipole pointing from the donor methyl to the S atom (Scheme 1b). Following the convention of starting the dipole vector at the δ‐ atom, gets a positive sign. A positive value for results in a negative , which favors the breaking of SAM's S–C. A positive value for yields a positive , disfavoring bond‐breakage. Changes in quantitatively impact . We calculated the S–C dipole moments for the binding SAM cofactor in 10 representative MTases in our data set. A change of 10 MV/cm resulted in an average change of 0.4 kcal/mol (Table S5). The change is expected to be even greater for transition state with a breaking, elongated S–C bond.
SCHEME 2.
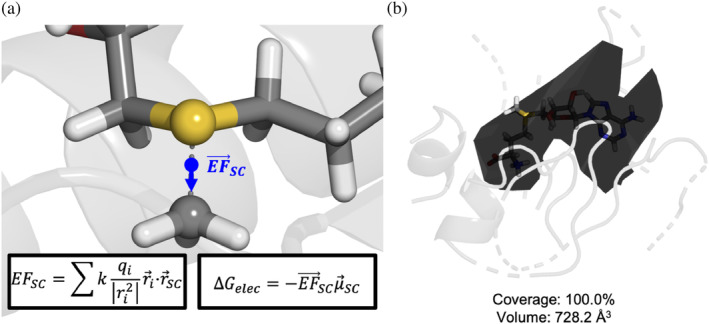
Measuring electric field (EF) strength and cavity volume. Visualized by the blue arrow in (a), EF is measured along the S–C bond axis at the center point of the bond. Charges and atom locations for the EF calculation are derived from the minimized AMBER structure. Inlay (b) shows a sample mesh from Mole2.0 used to calculate the cavity volume. Coverage denotes the percentage of SAM's heavy atoms whose centers are inside the mesh.
Cavity volume measures the size of the active site and provides information on how each enzyme geometrically accommodates its target substrate. Exact substrate orientations and conformations are not known for each of the selected structures and are generally difficult to determine. We also observed that active sites were relatively rigid. The average normalized B‐factor of active site residues is −0.3 versus 0.1 for the rest of enzyme excluding SAM (Table S6). B norm values were calculated using Equation (1), where and refer to the average and standard deviation of B values, respectively (Barthels et al., 2021):
| (1) |
This lack of substrate information combined with the relative rigidity of active sites observed in both this data set and others led us to measure cavity volume statically (Bartlett et al., 2002). We employed the Mole2.0 software package to calculate cavity volumes, running the software on truncated cavities using a robust set of parameters. Meshes from Mole2.0 were extracted and used for volume determination. Further details are provided in the Computational Methods Section.
Non‐SAM substrates were not explicitly considered in the following calculations. Substrate effects are known to play a role in SAM MTase mechanisms, with hydrogen bonds often forming between SAM and nucleic acid targets, for example, Yang et al. (2019). Therefore, these effects are expected to exist in the “uncatalyzed” background reactions in water and are not considered in this analysis. Difficulties in proper substrate positioning further complicate the inclusion of substrates for both low‐ and high‐throughput works. We are investigating methods for high‐throughput reactive docking techniques. Doing so will enable accurate, automated positioning of substrates in enzyme active sites.
The curated SAM MTases involve a diverse range of substrate specificity (Figure 1a) with nucleic acids and histones being the most abundant, representing 55.0% and 23.1% of the data set, respectively. MTases catalyzing small molecules (i.e., molecular weight ≤582.9 g/mol), proteins, and catechol each contribute 11.0%, 7.7%, and 3.3% of the structures, respectively. We isolated catechol from the small molecule category because of its high abundance and well‐established existing studies elucidating its mechanism (Jindal & Warshel, 2016; Kulik et al., 2016; Männistö & Kaakkola, 1999; Patra et al., 2016; Roca & Williams, 2020; Ruggiero et al., 2004; Yang et al., 2019; Zhang et al., 2015). The distributions of cavity volumes and EF values are displayed in Figure 1b. Cavity volumes range from 498.0 to 1494.7 Å3, with a median value of 859.6 Å3. Kernel density estimation (KDE) of cavity volume generates a distribution with a single peak around 806.3 Å3 and a small shoulder around 1400.0 Å3. SAM has a volume of 295.2 Å3, meaning that the median cavity volume has space of approximately twice the size of SAM to accommodate methyl‐acceptor substrate.
FIGURE 1.
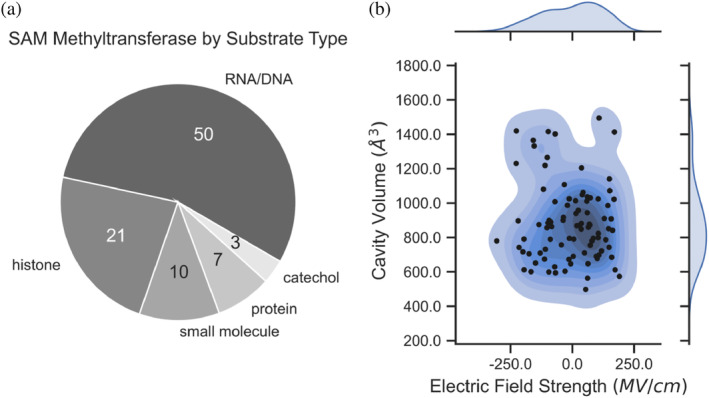
A survey of the compiled SAM MTase data set. The pie chart (a) on the left shows the functional breakdown of the MTases. Classifications are based on the EC number when available and are derived from the original publication if no EC number was supplied. The contour plot (b) on the right shows the distributions of cavity volume and electric field for all 91 MTases. The center of (b) shows a topographical view of the values in two dimensions and the margins show one‐dimensional kernel density estimation plots of each respective dimension.
EF strengths range from −306.2 to 190.7 MV/cm, with a median of 13.8 MV/cm. This result indicates that a large number of SAM MTases have positive EF strength although a substantial number have negative strength values. KDE estimation of EF generated a distribution with two peaks, one around −89.5 MV/cm and another around 93.0 MV/cm. While the median EF is on average slightly positive, KDE analysis indicates a wide distribution of EF strength in specific MTases. EF direction is generally orthogonal to the S–C bond with an average angle between and of 87.2°. Direct alignment or opposition of and is not common with 19.0% and 17.1% of active sites having angles on the ranges of [0°, 60°) and [120°, 180°), respectively. Proximal residues have larger average contribution to EF strength, although the large quantity of distal residues has meaningful cumulative contribution. Residues within 5 Å have an average EF strength magnitude contribution of 75.3 MV/cm whereas those 5–10, 10–15, and > 15 Å have average magnitude contributions of 14.0, 7.9, and 1.5 MV/cm, respectively. Polar residues also contribute 5.3 MV/cm to EF strength magnitude on average whereas non‐polar residues only contribute 1.1 MV/cm, respectively. Distributions of these values are available in the Supporting Information (Figure S3). Scheme 3 provides an illustrative example of EF strength generation for a typical structure, FtsJ RNA MTase (PDB ID: 1eiz). Cavity volume and EF strength have low correlation with an R 2 of only 0.01. The lack of correlation implies the two properties are independent and EF strength does not directly depend on binding cavity size.
SCHEME 3.
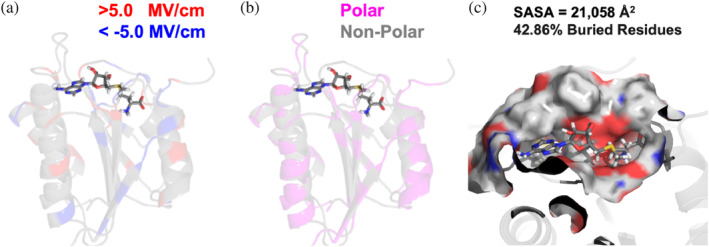
Illustrative example of contribution to electric field (EF) strength and local geometry of active site for FtsJ RNA MTase (PDB ID: 1eiz). (a) The residues are colored‐coded by the magnitude of the EF contribution with very positive and very negative contributions being shown in red and blue, respectively. The middle image (b) shows polar residues in magenta and non‐polar residues in gray. A zoomed‐in view of the active site is shown in (c), where the surface of the active site has been selected. A residue is considered buried when <10% of its surface area is a solvent‐accessible surface area (SASA).
Next, we investigated the electrostatic mediation of MTases on SAM co‐factor with substrates containing different methyl‐accepting polar atoms. We observe statistically significant differences in the distribution of EF strengths for O‐ and N‐targeting MTases (Figure 2, left). The EF strengths of O‐targeting MTases are on average 136.0 MV/cm more negative than those targeting nitrogen. Using student's t‐test, the EF distributions are statistically significant with a p‐value of 2.0 × 10⁻⁶. The average EF of 20.0 MV/cm for N‐targeting MTases is 62.1% more positive than the 13.8 MV/cm average field for the broader data set. The results show that the protein scaffolds of N‐targeting MTases have more positive EFs than O‐targeting MTases. We believe these EFs likely help to overcome the lower electronegativity of nitrogen, in turn making it a better acceptor of SAM's methyl group. Oxygen's stronger electronegativity makes it a naturally stronger methyl group acceptor, and therefore, MTases have taken fewer efforts to evolve their interior EFs. Notably, these analyses only reflect a general trend because the specific functional groups under each heteroatom‐targeting category involve large disparities of methyl‐accepting ability (e.g., hydroxyl versus carboxyl).
FIGURE 2.
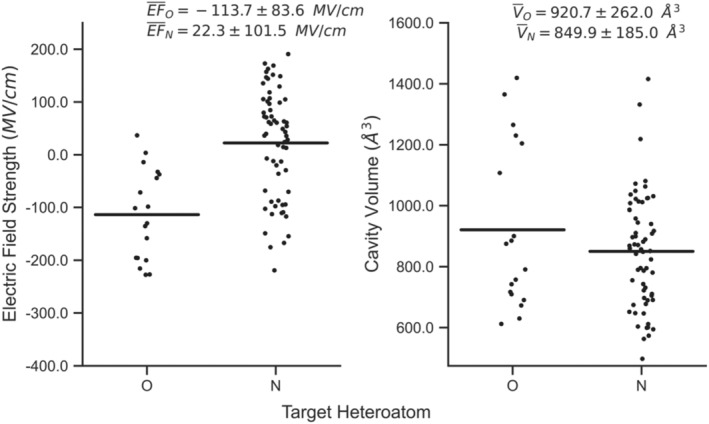
Distributions of measured electric field (EF) strength and cavity volume as a function of target heteroatom. The left and right plots show strip plots with the EF and cavity volume measurements for oxygen (O) and nitrogen (N), respectively. The bars for each data series represent the mean value for that subset. Average values and standard deviations are shown at the top of each subplot. Carbon‐targeting MTases do exist in the data set but have been omitted from this figure as only five data points exist.
The distributions of EF strength for both O‐ and N‐targeting MTases show considerable variation. We attribute this variation in field strength to the underlying substrate diversity seen for these categories of MTases. The substrates for 55.6% and 52.4% of the O‐ and N‐targeting MTases are RNA/DNA, respectively. RNA/DNA substrates are structurally and electrostatically diverse. Targeting different sequences or nucleotide atoms requires significant adjustment to the local substrate environments, resulting in noticeable EF strength variation.
In contrast, differences in cavity volumes for O‐ and N‐targeting MTases are not statistically significant. Cavity volumes only differ by 70.8 Å3 on average (Figure 2b), which is considerably smaller than the standard deviations of 262.0 and 185.0 Å3 for O‐ and N‐targeting targeting MTases, respectively. Using the student's t‐test, the cavity volume distributions are not considered to be statistically significant with a p‐value of 0.2. The upper and lower limits of cavity volumes for both heteroatom targeting enzymes are also comparable (i.e., ~550 to ~1425 Å3), further suggesting that the enzymes do not directly adjust their volumes to accommodate different heteroatoms.
The inverse relationship between EF and electronegativity of the target atom is conserved when looking only at MTases targeting RNA/DNA (Figure 3 ). The MTases targeting carbon atoms are also included in this comparison. O‐targeting MTases have the most negative EF strength with an average value of − 166.5 MV/cm. N‐targeting MTases still have negative EF strength with an average of −11.4 MV/cm, but it is much less negative than those of O‐targeting counterparts. C‐targeting is the least electronegative of the three elements and has the most positive EF strength with an average of 83.2 MV/cm, which is almost four times higher than the median seen across the larger MTase data set. This observation is consistent with our hypothesis that MTases targeting atoms of a weaker electronegativity experience a stronger evolutionary pressure for accelerating the methyl transfer reactions. As such, they evolve to produce more positive EFs in order to enhance the cleavage of S–C bond for methyl donation.
FIGURE 3.
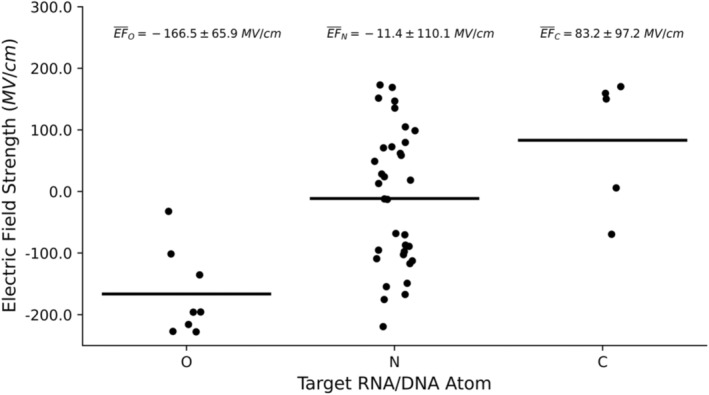
Distributions of measured electric field (EF) strength for MTases targeting RNA or DNA substrates. Values are grouped by target atom with oxygen, nitrogen, and carbon being represented by O, N, and C, respectively. The black line for each category represents the average EF and the average for each atom type plus or minus the standard deviation. Averages and standard deviations for each atom are listed above their respective distribution plots.
We investigated how interior EF and cavity volumes of N‐targeting MTases vary with respect to target atom geometry. We highlighted the N‐targeting MTases for RNA/DNA and histones because they are the two largest substrate types in the data set with 50 and 21 enzymes catalyzing for these reactants, respectively. Nucleic acids are more diverse, containing nitrogen in both sp2 and sp3 hybridization states (Figure 4b). Note that the sp2 hybridized cyclic ‐NH2 groups are conjugated and will exist in a mixed sp2/sp3 state. For the purposes of formal classification, we consider them to be sp3. We have also performed an alternative analysis with cyclic ‐NH2 groups placed into a separate sp2/sp3 mixed group (Figure S4). Histone MTases target nitrogen on lysine residues in sp3 hybridization only. Notably, the amine group with sp3 N can also have varying protonation states depending on local chemical environment. Wide distribution of EF strengths along the S–C bonds mirror this diversity, with RNA/DNA and histone MTases having standard deviations of 121.4 and 55.3 MV/cm, respectively (Figure 4a). RNA/DNA and histone targeting MTases have average EFs of −31.7 and 68.6 MV/cm, respectively. We believe the stronger EF for histone MTases may be due to the protonation state of the terminal nitrogen. In biological pH ranges, it will be in an NH3 + state, meaning the methyl‐accepting lone pair on the nitrogen is occupied. We hypothesize that the stronger EF strength aids in deprotonating the nitrogen, allowing methylation to occur. This notion is supported by the differences in EF strength for sp2 and sp3‐targeting RNA/DNA MTases which have averages of −65.6 and 52.9 MV/cm, respectively. This result demonstrates there is a clear trend between EF strength and the hybridization state of the target atom. The trend remains consistent even by the classification of cyclic ‐NH2 groups into a separate sp2/sp3 mixed group (Figure S4).
FIGURE 4.
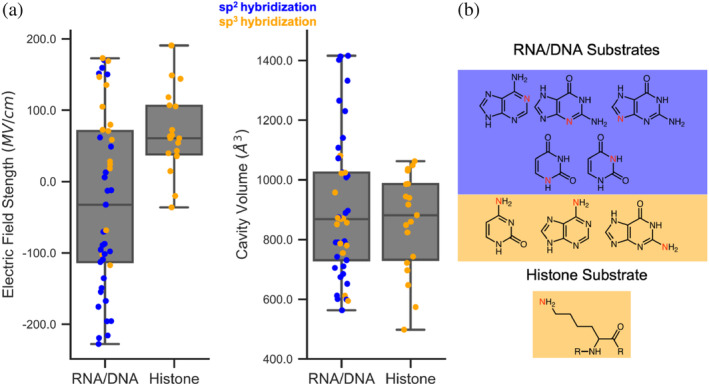
Electric field strength and cavity volume data for N‐targeting MTases stratified by target substrate type. Target substrates are determined by enzyme commission number and the subplots in (a) show actual data points overlaid onto boxplots. They are color‐coded by formal hybridization classification with blue corresponding to substrates with the target atom in a sp2 hybridization state and orange corresponding to when the target atom is in a sp3 hybridization state. On the right (b), the substrates are shown with target atoms highlighted in red. Substrates with sp2 and sp3 target atoms have blue and orange backgrounds, respectively.
Cavity volume spreads repeat the trend seen with EF spreads with RNA/DNA and histone MTases having standard deviations of 231.0 and 162.9 Å3, respectively. We believe the increased variation in volume for RNA/DNA targeting enzymes reflects the geometric diversity seen in nucleic acid substrates. Target atoms in nucleic acid substrates have diverse locations within their respective residues and have both sp2 and sp3 hybridization, whereas all histone targets have the same sp3 hybridization.
Finally, we investigated how the presence of metal ions mediate interior EF of MTases (Figure 5). A total of 19 enzymes have a metal ion present, with 2 having magnesium, and 17 having zinc. The average distance from zinc ions to the S–C midpoint is 30.6 Å, whereas the magnesium ions are only 5.1 Å away, on average. Looking at electrostatics, for 17 of the 19 structures the metal ion makes the EF along SAM's S–C bond more negative by an average of − 55.5 MV/cm. Metal ions do not typically enhance the EF strength for the purpose of methyl donation, but their corresponding host protein scaffolds work to offset these effects. MTases with metal ions have an average EF of 58.8 MV/cm versus the average of −20.1 MV/cm for those without metals (Figure 5a). Given the largely negative contributions of metal ions to EF strength, MTases containing metals feature extremely positive contributions from protein scaffold alone. Instead of directly aiding the transfer of SAM's methyl group, these binding metal ions likely contribute by stabilizing the enzyme structure or mediating protein dynamics. Many of the zinc‐containing enzymes have zinc fingertips which stabilize distal regions of enzyme structure (Bogani et al., 2013; Klug & Schwabe, 1995). In COMT, the magnesium ion stabilizes the catecholate intermediate although it directly worsens the EF strength. Similar to heteroatom‐based stratifications, there is an observed upper limit of EF near ~200 MV/cm for both metal and non‐metal MTases. The lower bound for non‐metal MTases is −306.2 versus −254.9 MV/cm for metal MTases. The consistently tighter EF strength spread and higher range of metal‐containing MTases indicates that MTases have consistently evolved to directly offset the negative EF strength contribution of the metal ions contained within.
FIGURE 5.
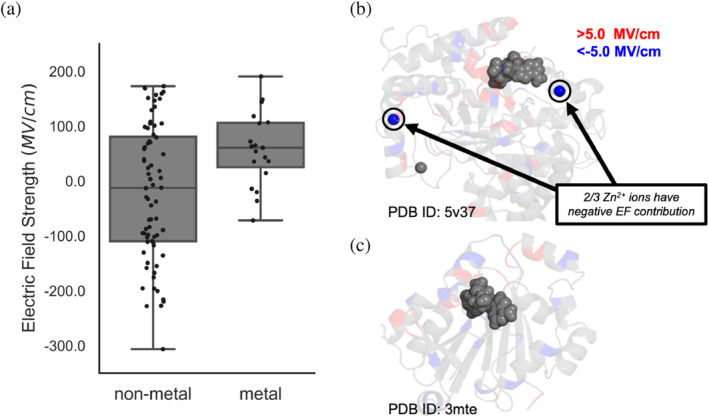
Distributions of electric fields (EFs) for MTases as a function of containing metal ions. The plot on the left visualizes raw values as black dots and box plots in gray. Inlay (b) shows an example of a structure with three metal ions where two provide negative EF contribution. The transparent amino acids are colored red and blue when they contribute >5.0 and < −5.0 MV/cm to the EF, respectively. Inlay (c) shows a structure that has no metal ions present. SAM is rendered as gray spheres in both (b and c).
4. CONCLUSION
We carried out a high‐throughput analysis of 91 SAM MTase structures focusing on how these enzymes have achieved enzymatic efficiency across a wide range of substrates. First, we calculated cavity volume and EF strength values for each structure and then determined the catalytic function of each protein. When looking at O‐ and N‐ targeting MTases, we found there was not a significant difference in cavity volumes but that distributions for EF strength differed at a statistically significant level. This trend was also conserved when looking only at MTases that target RNA or DNA substrates, including a small number of C‐targeting MTases. Comparing values for MTases targeting RNA/DNA and histones, we observed variations in both EF strength and cavity volume between these categories. More variation was seen in the EF strength and cavity volume values for RNA/DNA‐targeting MTases than histone‐targeting MTases which mirrors the associated diversity within each class of substrates. We observed that MTases targeting sp3 hybridized atoms have more positive EF strengths than those targeting sp2 atoms. In the case of histone targeting MTases, we hypothesize that the stronger EF helps prepare nitrogen centers to accept a methyl group. Lastly, we investigated the role of metal ions and found that they largely have a negative contribution to EF strength and that the sequences of metal‐containing enzymes appear to offset this effect.
We view this work as an extension of previous studies which compared computational predictions among smaller data sets (Horowitz et al., 2013; Yang et al., 2019). Previous studies used more expensive techniques less amenable to an HTP approach. Still, we believe this work demonstrates the feasibility of larger‐scale analyses as well as the insights that can be gained. We look forward to applying higher precision techniques to data sets of similar size in the future. From a computational perspective, the use of RESP charges in the calculation of EF strength cannot reflect the impact of charge transfer and polarization on the reaction. Given the reported role of charge transfer in SAM mechanisms (Yang et al., 2019), we plan to employ more precise QM/MM methods or polarizable force fields to investigate these aspects through HTP studies in the future.
CONFLICT OF INTEREST STATEMENT
The authors declare no competing financial interest.
Supporting information
DATA S1. Supporting Information.
ACKNOWLEDGMENTS
The authors thank Qianzhen Shao and Prof. Jens Meiler for their suggestions and comments. This research was supported by the startup grant from Vanderbilt University. Christopher Jurich is supposed by Vanderbilt Chemistry‐Biology Interface Training Grant (T32GM065086). Zhongyue J. Yang is supported by the National Institute of General Medical Sciences of the National Institutes of Health under award number R35GM146982 and Rosetta Commons Seed grant.
Jurich C, Yang ZJ. High‐throughput computational investigation of protein electrostatics and cavity for SAM‐dependent methyltransferases. Protein Science. 2023;32(7):e4690. 10.1002/pro.4690
Review Editor: Lynn Kamerlin
DATA AVAILABILITY STATEMENT
The code, structures, and parameter files can all be found at https://github.com/chrisjurich/sam-pockets. The code of EnzyHTP can be found at https://github.com/ChemBioHTP/EnzyHTP. AMBER 19 is available from http://ambermd.org/. Mole2.0 can be found at https://webchem.ncbr.muni.cz/Platform/App/Mole. Gaussian16 is available from https://gaussian.com/. Multiwfn can be found at http://sobereva.com/.
REFERENCES
- Akil M, Kolachana BS, Rothmond DA, Hyde TM, Weinberger DR, Kleinman JE. Catechol‐O‐methyltransferase genotype and dopamine regulation in the human brain. J Neurosci. 2003;23(6):2008–13. [DOI] [PMC free article] [PubMed] [Google Scholar]
- Barthels F, Schirmeister T, Kersten C. BANΔIT: B'‐factor analysis for drug design and structural biology. Mol Inform. 2021;40(1):2000144. [DOI] [PMC free article] [PubMed] [Google Scholar]
- Bartlett GJ, Porter CT, Borkakoti N, Thornton JM. Analysis of catalytic residues in enzyme active sites. J Mol Biol. 2002;324(1):105–21. [DOI] [PubMed] [Google Scholar]
- Berman HM, Gierasch LM. How the Protein Data Bank changed biology: an introduction to the JBC reviews thematic series, part 1. J Biol Chem. 2021;296:100608. [DOI] [PMC free article] [PubMed] [Google Scholar]
- Bogani D, Morgan MA, Nelson AC, Costello I, McGouran JF, Kessler BM, et al. The PR/SET domain zinc finger protein Prdm4 regulates gene expression in embryonic stem cells but plays a nonessential role in the developing mouse embryo. Mol Cell Biol. 2013;33(19):3936–50. [DOI] [PMC free article] [PubMed] [Google Scholar]
- Bügl H, Fauman EB, Staker BL, Zheng F, Kushner SR, Saper MA, et al. RNA methylation under heat shock control. Mol Cell. 2000;6(2):349–60. [DOI] [PubMed] [Google Scholar]
- Chang A, Jeske L, Ulbrich S, Hofmann J, Koblitz J, Schomburg I, et al. BRENDA, the ELIXIR core data resource in 2021: new developments and updates. Nucleic Acids Res. 2020;49(D1):D498–508. [DOI] [PMC free article] [PubMed] [Google Scholar]
- Chemical Computing Group ULC (CCG) . Molecular operating environment (MOE). 2022.02.
- Coudert E, Gehant S, de Castro E, Pozzato M, Baratin D, Neto T, et al. Annotation of biologically relevant ligands in UniProtKB using ChEBI. Bioinformatics. 2022;39(1):btac793. [DOI] [PMC free article] [PubMed] [Google Scholar]
- Couture J‐F, Hauk G, Thompson MJ, Blackburn GM, Trievel RC. Catalytic roles for carbon‐oxygen hydrogen bonding in SET domain lysine methyltransferases. J Biol Chem. 2006;281(28):19280–7. [DOI] [PubMed] [Google Scholar]
- Dhe‐Paganon S, Syeda F, Park L. DNA methyl transferase 1: regulatory mechanisms and implications in health and disease. Int J Biochem Mol Biol. 2011;2(1):58–66. [PMC free article] [PubMed] [Google Scholar]
- Falnes PØ, Jakobsson ME, Davydova E, Ho A, Małecki J. Protein lysine methylation by seven‐β‐strand methyltransferases. Biochem J. 2016;473(14):1995–2009. [DOI] [PubMed] [Google Scholar]
- Frisch MJ, Trucks GW, Schlegel HB, Scuseria GE, Robb MA, Cheeseman JR, et al. Gaussian 16 Rev. C.01. Wallingford, CT; 2016. [Google Scholar]
- Horowitz S, Adhikari U, Dirk LMA, Del Rizzo PA, Mehl RA, Houtz RL, et al. Manipulating unconventional CH‐based hydrogen bonding in a methyltransferase via noncanonical amino acid mutagenesis. ACS Chem Biol. 2014;9(8):1692–7. [DOI] [PubMed] [Google Scholar]
- Horowitz S, Dirk LM, Yesselman JD, Nimtz JS, Adhikari U, Mehl RA, et al. Conservation and functional importance of carbon‐oxygen hydrogen bonding in AdoMet‐dependent methyltransferases. J Am Chem Soc. 2013;135(41):15536–48. [DOI] [PubMed] [Google Scholar]
- Ji Z, Kozuch J, Mathews II, Diercks CS, Shamsudin Y, Schulz MA, et al. Protein electric fields enable faster and longer‐lasting covalent inhibition of β‐lactamases. J Am Chem Soc. 2022;144(45):20947–54. [DOI] [PMC free article] [PubMed] [Google Scholar]
- Jindal G, Warshel A. Exploring the dependence of QM/MM calculations of enzyme catalysis on the size of the QM region. J Phys Chem B. 2016;120(37):9913–21. [DOI] [PMC free article] [PubMed] [Google Scholar]
- Kamenik AS, Handle PH, Hofer F, Kahler U, Kraml J, Liedl KR. Polarizable and non‐polarizable force fields: protein folding, unfolding, and misfolding. J Chem Phys. 2020;153(18):185102. [DOI] [PubMed] [Google Scholar]
- Katada S, Sassone‐Corsi P. The histone methyltransferase MLL1 permits the oscillation of circadian gene expression. Nat Struct Mol Biol. 2010;17(12):1414–21. [DOI] [PMC free article] [PubMed] [Google Scholar]
- Klug A, Schwabe JWR. Zinc fingers. FASEB J. 1995;9(8):597–604. [PubMed] [Google Scholar]
- Kulik HJ, Zhang J, Klinman JP, Martínez TJ. How large should the QM region be in QM/MM calculations? The case of catechol O‐methyltransferase. J Phys Chem B. 2016;120(44):11381–94. [DOI] [PMC free article] [PubMed] [Google Scholar]
- Lameira J, Bora RP, Chu ZT, Warshel A. Methyltransferases do not work by compression, cratic, or desolvation effects, but by electrostatic preorganization. Proteins. 2015;83(2):318–30. [DOI] [PMC free article] [PubMed] [Google Scholar]
- Liscombe DK, Louie GV, Noel JP. Architectures, mechanisms and molecular evolution of natural product methyltransferases. Nat Prod Rep. 2012;29(10):1238–50. [DOI] [PubMed] [Google Scholar]
- Lu T, Chen F. Multiwfn: a multifunctional wavefunction analyzer. J Comput Chem. 2012;33(5):580–92. [DOI] [PubMed] [Google Scholar]
- Männistö PT, Kaakkola S. Catechol–O–methyltransferase (COMT): biochemistry, molecular biology, pharmacology, and clinical efficacy of the new selective COMT inhibitors. Pharmacol Rev. 1999;51(4):593–628. [PubMed] [Google Scholar]
- Min J, Feng Q, Li Z, Zhang Y, Xu R‐M. Structure of the catalytic domain of human DOT1L, a non‐SET domain nucleosomal histone methyltransferase. Cell. 2003;112(5):711–23. [DOI] [PubMed] [Google Scholar]
- Moore LD, Le T, Fan G. DNA methylation and its basic function. Neuropsychopharmacology. 2013;38(1):23–38. [DOI] [PMC free article] [PubMed] [Google Scholar]
- Nai Y‐S, Huang Y‐C, Yen M‐R, Chen P‐Y. Diversity of fungal DNA methyltransferases and their association with DNA methylation patterns. Front Microbiol. 2021;11:616922. [DOI] [PMC free article] [PubMed] [Google Scholar]
- Oanca G, Asadi M, Saha A, Ramachandran B, Warshel A. Exploring the catalytic reaction of cysteine proteases. J Phys Chem B. 2020;124(50):11349–56. [DOI] [PubMed] [Google Scholar]
- Ohashi M, Liu F, Hai Y, Chen M, Tang MC, Yang Z, et al. SAM‐dependent enzyme‐catalysed pericyclic reactions in natural product biosynthesis. Nature. 2017;549(7673):502–6. [DOI] [PMC free article] [PubMed] [Google Scholar]
- Ohashi M, Tan D, Lu J, Jamieson CS, Kanayama D, Zhou J, et al. Enzymatic cis‐decalin formation in natural product biosynthesis. J Am Chem Soc. 2023;145:3301–5. [DOI] [PMC free article] [PubMed] [Google Scholar]
- Paik WK, Kim S, Lim IK. Protein methylation and interaction with the antiproliferative gene, BTG2/TIS21/Pc3. Yonsei Med J. 2014;55(2):292–303. [DOI] [PMC free article] [PubMed] [Google Scholar]
- Patra N, Ioannidis EI, Kulik HJ. Computational investigation of the interplay of substrate positioning and reactivity in catechol O‐methyltransferase. PLOS ONE. 2016;11(8):e0161868. [DOI] [PMC free article] [PubMed] [Google Scholar]
- Petřek M, Otyepka M, Banáš P, Košinová P, Koča J, Damborský J. CAVER: a new tool to explore routes from protein clefts, pockets and cavities. BMC Bioinformatics. 2006;7(1). 10.1186/1471-2105-7-316 [DOI] [PMC free article] [PubMed] [Google Scholar]
- Roca M, Williams IH. Transition‐state vibrational analysis and isotope effects for COMT‐catalyzed methyl transfer. J Am Chem Soc. 2020;142(36):15548–59. [DOI] [PMC free article] [PubMed] [Google Scholar]
- Rod TH, Ryde U. Accurate QM/MM free energy calculations of enzyme reactions: methylation by catechol O‐methyltransferase. J Chem Theory Comput. 2005;1(6):1240–51. [DOI] [PubMed] [Google Scholar]
- Ruggiero GD, Williams IH, Roca M, Moliner V, Tuñón I. QM/MM determination of kinetic isotope effects for COMT‐catalyzed methyl transfer does not support compression hypothesis. J Am Chem Soc. 2004;126(28):8634–5. [DOI] [PubMed] [Google Scholar]
- Sehnal D, Svobodová Vařeková R, Berka K, Pravda L, Navrátilová V, Banáš P, et al. MOLE 2.0: advanced approach for analysis of biomacromolecular channels. J Chem. 2013;5(1):39. [DOI] [PMC free article] [PubMed] [Google Scholar]
- Shao Q, Jiang Y, Yang ZJ. EnzyHTP: a high‐throughput computational platform for enzyme modeling. J Chem Inf Model. 2022;62(3):647–55. [DOI] [PubMed] [Google Scholar]
- Soriano A, Castillo R, Christov C, Andrés J, Moliner V, Tuñón I. Catalysis in glycine N‐methyltransferase: testing the electrostatic stabilization and compression hypothesis. Biochemistry. 2006;45(50):14917–25. [DOI] [PubMed] [Google Scholar]
- Sousa SF, Calixto AR, Ferreira P, Ramos MJ, Lim C, Fernandes PA. Activation free energy, substrate binding free energy, and enzyme efficiency fall in a very narrow range of values for most enzymes. ACS Catal. 2020;10(15):8444–53. [Google Scholar]
- Świderek K, Tuñón I, Williams IH, Moliner V. Insights on the origin of catalysis on glycine N‐methyltransferase from computational modeling. J Am Chem Soc. 2018;140(12):4327–34. [DOI] [PMC free article] [PubMed] [Google Scholar]
- Trievel RC, Flynn EM, Houtz RL, Hurley JH. Mechanism of multiple lysine methylation by the SET domain enzyme Rubisco LSMT. Nat Struct Mol Biol. 2003;10(7):545–52. [DOI] [PubMed] [Google Scholar]
- Vasina M, Velecký J, Planas‐Iglesias J, Marques SM, Skarupova J, Damborsky J, et al. Tools for computational design and high‐throughput screening of therapeutic enzymes. Adv Drug Deliv Rev. 2022;183:114143. [DOI] [PubMed] [Google Scholar]
- Webb B, Sali A. Protein structure modeling with MODELLER. Methods Mol Biol. 2014;1137:1–15. [DOI] [PubMed] [Google Scholar]
- Winter DL, Hart‐Smith G, Wilkins MR. Characterization of protein methyltransferases Rkm1, Rkm4, Efm4, Efm7, Set5 and Hmt1 reveals extensive post‐translational modification. J Mol Biol. 2018;430(1):102–18. [DOI] [PubMed] [Google Scholar]
- Witte AV, Flöel A. Effects of COMT polymorphisms on brain function and behavior in health and disease. Brain Res Bull. 2012;88(5):418–28. [DOI] [PubMed] [Google Scholar]
- Yan B, Ran X, Gollu A, Cheng Z, Zhou X, Chen Y, et al. IntEnzyDB: an integrated structure‐kinetics enzymology database. J Chem Inf Model. 2022;62(22):5841–8. [DOI] [PMC free article] [PubMed] [Google Scholar]
- Yan B, Ran X, Jiang Y, Torrence SK, Yuan L, Shao Q, et al. Rate‐perturbing single amino acid mutation for hydrolases: a statistical profiling. J Phys Chem B. 2021;125(38):10682–91. [DOI] [PubMed] [Google Scholar]
- Yang Z, Liu F, Steeves AH, Kulik HJ. Quantum mechanical description of electrostatics provides a unified picture of catalytic action across methyltransferases. J Phys Chem Lett. 2019;10(13):3779–87. [DOI] [PubMed] [Google Scholar]
- Zhang H, Lang Z, Zhu J‐K. Dynamics and function of DNA methylation in plants. Nat Rev Mol Cell Biol. 2018;19(8):489–506. [DOI] [PubMed] [Google Scholar]
- Zhang J, Balsbaugh JL, Gao S, Ahn NG, Klinman JP. Hydrogen deuterium exchange defines catalytically linked regions of protein flexibility in the catechol O‐methyltransferase reaction. Proc Natl Acad Sci. 2020;117(20):10797–805. [DOI] [PMC free article] [PubMed] [Google Scholar]
- Zhang J, Klinman JP. Convergent mechanistic features between the structurally diverse N‐ and O‐methyltransferases: glycine N‐methyltransferase and catechol O‐methyltransferase. J Am Chem Soc. 2016;138(29):9158–65. [DOI] [PMC free article] [PubMed] [Google Scholar]
- Zhang J, Kulik HJ, Martinez TJ, Klinman JP. Mediation of donor‐acceptor distance in an enzymatic methyl transfer reaction. Proc Natl Acad Sci. 2015;112(26):7954–9. [DOI] [PMC free article] [PubMed] [Google Scholar]
- Zheng C, Mao Y, Kozuch J, Atsango AO, Ji Z, Markland TE, et al. A two‐directional vibrational probe reveals different electric field orientations in solution and an enzyme active site. Nat Chem. 2022;14(8):891–7. [DOI] [PMC free article] [PubMed] [Google Scholar]
Associated Data
This section collects any data citations, data availability statements, or supplementary materials included in this article.
Supplementary Materials
DATA S1. Supporting Information.
Data Availability Statement
The code, structures, and parameter files can all be found at https://github.com/chrisjurich/sam-pockets. The code of EnzyHTP can be found at https://github.com/ChemBioHTP/EnzyHTP. AMBER 19 is available from http://ambermd.org/. Mole2.0 can be found at https://webchem.ncbr.muni.cz/Platform/App/Mole. Gaussian16 is available from https://gaussian.com/. Multiwfn can be found at http://sobereva.com/.


