

Abstract
Hsp90 is a molecular chaperone involved in the refolding and activation of numerous protein substrates referred to as clients. While the molecular determinants of Hsp90 client specificity are poorly understood and limited to a handful of client proteins, strong clients are thought to be destabilized and conformationally extended. Here, we measured the phosphotransferase activity of 3929 variants of the tyrosine kinase Src in both the presence and absence of an Hsp90 inhibitor. We identified 84 previously unknown functionally dependent client variants. Unexpectedly, many destabilized or extended variants were not functionally dependent on Hsp90. Instead, functionally dependent client variants were clustered in the αF pocket and β1–β2 strand regions of Src, which have yet to be described in driving Hsp90 dependence. Hsp90 dependence was also strongly correlated with kinase activity. We found that a combination of activation, global extension, and general conformational flexibility, primarily induced by variants at the αF pocket and β1–β2 strands, was necessary to render Src functionally dependent on Hsp90. Moreover, the degree of activation and flexibility required to transform Src into a functionally dependent client varied with variant location, suggesting that a combination of regulatory domain disengagement and catalytic domain flexibility are required for chaperone dependence. Thus, by studying the chaperone dependence of a massive number of variants, we highlight factors driving Hsp90 client specificity and propose a model of chaperone‐kinase interactions.
Keywords: chaperone, client, Hsp90, Hsp90 inhibitor, src kinase, tyrosine kinase
1. INTRODUCTION
Heat shock protein 90 (Hsp90) is a molecular chaperone that assists in the maturation and folding of other proteins, called clients (Biebl & Buchner, 2019). Hsp90 clients are diverse proteins involved in signal transduction, including transcription factors, kinases, and steroid hormone receptors. Hsp90 can stabilize proteins that lead to cancer progression and neurodegeneration, and thus plays an important role in the progression of these and other diseases (Bohush et al., 2019; Jaeger & Whitesell, 2019).
Because of the role of Hsp90 in disease, small molecule Hsp90 inhibitors have been developed that block Hsp90's interaction with client kinases, often leading to client aggregation or degradation (Boczek et al., 2015). For Hsp90 inhibitor treatment to deplete disease‐causing proteins through aggregation or degradation, the protein must be a strong client, meaning the target protein's activity has a strong dependence on Hsp90 chaperoning. However, the mechanism driving Hsp90 client specificity, critical for Hsp90 inhibitor treatment, remains elusive.
The challenge of characterizing the determinants of Hsp90 client specificity is best demonstrated by highly conserved kinases that exhibit divergent client statuses. For example, ErbB‐1 and ErbB‐2, closely related receptor tyrosine kinases, have different client strengths owing to the disparate hydrophobic properties of their αC‐β4 loops (Mandal et al., 2007; Taipale et al., 2012). v‐Src and c‐Src are non‐receptor tyrosine kinases that share 98% protein sequence homology. While c‐Src is not a strong client of Hsp90, its oncogenic viral descendant, v‐Src is a strong client (Anderson et al., 1985). A single amino acid change in c‐Src, SrcE381K, can increase its interaction with Hsp90 by 30% compared to c‐Src (Taipale et al., 2013). Biochemical studies of c‐Src and v‐Src, which differ by only a handful of amino acids, suggest that Hsp90 client status depends on the differing intrinsic stability and aggregation propensity of each kinase (Boczek et al., 2015; Luo et al., 2017; Taipale et al., 2012). Molecular dynamics studies of v‐Src and c‐Src also suggest that Hsp90 preferentially recognizes the extended, activated conformation of this multi‐domain kinase, which is less stable than the closed, inactivated conformation (Luo et al., 2017). More generally, high‐throughput approaches have been employed to measure the interaction strength between Hsp90 and hundreds of different human kinases, revealing a correlation between Hsp90 interaction strength and thermostability for a subset of kinases (Taipale et al., 2013). However, this approach did not reveal an Hsp90 sequence recognition motif and did not measure the functional consequences of kinases interacting with the chaperone.
Thus, many questions surrounding Hsp90 kinase client recognition and processing remain unanswered. For example, are there other kinase structural motifs like the αC‐β4 loop that are recognized by Hsp90? What, if any, factors besides stability and surface hydrophobicity affect Hsp90 dependence? To what extent does Hsp90 recognize client kinases through alterations in kinase conformation? Of the client kinases recognized by Hsp90, which decrease in activity following Hsp90 inhibition? Finding answers to these questions is challenging due to the sequence diversity of Hsp90 clients. However, the advent of deep mutational scanning, where the effect of nearly all possible single amino acid variants of a protein can be measured simultaneously, offers a way to understand the physicochemical and structural bases of protein activity and proteostasis (Fowler & Fields, 2014). For example, we previously used deep mutational scanning to reveal mechanistic details of kinase regulation through changes in phosphotransferase activity (Ahler et al., 2019). In other examples, deep mutational scans of influenza hemagglutinin, metabolic enzyme dihydrofolate reductase (DHFR), and membrane protein rhodopsin in different proteostasis environments revealed how changes in mutational tolerance could impact a protein's allowable evolutionary sequence space (Penn et al., 2020; Phillips et al., 2018; Thompson et al., 2020).
Here, we explore Hsp90 dependence and client processing, combining deep mutational scanning, proteostasis perturbations, and computational approaches in the context of the model Hsp90 client, Src kinase. Src, a non‐receptor tyrosine kinase and one of the Src family kinases (SFKs), functions as a key mediator of signal transduction (Parsons & Parsons, 2004). Once activated by cell‐surface receptors, Src interacts with substrates to drive cell proliferation, differentiation, angiogenesis, and cell survival (Liu et al., 2015; Wheeler et al., 2009). Like ~50% of human kinases, Src is composed of a catalytic domain and multiple accessory domains that regulate its activity (Manning et al., 2002). Aside from the catalytic domain (CD), Src contains the unique, Src homology 4 (SH4), SH3, and SH2 domains in addition to a regulatory C‐terminal tail (Figure 1a,b). These regulatory domains act in concert to hold Src in its closed, inactive conformation. In the closed conformation, the SH4 domain forms an interface with the αF pocket on the CD while the SH3 and SH2 domains interact with the N‐ and C‐lobes of the CD, respectively (Figure 1c) (Ahler et al., 2019; Williams et al., 1997; Xu et al., 1997; Xu, Doshi, et al., 1999). Phosphorylation at Y530 in the C‐terminal tail strengthens intramolecular engagement of the SH2 domain to further repress Src activity (Nada et al., 1991). Competitive association of the SH4, SH3, and SH2 domains with other intracellular interactors, as well as phosphorylation at Y419 release these autoinhibitory interactions and activate Src (Ahler et al., 2019; Bjorge et al., 2000; Schlessinger, 1994). Mutations that disrupt autoinhibition allow Src to spontaneously access its active conformation and can lead to aberrant Src activity and oncogenesis (Dehm & Bonham, 2004; Liu et al., 2015; Wheeler et al., 2009).
FIGURE 1.

(a) Domain organization (SH4, Unique, SH3, SH2, and CD) of Src kinase. (b) In a closed conformation, Src is autoinhibited by the SH4, SH3, and SH2 domains (left) that, when released, yield Src's extended, active conformation (right). (c) Structure of Src in the inactive, closed conformation (PDB ID: 2SRC) showing the N‐lobe, C‐lobe, and the αF pocket. The SH2 domain is shown in red and the SH3 domain is shown in yellow. (d) The Src variant library was grown in basal conditions (DMSO) and Hsp90‐depleted conditions (radicicol) and differences in growth rates were used to determine variant Hsp90 dependence. (e) Individually measured growth rates of weak client SrcWT and functionally dependent client E381K in radicicol and DMSO (n = 3).
We evaluated the effect of 3929 Src CD variants on phosphotransferase activity in both the presence and absence of an Hsp90 inhibitor. By measuring change in Src variant phosphotransferase activity following Hsp90 inhibition, we identified 84 previously unknown functionally dependent client variants. These variants were distributed throughout the CD, but clustered in the β1–β2 strands and αF pocket regions of Src, previously unknown to drive Hsp90 interaction. While the E381K mutation in the αF pocket had previously been identified as a driver for Hsp90 interaction, the involvement of the remainder of the αF pocket in Hsp90 dependence has yet to be shown. Comparatively few client variants occurred in the regulatory SH3‐CD and SH2‐CD interfaces, indicating that Hsp90 recognition of Src does not occur solely due to disruption of regulatory interactions. Rather, Hsp90 dependence and conformational flexibility strongly correlated with kinase activity. We found that a combination of activation and the general flexibility of Src's global conformation, primarily induced by variants at the αF pocket and β1–β2 strands, was necessary to transform Src into a functionally dependent client. Moreover, the degree of activation and extension required to transform Src into a functionally dependent client changed depending on the variant hotspot location. Thus, our data suggest that regulatory domain disengagement and catalytic domain flexibility are both required to transform Src into a functionally dependent client. Our work demonstrates the utility of using deep mutational scanning to study the functional consequences of complex and dynamic protein–protein interactions such as protein chaperoning.
2. MULTIPLEXED MEASUREMENT OF HSP90 EFFECTS ON SRC VARIANT ACTIVITY
We previously used a S. cerevisiae assay to conduct a deep mutational scan of the c‐Src CD, measuring the effects of over 3500 c‐Src variants on the growth of the BY4741 Green Monster strain (see Section 4 for genotype) (Ahler et al., 2019; Brugge et al., 1987). In this assay, Src is expressed from a plasmid under the control of a galactose inducible promoter. Src activity disrupts a yeast spore wall remodeling pathway and limits the growth rate of cells (Kritzer et al., 2018). We showed that growth rates of yeast expressing different Src variants accurately reflected in vitro phosphotransferase activity as well as yeast and cultured human cell phosphotyrosine levels (Ahler et al., 2019).
We reasoned that we could use the yeast assay to measure the effect of Hsp90 on Src activity and thus comprehensively characterized the Hsp90 dependence of thousands of variants. Yeast Hsp90 is 60% identical to the human isoform Hsp90α and has been used as a model to investigate Hsp90 dependence of human Src variants (Boczek et al., 2015; Chen et al., 2006; Xu & Lindquist, 1993). The activity of functionally dependent clients depends on Hsp90, and thus changes in yeast growth following treatment with an Hsp90 inhibitor reflect changes in Src‐mediated toxicity (Xu, Singer, & Lindquist, 1999). In particular, the growth of yeast expressing functionally dependent client Src variants is rescued upon Hsp90 inhibition because of these variants' dependence on Hsp90 (Boczek et al., 2015) (Figure 1d). To inhibit Hsp90, we used radicicol, a small molecule that binds to Hsp90 and disrupts its function. We constructed a radicicol dose–response curve for yeast expressing SrcWT, SrcE381K, and an empty vector control to identify a concentration that resulted in the expected moderate increase in growth rate in cells expressing the weak client SrcWT (Figure S1) and a larger increase in growth rate in cells expressing the functionally dependent client SrcE381K. We selected 800 nM radicicol which, while somewhat toxic, increased the growth of yeast expressing SrcWT and greatly increased the growth of yeast expressing SrcE381K. (Figure 1e) (Taipale et al., 2013). Thus, yeast growth rates could be used to measure the effect of Hsp90 inhibition on Src variant‐mediated changes in yeast growth and, by proxy, Src phosphotransferase activity.
We transformed a previously generated library of ~4000 Src CD variants into yeast, induced Src expression, cultured the library in the presence of radicicol, and withdrew samples from each culture periodically (Ahler et al., 2019). We deeply sequenced each sample to quantify the frequency of each variant at each timepoint. We converted these frequencies into variant activity scores by taking the ratio of frequencies of each variant relative to the SrcWT frequency at each timepoint and performing a weighted linear regression in which the negative slope of the line was the activity score (Rubin et al., 2017). We normalized activity scores such that SrcWT had a score of 1. Using this method, we calculated the activity of 3929 (3366 nonsynonymous, 430 synonymous, and 133 nonsense) Src variants in both basal and Hsp90 inhibited conditions, representing 73% of possible CD single variants. We collected two replicates, which were well correlated (R = 0.86, rho = 0.86; Figure 2a).
FIGURE 2.
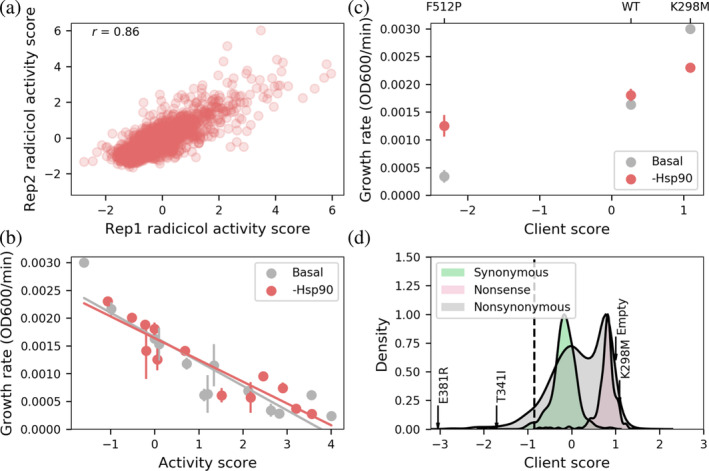
(a) Activity scores for 3929 of Src catalytic domain variants in two radicicol‐treated replicates. (b) Linear regression of activity scores and individually measured growth rates (n = 3) of 13 variants in either radicicol‐ or DMSO‐treated conditions. These linear models were used to convert radicicol activity scores to calibrated radicicol activity scores, which were then used to calculate a client score for each variant by subtracting the DMSO activity score from the calibrated radicicol activity score. (c) Individually measured growth rates of yeast expressing nonclient SrcK298M, weak client SrcWT, or functionally dependent client SrcF512P in either basal or Hsp90‐inhibited conditions (n = 3), along with each variant's client score. (d) Distribution of nonsynonymous (n = 3366, gray), synonymous (n = 430, green), and nonsense (N = 133, red) client scores of variants in the library. Dashed line indicates the client score used to define functionally dependent clients. Functionally dependent client variants E381R and T341I are indicated by arrows. The client score of kinase‐dead variant K298M and the apparent client score of empty vector are indicated by arrows over the nonsense distribution.
2.1. Determining the Hsp90 dependence of ~3500 Src missense variants
In order to quantify each variant's dependence on Hsp90 chaperoning, we compared the activity scores measured in the radicicol‐treated condition to previously measured DMSO activity scores generated using the same library and assay (Ahler et al., 2019). SrcWT, to which each set of scores was normalized, had different growth rates in the two conditions due to slight radicicol toxicity. Thus, the radicicol activity scores reflect growth rates affected by both radicicol toxicity and Src variant toxicity, making direct comparisons with DMSO activity scores, which only represent growth rates affected by Src variant toxicity, difficult. To enable direct comparison of variant activity scores in the two conditions, we calibrated how each set of activity scores related to growth rate by individually measuring the growth rates of yeast expressing 13 variants that spanned the range of the activity scores. Individually measured growth rates were well correlated with activity scores derived from the deep mutational scans in both conditions (Figure 2b; DMSO, R = 0.89, rho = 0.92; radicicol, R = 0.86, rho = 0.86). We used a linear model to transform radicicol activity scores to yeast growth rates and then used a second linear model to transform yeast growth rates to DMSO‐equivalent activity scores. We refer to the result of the transformed radicicol activity scores as “calibrated radicicol activity scores,” in which a variant with a calibrated radicicol activity score of 0 has the same growth rate as a variant with a DMSO activity score of 0. We then calculated a “client score” for each variant by taking the difference between the calibrated radicicol activity score and the measured DMSO activity score (see Section 4). Client scores ranged from −3.04 to 2.56, with negative values indicating a strong dependence on Hsp90 (Figure 2c,d). The inactive variant SrcK298M had a positive client score of 1.09. The weak client SrcWT had a client score of 0.27, indicating that weak clients in our library have client scores close to 0. To identify functionally dependent Hsp90 clients, we used synonymous variants to define the range of WT‐like client scores. We considered all variants whose client scores were below two standard deviations of the mean client score of synonymous variants functionally dependent clients (Figure 2d). Eighty‐four variants had client scores that met this definition of a functionally dependent client.
To validate our client scores, we tested three functionally dependent client variants individually and observed large increases in growth rates in radicicol relative to DMSO, as suggested by their large negative client scores (Figure S2a). We also examined previously known and suspected functionally dependent clients (Citri et al., 2006; Xu et al., 2005). SrcE381K increases Hsp90 interaction compared to SrcWT (Taipale et al., 2013). While SrcE381K was not present in our library, a variant with a similar positive charge at the same position, SrcE381R, was a functionally dependent client with a score of −3.04. We also examined SrcT341I, a “gatekeeper mutation” that confers tyrosine kinase inhibitor resistance in many different kinases (Azam et al., 2008). The oncogenic activity of kinases harboring gatekeeper mutations has been successfully repressed in mice using Hsp90 inhibitors, suggesting that kinases with the gatekeeper mutation are functionally dependent clients of Hsp90 (Peng, Brain, et al., 2007; Peng, Li, & Li, 2007). SrcT341I was also classified as a functionally dependent client with a score of −1.71. Thus, client scores accurately recapitulate the effects of Hsp90 on Src activity in yeast, and reveal Src variants that are strongly dependent on Hsp90.
We also observed 111 variants with positive client scores beyond two standard deviations of the synonymous distribution, suggesting that these variants might increase in activity following Hsp90 inhibition. Indeed, an increase in tyrosine kinase activity has been reported as a transient phenomenon following Hsp90 inhibition in T24 bladder carcinoma cells (Koga et al., 2006). However, 105 of the variants with large positive client scores were inactive (DMSO activity score <−0.47), so the reduction in yeast growth mediated by radicicol toxicity accounts for these variants' positive client scores. Similarly, yeast harboring an empty vector that does not express Src also had a positive client score (Figure 2d). Only six variants appeared to have appreciable activity in DMSO and increased activity following Hsp90 inhibition (Figure S2b). We individually measured the growth rate of three of these variants in DMSO and radicicol. None of them exhibited an appreciable decrease in growth rate upon radicicol treatment, as the client score suggested. One variant, SrcE335M, showed growth recovery with radicicol treatment, suggesting it was strongly dependent on Hsp90. However, this result was the consequence of experimental error, as the E335M client score had a standard error greater than 99.4% of the other variants. Thus, these few variants appear to be artifacts of radicicol‐mediated toxicity.
2.2. Functionally dependent client variants are spatially localized
In order to understand how variants impact Hsp90 dependence, we organized the client scores into a variant effect map comprising 73% of the total possible single amino acid variants in Src's CD (Figure 3a). The map revealed that 80% of the positions in the CD had no functionally dependent client variants. Of the 49 positions with a functionally dependent client variant, 35 positions had just one functionally dependent client variant while four positions, W285, E381, I444, and F512, had five or more functionally dependent client variants. Projection of the client score data onto the structure of the CD revealed dramatic localization of the positions harboring functionally dependent client variants. Two hotspots consisting of 14 positions in the αF pocket of the C‐lobe and β1–β2 strand hotspot of the N‐lobe account for 52.9% of functionally dependent client variants (Figure 3b). The functionally dependent client containing positions outside these two hotspots appear to form a continuous surface that connects the β1–β2 strand hotspot to the αF pocket, comprising the hinge between the N‐ and C‐lobes (342–347), the β7–β8 loop, and the αC‐β4 loop (Figure 3c).
FIGURE 3.

(a) Heatmap of client scores of 3499 Src variants. Cells are colored by client score. Gray indicates missing variants and dots indicate the WT amino acid. Asterisks indicate stop codons. (b) Structure of the Src CD colored by mean client score at each position and showing the number of functionally dependent clients at each position by sphere size (PDB ID: 2SRC). (c) Structure of Src with a continuous surface of client mutations between αF pocket and β1–β2 strand hotspot (PDB = 2SRC).
One hotspot, the αF pocket, contains eight positions that form a regulatory interface where the αE, αF, and αI helices meet (Figure 4a). Three of the four positions with five or more functionally dependent client variants, E381, I444, and F512, are located within the αF pocket. A lysine substitution at E381 has previously been shown to increase the Hsp90 dependence of Src (Taipale et al., 2013). The appearance of numerous functionally dependent client variants at αF pocket positions I444 and F512, which are adjacent to E381, suggest that the αF pocket plays an important role in Hsp90 dependence. Indeed, each of the other five positions comprising the αF pocket also harbored at least one functionally dependent client variant. T443 and T511 each had three functionally dependent client variants, while A378, P506, and E508 harbored one or two functionally dependent client variants. We compared the αF pocket positions to adjacent positions (within 7 angstroms), and found no appreciable difference in mutational coverage (Table S1). Positions adjacent to the αF pocket contained a significantly smaller proportion of functionally dependent client variants (5/413) compared to the αF pocket positions (31/133); two‐sided Fisher's exact test (p < 1e−4). Thus, variants within the αF pocket appear to specifically drive Hsp90 dependence.
FIGURE 4.

(a) Structural details of the αF pocket positions containing functionally dependent client variants (shown in green). (b) Structural details of the β1–β2 strand hotspot positions containing functionally dependent client variants (shown in blue). (c) Hierarchical clustering of αF pocket positions shows enrichment of hydrophobic functionally dependent client variants at positions E381 and F512 (outlined in yellow) and enrichment of positively charged functionally dependent client variants at positions E381, I444, T511, and F512 (outlined in blue). Dots indicate the WT amino acid. Asterisks indicate stop codons. (d) Hierarchical clustering of β1–β2 strand positions shows general enrichment of hydrophobic functionally dependent client variants. Dots indicate the WT amino acid. Asterisks indicate stop codons.
The other hotspot, in the β1 and β2 strands, contains six positions located on the solvent‐exposed face of the N‐lobe of Src's CD (Figure 4b). We previously showed that these six positions harbor many activating variants and that they play a role in regulating Src's activity (Ahler et al., 2019; Chakraborty et al., 2022) (Table S2). The β1–β2 hotspot contains one position with five functionally dependent client variants, two positions with three functionally dependent client variants, and three positions with 1–2 functionally dependent client variants. The appearance of numerous functionally dependent client variants at nearly all positions in the β1–β2 strand region suggests that this hotspot could also be involved in Hsp90 dependence. Indeed, as for the αF pocket, a comparison of the proportion of functionally dependent client variants within the β1–β2 strand positions (14/87) to adjacent positions (within 7 angstroms; 4/207) revealed that the β1–β2 strand positions are significantly enriched for functionally dependent client variants (two‐sided Fisher's exact test p < 1e−4) (Table S2). Thus, like the αF pocket, variants within the β1–β2 strand hotspot appear to specifically increase Hsp90 dependence.
Given the localization of functionally dependent client variants in two distinct hotspots, we asked if the hotspots had distinct patterns of amino acid substitutions. Positively charged and hydrophobic substitutions have previously been shown to drive Hsp90 interaction at position E381 (Citri et al., 2006). Thus, we asked whether these types of substitutions drove Hsp90 dependence at other αF pocket and β1–β2 strand positions. Indeed, positively charged substitutions at positions E381, I444, T511, and P506 conferred strong Hsp90 dependence (randomization test, p = 7e−4; Figure 4c). Positively charged substitutions at the remaining four αF pocket positions had WT‐like client scores, except at F512 where both K and R substitutions led to loss of function in DMSO. Similarly, hydrophobic substitutions at positions E381 and F512 conferred strong Hsp90 dependence (randomization test p < 1e−4) but at other αF pocket positions led to WT‐like client scores. Thus, the trends previously observed for E381 extend to only three other positions for positive charges and one other position for hydrophobic substitutions. This suggests that surface biochemical properties are not the only driver of Hsp90 dependence at the αF pocket.
Like the αF pocket, hydrophobic substitutions in the β1–β2 strand hotspot often produced Hsp90 dependence, accounting for 7 of the 14 functionally dependent client variants (randomization test p = 1.1e−4; Figure 4d). However, unlike positions E381 and F512 in the αF pocket where all observed hydrophobic substitutions created functionally dependent clients, no position in the β1–β2 strand hotspot had such strong enrichment for hydrophobic substitutions. The remaining functionally dependent client variants in the β1–β2 strand hotspot were polar or special amino acids (C, G, and P), and no negatively charged variants were functionally dependent clients.
Thus, at the αF pocket and β1–β2 strand hotspots, hydrophobic variants tended to give rise to Hsp90 dependence, but no other clear patterns in the nature of functionally dependent client substitutions were apparent. However, these two regions both play a role in facilitating autoinhibition and regulating Src activity. The αF pocket binds the SH4 domain to promote a closed and inactive conformation of Src (Ahler et al., 2019). We previously showed that Src becomes more extended and hyperactive upon abrogation of this regulatory interaction by mutagenesis. The β1–β2 strands flank the phosphate‐binding loop (P‐loop) of the CD and residues in the β1–β2 strand hotspot are components of an allosteric network that communicates intramolecular SH3 domain engagement with the conformational flexibility of Src's P‐loop and αC helix. Mutations in the β1–β2 strand hotspot also extend and activate Src (Boczek et al., 2015; Chakraborty et al., 2022; Luo et al., 2017). A previous biochemical study demonstrated that the introduction of mutations from v‐Src that disrupt regulatory domain interfaces and promote an extended global conformation into c‐Src also increase Hsp90 dependence (Boczek et al., 2015). Taken together, this evidence suggests that more extended, regulatory domain‐disengaged Src, created through variation within the αF pocket and the β1–β2 strands, is more functionally dependent on Hsp90.
In addition to the αF pocket and β1–β2 strand hotspots, Src contains other clusters of regulatory positions that influence its conformation, namely the SH2‐CD and SH3‐CD interfaces (Brown & Cooper, 1996; Cowan‐Jacob et al., 2005; Xu, Doshi, et al., 1999). Unlike the αF pocket and β1–β2 strand hotspot, the SH2 and SH3 interfaces were not functionally dependent client variant hotspots. The SH2 and SH3 interfaces each only had one functionally dependent client variant (1/49 and 1/78, respectively), compared to the 31 functionally dependent clients in the αF pocket (31/133) and the 14 functionally dependent clients (14/87) in the β1–β2 strand hotspot (Figure 5a; Table S3). The SH2 interface functionally dependent client variant, SrcL325T, is adjacent to the hinge and αE helix. The SH3 interface functionally dependent client variant, SrcW289K, is adjacent to the SH2‐CD linker. We, as well as others, previously showed that mutations at the SH2 and SH3 interfaces disrupt the intramolecular regulatory domain engagement of Src using both SH3 pull‐down assays and molecular dynamics simulations (Ahler et al., 2019; Xu et al., 1997; Young et al., 2001). For example, SrcT293D in the SH3‐CD interface leads to reduced intramolecular SH3 domain engagement in an SH3 pull‐down assay (Ahler et al., 2019). However, SrcT293D had a client score (0.26) similar to SrcWT (0.27). Thus, unlike the αF pocket and β1–β2 strand hotspot, the SH2‐CD and SH3‐CD interface variants were almost never strongly dependent on Hsp90, despite the ability of some to disrupt intramolecular regulatory domain engagement. Factors beyond the global conformation must therefore play a role in Hsp90 client dependence. These factors could include kinase domain stability, surface hydrophobicity, and phosphotransferase activity, all of which have been implicated in Hsp90 client specificity (Boczek et al., 2015; Citri et al., 2004; Luo et al., 2017; Taipale et al., 2012).
FIGURE 5.

(a) Distribution of client scores at different regulatory clusters. Solid line indicates the functionally dependent client threshold. (b) Distribution of DMSO activity scores at different client interfaces. Dashed line indicates increased activity threshold. (c) Correlation between client score and activity score; R = −0.91, rho = −0.93 (d) Linear regression of client scores and activity scores of variants in the αF pocket (green) and β1–β2 strand hotspot (blue) yield different slopes.
2.3. Src variant predicted stability and hydrophobicity do not dictate Hsp90 dependence
In vitro and molecular dynamics studies of weak client SrcWT and strong client v‐Src suggest that the stability of the kinase fold is important for Hsp90 client dependence (Boczek et al., 2015; Luo et al., 2017). Comprehensive characterization of the human kinome similarly found a modest correlation (R 2 = 0.23, Pearson's R = 0.48) between a measure of Hsp90 interaction and thermal stability of 56 kinases (Taipale et al., 2012). These studies suggest Hsp90 recognizes intrinsically unstable kinases as clients, reasoning that extended kinase conformations are less stable than more compact, closed conformations, thereby leading to increased dependence on Hsp90. However, these studies are limited in the number of kinases studied and our data provides a unique opportunity to identify stability trends in functionally dependent Hsp90 clients.
We calculated the free energy change brought about by variants (ΔΔG) in the extended conformation of Src (PDB ID: 1Y57) using a previously described Rosetta‐based method for predicting a protein's thermodynamic stability from its structure (Cagiada et al., 2021; Park et al., 2016). We validated the viability of these stability calculations using the gatekeeper mutation, SrcT341I. Structural analyses of the T341I gatekeeper mutation suggest it stabilizes a hydrophobic spine that links the gatekeeper mutation to the activation loop (Azam et al., 2008; Barouch‐Bentov & Sauer, 2011; Kornev et al., 2006). We calculated a ΔΔG of −0.4 for SrcT341I, indicating that the introduction of the gatekeeper mutation stabilizes the structure relative to SrcWT. We projected the average ΔΔG values of client positions onto the CD (Figure S3a), revealing other stabilizing client variants at the β3‐αC loop as well as on the surface of the αG, αH, and αI helices. However, Src variant ΔΔG had only a limited correlation with client score (Pearson's R = 0.22; Figure S3b). Because Hsp90 may only recognize specific local instabilities in the kinase domain, we also analyzed the relationship between ΔΔG and client score at each position with a functionally dependent client variant. Although we observed a correlation between ΔΔG and client score at a few positions, most positions had no such correlation, with many nonclient variants having similar ΔΔG to client variants (Figure S3c), suggesting that the major determinant of Hsp90 interaction resides in features not captured by the Rosetta energy function and our calculated ΔΔGs.
Another factor suggested to be a determinant of Hsp90 client dependence is surface hydrophobicity (Karagöz et al., 2014; Karagöz & Rüdiger, 2015; Wegele et al., 2004). The most notable example is the substitution D770G in ErbB‐1, which introduces a hydrophobic patch at the αC‐β4 loop, leading to increased Hsp90 interaction (Citri et al., 2006; Taipale et al., 2013). Fluorescence assays for binding exposed hydrophobic regions showed that v‐Src and other client Src variants had more exposed hydrophobic regions than c‐Src, suggesting surface hydrophobicity as a factor involved in Hsp90 dependence (Boczek et al., 2015). We also observed a tendency for hydrophobic variants to result in functionally dependent clients at the αF pocket and β1–β2 strands. We used Rosetta to calculate the hydrophobic solvent accessible surface area (hSASA) of the side chains of the variants in the extended conformation of Src (PDB ID: 1Y57). We found limited correlation between the ΔhSASA and client score (Pearson's R = −0.14) (Figure S4a). To tease out the effects of hydrophobicity at individual positions, we projected the average ΔhSASA onto the CD structure (Figure S4b), revealing E381 and F512 in the αF pocket as positions with the lowest ΔhSASA. The only region with localization of positive ΔhSASA values is on the αG and αH helices. However, many nonclients at these positions had similar ΔhSASA values (Figure S4c), suggesting that changes in surface exposed hydrophobicity are not a major determinant of Hsp90 dependence.
2.4. Src hyperactivity correlates with Hsp90 dependence
Variants in the SH2‐CD and SH3‐CD interfaces were much less activating than those in the αF pocket and β1–β2 strand hotspot (Figure 5b). The mean DMSO activity score of variants in the αF pocket and β1–β2 strand hotspots were 0.79 and 1.72 respectively. In comparison, the mean activity scores of the SH2 and SH3 interfaces were 0.11 and 0.35 respectively. Thus, the lack of functionally dependent Hsp90 client variants at the SH2‐CD and SH3‐CD interfaces could reflect an apparent dependence on active global conformations of Src.
To test this dependence more generally, we compared variant client scores to their corresponding DMSO activity scores and found a strong correlation (R = −0.91, rho = −0.93; Figure 5c). In fact, all 84 client variants we identified were also classified as increased activity variants based on their DMSO activity score (Ahler et al., 2019). Thus, Hsp90 appears to recognize, in an indirect fashion, increased phosphotransferase activity of Src variants. However, high activity does not always confer strong Hsp90 dependence, as some highly active variants had WT‐like client scores. Regressing client scores and activity scores for variants in either the αF pocket or β1–β2 strand hotspot revealed substantially different linear slopes and correlation coefficients (Figure 5d). While activity and client scores were strongly correlated for αF pocket variants, there was much more variance in client scores for β1–β2 strand variants of similar activity. The discrepancy between the two hotspots was most apparent between activity scores of 1.4 and 2.5, where moderately activating variants are found. Indeed, most moderately activating αF pocket variants (14/18) were functionally dependent clients while only a few moderately activating β1–β2 strand variants (2/17) were functionally dependent clients. Thus, while high phosphotransferase activity was necessary for strong Hsp90 dependence in our assay, not all activating variants were functionally dependent clients and the distribution of functionally dependent clients among moderately activating variants was highly dependent on the location within the CD.
Disengagement of Src's regulatory domain apparatus is generally necessary for higher Src activity, so Src's Hsp90 dependence appears to require disengagement of the regulatory domain apparatus to provide access to the CD. However, comparison of similarly activating variants in the αF pocket and β1–β2 strand hotspots highlight that regulatory domain disengagement alone is insufficient for Src to become a functionally dependent Hsp90 client. We observe a strong correlation between the activity and client scores of αF pocket variants (Pearson's R = −0.59), suggesting that activating variants in this region loosen the regulatory apparatus and promote the partially unfolded state required for recognition by the Hsp90/Cdc37 chaperone system. The weaker correlation between the activity and client scores for variants in the β1–β2 strand hotspot (Pearson's R = −0.39) suggests that while activating variants in this region of Src can promote regulatory domain disengagement, only a subset of variants promote partial unfolding of the CD.
2.5. Specific active conformations drive Hsp90 dependence
To gain insight into the relationship between Src conformation and Hsp90 dependence, we used a limited proteolysis assay with thermolysin to measure the kinase domain stability, conformational flexibility, and global extension of Src variants with similar activity scores but differing Hsp90 dependence (Agius et al., 2019; Chakraborty et al., 2022; Fang et al., 2020). We expressed individual Src variants in HEK293T cells and captured each through their ATP‐binding sites using dasatinib‐conjugated beads. We then exposed the Src‐bound beads to thermolysin, and measured the quantity of full‐length Src over time via densitometry.
To determine if we could differentiate between Src variants with extended or compact global conformations, we compared the thermolysin half‐lives of SrcW285T, an extended, flexible conformation control, and SrcE283D, a compact conformation control, to SrcWT (Figure S5a–c). We normalized the half‐lives such that SrcWT had a half‐life of 1. The extended global conformation control SrcW285T yielded a half‐life of 0.56 relative to SrcWT, meaning that it was proteolyzed more quickly and therefore in a more extended, flexible conformation. The compact control SrcE283D yielded a relative half‐life of 1.37, meaning that it was proteolyzed less quickly and therefore in a more compact conformation. Thus, our assay could resolve differences in the conformational flexibility and global extension of Src variants bound to dasatinib beads (Figure S6).
In general, globally extended Src is considered to be active while compact Src is inactive, but we found only a modest correlation between activity and thermolysin half‐life (Pearson's R = −0.46; Figure 6a). We found a slightly stronger correlation between thermolysin half‐life and client score (Pearson's R = 0.68; Figure 6b) than activity score. Taken together, these data suggest that activating, weak client variants have less flexible and more compact global conformations than similarly active functionally dependent client variants.
FIGURE 6.

(a) Activity scores are negatively correlated with thermolysin half‐lives, while (b) client scores are positively correlated with thermolysin half‐lives.
3. DISCUSSION
We used deep mutational scanning to investigate the effects of Hsp90 chaperoning on Src activity among 3929 variants in the CD. Overall, few variants' activity depended strongly on Hsp90. We revealed 84 previously unknown functionally dependent client variants of Src, which spatially clustered in the αF pocket and the β1–β2 strands. Fifty‐two percent of the new functionally dependent client variants we identified were located in these hotspots, with the remaining functionally dependent client variants forming a surface through the CD hinge, β7–β8 loop, and the αC‐β4 loop. These findings corroborate previous studies identifying position E381 as a location where variants with strong Hsp90 dependence can appear (Taipale et al., 2013). However, the appearance of functionally dependent client variants in the β1–β2 strands was not previously recognized (Boczek et al., 2015).
Within each hotspot, we observed trends in the types of variants that transform Src into a functionally dependent client. For example, select positions in both the αF pocket and the β1–β2 strands transform Src into a functionally dependent client when mutated to hydrophobic residues. A smaller subset of αF pocket positions transform Src into a functionally dependent client when mutated to positively charged residues. Because the trends are limited to subsets of positions within each hotspot, they imply that Hsp90 does not directly interact with these regions, but rather these variants create conformational flexibility or expose structural motifs recognized by Hsp90.
Variant‐induced instability and hydrophobicity have long been proposed as drivers of Hsp90 dependence (Boczek et al., 2015; Luo et al., 2017; Taipale et al., 2012; Taipale et al., 2013). We used Rosetta to calculate the changes in stability and hydrophobicity caused by Src variants, and found little correlation between Hsp90 dependence and predicted stability or hydrophobicity. While nearly all functionally dependent clients we identified were predicted to be unstable, many variants with similarly low predicted stability were classified as weak clients or nonclients. Moreover, some functionally dependent clients increased local hydrophobicity while others decreased hydrophobicity. Our assay only detects functionally dependent Src variants, we would miss loss‐of‐function variants with increased hydrophobicity or instability that are dependent on Hsp90. Additionally, Rosetta calculates changes in hydrophobicity and stability using static structures of Src, and may not accurately predict structural dynamics that increase hydrophobicity or induce local destabilization. Thus, the lack of correlation between client score and predicted hydrophobicity and stability may inaccurately reflect the role of these factors in determining Hsp90 binding.
Previously, Hsp90 dependence has been suggested to correlate with unfolding cooperativity, hydrophobicity, and structural elements in the kinase domain (Boczek et al., 2015; Luo et al., 2017). Functionally dependent clients with variants disrupting C‐terminal tail binding and the SH3‐CD interface increase Src unfolding and the dynamics or solvent exposure of the αC‐β4 loop and β1–β3 strands (Boczek et al., 2015). Here, we extend this picture to show that variants in the αF pocket and the β1–β2 strands also increase conformational flexibility and disengagement of the regulatory domain apparatus, becoming dependent on Hsp90.
High Src activity requires disengagement of the regulatory apparatus and adoption of an extended conformation. We found a strong correlation between high Src phosphotransferase activity and Hsp90 dependence, suggesting that adoption of an extended global conformation is required to drive Hsp90 dependence. However, variants at the SH2‐CD and SH3‐CD interfaces that promoted phosphotransferase activity and extend Src global conformation were not classified as functionally dependent clients by our assay (Ahler et al., 2019). Moreover, similarly active variants in the β1–β2 strands and αF pocket differed in their tendency to confer strong Hsp90 dependence. Thus, regulatory domain disengagement alone cannot explain Src Hsp90 dependence.
Instead, we found that regulatory domain disengagement was necessary, but not sufficient, to confer strong Hsp90 dependence. Variants that increased conformational flexibility in our thermolysin assay generally had higher activity and yielded stronger Hsp90 dependence. The differences in how similarly activating variants extend Src's global conformation suggest that active Src variants occupy different conformations. In particular, we hypothesize that, in addition to regulatory domain disengagement, partial unfolding of the CD is necessary to confer strong Hsp90 dependence. A cryo‐electron microscopy‐derived structure of the kinase Cdk4 in complex with Hsp90 and the kinase‐specific co‐chaperone Cdc37 showed the kinase domain in an extended conformation with split N‐ and C‐lobes threaded through the Hsp90 lumen (Verba et al., 2016). Notably, Cdc37 forms hydrogen‐bonding interactions with the backbone of Cdk4's αE helix in the C‐terminal lobe. Given the proximity of the αF pocket to Cdc37's site of interaction with the αE helix, we speculate that activating mutations in the αF pocket also promote a more accessible αE helix in Src. Additionally, the Cdk4‐Cdc37‐Hsp90 structure shows that Cdc37 stabilizes the separation of the N‐ and C‐lobes of Cdk4 by mimicking interactions the N‐lobe makes with the C‐lobe. Both the αF pocket and the β1–β2 strands are adjacent to the unfolded region of Cdk4 in the structure. Thus, we hypothesize that the conformational flexibility induced by variants at the αF pocket and the β1–β2 strands potentiate binding and stabilization by Cdc37, and ultimate loading onto the Hsp90 dimer (Figures S7 and S8). Further study of the conformation and dynamics of the variants we identified with similar activity but different Hsp90 dependence in different CD regions could provide insight to the initial steps of kinase loading into the chaperone complex. Such studies could also facilitate development of therapeutics that stabilize Hsp90 dependent kinase conformations, and these therapeutics could be used in combination with Hsp90 inhibitors.
While we were able to add to the picture of Hsp90 dependence of Src kinase, our study is limited in several ways. Our assay only identifies functionally dependent client variants that lose activity when Hsp90 is inhibited. However, other strong client variants that interact with Hsp90 in their mature forms, but do not lose activity following Hsp90 inhibition, could exist and would be missed by our assay. Activating, weak client variants at the SH3‐CD and SH2‐CD interfaces could be such variants. Additionally, radicicol treatment could induce the heat shock response and could give rise to off‐target effects that affect measured growth rate. Moreover, our study pairs human Src with yeast Hsp90. While yeast and human Hsp90 are conserved in sequence, structure, and function, differences may exist (Chang & Lindquist, 1994). Nonetheless, we recapitulate all of the known Src functionally dependent clients studied in the context of human Hsp90 of which we are aware (Peng, Brain, et al., 2007; Peng, Li, & Li, 2007; Taipale et al., 2013). Another limitation is that we were unable to determine the relative importance of activation and extension in determining Hsp90 functional dependence. Future work measuring the dynamics and SH2‐ and SH3‐domain availability of full‐length and truncated forms of the strong client Src variants we identified will be necessary to deconvolve the effects of each contributing factor on client status. Finally, our analysis of the relationship between client score and stability relies on predicted, rather than measured, stability.
Taken together, our data suggest that activation and extension, primarily induced by positively charged and hydrophobic variants at the αF‐pocket or hydrophobic variants at the β1–β2 strands, are additive determinants of Hsp90 dependence. We found that increased Src phosphotransferase activity was strongly correlated with increased Hsp90 dependence, but that high activity alone was insufficient to drive Hsp90 dependence. We showed, for a limited number of variants at the αF‐pocket and β1–β2 strands, that conformational extension also correlated with increased Hsp90 dependence. We speculate that variants at the αF pocket and the β1–β2 strand hotspot perturb different regulatory elements in the CD, driving spontaneous access to different conformations. In turn, Cdc37 may preferentially recruit some Src conformations over others to the Hsp90 complex. Due to the high conservation of the CD between diverse kinases, it is possible that similar factors driving Src‐Hsp90 client preferences apply to other kinases. Thus, extension of our approach to other Hsp90 clients, including other kinases and neurodegenerative disease‐related proteins, could reveal a broader array of client dependence and processing mechanisms. Likewise, Hsp90 client variant libraries could be assessed in a human cell context, which would enable modulation of the full slate of Hsp90 co‐chaperones by chemical or genetic means. Thus, deep mutational scanning represents a useful tool for investigating the mechanisms by which Hsp90 recognizes and processes clients.
4. METHODS
4.1. S. cerevisiae genetics
Yeast experiments were performed in BY4741 Green Monster (MATa his3Δ1 leu2Δ0 met15Δ0 ura3Δ0 pdr5Δ pdr10Δ pdr11Δ pdr12Δ pdr15Δ snq2Δ ynr070wΔ aus1Δ yol075cΔ adp1Δ ycf1Δ vmr1Δ nft1Δ bpt1Δ ybt1Δ yor1Δ) (Suzuki et al., 2011; a gift from Dr. Fritz Roth). All Src constructs were cloned into the p415 GAL1 plasmid and transformed via lithium acetate transformation. Transformants were plated onto C‐Leu selective media and incubated at 30°C for 72 h. Single colonies were used to inoculate C‐Leu liquid medium and incubated at 30°C in a rotating mixer at 20 rpm for 72 h.
4.2. Cloning
All variants were generated using IVA cloning following standard protocols (García‐Nafría et al., 2016). Sequences of the full open reading frame were verified by Azenta Life Sciences Sanger sequencing with custom primers.
4.3. Individual yeast growth assays
Codon‐optimized, full‐length single variants of Src were transformed into the BY4741 Green Monster strain (a gift from Dr. Fritz Roth) using standard lithium acetate transformation protocol and plated on C‐Leu plates (Suzuki et al., 2011). Three individual colonies of each transformation were used to inoculate 5 mL 2% glucose C‐Leu cultures which were grown at 30°C to saturation. Cultures were back diluted to an OD600 of 0.5 and allowed to double once in 3% raffinose C‐Leu media. Cultures were back diluted to an OD600 of 0.01 in 2% galactose C‐Leu media to induce expression and plated and grown in a BioTek Synergy H1 plate reader using constant orbital shaking at 30°C. The OD600 was measured every 30 min during a 48 h growth period. Growth rates of each culture were calculated using the GrowthRates software (Hall et al., 2014).
4.4. Src CD DMS
To identify Hsp90 client variants, we cultured BY4741 Green Monster cells expressing our previously described c‐Src variant library in 2% galactose C‐Leu media supplemented by 800 nM radicicol in duplicate (GI50 = 5.32 μM) (Ahler et al., 2019). Three timepoints were sampled from each culture during 48 h of growth at approximately 19, 25, and 32 h. Selection 1 timepoints had OD600's of 0.186 and 0.202. Selection 2 timepoints had OD600's of 0.682 and 0.63. Selection 3 timepoints had OD600's of 2.95 and 2.4. Timepoints were spun down at 3000 × g and plasmids were extracted using Yeast Plasmid Prep I (Zymogen) according to the manufacturer's protocol. Barcodes were amplified and Illumina cluster generators and indices were added via PCR using 2X KAPA Robust HotStart ReadyMix (KAPA Biosystems). PCR products were cleaned and sequenced on the NextSeq 500/550 High Output v2 kit.
4.5. Library sequencing and variant scoring
Illumina reads for each timepoint and replicate were processed using bcl2fastq. All timepoints and replicates were imported into Enrich2 and converted to activity scores using the weighted least squares scoring method (Rubin et al., 2017). Missing variants in this work were also missing in Ahler et al., 2019, where we generated the library used in this work. These missing variants could result from nonuniform PCR amplification, inadequate barcode coverage, and extreme growth attenuation due to variant activity and subsequent filtering of low‐frequency barcodes. Because increased Src activity decreases yeast growth and subsequently the number of barcodes associated with each variant, activity scores were multiplied by −1 before further analysis. The radicicol activity scores were transformed using two linear regression models from measurements of 13 variants spanning the range of DMSO and radicicol activity scores. DMSO activity scores from previous work were used for normalization (Ahler et al., 2019).
The first model predicts the growth rate of given variant from the variant's radicicol score . The second model predicts the DMSO activity score of given variant from the variant's growth rate . and are the fitted parameters for each linear regression.
The result of this transformation is a calibrated radicicol activity score for each variant .
The difference between the calibrated radicicol activity score and the DMSO activity score for a given variant is the client score .
The client score of empty vector was calculated by first measuring the growth rate of empty vector expressing cells in DMSO () and radicicol (). Next, the respective activity scores and of each was calculated from the measured growth rates.
Finally, the client score was calculated by taking the difference between the predicted activity score of empty vector in DMSO and radicicol.
4.6. Rosetta stability and hydrophobicity calculations
The local stability values were obtained using the Cartesian ddG method first described by Park (2016). The hSASA values were obtained by building models of each variant present in our study and calculating the hydrophobic SASA of the mutated residue.
4.7. Dasatinib bead conjugation
Carbodiimide hydrochloride and mixed overnight at room temperature to couple the dasatinib to sepharose. The following day, the supernatant was removed and the beads were washed three times with 1:1 dimethylformamide and ethanol. The beads were then incubated in a mixture of 57% 1:1 dimethylformamide and ethanol, 30% ethanolamine, and 13% 1 M carbodiimide hydrochloride. The next day, the supernatant was removed and the beads were washed three times with 1:1 dimethylformamide and ethanol, twice with 0.5 M sodium chloride, once with 20% ethanol, and stored in 20% ethanol until use.
4.8. Mammalian cell culture
HEK293T cells were used for Src variant expression in thermolysin experiments. Cells were grown at 37°C and 5% CO2 in DMEM (Thermo Fisher Scientific) supplemented with 10% fetal bovine serum and 1% penicillin–streptomycin. Cells were passaged regularly when they reached 80%–90% confluency. The Src variants were transiently transfected into 500,000 HEK293T cells using FuGENE6 (Promega) and 1200 ng plasmid DNA at a 3:1 ratio of transfection reagent:DNA in single wells in six‐well plates according to the manufacturer's protocol. Transfected cells were lifted off plates with 0.25% Trypsin–EDTA (Thermo Fisher Scientific) and pelleted at 300 × g for 10 min for downstream sample analysis.
4.9. Thermolysin assay measuring Src global conformation
Variants were transfected in HEK293T cells in single wells in 6‐well plates. Forty‐eight hours after transfection, the transfected cells were lifted from the plate and pelleted at 300 × g for 10 min. Cell pellets were lysed using 200 μL of chilled modRIPA buffer (50 mM Tris, 150 mM NaCl, 5% glycerol (v/v), 1% NP‐40, 0.25% sodium deoxycholate (w/v), 10 mM NaF, 1 mM PMSF, 1X protease inhibitor cocktail (Sigma Aldrich), 1X phosphatase inhibitor cocktail 2 (Sigma Aldrich), and 1X phosphatase inhibitor cocktail 3 (Sigma Aldrich), pH 8.0) for 10 min on ice, with occasional mixing. Cell lysates were spun at 20,000 × g for 10 min at 4°C and the supernatant was separated from the insoluble lysate. Ten microliters of 50% dasatinib‐conjugated bead/20% EtOH slurry was prepared for each replicate by washing three times with 10 bead volumes of 1X modRIPA buffer. Soluble lysate was incubated with washed dasatinib‐conjugated beads for 1 h at room temperature, gently mixing end over end. Following incubation, the beads were washed with 10 bead volumes of thermolysin digestion buffer (50 mM Tris, 500 mM CaCl2, pH 8.0) three times, and resuspended in a final volume of 100 μL digestion buffer. 500 nM thermolysin (Promega) was added to the resuspended and washed beads in a 1:100 dilution and incubated at 37°C for up to 75 min. Timepoints were taken by quenching the bead‐thermolysin mixture to 4X Laemmli 0.5 mM EDTA.
4.10. Western blot and densitometric analysis
Samples in 1X Laemmli (BioRad) were boiled at 95°C for 10 min and run in 4%–20% polyacrylamide gels (BioRad) in Tris‐Glycine‐SDS (BioRad) buffer for 40 min at 200 V. Gels were transferred using the TurboBlot transfer system (BioRad) on the “Mixed MW Midi” program onto nitrocellulose (BioRad). Blot washes include three 5‐min incubations with TBST (25 mM Tris, 150 mM NaCl, 0.1% Tween‐20) on an orbital shaker. Following transfer, blots were washed, blocked with TBST and 5% nonfat dry milk for 1 h at room temperature, washed, and incubated with primary antibody overnight at 4°C (Cell Signaling Technologies, 36D10). Blots were then washed again and incubated with secondary antibodies (LiCOR) and imaged via ChemiDoc (BioRad). All western blot quantification was performed using ImageLab software.
4.11. Half‐life estimation and normalization
Densitometric measurements of each sample were normalized to the first timepoint by taking the ratio of each timepoint to the first timepoint. The normalized values were then fit to an exponential decay function using the curve‐fitting function in scipy 1.4.1 package. To calculate relative half‐lives that are reported in the results section, the half‐lives of Src variants were then normalized to SrcWT by taking the ratio of the variant half‐life to the wild‐type half‐life.
4.12. Code and data availability
Sequencing reads were deposited in NCBI's Gene Expression Omnibus (GEO) and are accessible through accession number GSE218190. Data for the DMS and code to reproduce figures are located in our Github repository at https://github.com/FowlerLab/2022_SrcHsp90.
AUTHOR CONTRIBUTIONS
Vanessa Nguyen: Conceptualization (equal); data curation (lead); formal analysis (lead); investigation (lead); methodology (equal); project administration (lead); software (lead); validation (lead); visualization (lead); writing – original draft (lead); writing – review and editing (lead). Ethan Ahler: Conceptualization (equal); data curation (equal). Katherine A. Sitko: Data curation (supporting). Jason J. Stephany: Data curation (supporting). Dustin J. Maly: Conceptualization (supporting); supervision (supporting); writing – review and editing (supporting). Douglas M. Fowler: Conceptualization (equal); funding acquisition (lead); project administration (supporting); resources (lead); supervision (equal); writing – review and editing (equal).
Supporting information
Data S1: Supporting Information.
ACKNOWLEDGMENTS
We would like to thank Rachel Klevit for guidance. We thank Jessica Simon and Zachary Potter for thermolysin assay assistance and helpful discussions regarding Src. This work was supported by the National Institutes of Health National Institute for General Medical Sciences (R01GM109110 [Douglas M. Fowler] and R01GM086858 [Dustin J. Maly]). The research was supported by the PRISM (Protein Interactions and Stability in Medicine and Genomics) center funded by the Novo Nordisk Foundation (NNF18OC0033950).
Nguyen V, Ahler E, Sitko KA, Stephany JJ, Maly DJ, Fowler DM. Molecular determinants of Hsp90 dependence of Src kinase revealed by deep mutational scanning. Protein Science. 2023;32(7):e4656. 10.1002/pro.4656
Review Editor: Carol Beth Post
Contributor Information
Dustin J. Maly, Email: djmaly@uw.edu.
Douglas M. Fowler, Email: dfowler@uw.edu.
REFERENCES
- Agius MP, Ko KS, Johnson TK, Kwarcinski FE, Phadke S, Lachacz EJ, et al. Selective proteolysis to study the global conformation and regulatory mechanisms of c‐Src kinase. ACS Chem Biol. 2019;14:1556–63. [DOI] [PMC free article] [PubMed] [Google Scholar]
- Ahler E, Register AC, Chakraborty S, Fang L, Dieter EM, Sitko KA, et al. A combined approach reveals a regulatory mechanism coupling Src's kinase activity, localization, and phosphotransferase‐independent functions. Mol Cell. 2019;74:393–408. [DOI] [PMC free article] [PubMed] [Google Scholar]
- Anderson SK, Gibbs CP, Tanaka A, Kung HJ, Fujita DJ. Human cellular src gene: nucleotide sequence and derived amino acid sequence of the region coding for the carboxy‐terminal two‐thirds of pp60c‐src. Mol Cell Biol. 1985;5:1122–9. [DOI] [PMC free article] [PubMed] [Google Scholar]
- Azam M, Seeliger MA, Gray NS, Kuriyan J, Daley GQ. Activation of tyrosine kinases by mutation of the gatekeeper threonine. Nat Struct Mol Biol. 2008;15:1109–18. [DOI] [PMC free article] [PubMed] [Google Scholar]
- Barouch‐Bentov R, Sauer K. Mechanisms of drug resistance in kinases. Expert Opin Investig Drugs. 2011;20:153–208. [DOI] [PMC free article] [PubMed] [Google Scholar]
- Biebl MM, Buchner J. Structure, function, and regulation of the Hsp90 machinery. Cold Spring Harb Perspect Biol. 2019;11: a034017. [DOI] [PMC free article] [PubMed] [Google Scholar]
- Bjorge JD, Jakymiw A, Fujita DJ. Selected glimpses into the activation and function of Src kinase. Oncogene. 2000;19:5620–35. [DOI] [PubMed] [Google Scholar]
- Boczek EE, Reefschläger LG, Dehling M, Struller TJ, Häusler E, Seidl A, et al. Conformational processing of oncogenic v‐Src kinase by the molecular chaperone Hsp90. Proc Natl Acad Sci U S A. 2015;112:E3189–98. [DOI] [PMC free article] [PubMed] [Google Scholar]
- Bohush A, Bieganowski P, Filipek A. Hsp90 and its co‐chaperones in neurodegenerative diseases. Int J Mol Sci. 2019;20:4976. [DOI] [PMC free article] [PubMed] [Google Scholar]
- Brown MT, Cooper JA. Regulation, substrates and functions of src. Biochim Biophys Acta. 1996;1287:121–49. [DOI] [PubMed] [Google Scholar]
- Brugge JS, Jarosik G, Andersen J, Queral‐Lustig A, Fedor‐Chaiken M, Broach JR. Expression of Rous sarcoma virus transforming protein pp60v‐src in Saccharomyces cerevisiae cells. Mol Cell Biol. 1987;7:2180–7. [DOI] [PMC free article] [PubMed] [Google Scholar]
- Cagiada M, Johansson KE, Valanciute A, Nielsen SV, Hartmann‐Petersen R, Yang JJ, et al. Understanding the origins of loss of protein function by analyzing the effects of thousands of variants on activity and abundance. Cold Spring Harbor Laboratory, 2020.09.28.317040 2021. 10.1101/2020.09.28.317040 [DOI] [PMC free article] [PubMed]
- Chakraborty S, Ahler E, Simon JJ, Fang L, Potter ZE, Sitko KA, et al. Profiling of the drug resistance of thousands of Src tyrosine kinase mutants uncovers a regulatory network that couples autoinhibition to the dynamics of the catalytic domain. bioRxiv 2021.12.05.471322 2022. 10.1101/2021.12.05.471322 [DOI]
- Chang HC, Lindquist S. Conservation of Hsp90 macromolecular complexes in Saccharomyces cerevisiae . J Biol Chem. 1994;269:24983–8. [PubMed] [Google Scholar]
- Chen B, Zhong D, Monteiro A. Comparative genomics and evolution of the HSP90 family of genes across all kingdoms of organisms. BMC Genomics. 2006;7:156. [DOI] [PMC free article] [PubMed] [Google Scholar]
- Citri A, Harari D, Shohat G, Ramakrishnan P, Gan J, Lavi S, et al. Hsp90 recognizes a common surface on client kinases. J Biol Chem. 2006;281:14361–9. [DOI] [PubMed] [Google Scholar]
- Citri A, Kochupurakkal BS, Yarden Y. The Achilles heel of ErbB‐2/HER2: regulation by the Hsp90 chaperone machine and potential for pharmacological intervention. Cell Cycle. 2004;3:51–60. [PubMed] [Google Scholar]
- Cowan‐Jacob SW, Fendrich G, Manley PW, Jahnke W, Fabbro D, Liebetanz J, et al. The crystal structure of a c‐Src complex in an active conformation suggests possible steps in c‐Src activation. Structure. 2005;13:861–71. [DOI] [PubMed] [Google Scholar]
- Dehm SM, Bonham K. SRC gene expression in human cancer: the role of transcriptional activation. Biochem Cell Biol. 2004;82:263–74. [DOI] [PubMed] [Google Scholar]
- Fang L, Vilas‐Boas J, Chakraborty S, Potter ZE, Register AC, Seeliger MA, et al. How ATP‐competitive inhibitors allosterically modulate tyrosine kinases that contain a Src‐like regulatory architecture. ACS Chem Biol. 2020;15:2005–16. [DOI] [PMC free article] [PubMed] [Google Scholar]
- Fowler DM, Fields S. Deep mutational scanning: a new style of protein science. Nat Methods. 2014;11:801–7. [DOI] [PMC free article] [PubMed] [Google Scholar]
- García‐Nafría J, Watson JF, Greger IH. IVA cloning: a single‐tube universal cloning system exploiting bacterial In vivo assembly. Sci Rep. 2016;6:27459. [DOI] [PMC free article] [PubMed] [Google Scholar]
- Hall BG, Acar H, Nandipati A, Barlow M. Growth rates made easy. Mol Biol Evol. 2014;31:232–8. [DOI] [PubMed] [Google Scholar]
- Jaeger AM, Whitesell L. HSP90: enabler of cancer adaptation. Annu Rev Cancer Biol. 2019;3:275–97. [Google Scholar]
- Karagöz GE, Duarte AMS, Akoury E, Ippel H, Biernat J, Morán Luengo T, et al. Hsp90‐Tau complex reveals molecular basis for specificity in chaperone action. Cell. 2014;156:963–74. [DOI] [PMC free article] [PubMed] [Google Scholar]
- Karagöz GE, Rüdiger SGD. Hsp90 interaction with clients. Trends Biochem Sci. 2015;40:117–25. [DOI] [PubMed] [Google Scholar]
- Koga F, Xu W, Karpova TS, McNally JG, Baron R, Neckers L. Hsp90 inhibition transiently activates Src kinase and promotes Src‐dependent Akt and Erk activation. Proc Natl Acad Sci U S A. 2006;103:11318–22. [DOI] [PMC free article] [PubMed] [Google Scholar]
- Kornev AP, Haste NM, Taylor SS, Eyck LFT. Surface comparison of active and inactive protein kinases identifies a conserved activation mechanism. Proc Natl Acad Sci U S A. 2006;103:17783–8. [DOI] [PMC free article] [PubMed] [Google Scholar]
- Kritzer JA, Freyzon Y, Lindquist S. Yeast can accommodate phosphotyrosine: v‐Src toxicity in yeast arises from a single disrupted pathway. FEMS Yeast Res. 2018;18:foy027. [DOI] [PMC free article] [PubMed] [Google Scholar]
- Liu W, Yue F, Zheng M, Merlot A, Bae DH, Huang M, et al. The proto‐oncogene c‐Src and its downstream signaling pathways are inhibited by the metastasis suppressor, NDRG1. Oncotarget. 2015;6:8851–74. [DOI] [PMC free article] [PubMed] [Google Scholar]
- Luo Q, Boczek EE, Wang Q, Buchner J, Kaila VRI. Hsp90 dependence of a kinase is determined by its conformational landscape. Sci Rep. 2017;7:43996. [DOI] [PMC free article] [PubMed] [Google Scholar]
- Mandal AK, Lee P, Chen JA, Nillegoda N, Heller A, DiStasio S, et al. Cdc37 has distinct roles in protein kinase quality control that protect nascent chains from degradation and promote posttranslational maturation. J Cell Biol. 2007;176:319–28. [DOI] [PMC free article] [PubMed] [Google Scholar]
- Manning G, Whyte DB, Martinez R, Hunter T, Sudarsanam S. The protein kinase complement of the human genome. Science. 2002;298:1912–34. [DOI] [PubMed] [Google Scholar]
- Nada S, Okada M, MacAuley A, Cooper JA, Nakagawa H. Cloning of a complementary DNA for a protein‐tyrosine kinase that specifically phosphorylates a negative regulatory site of p60c‐src. Nature. 1991;351:69–72. [DOI] [PubMed] [Google Scholar]
- Park H, Bradley P, Greisen P Jr, Liu Y, Mulligan VK, Kim DE, et al. Simultaneous optimization of biomolecular energy functions on features from small molecules and macromolecules. J Chem Theory Comput. 2016;12:6201–12. [DOI] [PMC free article] [PubMed] [Google Scholar]
- Parsons SJ, Parsons JT. Src family kinases, key regulators of signal transduction. Oncogene. 2004;23:7906–9. [DOI] [PubMed] [Google Scholar]
- Peng C, Brain J, Hu Y, Goodrich A, Kong L, Grayzel D, et al. Inhibition of heat shock protein 90 prolongs survival of mice with BCR‐ABL‐T315I‐induced leukemia and suppresses leukemic stem cells. Blood. 2007;110:678–85. [DOI] [PMC free article] [PubMed] [Google Scholar]
- Peng C, Li D, Li S. Heat shock protein 90: a potential therapeutic target in leukemic progenitor and stem cells harboring mutant BCR‐ABL resistant to kinase inhibitors. Cell Cycle. 2007;6:2227–31. [DOI] [PubMed] [Google Scholar]
- Penn WD, McKee AG, Kuntz CP, Woods H, Nash V, Gruenhagen TC, et al. Probing biophysical sequence constraints within the transmembrane domains of rhodopsin by deep mutational scanning. Sci Adv. 2020;6:eaay7505. [DOI] [PMC free article] [PubMed] [Google Scholar]
- Phillips AM, Doud MB, Gonzalez LO, Butty VL, Lin YS, Bloom JD, et al. Enhanced ER proteostasis and temperature differentially impact the mutational tolerance of influenza hemagglutinin. Elife. 2018;7:e38795. [DOI] [PMC free article] [PubMed] [Google Scholar]
- Rubin AF, Gelman H, Lucas N, Bajjalieh SM, Papenfuss AT, Speed TP, et al. A statistical framework for analyzing deep mutational scanning data. Genome Biol. 2017;18:150. [DOI] [PMC free article] [PubMed] [Google Scholar]
- Schlessinger J. SH2/SH3 signaling proteins. Curr Opin Genet Dev. 1994;4:25–30. [DOI] [PubMed] [Google Scholar]
- Suzuki Y, Onge RPS, Mani R, King OD, Heilbut A, Labunskyy VM, et al. Knocking out multigene redundancies via cycles of sexual assortment and fluorescence selection. Nat Methods. 2011;8:159–64. [DOI] [PMC free article] [PubMed] [Google Scholar]
- Taipale M, Krykbaeva I, Koeva M, Kayatekin C, Westover KD, Karras GI, et al. Quantitative analysis of HSP90‐client interactions reveals principles of substrate recognition. Cell. 2012;150:987–1001. [DOI] [PMC free article] [PubMed] [Google Scholar]
- Taipale M, Krykbaeva I, Whitesell L, Santagata S, Zhang J, Liu Q, et al. Chaperones as thermodynamic sensors of drug‐target interactions reveal kinase inhibitor specificities in living cells. Nat Biotechnol. 2013;31:630–7. [DOI] [PMC free article] [PubMed] [Google Scholar]
- Thompson S, Zhang Y, Ingle C, Reynolds KA, Kortemme T. Altered expression of a quality control protease in E. coli reshapes the in vivo mutational landscape of a model enzyme. Elife. 2020;9:e53476. [DOI] [PMC free article] [PubMed] [Google Scholar]
- Verba KA, Wang RYR, Arakawa A, Liu Y, Shirouzu M, Yokoyama S, et al. Atomic structure of Hsp90‐Cdc37‐Cdk4 reveals that Hsp90 traps and stabilizes an unfolded kinase. Science. 2016;352:1542–7. [DOI] [PMC free article] [PubMed] [Google Scholar]
- Wegele H, Müller L, Buchner J. Hsp70 and Hsp90—a relay team for protein folding. Rev Physiol Biochem Pharmacol. 2004;151:1–44. [DOI] [PubMed] [Google Scholar]
- Wheeler DL, Iida M, Dunn EF. The role of Src in solid tumors. Oncologist. 2009;14:667–78. [DOI] [PMC free article] [PubMed] [Google Scholar]
- Williams JC, Weijland A, Gonfloni S, Thompson A, Courtneidge SA, Superti‐Furga G, et al. The 2.35 A crystal structure of the inactivated form of chicken Src: a dynamic molecule with multiple regulatory interactions. J Mol Biol. 1997;274:757–75. [DOI] [PubMed] [Google Scholar]
- Xu W, Doshi A, Lei M, Eck MJ, Harrison SC. Crystal structures of c‐Src reveal features of its autoinhibitory mechanism. Mol Cell. 1999;3:629–38. [DOI] [PubMed] [Google Scholar]
- Xu W, Harrison SC, Eck MJ. Three‐dimensional structure of the tyrosine kinase c‐Src. Nature. 1997;385:595–602. [DOI] [PubMed] [Google Scholar]
- Xu W, Yuan X, Xiang Z, Mimnaugh E, Marcu M, Neckers L. Surface charge and hydrophobicity determine ErbB2 binding to the Hsp90 chaperone complex. Nat Struct Mol Biol. 2005;12:120–6. [DOI] [PubMed] [Google Scholar]
- Xu Y, Lindquist S. Heat‐shock protein hsp90 governs the activity of pp60v‐src kinase. Proc Natl Acad Sci U S A. 1993;90:7074–8. [DOI] [PMC free article] [PubMed] [Google Scholar]
- Xu Y, Singer MA, Lindquist S. Maturation of the tyrosine kinase c‐src as a kinase and as a substrate depends on the molecular chaperone Hsp90. Proc Natl Acad Sci U S A. 1999;96:109–14. [DOI] [PMC free article] [PubMed] [Google Scholar]
- Young MA, Gonfloni S, Superti‐Furga G, Roux B, Kuriyan J. Dynamic coupling between the SH2 and SH3 domains of c‐Src and Hck underlies their inactivation by C‐terminal tyrosine phosphorylation. Cell. 2001;105:115–26. [DOI] [PubMed] [Google Scholar]
Associated Data
This section collects any data citations, data availability statements, or supplementary materials included in this article.
Supplementary Materials
Data S1: Supporting Information.
Data Availability Statement
Sequencing reads were deposited in NCBI's Gene Expression Omnibus (GEO) and are accessible through accession number GSE218190. Data for the DMS and code to reproduce figures are located in our Github repository at https://github.com/FowlerLab/2022_SrcHsp90.