

Abstract
Objectives:
Pathologists have routinely observed distinct histologic patterns of growth in early-stage lung adenocarcinoma (LUAD), which have been suggested to be associated with prognosis. Herein, we investigated the relationship between LUAD patterns of growth, as defined by the updated international association for the study of lung cancer (IASLC) grading criteria, and differences in the tumor immune microenvironment to identify predictors of response to immunotherapy.
Methods:
174 resected stage I-III LUAD tumors were classified by histologic pattern of growth (i.e. solid, micropapillary, acinar, papillary, and lepidic) and then grouped as well differentiated, moderately differentiated, and poorly differentiated. Comprehensive multiplatform analysis including whole exome sequencing, gene expression profiling, immunohistochemistry, CIBERSORT, and T-cell receptor sequencing was performed and groups were compared for differences in genomic drivers, immune cell infiltrate, clonality, and survival. Finally, multivariate analysis was performed adjusting for pathologic stage and smoking status.
Results:
Poorly differentiated tumors demonstrated a strong association with smoking relative to moderately differentiated or well differentiated tumors. However, unlike in prior reports, poorly differentiated tumors were not associated with a worse survival after curative-intent resection. Genomic analysis revealed that poorly differentiated tumors are associated with high tumor mutation burden but showed no association with oncogenic drivers. Immune analyses revealed that poorly differentiated tumors are associated with increased T-cell clonality, expression of PD-L1, and infiltration by cytotoxic CD8 T-cells, activated CD4 T-cells, and pro-inflammatory (M1) macrophages. Finally, multivariate analysis controlling for stage and smoking status confirmed independence of immune differences between IASLC grade groups.
Conclusions:
Poorly differentiated tumors, as defined by the updated IASLC grading criteria, are associated with a distinct immunogenic tumor microenvironment that predicts for therapeutic response to immune agents, including checkpoint inhibitors, and should be included in the clinical trial design of immunotherapy studies in early-stage lung adenocarcinoma.
Keywords: Lung adenocarcinoma, Adenocarcinoma patterns of growth, Translational pathology, Immune microenvironment, Multiplatform profiling, Predictors of immunotherapy response
1. Introduction
Lung cancer remains the leading cause of cancer-related mortality in men and women in the United States [1–2]. Small cell and non-small cell lung cancer (NSCLC) are regarded as the most clinically meaningful subtypes of lung cancer [3–4] with NSCLC further sub-classified as lung adenocarcinoma (LUAD) and squamous cell carcinoma (LUSC) due to distinct genetic basis and disparate responses to systemic therapy [5–7]. LUAD is the most common subtype and the most epidemiologically and genetically heterogeneous [5]. Tobacco exposure is the most prevalent risk factor for LUAD; however, nearly 20–30 % of cases are identified in never smokers [2]. Further, LUAD in smokers is enriched for activating mutations in KRAS, high tumor mutation burden, and increased T-cell infiltration and clonality [5,8]. In contrast, LUAD in never smokers is rarely associated with KRAS alterations and predicts for the presence of a diverse set of oncogenic mutations or fusions, such as EGFR or ALK, each with distinct disease biology and treatment [3,5,8].
However, pathologists have routinely observed phenotypic heterogeneity among LUAD primary tumors as reflected by distinct patterns of tumor growth which prompted the International Association for the Study of Lung Cancer (IASLC)/American Thoracic Society (ATS)/European Respiratory Society (ERS) [9] to develop a multidisciplinary classification. This classification system identified five distinct patterns of growth in LUAD: acinar, lepidic, papillary, micropapillary, and solid [10], as classified by predominant subtype.
Multiple clinical studies have attempted to determine the relationship of patterns of growth and genomic drivers or prognosis and have suggested that solid or micropapillary-predominant tumors are high-grade and associated with worse prognosis [11–18]. However, due to large scale differences in sample size and clinical variables such as completeness of surgical resection or pathologic stage, findings have not been uniformly consistent. Recently, an updated grading criteria from IASLC was designed that grouped tumors into 3 distinct groups, poorly differentiated, moderately differentiated, and well differentiated, as defined by the combination of predominant subtype and percentage of high grade patterns of growth [19] and was found to better stratify tumors by prognosis than classification by predominant subtype alone. Nonetheless, despite a suggested relationship with prognosis, in the clinic LUAD patterns of growth and the updated IASLC grading criteria are rarely utilized in treatment decision making. However, particularly in the immunotherapy and cellular therapy era, further study is warranted to understand the relationship of LUAD pattern of growth and immune activation and senescence within the tumor microenvironment that could impact the efficacy of these novel agents.
Herein, we describe the most comprehensive examination of the relationship between LUAD pattern of growth with genomic-immunologic disease correlates and survival. Using the PROSPECT (Profiling of Resistance patterns and Oncogenic Signaling Pathways in Evaluation of Cancers of the Thorax; LAB07-0233) patient cohort from the University of Texas M.D. Anderson Cancer Center, a robust dataset of stage I-III NSCLC tumors collected from 1996 to 2008, we applied the updated IASLC grading criteria to group tumors and utilized the power of multiplatform immune-genomic profiling to interrogate the relationship between LUAD patterns of growth and baseline clinical variables, prognosis, and immunogenomic environment, with particular interest given to predictors of response to immune therapies.
Our study, for the first time, demonstrates that poorly differentiated tumors are associated with prolonged tobacco exposure, elevated tumor mutation burden, and an immune infiltrated tumor microenvironment with increased cytotoxic CD8 T-cell infiltration, PD-L1 and LAG-3 expression, increased T-cell clonality, and decreased T-cell repertoire homology with tumor-adjacent lung tissue, which predict for favorable therapeutic response to novel immunotherapies.
2. Materials and methods
2.1. Patient cohort and sample collection
After informed consent, enrollment of study participants and collection of study samples was performed via the PROSPECT (Profiling of Resistance patterns and Oncogenic Signaling Pathways in Evaluation of Cancers of the Thorax; LAB07-0233) study approved by the University of Texas M.D. Anderson Cancer Center’s Institutional Review Board (IRB). Between 1996 and 2008, fresh-frozen and formalin-fixed paraffin-embedded (FFPE), peripheral blood mononuclear cells (PBMC), serum, tumor, and tumor-adjacent lung tissue samples were obtained from 174 LUAD patients at time of diagnosis and surgery. Histological subtype was defined and pathologic classification was performed on all samples and patients were treatment-naïve at the time of surgery. As part of pathologic sub-classification, patterns of growth were quantified within tumors such that the sum total of all patterns within an individual tumor was 100 %. LUAD tumors were classified using the updated IASLC grading criteria [19] and upon quantification of individual patterns of growth in a LUAD tumor, tumors were then classified into three distinct groups: well differentiated, moderately differentiated, and poorly differentiated. Well differentiated tumors were defined as lepidic predominant and <20 % high grade (i.e. solid or micropapillary) patterns of growth. Moderately differentiated tumors were defined as acinar or papillary predominant and <20 % high grade. Finally, poorly differentiated tumors were defined as any tumors with ≥20 % high grade pattern of growth. Notably, at the time of our pathologic sub-classification, our study did not quantify or identify non-traditional growth patterns such as cribriform and fused gland patterns of growth. Therefore, although this “high grade acinar” group was considered poorly differentiated in the updated IASLC grading criteria, it was not identified or included in the poorly differentiated group in this study.
2.2. TCR beta chain sequencing
Sequencing of the CDR3 regions of the human TCR-β chains was performed using the immunoSEQ Assay (Adaptive Biotechnologies, Seattle, WA) [20–22]. T cell density, richness, clonality, and similarity were calculated as previously described [8,23]. Briefly, TCR counts were normalized to the total amount of DNA usable for TCR sequencing as determined by PCR-amplification and sequencing of housekeeping genes before calculating T cell density. The preseqR package was used to calculated richness by extrapolating to 400,000 templates for PBMCs and 120,000 templates for tissue. To allow comparison of samples with unequal numbers of T cells, both richness and clonality normalize for sampling depth. Clonality was defined as 1-Peilou’s eveness [24]. As described previously, differential abundance analyses were used to identify TCRs that were enriched in one sample over another [25]. Parameters were as follows: minTotal = 5, productiveOnly = True, alpha = 0.1, count = aminoAcid. Statistical analysis was performed in R version 3.2.
2.3. Whole exome sequencing
Whole exome sequencing (WES) was performed on tumors and spatially segregated tumor-adjacent lung tissues to determine somatic point mutations in a prior study [26–27], where single nucleotide variants (SNV) and small insertions and deletions (indels) were detected using MuTect [28] and Pindel [29], respectively, followed by variants annotation and filter [30]. In addition, genomic DNA from 96 available matched peripheral blood samples was sequenced as germline control to identify the mutations in the tumor-adjacent uninvolved lung tissues. Blood DNA was analyzed to identify mutations related to clonal hematopoiesis of indeterminate potential (CHIP) based on annotation specified previously [31]. WES data are available in the EGA (EGAS00001004026).
2.4. Gene expression profiling
RNA microarray was performed in a prior study on 141 patients [32–33] using the Illumina HumanWG-6 v3.0 expression bead chip. Then an extended robust multi-array analysis (RMA) background correction model [34] was applied to obtain normalized gene expression profiles for individual samples. Gene expression data are available in the GEO repository (GSE42127).
2.5. CIBERSORT
To estimate the abundances of different cell types in mixed cell population, we ran CIBERSORT [35] (https://cibersort.stanford.edu) using leukocyte gene signature matrix.
LM22 containing 22 functionally defined human immune subsets was utilized to deconvolute our normalized gene expression profiles with default settings.
2.6. Immunohistochemistry
Tumor tissue was fixed in formalin and embedded in paraffin. For immunohistochemical staining, tissue was cut and mounted at a thickness of 4 μm per slide. Slides were then stained with CD3 polyclonal (1:100, DAKO), CD4 clone 4B12 (1:80, Leica Biosystems), CD8 clone C8/144B (1:25, Thermo Scientific), PD-L1 clone E1L3N (1:100, Cell Signaling Technology), PD-1 clone EPR4877-2 (1:250, Abcam), CD45RO clone UCHL1 (ready-to- use, Leica Biosystems), FoxP3 clone 206D (1:50, BioLegend), and Granzyme B clone F1 (ready-to-use, Leica Biosystems) [36] antibodies. Slides were then stained using diaminobenzidine as chromogen and the Leica Bond Polymer refine detection kit (Leica Biosystems). Slides were then counterstained with hematoxylin and scanned using an Aperio AT2 automated slide scanner (Leica Biosystems). Quantification was performed on 5 × 1 mm2 regions per tumor sample within the tumor center and measuring the average density of positive cells per region as a count of positive cells/mm2. For PD-L1, tumor proportion score was calculated by manual quantification with percentage between 0 and 100 % [37].
2.7. Grouping of lymphocyte interactions by paratope hotspots (GLIPH)
For identifying T cell specificity groups, Grouping of Lymphocyte Interactions by Paratope Hotspots (GLIPH) was used to cluster CDR3 rearrangements [38]. Briefly, the CDR3 sequences of the TCR-β chain from the uninvolved tumor-adjacent lung and tumors were used in conjunction with publicly available, tetramer defined viral CDR3 sequences [39]. Viral motifs are defined as a GLIPH motif composed of at least 3 viral tetramer-derived CDR3 sequences as well as the enrichment for a given V-gene (p < 0.05 by Fisher’s exact test).
2.8. Statistical analysis
All plots were generated using GraphPad Prism 8.0 (La Jolla, CA). For baseline characteristics, for continuous variables, t-test was applied. Further, for categorical variables, based upon sample size of < or >5, chi-square or Fisher’s exact test was applied. Because not all distributions of TCR variables met the normality assumption, Mann-Whitney U test or Kruskal-Wallis test (two-sided) was applied for assessing differences among groups. Wilcoxon signed-rank test was used to compare matched samples. Spearman’s rank correlation (two-sided) was used to assess monotonic relationships between two continuous variables. For survival analysis, we first performed Log-rank (Mantel-Cox) test. Due to the exploratory nature of the study, p-values were adjusted for multiple hypothesis testing (adjusted p-value (padj) < 0.05). Finally, to confirm independence of identified findings from covariates, multivariate analyses were performed on all significant findings with adjustment for the clinical variables of smoking status (current, former, never) and pathologic stage (1 vs 2 & 3). As patterns of growth are categorical variables with natural ordering, ordinal logistic regression was fit for multivariate analysis. Due to the exploratory nature of the study, p-values for independence were set at p-value < 0.01.
3. Results
3.1. Poorly differentiated tumors are associated with current and heavy tobacco use
One hundred and seventy-four patients with LUAD enrolled onto the PROSPECT study were included in our analysis. All patients underwent curative-intent surgery followed by classification of histologic pattern of growth by expert thoracic pathologist and comprehensive multiplatform profiling. Utilizing the updated IASLC grading criteria [19], LUAD tumors were stratified into three groups, well differentiated, moderately differentiated, and poorly differentiated as dictated by the predominant pattern of growth and percentage of high grade component. Next, the relationship of individual groups and tumor microenvironment was assessed. As shown in Supplementary Fig. 1, of the 174 LUAD tumors, 75 (43 %) were classified as poorly differentiated (i.e. containing ≥20 % high grade pattern of growth). Of these, the most common high grade pattern was solid (n = 74) with only 1 case of micropapillary growth ≥20 %. As was expected, the largest group was the moderately differentiated group (n = 85; 49 %) with the prevalence of acinar predominant tumors (n = 73) being much larger than papillary predominant tumors (n = 12). Finally, the smallest group was the well differentiated group (n = 14; 8 %).
Baseline characteristics, as shown in Table 1, demonstrated no significant differences among age, sex, race, baseline stage (AJCC 8th edition), surgical quality or type. However, in contrast to well differentiated or moderately differentiated tumors, poorly differentiated tumors were enriched for a consistent association with active and heavy tobacco use. Specifically, 57 % and 73 % of patients with poorly differentiated tumors were either current active smokers or have ≥30 pack/year history of smoking, relative to only 29 % and 55 % of moderately differentiated tumors, and 21 % and 29 % of well differentiated tumors, respectively.
Table 1.
Baseline characteristics. +Stage was determined by American Joint Committee on Cancer (AJCC) 8th edition.
| Variable | Poorly differentiated (N = 75) | Moderately differentiated (N = 85) | Well differentiated (N = 14) | p-value |
|---|---|---|---|---|
|
| ||||
| Age yr. | 62.5 +/− 10.0 | 66.5 +/− 10.2 | 66.4 +/− 11.6 | 0.03 |
| Sex no. (%) | 1 | |||
| Male | 40(53) | 45 (53) | 8 (57) | |
| Female | 35 (47) | 40 (47) | 6 (43) | |
| Race no. (%) | 0.07 | |||
| Caucasian | 65 (87) | 78 (92) | 10 (71) | |
| Non-Caucasian | 10 (13) | 7 (8) | 4 (29) | |
| Smoking Status no. (%) | 0.0005 | |||
| Current | 43 (57) | 25 (29) | 3 (21) | |
| Former | 27 (36) | 48 (56) | 6 (43) | |
| Never | 5 (7) | 12 (14) | 5 (36) | |
| Tobacco Use no. (%) | 0.002 | |||
| ≥ 30 pack/year | 55 (73) | 47 (55) | 4 (29) | |
| < 30 pack/year | 20 (27) | 38 (45) | 10 (71) | |
| Pathologic Stage no. (%)+ | 0.37 | |||
| Stage 1 | 38 (51) | 47 (55) | 10 (71) | |
| Stage 2 + 3 | 37 (49) | 38 (45) | 4 (29) | |
| Surgery no. (%) | 0.77 | |||
| Lobectomy* | 71(95) | 81 (95) | 13 (93) | |
| Wedge | 4 (5) | 4 (5) | 1 (7) | |
| Resection | 1 | |||
| Margin no. (%) | ||||
| Negative (R0) | 71 (95) | 80 (94) | 14 (100) | |
| Positive (R1/R2) | 4 (5) | 5 (6) | 0 (0) | |
3.2. Poorly differentiated tumors are not associated with worsened relapse-free & overall survival.
Next, we examined the relationship between LUAD pattern of growth and prognosis. Unlike the patient cohorts used to validate the new IASLC grading criteria [19], which demonstrated that stratifying by ≥ or <20 % high grade pattern most effectively classified tumors by prognosis, in our study relapse-free (RFS) and overall survival (OS) were nearly identical between all groups (Supplementary Fig. 2a–e) despite extended follow-up (average: 7 years; range: 0–17 years). Further, prognosis between grade groups remained overlapping even after stratifying by pathologic stage (Supplementary Fig. 2c–f). While recognizing that there are differences in our cohort from prior IASLC study cohorts, the lack of survival difference in our cohort suggests that the updated IASLC grading criteria requires further refinement and validation as a prognostic tool before widespread adoption into clinical use.
3.3. Poorly differentiated tumors are associated with increased tumor mutation burden
Due to the burden of smokers in the poorly differentiated group, we next assessed the relationship of IASLC grade group and tumor mutation burden (TMB), which has been recurrently shown to be increased in lung cancer, particularly smoking-associated lung cancer, relative to other cancer types [40]. Additionally, TMB has been shown to be modestly correlated with increased prevalence of tumor infiltrating CD8 T-cells and T-cell clonality [8]. Finally, TMB of greater than 10 mutations per megabase has been shown to be an independent predictor of response to immunotherapy across human cancer [41], including LUAD [42].
First, to validate findings of prior studies in our dataset, we assessed the relationship of TMB, tobacco use and T-cell clonality. TMB again demonstrated a modest correlation with pack/years of smoking (Fig. 1a; r = 0.37; p = 0.0001; spearman rank correlation) and T-cell clonality (Fig. 1b; r = 0.28; p = 0.02; spearman rank correlation). Next, we compared TMB and IASLC grade group by total non-synonymous exonic mutations (NSEM) and by percentage of tumors with ≥10 mutations/megabase (Mut/Mb) or <10 Mut/Mb. Poorly differentiated tumors demonstrated a significantly increased TMB relative to moderately and well differentiated tumors in total NSEM and possibly by the percentage of tumors with >10 Mut/Mb. Specifically, poorly differentiated tumors were found to have 292 (ranging from 8 to 857) NSEM per tumor compared to only 136 (ranging from 5 to 653) NSEM per tumor in moderately differentiated tumors and 52 (ranging from 3 to 184) NSEM per tumor in well differentiated tumors (Supplementary Fig. 3a; Kruskal-Wallis (KW) p = 0.003; Adjusted (padj) p = 0.02). Additionally, tumors classified as poorly differentiated were enriched for increased TMB ≥ 10 Mut/Mb. Specifically, 79 % of all tumors with ≥10 Mut/Mb were classified as poorly differentiated relative to only 21 % and 0 % classified as moderately differentiated or well differentiated tumors, respectively (Fig. 1c; KW p = 0.02; padj = 0.08). However, as the finding of TMB ≥ 10 Mut/Mb lost significance upon multiple hypothesis adjustment, future validation will be required.
Fig. 1.
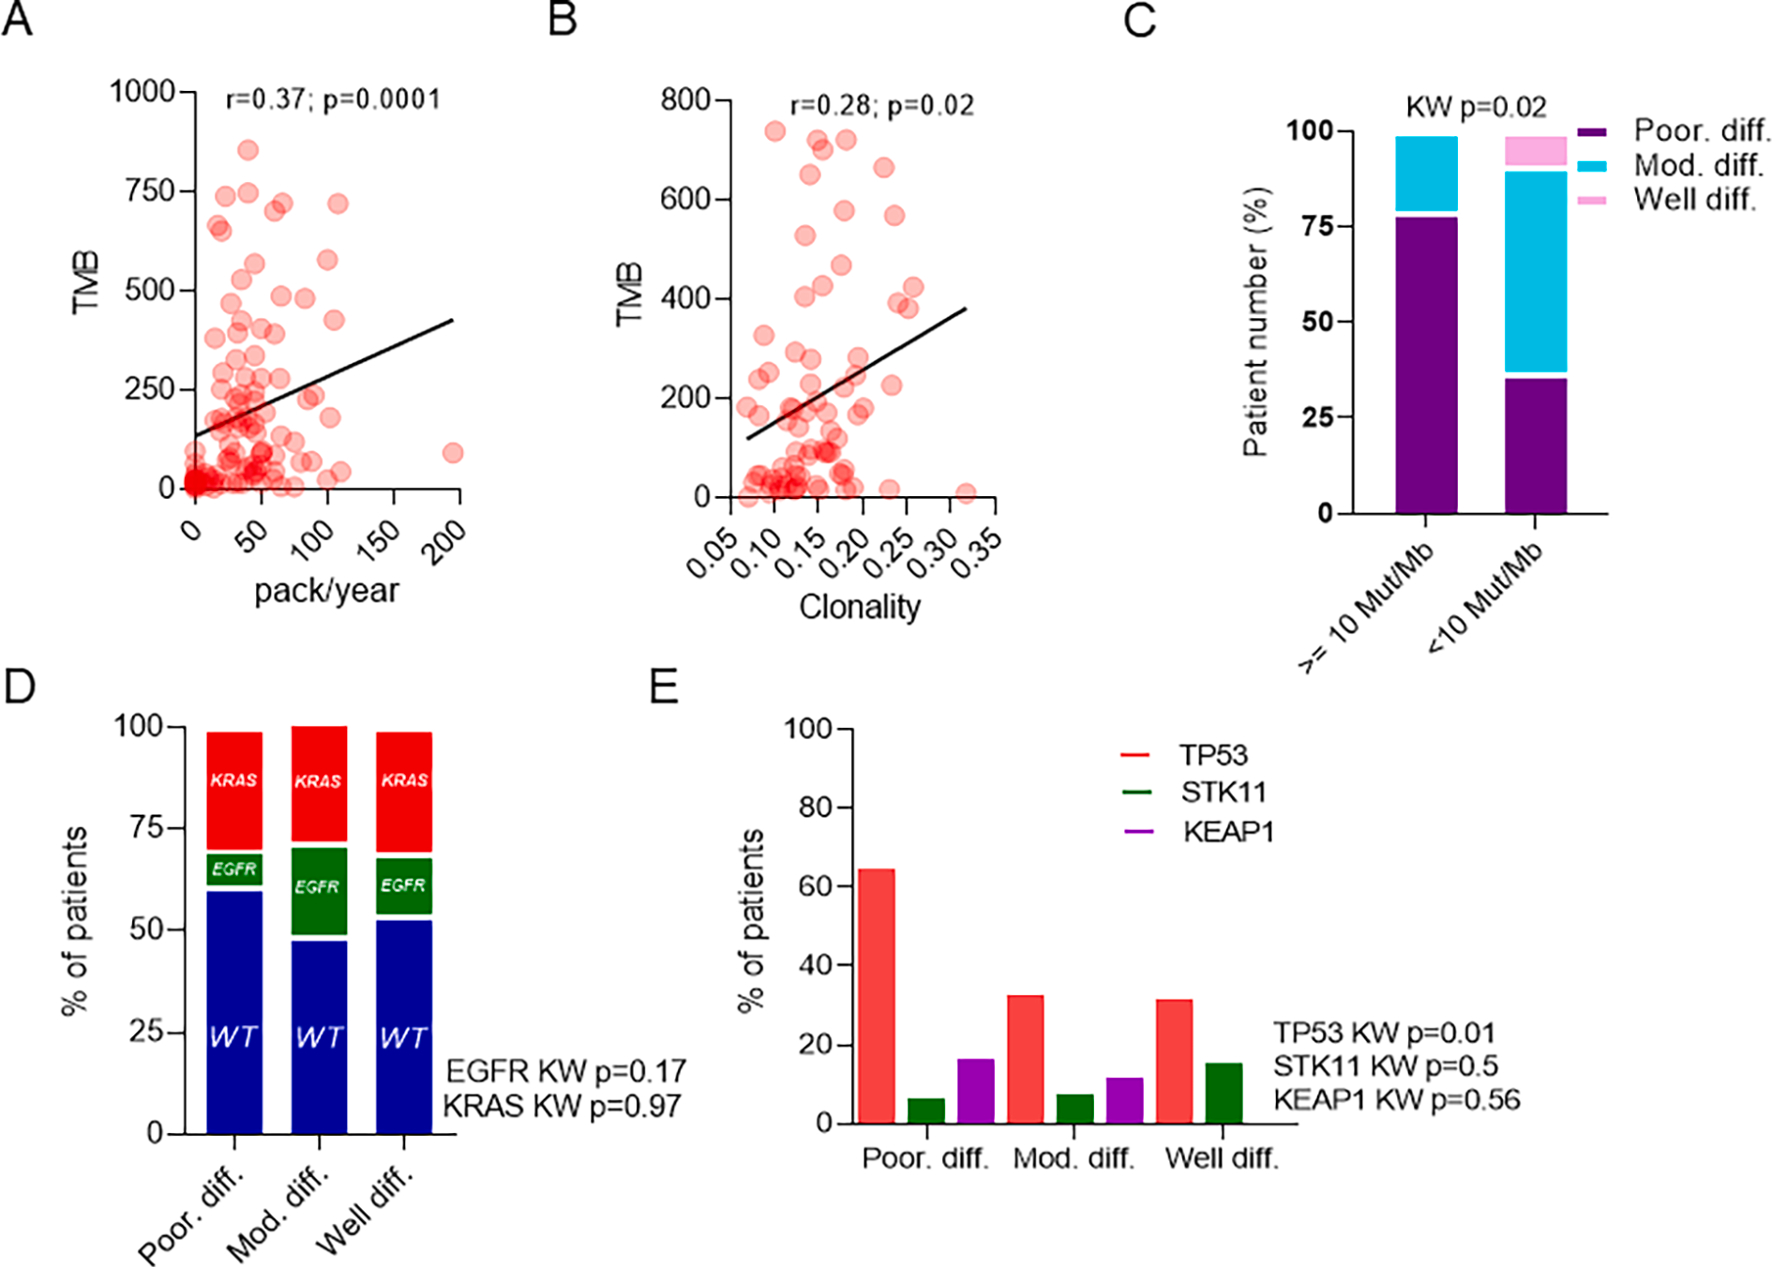
Poorly differentiated tumors are associated with increased tumor mutation burden (TMB) and mutations in TP53. Correlation between TMB and A. Tobacco use (n = 101) and B. T-cell clonality (n = 73). C. Relationship between TMB (>10 Mut/Mb) and IASLC grade group (n = 101). Relationship of IASLC grade group and D. KRAS/EGFR driver mutations (n = 162) and E. TP53/STK11/KEAP1 tumor suppressor genes (n = 100).
Altogether, these findings suggest that poorly differentiated tumors with ≥ 20 % high grade patterns of growth are associated with increased TMB, including a trend towards the clinically useful variable to TMB ≥ 10 Mut/Mb, which predicts for increased responsiveness to immunotherapy, particularly the currently FDA approved anti-PD1 and anti-CTLA4 immunotherapies.
3.4. Poorly differentiated tumors may be associated with mutations in TP53
We next assessed the relationship between IASLC grade group and LUAD oncogenic drivers, KRAS and EGFR, and tumor suppressor genes, TP53, STK11, and KEAP1 [43]. Notably, although whole exome sequencing was used in this dataset, fusions were poorly captured and therefore we were unable to assess for presence of fusion-specific oncogenic drivers in LUAD involving ALK, ROS1, and RET genes. No IASLC grade group showed an enrichment of activating mutations in KRAS or EGFR (Fig. 1d) or loss of function mutations in STK11 or KEAP1 (Fig. 1e). However, poorly differentiated tumors demonstrated a significant increase in the prevalence of mutations in TP53 (Fig. 1d; KW p = 0.01; padj = 0.06). However, as findings were not significant after adjustment for multiple hypothesis testing further validation will be needed to confirm this finding.
As with TMB, TP53 mutations have been suggested to also predict responsiveness to checkpoint inhibitors [43] and create an environment that allows for cancer cell proliferation [44] and future genomic doubling, a finding associated with poor prognosis [44].
3.5. Poorly differentiated tumors are associated with increased immune infiltration and T-cell activation
As prior studies have suggested a relationship of TP53 mutations and increased TMB with increased infiltration of cytotoxic and activated CD8 T-cells and M0/M1 macrophages [45], we next assessed the relationship between IASLC grade group and immune cells in the tumor microenvironment. As our group has previously published upon the immune characteristics of this patient cohort using TCRseq, IHC, and GEP [8,23,26–27,32–33,36], we reanalyzed the data to interrogate the composition of the poorly differentiated, moderately differentiated, and well differentiated tumors and associated tumor-adjacent uninvolved lung tissue (TAL).
First, we reviewed results of IHC and identified a significantly increased density of CD8 T-cells (KW p = 0.0004; padj = 0.002) and GZMB-expressing cells (KW p = 0.0001; padj = 0.001) (Fig. 2a) in poorly differentiated tumors, a difference not found with other T-cell populations (Fig. 2a; Supplementary Fig. 3b). Further, although all T-cell markers were positively correlated with GZMB, among poorly differentiated tumors the density of GZMB was most positively correlated with CD8 T-cells (Fig. 2b; p=<0.0001; r = 0.66; spearman rank correlation) as opposed to CD4 T-cells (Supplementary Fig. 3c; p=<0.0001; r = 0.39; spearman rank correlation), highlighting the cytotoxic nature of these infiltrating CD8 T-cells.
Fig. 2.
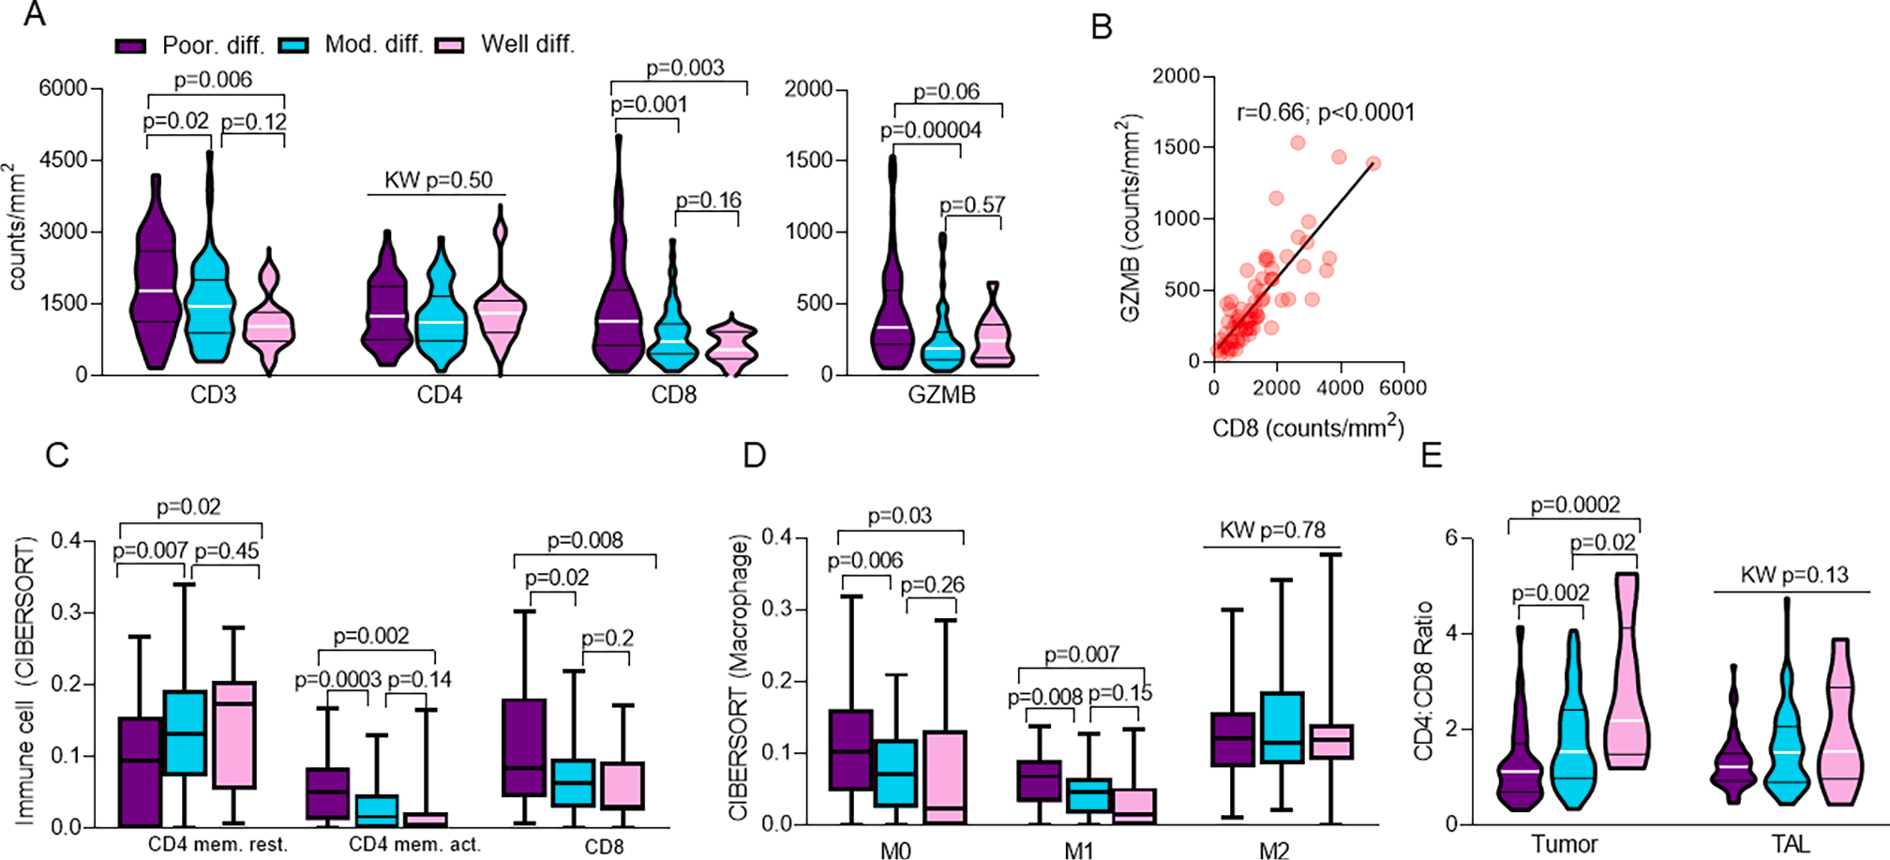
Poorly differentiated tumors are associated with increased immune infiltration and T-cell activation. Relationship of IASLC grade group and A. intra-tumoral T-cell populations (n = 146). Within poorly differentiated tumors, relationship of CD8 and B. GZMB density (n = 66). CIBERSORT of C. T-cells (n = 138) and D. Macrophages (n = 138) by IASLC grade group. Relationship of IASLC grade group and E. Tumor and TAL CD4:CD8 Ratio (n = 129).
Further, functional assessment by CIBERSORT revealed that CD4 T-cells within moderately differentiated and well differentiated tumors favored a resting CD4 memory cell phenotype (Fig. 2c; KW p = 0.008; padj = 0.03), whereas CD4 T-cells within poorly differentiated tumors favored an activated CD4 memory cell phenotype (Fig. 2c; KW p = 0.0001; padj = 0.003). Additionally, poorly differentiated tumors showed an increased presence of CD8 T-cells relative to moderately differentiated or well differentiated tumors (Fig. 2c; p = 0.007; padj = 0.03), further reinforcing IHC findings. Although no difference was seen among nearly all other adaptive and innate immune cells (Supplementary Fig. 4a–b), poorly differentiated tumors demonstrated an increase in prevalence of M0 (Fig. 2d; KW p = 0.01; padj = 0.03) and pro-inflammatory (M1) macrophages (Fig. 2d; KW p = 0.0004; padj = 0.005), but not anti-inflammatory (M2) macrophages (Fig. 2d; KW p = 0.78; padj = 0.82). Further, moderately differentiated and well differentiated tumors demonstrated increased monocytes relative to poorly differentiated tumors (Supplementary Fig. 4b; KW p = 0.01; padj = 0.04). Altogether, this finding suggests that poorly differentiated tumors may be more primed to foster an anti-tumor immune response [46] and supports the idea of a distinct immunogenic TME phenotype within poorly differentiated tumors. Additionally, the lack of increase in activated NK cell programming among poorly differentiated tumors further supports that the observed increase in granzyme B expression is likely solely due to increased CD8 T cell infiltration (Supplementary Fig. 4b).
Comparison of intra-tumoral CD4:CD8 ratio also revealed an intensification of differences between poorly differentiated and moderately differentiated or well differentiated tumors. Specifically, intra-tumoral CD4:CD8 ratio among well differentiated, moderately differentiated, and poorly differentiated tumors was 2.78 (ranging from 1.2 to 5.27), 1.77 (ranging from 0.34 to 4.08), and 1.31 (ranging from 0.32 to 4.15), respectively (Fig. 2e; KW p = 0.00005; padj = 0.001), again reinforcing enrichment of CD8 + T cells within poorly differentiated tumors. In contrast, comparison of CD4:CD8 ratio in TAL between IASLC grade group did not identify any differences (Fig. 2e; KW p = 0.13; padj = 0.27).
Finally, review of T-cell populations within TAL revealed significantly increased T-cell density across nearly all markers tested among poorly differentiated tumors, including total CD4 and CD8 T-cells along with cytotoxic (GZMB-expressing), regulatory (FOXP3-expressing), and antigen-experienced (CD45RO-expressing) T-cells (Supplementary Fig. 4c).
Altogether, as shown in the representative histologic images (Fig. 3), our findings suggest that poorly differentiated tumors may drive a more active T-cell population both within LUAD tumors and in the tumor-adjacent uninvolved lung tissue in contrast to the more scant and inactivated immune infiltrate in moderately differentiated and well differentiated tumors.
Fig. 3.
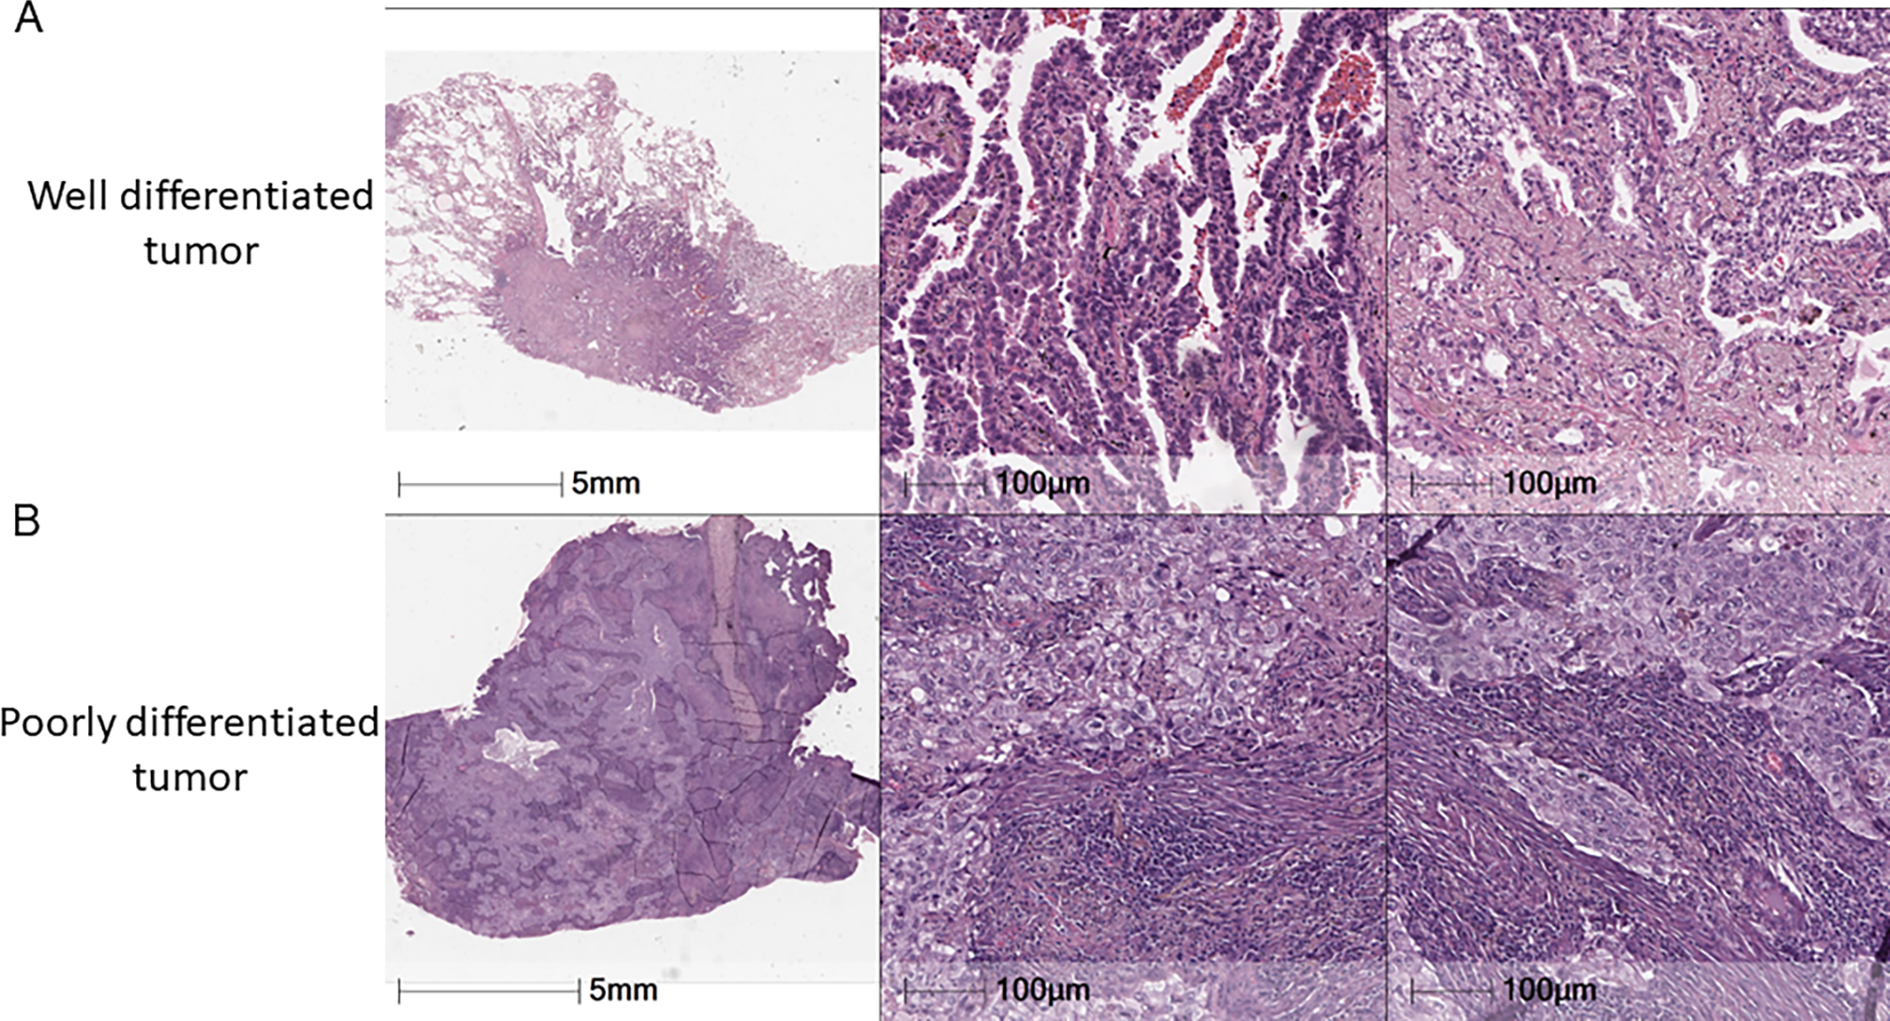
Poorly differentiated tumors are associated with increased immune infiltration and T-cell activation. Representative image of A. well-differentiated tumor with scant immune cell infiltration and B. poorly differentiated tumor and extensive immune infiltration.
3.6. Poorly differentiated tumors are associated with increased expression of PD-L1 and LAG-3
Considering the increased T-cell infiltration seen in poorly differentiated tumors, we next assessed the expression of immune checkpoints used by malignant tumors, including LUAD, to induce immune senescence. First, we assessed PD-L1 expression by tumor proportion score [37] and identified that poorly differentiated tumors had significantly increased PD-L1 TPS relative to moderately differentiated tumors with average TPS of 17.7 (range 0 to 100) and 4.8 (range 0 to 90), respectively (Fig. 4a; KW p = 0.006; padj = 0.02). Average PD-L1 TPS in well differentiated tumors was also only 1.4 (range 0 to 15). However, due to small sample size this did not achieve statistical significance (Fig. 4a). Further analysis by gene expression profiling assessing other immune checkpoints showed no significant differences in expression of TIGIT or CTLA-4 (Supplementary Fig. 5). However, poorly differentiated tumors demonstrated a significant increase in the expression of LAG-3, an immune checkpoint in development for NSCLC and already showing success in metastatic melanoma [47], relative to moderately differentiated tumors (Supplementary Fig. 5a; KW p = 0.006; padj = 0.08). However, as findings were not significant after adjustment for multiple hypothesis testing, additional assessment in other datasets will be required to confirm this finding.
Fig. 4.
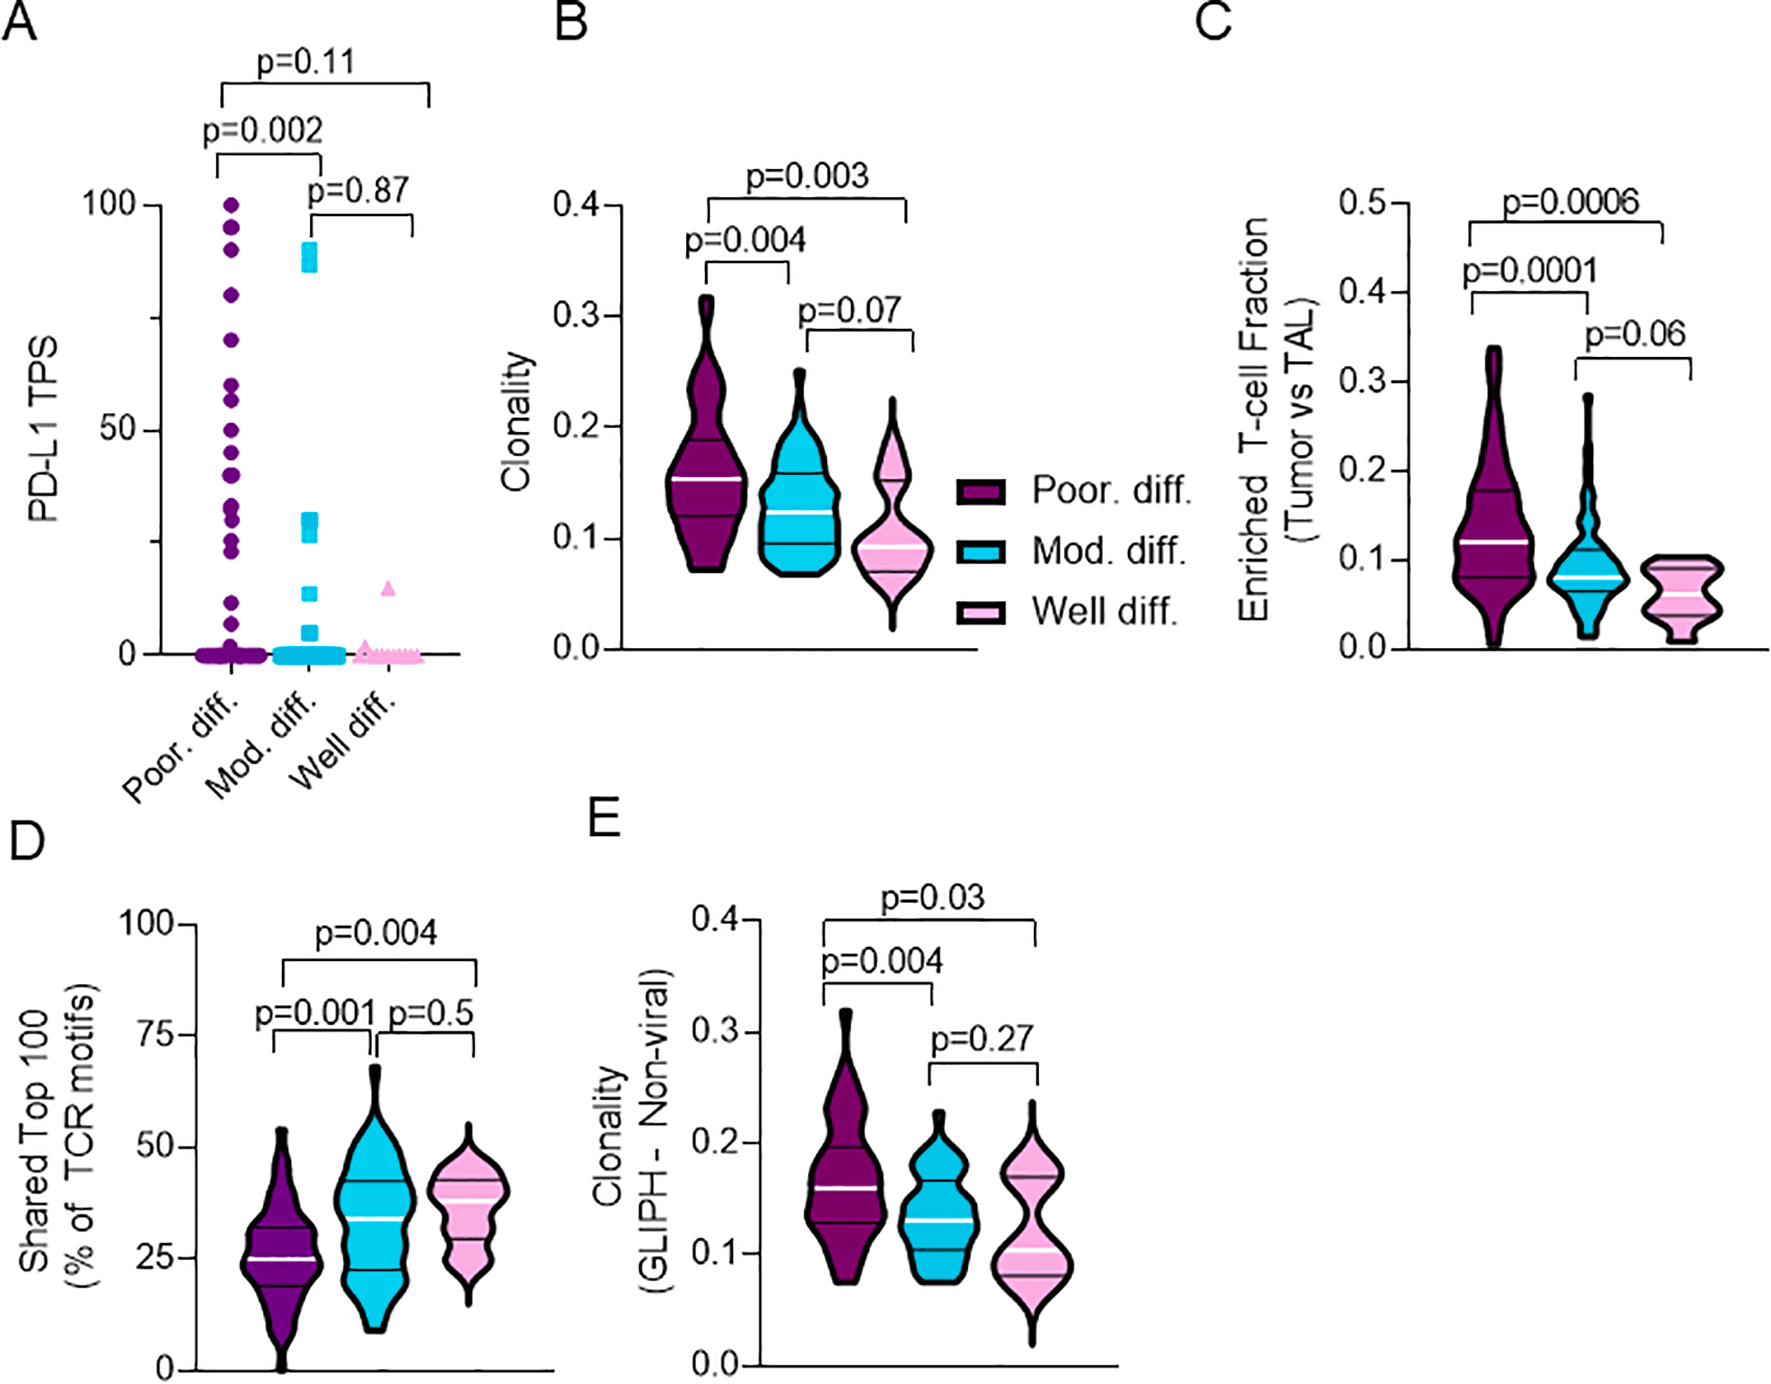
Poorly differentiated tumors are associated with increased expression of PD-L1, increased T-cell clonality, and decreased T-cell repertoire homology with TAL. Relationship of IASLC grade group and A. PD-L1 tumor proportion score (TPS) (n = 130), B. T-cell clonality (n = 135), C. Enriched T-cell fraction (n = 130), D. Shared Top 100 T-cell clones in tumor relative to Top 100 T-cell clones in TAL (n = 130), and E. T-cell clonality against non-viral antigens by GLIPH analyses (n = 104).
3.7. Poorly differentiated tumors are associated with increased T-cell clonality and decreased T-cell repertoire homology compared to TAL
Finally, to investigate the nature of the infiltrating T-cell repertoire between IASLC grade groups, we analyzed TCR sequencing data generated from tumor and TAL repertoires. First, we assessed the relationship of IASLC grade group and T-cell clonality and richness. For T-cell clonality, poorly differentiated tumors demonstrated increased clonal expansion relative to moderately differentiated or well differentiated tumors (Fig. 4b; KW p = 0.0008; padj = 0.03). Further, T-cell richness, a measure of T-cell diversity, demonstrated near identical richness between all IASLC grade groups (Supplementary Fig. 6a; KW p = 0.8; padj = 0.91) suggesting that although infiltrating T-cells among LUAD tumors are similarly diverse, poorly differentiated tumors in particular appear to drive clonal T-cell expansion and therefore could contain a more tumor-reactive T-cell infiltrate. Indeed, further enrichment for fraction of T-cell clones unique to tumor and not found in TAL (i.e. enriched T-cell fraction) demonstrated a significant increase in the number of tumor-only T-cell clones in poorly differentiated tumors relative to moderately differentiated or well differentiated tumors (Fig. 4c; KW p = 0.0002; padj = 0.002). Finally, we assessed the anti-tumor specificity of infiltrating T-cells by comparing T-cell repertoire homology between tumor and TAL. Notably, relative to moderately differentiated or well differentiated tumors, poorly differentiated tumors were found to have decreased T-cell repertoire homology between tumor and TAL, a finding that has been previously suggested to be associated with a more tumor-focused T cell repertoire devoid of bystander T cells [8]. Specifically among the top 100 most prevalent T-cell clones identified in individual tumors, moderately differentiated and well differentiated tumors had an average 33 and 36 T-cell clones shared among the top 100 in the TAL, respectively (Fig. 4d). In contrast, poorly differentiated tumors had an average of only 25 shared among the top 100 in the TAL (Fig. 4d; KW p = 0.0007; padj = 0.03). Further evaluation utilizing other overall measures of homology including the Jaccard and Morisita indices demonstrated a trend but no significant differences in T-cell repertoire homology on Supplementary Fig. 6b–c.
Additionally, to evaluate T-cell antigen specificity we studied TCR motifs using the GLIPH algorithm, a tool validated on tuberculosis antigens utilized to predict antigen binding by comparing TCR sequencing data to tetramer-validated sequences to identify shared amino acid motifs and infer antigen specificity. Analysis by GLIPH demonstrated an overall increased T-cell clonality in poorly differentiated tumors relative to moderately differentiated and well differentiated tumors (Supplementary Fig. 6d; KW p = 0.005; padj = 0.04). Importantly, GLIPH demonstrated increased T-cell clonality against non-viral antigens (rather than viral antigens – i.e. Bystander T cells) in poorly differentiated tumors relative to moderately differentiated or well differentiated tumors (Fig. 4e; KW p = 0.005; padj = 0.04) supporting findings from the TCRseq analysis (Fig. 4b). In conjunction with the findings of decreased shared T-cell homology between tumor and TAL, and increased enriched T-cell fraction, the GLIPH analysis supports that poorly differentiated tumors appear to be more immunogenic and contain a T-cell infiltrate that appears to be clonally expanded against tumor-specific antigens.
3.8. Multivariate analysis confirms that poorly differentiated tumors are independently associated with an immunogenic and inflamed tumor immune microenvironment
Finally, due to significant differences in smoking status between IASLC grade groups in our cohort (Table 1) and possible association of smoking with genomic and immune findings across multiplatform analysis, we next performed a multivariate analysis controlling for smoking status (current, former, never) and pathologic stage (stage 1 vs stage 2 & 3). As shown in Table 2 and Supplementary Table 1, among the genomic analyses, the association of increased prevalence of mutation in TP53 and poorly differentiated tumors remained significant after multivariate adjustment (p = 0.002). However, in contrast, association of increased TMB and poorly differentiated tumors lacked significance after multivariate analysis (p = 0.01) suggesting that increased TMB in this group is explained by increased burden of smokers among patients with poorly differentiated tumors. Among the immune analyses, the multivariate analysis confirmed the independent association of poorly differentiated grade group and nearly all significant findings from IHC, CIBERSORT, TCRseq, and GLIPH analyses including increased prevalence of intra-tumoral CD8 (p = 0.0002) and GZMB T-cells (p = 0.002), the increased expression of LAG-3 (p = 0.004), and increased T-cell clonality (p = 0.001) in poorly differentiated tumors. However, notably, association of increased PD-L1 TPS and poorly differentiated tumors lacked significance after multivariate analysis (p = 0.02). Altogether, these findings reinforce that although TMB may correlate modestly with T-cell prevalence in tumors, it is neither the sole nor the principal driver of T-cell infiltration and does not explain the increased immune activation in poorly differentiated tumors. Further, it suggests that differences in prevalence of immune cells both within tumor and in TAL are not solely due to differences in smoking-associated lung inflammation and appear to be related to distinct immunogenic potentials of different IASLC grade groups. Finally, it suggests that T-cell repertoire in poorly differentiated tumors appear to be more tumor focused and thus perhaps better primed for an effective anti-tumor immune response. However, immune senescence, unsurprisingly, is likely not solely related to a single immune checkpoint such as PD-L1 but rather by multiple distinct checkpoints, possibly including LAG-3.
Table 2.
Multivariate analysis. *TMB, tumor mutation burden; +TPS, Tumor proportion score.
| Poor. diff. | Mod. diff. | Well diff. | Univariate analysis p-values | Multivariate model p-values | ||||
|---|---|---|---|---|---|---|---|---|
|
| ||||||||
| Genomic findings: | percent. | percent. | percent. | |||||
| TP53 mut.(%) | 66% | 34% | 33% | 0.01 | 0.002 | |||
| median | range | median | range | median | range | |||
| Genomic findings: | ||||||||
| TMB* | 217 | 8–857 | 91 | 5–653 | 22 | 3–184 | 0.003 | 0.01 |
| Immune findings (IHC): | ||||||||
| CD3 (tumor) | 1789 | 173–4201 | 1455 | 309–4689 | 1043 | 324–2184 | 0.005 | 0.004 |
| CD8 (tumor) | 1147 | 94–5028 | 726 | 103–2848 | 554 | 100–990 | 0.0004 | 0.0002 |
| GZMB (tumor) | 336 | 54–1536 | 191 | 31–992 | 245 | 69–651 | 0.0001 | 0.002 |
| PD-L1 TPS+ | 0 | 0–100 | 0 | 0–90 | 0 | 0–15 | 0.006 | 0.02 |
| Immune findings (GEP): | ||||||||
| LAG-3 | 7.5 | 4.5–11.2 | 6.6 | 3.4–10.4 | 6.1 | 4–9 | 0.006 | 0.004 |
| Immune findings (TCRseq): | ||||||||
| T-cell clonality | 0.15 | 0.07–0.32 | 0.12 | 0.07–0.25 | 0.09 | 0.06–0.18 | 0.0008 | 0.001 |
| Enriched T-cell fraction | 0.09 | 0.001–0.20 | 0.08 | 0.03–0.24 | 0.07 | 0.02–0.22 | 0.00002 | 0.0001 |
| Immune findings (GLIPH): | ||||||||
| T-cell clonality (non-viral) | 0.15 | 0.08–0.32 | 0.13 | 0.07–0.23 | 0.1 | 0.17–0.18 | 0.005 | 0.002 |
4. Discussion
This study represents the most comprehensive analysis of the genomic and immune underpinnings of LUAD morphologic patterns of growth and invasion. Utilizing the updated IASLC grading criteria, our study highlights the key clinical, prognostic, genomic, and immunologic differences between poorly differentiated, moderately differentiated, and well differentiated tumors. Although recent studies have also described distinct epidemiologic and genomic differences among various LUAD patterns of growth [48], our trial is the first to do so using the updated IASLC criteria and is the first to thoroughly detail the distinct immune differences between IASLC grade group.
Herein, we have demonstrated that poorly differentiated tumors, as defined by ≥20 % high grade pattern of growth (i.e. solid or micropapillary), appear to represent the morphologic phenotype of an active, heavy smoker, particularly those with ≥30 pack/years of smoking. Furthermore, our multiplatform analysis reveals that relative to moderately differentiated or well differentiated tumors, poorly differentiated tumors have increased TMB, a trend towards increased frequency of TP53 loss of function mutations, and increased expression of PD-L1 TPS, all of which are independent predictors of response to checkpoint blockade [41–42,44,49]. Further, we describe the novel finding that tumor microenvironments of poorly differentiated tumors possess a distinct immunogenic phenotype with significant infiltration of cytotoxic CD8+ T-cells, increased activated CD4 memory T- cells, polarization of macrophages toward pro-inflammatory M1, and increased expression of LAG-3. Further, they demonstrate more tumor-focused T-cell repertoire with increased T-cell clonality with selectively higher expansion of T-cell clones only found in tumor, non-viral antigen specificity, and decreased shared T-cell homology with TAL. Altogether these findings suggest that the tumor microenvironment within poorly differentiated tumors is likely more tumor specific and thus more primed for anti-tumor immune response.
Notably, our study does have certain limitations. First, although our study separated tumors into poorly differentiated, moderately differentiated, and well differentiated grade groups, the well differentiated group was very small. Therefore, nearly all findings are based upon differences between poorly differentiated and moderately differentiated groups and findings from multiplatform analyses of well differentiated grade group likely require further validation in larger cohorts. Additionally, for the sake of simplicity, although nearly all LUAD tumors consist of multiple different co-existing patterns of growth and invasion, our analyses evaluated tumors as a whole as opposed to specific analysis of individual growth patterns within a tumor. Therefore, although it is very likely that there is intra-tumor heterogeneity of genomic findings and non-uniform infiltration and expansion of T-cell repertoire within the tumor, we are unable to specifically correlate a specific pattern of growth and genotypic or immune findings. Finally, we recognize that although the revised IASLC criteria was built and validated to stratify tumors by prognosis, we do not see prognostic differences between IASLC grade groups despite long follow-up. Possible explanations for differences are that our cohort consisted of patients of more advanced stage than in validation studies with nearly 45 % of our cohort being stage 2 or 3, much more than incorporated into IASLC testing and validation study [19], and had a smaller group of stage 1 patients, which may have limited our power to separate tumors by prognosis. Nonetheless, among stage 1 tumors we do see a trend of patients with poorly differentiated tumors experiencing worse RFS and OS than moderately differentiated tumors, however, it is not statistically significant. Other considerations include our small number of tumors with micropapillary pattern of growth (n = 1), which would be expected to be associated with worse RFS and OS. Further, we did not evaluate “high risk acinar” growth and therefore our moderately differentiated group may incorporate a small proportion of such patients that would also be associated with worse survival. Nonetheless, as this group only represented ~5 % of the training, validation, and test cohorts in the IASLC publication, we do not feel that this exclusion is likely to significantly impact our findings. Finally, compared to prior publications, our cohort contained a much larger percentage of poorly differentiated tumors (43 %).
In conclusion, we suggest that poorly differentiated tumors, as defined by the updated IASLC grading criteria possess a distinct tumor phenotype that is predicted for favorable response to immunotherapy, including novel and currently approved checkpoint inhibitor therapy, and should be considered at the time of surgery and warrant inclusion in the clinical trial design of immunotherapy trials in early-stage lung adenocarcinoma.
Supplementary Material
Acknowledgements
The authors sincerely appreciate the patients who were included in this study. The authors declare that they have no known competing financial interests or personal relationships have influenced this work.
Funding
This study was supported by the NIH CCSG Award (CA016672 (Institutional Tissue Bank (ITB) and Research Histology Core Laboratory (RHCL)) and the Translational Molecular Pathology-Immunoprofiling Moonshot Platform (TMP-IL) at the Department Translational Molecular Pathology, the University of Texas MD Anderson Cancer Center; the Lung Specialized Programs of Research Excellence grant 5 (P50 CA070907).
AR is supported by the Exon20 Group, Rexanna’s Foundation for Fighting Lung Cancer, the Happy Lungs Project, the Waun Ki Hong Lung Cancer Research Fund, MD Anderson’s Lung Cancer Moon Shot, the Petrin Fund, the University Cancer Foundation via the Institutional Research Grant program at the University of Texas MD Anderson Cancer Center, RETpositive, LUNGevity, and the Cancer Prevention and Research Institute of Texas. All other authors declare no disclosures.
Abbreviations:
- NSCLC
non-small cell lung cancer
- LUAD
lung adenocarcinoma
- LUSC
lung squamous cell carcinoma
- PROSPECT
Profiling of Resistance patterns and Oncogenic Signaling Pathways in Evaluation of Cancers of the Thorax
- IASLC
International Association for the Study of Lung Cancer
- ATS
American Thoracic Society
- ERS
European Respiratory Society
- WHO
World Health Organization
- IHC
immunohistochemistry
- WES
whole exome sequencing
- GLIPH
Grouping of Lymphocyte Interactions by Paratope Hotspots
- GEP
gene expression profiling
- TCR
T-cell receptor
- RFS
relapse-free survival
- OS
overall survival
- TMB
tumor mutation burden
- NSEM
non-synonymous exonic mutations
- TAL
tumor-adjacent uninvolved lung
- GZMB
Granzyme B
- TIL
Tumor infiltrating lymphocyte
- EBUS
endobronchial ultrasound
- AJCC
American joint committee on cancer
Footnotes
Declaration of Competing Interest
The authors declare the following financial interests/personal relationships which may be considered as potential competing interests: Alexandre Reuben serves on the Scientific Advisory Board and has received honoraria from Adaptive Biotechnologies. John V. Heymach serves on the Scientific Advisory Committees of AstraZeneca, EMD Serono, Boehringer-Ingelheim, Genentech, GlaxoSmithKline, Hengrui Therapeutics, Eli Lilly, Spectrum, Sanofi, Takeda, Mirati Therapeutics, BMS, BrightPath Biotherapeutics, Janssen Global Services, Nexus Health Systems, Pneuma Respiratory, Roche, Leads Biolabs, and RefleXion and provides research support to AstraZeneca, Bristol-Myers Squibb, and Spectrum and has received royalties and licensing fees from Spectrum. All other authors declare no potential conflicts of interest.
CRediT authorship contribution statement
Neal Akhave: Conceptualization, Methodology, Investigation, Writing – original draft, Writing – review & editing, Visualization. Jiexin Zhang: Formal analysis. Erin Bayley: Conceptualization, Investigation, Writing – review & editing. Meredith Frank: Writing – review & editing. Shin-Heng Chiou: Investigation. Carmen Behrens: Investigation. Runzhe Chen: Investigation, Writing – review & editing. Xin Hu: Investigation, Writing – review & editing. Edwin Roger Parra: Resources, Methodology. Won-Chul Lee: Formal analysis, Investigation. Stephen Swisher: Resources. Luisa Solis: Resources, Methodology. Annikka Weissferdt: Resources, Methodology. Cesar Moran: Resources, Methodology. Neda Kalhor: Resources, Methodology. Jianhua Zhang: Investigation. Paul Scheet: Investigation, Formal analysis. Ara A. Vaporciyan: Resources, Methodology. Boris Sepesi: Resources, Methodology. Don L. Gibbons: Methodology. John V. Heymach: Formal analysis. Jack J. Lee: Formal analysis. Ignacio I. Wistuba: Investigation, Resources, Methodology. P. Andrew Futreal: Investigation, Methodology. Jianjun Zhang: Conceptualization, Methodology, Investigation, Writing – review & editing, Supervision. Junya Fujimoto: Conceptualization, Methodology, Investigation, Writing – review & editing, Supervision. Alexandre Reuben: Conceptualization, Methodology, Investigation, Writing – review & editing, Supervision, Visualization.
Appendix A. Supplementary data
Supplementary data to this article can be found online at https://doi.org/10.1016/j.lungcan.2022.08.007.
References
- [1].Henley SJ, Ward EM, Scott S, et al. , Annual report to the nation on the status of cancer, part I: National cancer statistics, Cancer 126 (2020) 2225–2249. [DOI] [PMC free article] [PubMed] [Google Scholar]
- [2].Siegel RL, Miller KD, Fuchs HE, Jemal A, Cancer Statistics, 2021, CA Cancer J. Clin. 71 (2021) 7–33. [DOI] [PubMed] [Google Scholar]
- [3].Ettinger DS, Wood DE, Aisner DL, et al. , NCCN Guidelines Insights: Non-Small Cell Lung Cancer, Version 2.2021, J. Natl. Compr. Canc. Netw 19 (2021) 254–266. [DOI] [PubMed] [Google Scholar]
- [4].Kalemkerian GP, Loo BW, Akerley W, et al. , NCCN Guidelines Insights: Small Cell Lung Cancer, Version 2.2018, J Natl. Compr. Canc. Netw. 16 (2018) 1171–1182. [DOI] [PubMed] [Google Scholar]
- [5].Cancer Genome Atlas Research N. Comprehensive molecular profiling of lung adenocarcinoma. Nature 2014;511:543–50. [DOI] [PMC free article] [PubMed] [Google Scholar]
- [6].Cancer Genome Atlas Research N. Comprehensive genomic characterization of squamous cell lung cancers. Nature 2012;489:519–25. [DOI] [PMC free article] [PubMed] [Google Scholar]
- [7].Scagliotti GV, Parikh P, von Pawel J, et al. , Phase III study comparing cisplatin plus gemcitabine with cisplatin plus pemetrexed in chemotherapy-naive patients with advanced-stage non-small-cell lung cancer, J. Clin. Oncol. 26 (2008) 3543–3551. [DOI] [PubMed] [Google Scholar]
- [8].Reuben A, Zhang J, Chiou SH, et al. , Comprehensive T cell repertoire characterization of non-small cell lung cancer, Nat. Commun. 11 (2020) 603. [DOI] [PMC free article] [PubMed] [Google Scholar]
- [9].Travis WD, Brambilla E, Noguchi M, et al. , International Association for the Study of Lung Cancer/American Thoracic Society/European Respiratory Society: international multidisciplinary classification of lung adenocarcinoma: executive summary, Proc. Am. Thorac. Soc. 8 (2011) 381–385. [DOI] [PubMed] [Google Scholar]
- [10].Travis WD, Brambilla E, Noguchi M, et al. , International association for the study of lung cancer/american thoracic society/european respiratory society international multidisciplinary classification of lung adenocarcinoma, J. Thorac. Oncol 6 (2011) 244–285. [DOI] [PMC free article] [PubMed] [Google Scholar]
- [11].Warth A, Muley T, Meister M, et al. , The novel histologic International Association for the Study of Lung Cancer/American Thoracic Society/European Respiratory Society classification system of lung adenocarcinoma is a stage-independent predictor of survival, J. Clin. Oncol. 30 (2012) 1438–1446. [DOI] [PubMed] [Google Scholar]
- [12].Tsuta K, Kawago M, Inoue E, et al. , The utility of the proposed IASLC/ATS/ERS lung adenocarcinoma subtypes for disease prognosis and correlation of driver gene alterations, Lung Cancer 81 (2013) 371–376. [DOI] [PubMed] [Google Scholar]
- [13].Gu J, Lu C, Guo J, et al. , Prognostic significance of the IASLC/ATS/ERS classification in Chinese patients-a single institution retrospective study of 292 lung adenocarcinoma, J. Surg. Oncol. 107 (2013) 474–480. [DOI] [PubMed] [Google Scholar]
- [14].Murakami S, Ito H, Tsubokawa N, et al. , Prognostic value of the new IASLC/ATS/ERS classification of clinical stage IA lung adenocarcinoma, Lung Cancer 90 (2015) 199–204. [DOI] [PubMed] [Google Scholar]
- [15].Hung JJ, Jeng WJ, Chou TY, et al. , Prognostic value of the new International Association for the Study of Lung Cancer/American Thoracic Society/European Respiratory Society lung adenocarcinoma classification on death and recurrence in completely resected stage I lung adenocarcinoma, Ann. Surg. 258 (2013) 1079–1086. [DOI] [PubMed] [Google Scholar]
- [16].Tsao MS, Marguet S, Le Teuff G, et al. , Subtype Classification of Lung Adenocarcinoma Predicts Benefit From Adjuvant Chemotherapy in Patients Undergoing Complete Resection, J. Clin. Oncol. 33 (2015) 3439–3446. [DOI] [PMC free article] [PubMed] [Google Scholar]
- [17].Yoshizawa A, Motoi N, Riely GJ, et al. , Impact of proposed IASLC/ATS/ERS classification of lung adenocarcinoma: prognostic subgroups and implications for further revision of staging based on analysis of 514 stage I cases, Mod. Pathol. 24 (2011) 653–664. [DOI] [PubMed] [Google Scholar]
- [18].Yoshizawa A, Sumiyoshi S, Sonobe M, et al. , Validation of the IASLC/ATS/ERS lung adenocarcinoma classification for prognosis and association with EGFR and KRAS gene mutations: analysis of 440 Japanese patients, J. Thorac. Oncol 8 (2013) 52–61. [DOI] [PubMed] [Google Scholar]
- [19].Moreira AL, Ocampo PSS, Xia Y, et al. , A grading system for invasive pulmonary adenocarcinoma: a proposal from the International Association for the Study of Lung Cancer Pathology Committee, J Thorac Oncol 15 (2020) 1599–1610. [DOI] [PMC free article] [PubMed] [Google Scholar]
- [20].Robins HS, Campregher PV, Srivastava SK, et al. , Comprehensive assessment of T-cell receptor beta-chain diversity in alphabeta T cells, Blood 114 (2009) 4099–4107. [DOI] [PMC free article] [PubMed] [Google Scholar]
- [21].Robins H, Desmarais C, Matthis J, et al. , Ultra-sensitive detection of rare T cell clones, J. Immunol. Methods 375 (2012) 14–19. [DOI] [PMC free article] [PubMed] [Google Scholar]
- [22].Carlson CS, Emerson RO, Sherwood AM, et al. , Using synthetic templates to design an unbiased multiplex PCR assay, Nat. Commun. 4 (2013) 2680. [DOI] [PubMed] [Google Scholar]
- [23].Reuben A, Gittelman R, Gao J, et al. , TCR repertoire intratumor heterogeneity in localized lung adenocarcinomas: an association with predicted neoantigen heterogeneity and postsurgical recurrence, Cancer Discov. 7 (2017) 1088–1097. [DOI] [PMC free article] [PubMed] [Google Scholar]
- [24].Kirsch I, Vignali M, Robins H, T-cell receptor profiling in cancer, Mol. Oncol. 9 (2015) 2063–2070. [DOI] [PMC free article] [PubMed] [Google Scholar]
- [25].DeWitt WS, Emerson RO, Lindau P, et al. , Dynamics of the cytotoxic T cell response to a model of acute viral infection, J. Virol. 89 (2015) 4517–4526. [DOI] [PMC free article] [PubMed] [Google Scholar]
- [26].Choi M, Kadara H, Zhang J, et al. , Mutation profiles in early-stage lung squamous cell carcinoma with clinical follow-up and correlation with markers of immune function, Ann. Oncol. 28 (2017) 83–89. [DOI] [PMC free article] [PubMed] [Google Scholar]
- [27].Kadara H, Choi M, Zhang J, et al. , Whole-exome sequencing and immune profiling of early-stage lung adenocarcinoma with fully annotated clinical follow-up, Ann. Oncol. 29 (2018) 1072. [DOI] [PMC free article] [PubMed] [Google Scholar]
- [28].Cibulskis K, Lawrence MS, Carter SL, et al. , Sensitive detection of somatic point mutations in impure and heterogeneous cancer samples, Nat. Biotechnol. 31 (2013) 213–219. [DOI] [PMC free article] [PubMed] [Google Scholar]
- [29].Ye K, Schulz MH, Long Q, Apweiler R, Ning Z, Pindel: a pattern growth approach to detect break points of large deletions and medium sized insertions from paired-end short reads, Bioinformatics 25 (2009) 2865–2871. [DOI] [PMC free article] [PubMed] [Google Scholar]
- [30].Takahashi K, Wang F, Kantarjian H, et al. , Preleukaemic clonal haemopoiesis and risk of therapy-related myeloid neoplasms: a case-control study, Lancet Oncol. 18 (2017) 100–111. [DOI] [PMC free article] [PubMed] [Google Scholar]
- [31].Jaiswal S, Fontanillas P, Flannick J, et al. , Age-related clonal hematopoiesis associated with adverse outcomes, N. Engl. J. Med. 371 (2014) 2488–2498. [DOI] [PMC free article] [PubMed] [Google Scholar]
- [32].Tang H, Xiao G, Behrens C, et al. , A 12-gene set predicts survival benefits from adjuvant chemotherapy in non-small cell lung cancer patients, Clin. Cancer Res. 19 (2013) 1577–1586. [DOI] [PMC free article] [PubMed] [Google Scholar]
- [33].Lou Y, Diao L, Cuentas ER, et al. , Epithelial-mesenchymal transition is associated with a distinct tumor microenvironment including elevation of inflammatory signals and multiple immune checkpoints in lung adenocarcinoma, Clin. Cancer Res. 22 (2016) 3630–3642. [DOI] [PMC free article] [PubMed] [Google Scholar]
- [34].Xie Y, Wang X, Story M, Statistical methods of background correction for Illumina BeadArray data, Bioinformatics 25 (2009) 751–757. [DOI] [PMC free article] [PubMed] [Google Scholar]
- [35].Newman AM, Liu CL, Green MR, et al. , Robust enumeration of cell subsets from tissue expression profiles, Nat. Methods 12 (2015) 453–457. [DOI] [PMC free article] [PubMed] [Google Scholar]
- [36].Parra ER, Behrens C, Rodriguez-Canales J, et al. , Image analysis-based assessment of PD-L1 and tumor-associated immune cells density supports distinct intratumoral microenvironment groups in non-small cell lung carcinoma patients, Clin. Cancer Res. 22 (2016) 6278–6289. [DOI] [PMC free article] [PubMed] [Google Scholar]
- [37].Rocha P, Salazar R, Zhang J, et al. , CD73 expression defines immune, molecular, and clinicopathological subgroups of lung adenocarcinoma, Cancer Immunol. Immunother. 70 (2021) 1965–1976. [DOI] [PMC free article] [PubMed] [Google Scholar]
- [38].Glanville J, Huang H, Nau A, et al. , Identifying specificity groups in the T cell receptor repertoire, Nature 547 (2017) 94–98. [DOI] [PMC free article] [PubMed] [Google Scholar]
- [39].Shugay M, Bagaev DV, Zvyagin IV, et al. , VDJdb: a curated database of T-cell receptor sequences with known antigen specificity, Nucl. Acids Res. 46 (2018) D419–D427. [DOI] [PMC free article] [PubMed] [Google Scholar]
- [40].Alexandrov LB, Nik-Zainal S, Wedge DC, et al. , Signatures of mutational processes in human cancer, Nature 500 (2013) 415–421. [DOI] [PMC free article] [PubMed] [Google Scholar]
- [41].Marabelle A, Fakih M, Lopez J, et al. , Association of tumour mutational burden with outcomes in patients with advanced solid tumours treated with pembrolizumab: prospective biomarker analysis of the multicohort, open-label, phase 2 KEYNOTE-158 study, Lancet Oncol. 21 (2020) 1353–1365. [DOI] [PubMed] [Google Scholar]
- [42].Hellmann MD, Ciuleanu TE, Pluzanski A, et al. , Nivolumab plus ipilimumab in lung cancer with a high tumor mutational burden, N. Engl. J. Med. 378 (2018) 2093–2104. [DOI] [PMC free article] [PubMed] [Google Scholar]
- [43].Skoulidis F, Heymach JV, Co-occurring genomic alterations in non-small-cell lung cancer biology and therapy, Nat. Rev. Cancer 19 (2019) 495–509. [DOI] [PMC free article] [PubMed] [Google Scholar]
- [44].Dong ZY, Zhong WZ, Zhang XC, et al. , Potential predictive value of TP53 and KRAS mutation status for response to PD-1 blockade immunotherapy in lung adenocarcinoma, Clin. Cancer Res. 23 (2017) 3012–3024. [DOI] [PubMed] [Google Scholar]
- [45].Bielski CM, Zehir A, Penson AV, et al. , Genome doubling shapes the evolution and prognosis of advanced cancers, Nat. Genet. 50 (2018) 1189–1195. [DOI] [PMC free article] [PubMed] [Google Scholar]
- [46].Lin X, Wang L, Xie X, et al. , Prognostic biomarker TP53 mutations for immune checkpoint blockade therapy and its association with tumor microenvironment of lung adenocarcinoma, Front Mol Biosci 7 (2020), 602328. [DOI] [PMC free article] [PubMed] [Google Scholar]
- [47].LAG3-PD-1 Combo Impresses in Melanoma. Cancer Discov 2021;11:1605–6. [DOI] [PubMed] [Google Scholar]
- [48].Caso R, Sanchez-Vega F, Tan KS, et al. , The underlying tumor genomics of predominant histologic subtypes in lung adenocarcinoma, J. Thorac Oncol. 15 (2020) 1844–1856. [DOI] [PMC free article] [PubMed] [Google Scholar]
- [49].Gandhi L, Rodriguez-Abreu D, Gadgeel S, et al. , Pembrolizumab plus chemotherapy in metastatic non-small-cell lung cancer, N. Engl. J. Med. 378 (2018) 2078–2092. [DOI] [PubMed] [Google Scholar]
Associated Data
This section collects any data citations, data availability statements, or supplementary materials included in this article.