Abstract
A method for quantifying the proportion of supercoiled circular (SC) forms in DNA solutions is described. The method (SCFluo) takes advantage of the reversible denaturation property of SC forms and the high specificity of the PicoGreen fluorochrome for double-stranded (ds)DNA. Fluorescence values of forms capable of reversible denaturation after a 5 min heating, 2 min cooling step are normalised to fluorescence values of total dsDNA present in the preparation. For samples with a SC content >20–30%, good regression fits were obtained when values derived from densitometric scanning of an agarose gel and those derived from the SCFluo method were compared. The method represents an attractive alternative to currently established methods because it is simple, rapid and quantitative. During large-scale processing and long-term storage, enzymatic, chemical and shear degradation may substantially decrease the SC content of plasmid DNA preparations. Regulations for pharmaceutical grade products for use in gene therapy and DNA vaccination may require >90% of the plasmid to be in the SC form. In the present study the SC content of 6.9, 13 and 20 kb plasmid preparations that had been subjected to chemical and shear degradation was successfully quantified using the new method.
INTRODUCTION
Supercoiled circular (SC) plasmid DNA is generally considered to be the desirable form for use in gene therapy and DNA vaccination. Regulations for pharmaceutical grade products may require >90% of the plasmid to be in the SC form (1). In small-scale freshly made preparations of plasmid DNA the SC form, which is the native form of the plasmid, usually accounts for 80–90% of the total DNA (2,3). During large-scale processing and long-term storage, enzymatic, chemical and shear degradation of the SC form become significant in decreasing the SC content with respect to total DNA (2,4–8).
SC content in DNA preparations is typically assessed using agarose gel electrophoresis, gel staining and subsequent photography and/or densitometric scanning. Capillary electrophoresis and various chromatographic techniques can also be used for this purpose (2). Most of these methods are time consuming and labour intensive and additionally they require relatively large amounts of sample. Electrochemical methods can offer an alternative; however, they are restricted to laboratories equipped with voltammetric or chronopotentiometric analysers (9).
In this paper we present a method (SCFluo) to monitor SC content in DNA solutions that is simple, rapid and requires small amounts of sample. SCFluo takes advantage of two well-documented properties: reversible denaturation of SC DNA and the high specificity of the PicoGreen fluorochrome for double-stranded (ds)DNA (10). The complementary strands of SC molecules cannot be separated (without breaking one of them) by treatments such as heating or exposure to mild alkali which break most of the hydrogen bonds in DNA (11). Closed circular molecules regain their native configuration when cooled or return to neutral pH and show a high fluorescence enhancement (>1000-fold) upon binding the PicoGreen reagent. In contrast, other dsDNA structures, such as open circular (OC) and linear forms, are irreversibly denatured by such treatments and remain as single-stranded (ss)DNA showing minimal fluorescence upon binding the PicoGreen reagent.
MATERIALS AND METHODS
Plasmid and bacterial cultures
The plasmids used in the present study were: pSVβ (Promega Corp., Madison, WI), 6.9 kb; pQR186 (12), 13 kb; pQR150 (12), 20 kb. Plasmids were transformed and propagated in Escherichia coli DH5α (Gibco-Life Technologies, Gaithersburg, MD); LB medium (11) was used for all cultures. Small-scale cultures of pSVβ, pQR186 and pQR150 were prepared in 2 l shake flasks and incubated at 37°C with agitation. A large-scale culture of pSVβ was prepared in a 450 l Chemap bioreactor (Chemap AG, Maenndorf, Switzerland) as described previously (13). Intermediate cultures of pQR150 were prepared in a Series 210 LH 7l bioreactor (Adaptive Biosystems, Luton, UK). Cell pastes were initially stored at –20°C and then at –70°C.
Plasmid purification
Pure plasmid DNA solutions were obtained from Qiagen Maxi or Mega anion exchange columns (Qiagen Ltd, West Sussex, UK). DNA concentrations were determined by UV spectrophotometry at 260 nm. Partially purified plasmid solutions were obtained using a small-scale procedure (11). Cells (135 mg) were defrosted and resuspended in 750 µl of TE buffer (10 mM Tris–HCl, pH 8.0, 1 mM EDTA) containing 100 mg l–1 RNase A (Sigma, Poole, UK). Lysis was achieved by addition of an equal volume of 200 mM NaOH, 1% SDS buffer. After 5 min incubation, the mixture was neutralised by addition of 1.4 vol of 3 M potassium acetate, pH 5.5. Clarification was achieved by 10 min centrifugation at 15 000 r.p.m. A volume of the clarified lysate was precipitated with 0.7 vol of isopropanol, washed with 70% ethanol and resuspended in 1 vol of TE buffer. A fraction of the redissolved DNA was further purified using the Qiaprep Spin Miniprep kit and protocols (Qiagen Ltd). Aliquots of the clarified lysate and resuspended isopropanol precipitates were diluted 1/300, 1/400 and 1/600 in TE buffer prior to heating at 95°C. For spiking experiments, pure DNA obtained from Qiagen anion exchange columns was used.
Generation of degraded plasmid samples
Pure plasmid preparations (P-DNA) of either pSVβ or pQR150 were diluted to 14 µg ml–1 in TE buffer. The solutions were incubated in a water bath at 60°C to accelerate chemical degradation of the SC to OC and linear forms. After 48 h, the solutions (hereafter named O-DNA) were divided into small aliquots and kept at –20°C. Clarified lysates of either pQR186 or pQR150 were subjected to shear rates between 1.4 and 4.8 × 10⁵ s–1 using a capillary rheometer as described previously (6).
Agarose gel electrophoresis
Plasmid pSVβ samples were loaded onto 0.8% agarose gels containing 0.05 µg ml–1 ethidium bromide and electrophoresed at 80 V for 2 or 3 h in Tris–borate electrophoresis buffer (11). Plasmid pQR150 samples were electrophoresed in 0.6% agarose gels at 50 V for 6 h and stained after the run with ethidium bromide. Gels were scanned and analysed using the UVP 5000 Gel Documentation System and GelBase™ analysis software (Ultra Violet Products Ltd, Cambridge, UK). Control and sheared samples of pQR186 and pQR150 were electrophoresed and analysed as described previously (6).
Fluorescence-based assay
Plasmid DNA solutions were diluted to a final volume of 2 ml in TE buffer. One millilitre was kept at ambient temperature and used subsequently for standard PicoGreen (Molecular Probes, Leiden, The Netherlands) dsDNA quantification. The remaining volume was transferred to a 2 ml microtube and incubated at 95°C in a water bath for 4–5 min, followed by cooling by incubation on ice for 2 min. Hereafter, these samples are referred to as ‘heated–cooled’ samples. Ambient and heated–cooled samples were transferred to disposable acrylic cuvettes, mixed with an equal volume of diluted PicoGreen reagent (1:400 in TE buffer) and incubated, unless otherwise stated, for 3–5 min before measuring fluorescence enhancement. A TD-700 Laboratory Fluorometer (Turner Designs, Sunnyvale, CA) at excitation and emission wavelengths of 480 and 520 nm, respectively, was used. The sensitivity factor was adjusted from 92 to 100% according to the range of DNA concentrations of each experiment. For each dilution point or mixture tested, the ambient aliquot was read immediately before the corresponding heated–cooled aliquot. Measurements were corrected for background fluorescence from a solution containing buffer and diluted PicoGreen reagent.
RESULTS
Characterisation of native and chemically degraded samples
A plasmid preparation (P-DNA) of pSVβ was obtained from an overnight shake flask culture and subsequent purification using a Qiagen anion exchange column. Different amounts of the preparation were loaded onto an agarose gel (Fig. 1, lanes 2–4 and 9). The SC content, proportion of SC plasmid with respect to total plasmid, was estimated by applying the correction factor for supercoiling of 1.36 to values obtained from densitometric scanning of the SC band of the gel (14). Using this method the SC content was found to be 95%; an error of ±20% is considered to be associated with this technique (14). A pSVβ solution containing only OC and linear forms (O-DNA) of the plasmid was generated by prolonged incubation at 60°C. An agarose gel was loaded with 17.5–350 ng of this preparation (Fig. 1, lanes 5–8). No band corresponding to SC DNA was detectable by densitometric scanning of these lanes. A SC content <5% can be safely assumed, considering a limit of detection of 17.5 ng (Fig. 1, lane 4) under the conditions used. In this preparation a small proportion of DNA was further converted into a linear form (Fig. 1, lanes 5–8). Also shown in Figure 1 (lane 10) is a sample of pSVβ linearized with HindIII.
Figure 1.
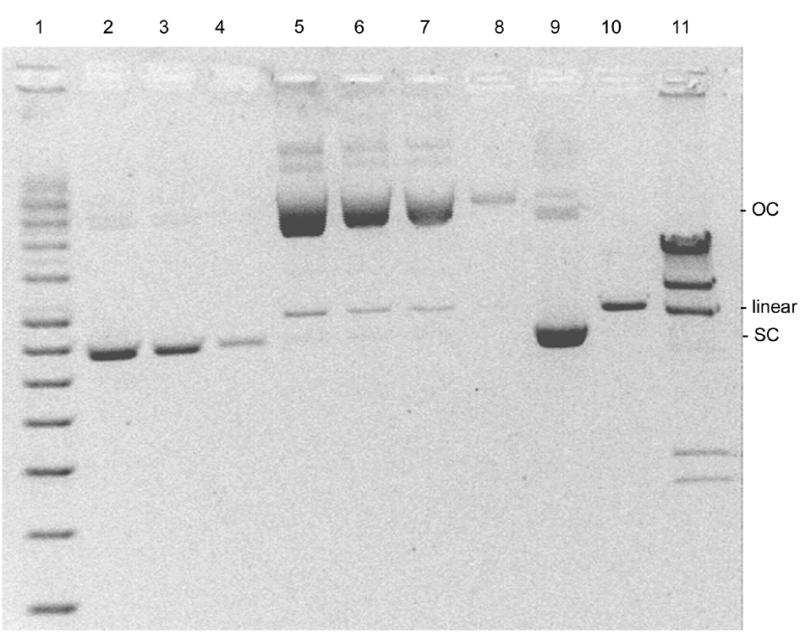
Agarose gel electrophoresis of supercoiled circular (SC), open circular (OC) and linear forms of pSVβ. Lane 1, supercoiled DNA ladder; lanes 2–4 and 9, 105, 61.5, 17.5 and 350 ng, respectively, of a typical plasmid preparation (P-DNA); lanes 5–8, 350, 105, 61.5 and 17.5 ng, respectively, of the same preparation but incubated at 60°C for 48 h (O-DNA); lane 10, P-DNA linearized with HindIII; lane 11, phage λ × HindIII molecular weight marker.
P-DNA and O-DNA solutions were heated for 5 min at 95°C and incubated for 2 min on ice. Aliquots of these solutions together with unheated control samples were loaded onto an agarose gel. The result, shown in Figure 2, indicates that in the P-DNA sample the SC band remained unchanged after the heating–cooling step and the small proportion of OC forms present in the sample were converted into ssDNA forms (Fig. 2, lanes 1 and 2). As expected, the O-DNA sample, composed only of OC and linear forms, was completely converted, after the heating step, into various different ssDNA forms (Fig. 2, lanes 3 and 4).
Figure 2.
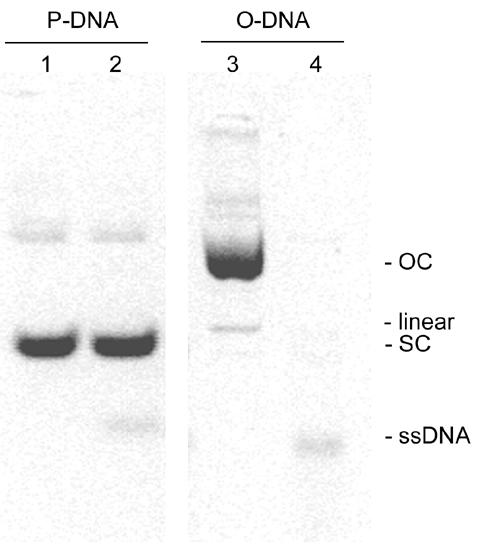
Agarose gel electrophoresis of heated (95°C)–cooled pSVβ. Lanes 1 and 2, ambient and heated (95°C)–cooled P-DNA; lanes 3 and 4, ambient and heated (95°C)–cooled O-DNA. SC, supercoiled circular; OC, open circular; ssDNA, single-stranded DNA.
Assay development and calculation protocol
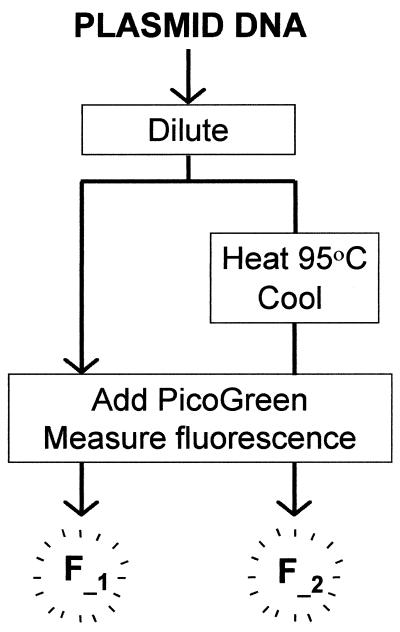
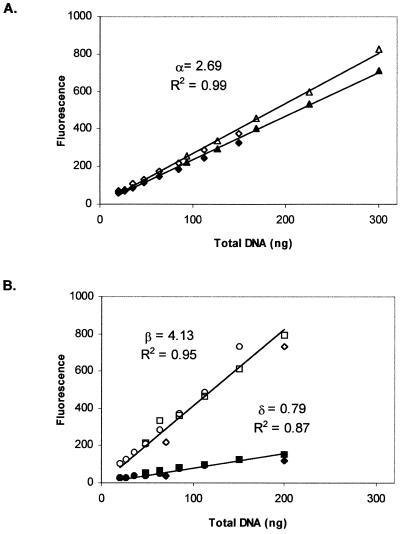
P-DNA and O-DNA preparations were diluted from 300 to 20 ng ml–1 in 2 ml TE buffer and treated as depicted schematically in Figure 3. An aliquot of 1 ml from each of the dilution points was heated–cooled, while the remaining 1 ml of each dilution point was kept at ambient temperature. Fluorescence enhancement for ambient (standard PicoGreen assay) O-DNA samples was higher than for P-DNA samples of the same DNA concentration (Fig. 4A and B, open symbols). This result demonstrates that fluorescence enhancement of PicoGreen is dependent on plasmid conformation and agrees well with data reported previously (10). It also indicates that plasmid quantitation using the standard PicoGreen fluorescence assay could lead to overestimation in cases where the SC content of the preparation differs substantially from the SC content of the DNA used to generate the relevant calibration curve. Considering that for a P-DNA sample:
Figure 3.
Schematic outline of the SCFluo method. F_1, fluorescence of ambient aliquot; F_2, fluorescence of heated (95°C)–cooled aliquot.
Figure 4.
Fluorescence enhancement of the PicoGreen reagent upon binding to different concentrations of P-DNA (A) or O-DNA (B) preparations of pSVβ. Ambient (open symbols) and heated (95°C)–cooled (closed symbols) aliquots were obtained as described (Materials and Methods). Different symbols represent results from independent determinations.
XPT = XPS + XPO 1
where XPT is total mass of plasmid DNA, XPS is the mass of SC DNA and XPO is the mass of OC and linear forms. The percentage of SC DNA in a P-DNA sample may be calculated as:
SC% = [(XPT – XPO)/XPT] × 100 2
Fluorescence values obtained from the SCFluo method for the P-DNA sample (Fig. 4A) may be used to estimate SC% as follows:
FP1 = α(XPT – XPO) + βXPO 3
FP2 = α(XPT – XPO) + δXPO 4
where FP1 are fluorescence values for ambient P-DNA samples, FP2 are fluorescence values for heated–cooled P-DNA samples, α is the coefficient for SC DNA in ambient and heated–cooled P-DNA, β is the coefficient for OC and linear DNA in ambient P-DNA and δ is the coefficient for OC and linear DNA in heated–cooled P-DNA samples (ssDNA noise). Combining equations 2–4, rearranging and simplifying leads to the following expression for SC%:
SC% = (1 – {[FP1 – FP2]/[(–δ + β)XPT]}) × 100 5
The solution of equation 5 requires the values of coefficients δ and β. These were obtained experimentally from data from the O-DNA sample. Fluorescence values obtained for the O-DNA sample (Fig. 4B) may be expressed as:
FO1 = βXOO 6
FO2 = δXOO 7
where FO1 are fluorescence values for ambient samples, FO2 are fluorescence values for heated–cooled samples and XOO is the amount of OC and linear DNA in the O-DNA sample. A ratio δ/β = 0.2 was obtained from the slopes of the plot of fluorescence against DNA mass shown in Figure 4B. Replacing δ in equation 5 gives:
SC% = [1 – (FP1 – FP2)/(0.8β XPT)] × 100 8
The SC content for the different dilution points of the P-DNA sample was calculated by substituting into equation 8 a value for the coefficient β obtained from the slope of the regression line shown in Figure 4B and the corresponding total mass of plasmid DNA (XPT). The average SC% was found to be 89 ± 2 (n = 9), which agrees well with the value of 95 ± 19% obtained from densitometric scanning of an agarose gel, given the uncertainty associated with the experimental technique.
Linear range for samples containing a 6.9 kb plasmid
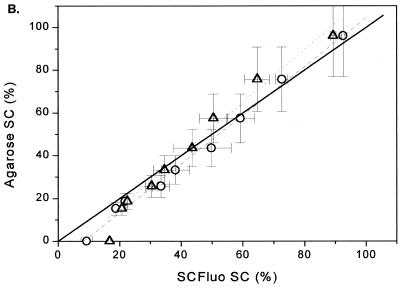
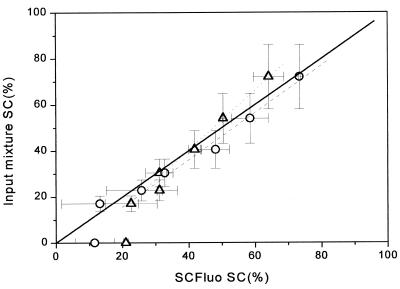
In order to evaluate the limits of the linear range of the SCFluo method for samples with decreasing supercoiled content, P-DNA and O-DNA preparations were mixed at different ratios producing samples ranging from <5 to 95% SC DNA. An aliquot from each mixture was directly loaded onto an agarose gel (Fig. 5A). Another aliquot was diluted in 2 ml of TE buffer to a final dsDNA concentration of 200 ng ml–1 and treated as depicted in Figure 3. To verify equation 8, a correlation plot was constructed between the SC% obtained from densitometric scanning of an agarose gel (Fig. 5A) and the SC% obtained by substitution of fluorescence values into equation 8. The plot, shown in Figure 5B, indicates a good correlation between the two methods (slope of 0.87, r2 = 0.99).
Figure 5.
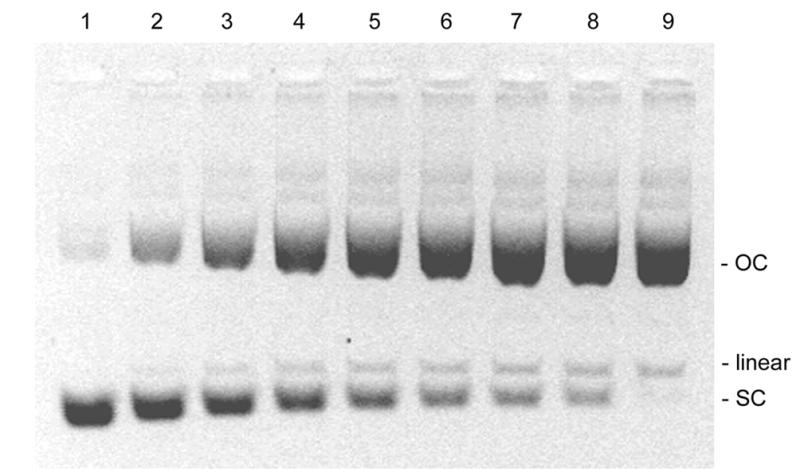
(A) Agarose gel electrophoresis of pSVβ preparations containing decreasing amounts of SC DNA and increasing amounts of OC and linear DNA prepared by serial dilution of P-DNA into O-DNA. Lanes 1–9, mixtures of P-DNA:O-DNA in the ratios 1:0, 0.75:0.25, 0.56:0.44, 0.42:0.58, 0.32:0.68, 0.24:0.76, 0.18:0.82, 0.13:0.87 and 0:1, respectively. (B) Correlation analysis between the SC% obtained from densitometric scanning of the agarose gel and the SC% obtained from substituting values from the SCFluo method into equations 8 (circles) and 9 (triangles). Solid line, theoretical ideal correlation; dashed line, linear regression (y = 0.87x + 8.33, r2 = 0.99) obtained by substituting all values (n = 9) in equation 8; dotted line, linear regression (y = 0.81x + 7.42, r2 = 0.99) obtained by substituting in equation 9 values for samples with >20% SC (n = 7). Values shown depict means of at least two determinations; x error bars, standard deviation; y error bars, coefficient of variation of 20% associated with the agarose gel electrophoresis technique.
Estimation of SC content using an approximate solution
Examination of experimental data suggested that SC content could also be estimated by a first degree approximation by substituting fluorescence data from the SCFluo method into:
SC% ≈ FP2/FP1) × 100 9
where the fluorescence signal from each heated–cooled aliquot is normalised to the corresponding ambient control. To validate the use of equation 9 to estimate the SC content of a sample, a correlation plot was constructed between the SC% obtained from densitometric scanning of an agarose gel (Fig. 5A) and the SC% obtained from substituting fluorescence values into equation 9. The plot reveals a correlation coefficient of 0.99 and a slope of 0.81 for preparations with a supercoiled content >20% (Fig. 5B), suggesting that under the prevailing conditions the relative increase in the value of the coefficient β in relation to the value of the coefficient α (equation 3) tends to compensate for the contribution of ssDNA noise signal (term δXPO in equation 4). For preparations containing <20% SC, the correlation decreased (Fig. 5B), giving values greater than those expected; this is probably due to an increase in the ssDNA noise signal to dsDNA signal ratio.
The stability of the fluorescence signal over time was evaluated by incubation of the samples for 5, 30, 60, 90 and 120 min after addition of the PicoGreen reagent. Although raw fluorescence values tended to increase slightly over time, the SC% calculated using equation 9 remained constant with an average error of <1.4%.
In an attempt to further simplify the SCFluo method, a series of experiments were performed using a single aliquot of each preparation. After measuring ambient fluorescence, the same aliquot (containing PicoGreen) was heated–cooled and fluorescence was measured again. Heating O-DNA at 95°C for 5, 10 or 20 min in the presence of PicoGreen did not produce the expected decrease in fluorescence signal (data not shown). This result suggested that the reagent bound to the DNA stabilised the plasmid structure in such a way that it could not undergo denaturation even after 20 min at 95°C.
Linear range for samples containing a 20 kb plasmid
In order to determine if the SCFluo method could be used for larger plasmids, similar experiments to those described above were performed using a 20 kb plasmid. P-DNA of pQR150 was obtained from a 5 l batch fermentation and subsequent anion exchange purification. Agarose gel electrophoresis analysis indicated that this P-DNA preparation of pQR150 had a SC content of 72 ± 14%. For an O-DNA preparation of pQR150 no SC bands were detected when 350 ng DNA were loaded in the gel. Therefore a SC content <5% was considered in this case (data not shown).
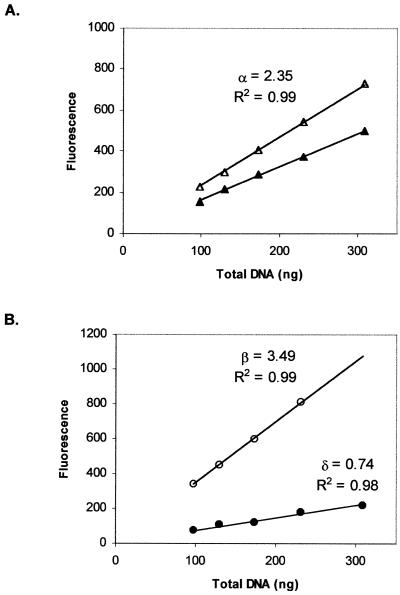
P-DNA and O-DNA preparations were diluted from 300 to 94 ng ml–1 in 2 ml TE buffer to carry out a fluorescence assay. Results for ambient and heated–cooled aliquots for each dilution point of these preparations are shown in Figure 6. Fluorescence enhancement for ambient O-DNA samples was higher than for P-DNA samples of the same DNA concentration (Fig. 6A and B, open symbols). Linear regression analysis obtained for fluorescence values from ambient and heated–cooled O-DNA aliquots (Fig. 6B) indicated that the ratio δ/β was equal to 0.2, which is identical to the value obtained for the 6.9 kb plasmid (Fig. 4B). The SC% obtained by substituting fluorescence values for the different dilution points of pQR150 P-DNA into equation 8 was 74.5 ± 1.6% (n = 5). Substitution into equation 9 resulted in a SC content estimation of 69.5 ± 1.7% (n = 5). Both values agree well with the value of 72 ± 14% estimated from densitometric scanning of the agarose gel.
Figure 6.
Fluorescence enhancement of the PicoGreen reagent upon binding to different concentrations of P-DNA (A) or O-DNA (B) preparations of pQR150. Ambient (open symbols) and heated (95°C)–cooled (closed symbols) aliquots were obtained as described (Materials and Methods).
In order to evaluate the limits of the linear range of the SCFluo method for the 20 kb plasmid, P-DNA and O-DNA preparations of pQR150 were mixed at different ratios producing samples with a supercoiled DNA content ranging from <5 to 72% SC. The mixtures were diluted in 2 ml TE to a final dsDNA concentration of 84 ng ml–1 and assayed as depicted in Figure 3. A correlation plot was constructed between the SC% of the input mixture and the SC% obtained from substituting fluorescence values into equation 8 (Fig. 7). The plot reveals a correlation coefficient of 0.99 and a slope approaching unity. When fluorescence values were substituted into equation 9, a good correlation was obtained for preparations with a supercoiled content >30% (Fig. 7). For preparations containing <30% SC, the correlation decreased (Fig. 7), giving values greater than those expected. For practical purposes equation 9 was chosen to estimate the SC content in all subsequent experiments because it does not require prior knowledge of the concentration of the sample and/or any coefficient.
Figure 7.
Correlation analysis between the SC% of the input mixture and the SC% obtained from substituting values from the SCFluo method into equations 8 (circles) and 9 (triangles). Solid line, theoretical ideal correlation; dashed line, linear regression (y = 0.97x + 3.5, r2 = 0.99) obtained by substituting all values (n = 7) in equation 8; dotted line, linear regression (y = 0.77x + 8.96, r2 = 0.99) obtained by substituting in equation 9 values for samples with >30% SC (n = 4). Values shown depict means of at least two determinations; x error bars, standard deviation; y error bars, coefficient of variation of 20% associated with the agarose gel electrophoresis technique.
Partially purified process samples
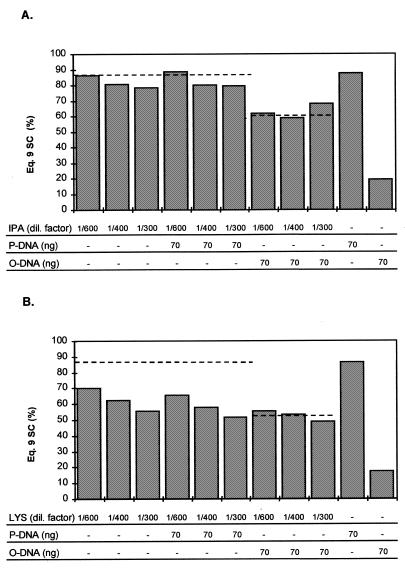
We have previously shown (15) that partially purified preparations such as resuspended isopropanol precipitates or even clarified lysates, if diluted appropriately, can be used for quantitation of total plasmid DNA with the standard PicoGreen assay. The efficacy of the SCFluo method with such preparations was also evaluated using plasmid material obtained from a large-scale culture. A resuspended isopropanol precipitate of pSVβ and a clarified lysate from the same preparation were diluted from 1/300 to 1/600 in either TE buffer or TE buffer containing 70 ng pure pSVβ (P-DNA or O-DNA). The fluorescence assay was performed on these samples together with pure P-DNA and O-DNA controls. As shown in Figure 8A, values for SC content estimated from pure DNA and isopropanol precipitates agree well. Samples spiked with either P-DNA or O-DNA gave the expected fluorescence signals and SC% estimation (Fig. 8A), indicating that there is no interference with the SCFluo method due to impurities characteristic of isopropanol precipitates.
Figure 8.
Efficacy of the SCFluo method when performed on partially purified process samples. A resuspended isopropanol precipitate (A) or a clarified lysate (B) were diluted 1/300–1/600 in TE buffer before carrying out the heating (95°C)–cooling step of the method. Spiked samples were prepared similarly but by dilution in TE buffer containing known amounts of pure P-DNA or O-DNA. Fluorescence values were substituted in equation 9 to estimate SC%. Dashed lines represent the expected SC content. IPA, resuspended isopropanol precipitate; dil, dilution; LYS, clarified lysate.
In contrast, values for SC content obtained from diluted (1/300 and 1/400) clarified lysate samples were 27% lower than expected (Fig. 8B). Spiking experiments with P-DNA showed that the expected fluorescence signal decreased when the heating step of the SCFluo method was performed in the presence of diluted lysate. The decrease was less evident in more diluted samples (1/600) (Fig. 8B), suggesting that the decrease might be due to signal quenching and/or DNA damage caused by impurities present in the clarified lysate. Spiking experiments with O-DNA gave the expected fluorescence signal and SC% estimation (Fig. 8B).
Shear degraded 13 and 20 kb plasmid samples
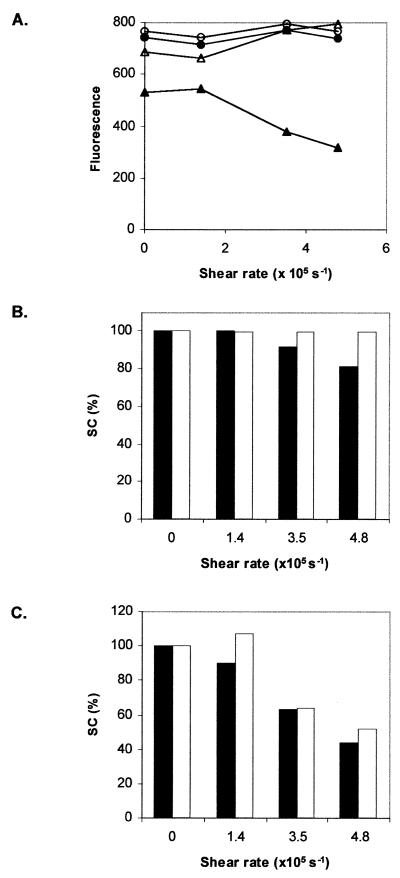
The application of the SCFluo method for plasmid samples that had been subjected to shear forces was evaluated. Clarified lysates containing plasmid pQR186 or pQR150 were subjected to shear rates between 1.4 and 4.8 × 10⁵ s–1; shear rates above 1.4 × 10⁵ s–1 have been shown to damage pQR150 but not pQR186 (6). Resuspended isopropanol precipitates of these samples were diluted to 200 ng ml–1 in TE buffer and used to perform a SCFluo assay. The results are plotted in Figure 9A as fluorescence signal against shear rate for both plasmids. Ambient samples of pQR186 show steady fluorescence values with increasing shear rate. In contrast, fluorescence values for ambient samples of pQR150 increase for shear rates above 1.4 × 10⁵ s–1.
Figure 9.
Efficacy of the SCFluo method when performed on sheared plasmid samples. (A) Fluorescence of ambient (open symbols) and heated (95°C)–cooled (closed symbols) aliquots of pQR186 (circles) and pQR150 (triangles) samples as a function of shear rate. (B and C) Comparison of SC% obtained from densitometric scanning of an agarose gel (closed bars) and the SC% derived from equation 9 (open bars) for pQR186 and pQR150, respectively.
Fluorescence values shown in Figure 9A were substituted into equation 9 to estimate the SC content of the sheared samples and the results are shown in Figure 9B and C. These results were compared with those obtained from agarose gel electrophoresis for pQR186 (Fig. 9B) and pQR150 (Fig. 9C). In Figure 9B and C the SC content of non-sheared (control) samples was normalised to 100 and the SC content for sheared samples was expressed as a percentage of this value. The comparison shows that SC% derived by both methods agree well for the two plasmids studied.
CONCLUSIONS
In the present paper we describe a novel fluorescence-based method that provides rapid quantitative information on the SC content of plasmid solutions. For samples with a SC content >20–30% good regression fits were obtained when values derived from densitometric scanning of an agarose gel and those derived from the method were compared (Figs 5 and 7). For samples with a SC content <20–30% the correlation decreased in the direction of too great a response. Nevertheless, accurate quantitation of SC content >50% appears to be adequate for monitoring plasmid quality for pharmaceutical applications. For this purpose, normalising the fluorescence signal from each heated–cooled aliquot to the corresponding ambient control would rapidly indicate if the SC% has fallen below regulatory specifications.
In the present study the SCFluo method was used successfully to estimate SC content in chemically degraded and sheared plasmid samples from either pure or partially purified preparations (Figs 5 and 7–9). The method is simple to perform manually, takes less than 15 min and requires small amounts of sample. The method would be amenable to high throughput automation or semi-automation using well-established microwell technology combined with appropriate thermocyclers and fluorescence readers. The use of microplates would permit a decrease in the amount of sample and reagent required, with a corresponding reduction in costs. In fact, the development of microplate-based assays using PicoGreen to quantify dsDNA pre- and post-PCR has recently been reported (16).
Since the SCFluo method is based on well-documented properties of DNA, its use is not limited to the application described in the present study but could be used generically in a wide range of applications involving circular DNAs. For example, to quickly evaluate endonuclease and DNA-modifying enzyme activities, mutagenesis, photodamage and photoprotection.
Acknowledgments
ACKNOWLEDGEMENTS
The authors are grateful to Prof. Peter Dunnill (Director, Advanced Centre for Biochemical Engineering, Department of Biochemical Engineering, UCL) and to Dr John Ward (Department of Biochemistry and Molecular Biology, UCL) for their helpful advice on experimental work and their critical reading of the manuscript. The support of the Biotechnology and Biological Sciences Research Council is also gratefully acknowledged.
REFERENCES
- 1.USFDA (1996) Hum. Gene Ther., 7, 1181–1190. [DOI] [PubMed] [Google Scholar]
- 2.Middaugh C.R., Evans,R.K., Montgomery,D.L. and Casimiro,D.R. (1998) J. Pharm. Sci., 87, 131–146. [DOI] [PubMed] [Google Scholar]
- 3.Horn N.A., Meek,J.A., Budahazi,G. and Marquet,M. (1995) Hum. Gene Ther., 6, 565–573. [DOI] [PubMed] [Google Scholar]
- 4.Levy M.S., O’Kennedy,R.D., Shamlou,P.A. and Dunnill,P. (2000) Trends Biotechnol., in press. [DOI] [PubMed] [Google Scholar]
- 5.Volkin D.B., Evans,R.K. and Bruner,M. (1997) International patent no. WO 97/40839.
- 6.Levy M.S., Collins,I.J., Yim,S.S., Ward,J.M., Titchener-Hooker,N., Ayazi Shamlou,P. and Dunnill P. (1999) Bioprocess Eng., 20, 1, 7–13. [Google Scholar]
- 7.Levy M.S., Ciccolini,L.A.S., Yim,S.S., Tsai,J.T., Titchener-Hooker,N., Ayazi Shamlou,P. and Dunnill,P. (1999) Chem. Eng. Sci., 54, 3171–3178. [Google Scholar]
- 8.Ando S., Putman,D., Pack,D.W. and Langer,R. (1999) J. Pharm. Sci., 88, 1, 126–130. [DOI] [PubMed] [Google Scholar]
- 9.Fojta M. and Palecek,M. (1997) Anal. Chim. Acta, 342, 1–12. [Google Scholar]
- 10.Singer V.L., Jones,L.J., Yue,S.T. and Haughland,R.P. (1997) Anal. Biochem., 249, 228–238. [DOI] [PubMed] [Google Scholar]
- 11.Sambrook J., Fritsch,E.F. and Maniatis,T. (1989) Molecular Cloning: A Laboratory Manual, 2nd Edn. Cold Spring Harbor Laboratory Press, Cold Spring Harbor, NY.
- 12.Jackson G., Sherestha,S. and Ward,J.M. (1995) J. Cell. Biochem., S21A, CIA48. [Google Scholar]
- 13.Levy M.S., Collins,I.J., Ward,J.M., Ayazi Shamlou,P. and Dunnill,P. (2000) J. Biotechnol., 76, 197–205. [DOI] [PubMed] [Google Scholar]
- 14.Projan S.J., Carleton,S. and Novick,R.P. (1983) Plasmid, 9, 182–190. [DOI] [PubMed] [Google Scholar]
- 15.Noites I.S., O’Kennedy,R.D., Levy,M.S., Abidi,N. and Keshavarz-Moore,E. (1999) Biotechnol. Bioeng., 66, 195–207. [DOI] [PubMed] [Google Scholar]
- 16.Ahn J.H., Costa,J. and Emanuel,J.R. (1996) Nucleic Acids Res., 24, 2623–2625. [DOI] [PMC free article] [PubMed] [Google Scholar]


