Abstract
We have developed a novel method for real-time monitoring of RNA synthesis in in vitro transcription reactions using fluorescence resonance energy transfer (FRET). Two 15mer DNAs, either of which was labeled with Bodipy493/503 as a donor or Cy5 as an acceptor, were prepared. When the two fluorescent DNAs hybridized to adjacent locations on Xenopus elongation factor 1-α (xelf1-α) RNA, the distance between the two fluorophores became very close, causing FRET to occur and resulting in changes in fluorescence spectra. A high accessibility 30mer site of xelf1-α RNA was found and excess amounts of a pair of donor and acceptor DNA probes that were complementary to the site were added to the in vitro transcription reaction solution. Changes in fluorescence spectra were observed in response to progression of xelf1-α RNA synthesis that showed that the fluorescent probes hybridized to the synthesized RNA. Furthermore, when probes hybridizing to the synthesized xelf1-α RNA with less efficiency were used to monitor the reaction, spectral changes in response to RNA synthesis were also observed. This result suggests that the probes hybridized to synthesizing RNA molecules before they folded to form secondary structure and that there is no need to select sites on the RNA for the probes, which is required for probes hybridizing to folded RNA molecules.
INTRODUCTION
In vitro transcription reactions have been widely used to synthesize RNA for a variety of uses, such as RNA probes for hybridization, in vitro translation reactions and isolation of RNA-binding proteins. In this article we provide a simple and novel method to monitor RNA synthesis in in vitro transcription reactions while the reaction is progressing.
Fluorescence resonance energy transfer (FRET) is the interaction between two kinds of fluorescence molecules (donor and acceptor). The excited state energy of a donor molecule is transferred non-radiatively to an acceptor molecule, resulting in quenching of the donor fluorescence and enhancement of the acceptor fluorescence intensity. FRET occurs when the fluorescence spectrum of the donor and the absorption spectrum of the acceptor overlap and the two fluorophores reside within ~8 nm of each other (1). Since the efficiency of FRET is strongly dependent on the distance between the donor and acceptor (inverse of the sixth power), FRET is a powerful tool for detecting associations of proteins (2) and protein conformational changes (3). Specific sequences in nucleic acids can also be detected using FRET by hybridization of fluorescently labeled oligonucleotides. FRET occurs when a donor-labeled oligonucleotide and an acceptor-labeled complementary oligonucleotide form a hybrid (4,5). Hybridization of two fluorescent oligonucleotides to an adjacent nucleic acid sequence also causes FRET (4,6; Fig. 1, inset).
Figure 1.
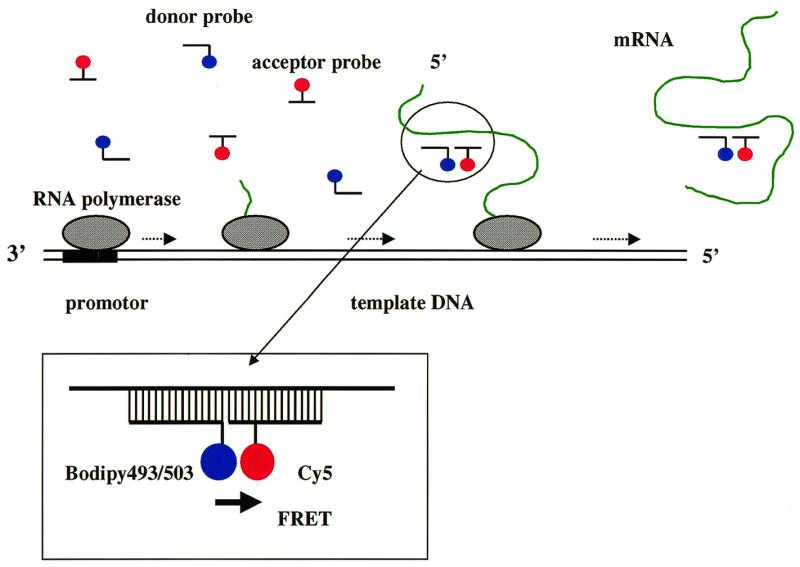
Description of the method presented in this paper for monitoring in vitro transcriptional RNA synthesis. Two fluorescent oligoDNAs are prepared, each labeled with a fluorescent molecule different from the other (donor probe and acceptor probe). When the two oligoDNA probes hybridize to an adjacent sequence on the target RNA, FRET occurs (inset). Excess amounts of two fluorescent oligoDNA probes complementary to a site in the synthesized RNA are added to the in vitro transcription reaction solution and the reaction carried out. Fluorescent probes hybridize to the synthesizing RNA molecules while the reaction is progressing. When a hybrid with a donor probe, an acceptor probe and an RNA molecule is formed, FRET occurs and the hybrid emits a distinctive fluorescence signal in the presence of other non-hybridizing probes.
We recently showed that FRET caused by hybridization of two fluorescent oligonucleotides to an adjacent location on the target RNA can be detected efficiently using a combination of Bodipy493/503 and Cy5 as donor and acceptor (Fig. 1, inset). We also showed that accessibility of human c-fos RNA to oligonucleotides can be examined by measuring fluorescence spectral changes by adding c-fos RNA to a pair of donor- and acceptor-labeled oligonucleotides (7). The secondary structure of c-fos RNA was simulated and several 40mer sites were selected on the predicted structure. Each site was divided into two halves and labeled with donor or acceptor, respectively. The two fluorescent oligonucleotides were mixed at a molar ratio of 1:1 and used as a probe pair. The probe pairs for each site and c-fos RNA were mixed in solution and fluorescence spectra were measured. The spectra changed in response to hybrid formation causing FRET and suitable sites were selected by spectral changes. We then microinjected a probe pair for a highly accessible site into cells expressing c-fos mRNA and hybridization of the probes to the c-fos mRNA in the cytoplasm of a living cell was observed under a fluorescence microscope (7).
In this study we applied the above method to monitor synthesis of Xenopus elongation factor 1-α (xelf1-α) RNA in in vitro transcription reactions (Fig. 1). High accessibility 30mer sites of xelf1-α RNA to oligonucleotides were determined and two fluorescent 15mer DNAs that were complementary to the site were added to the in vitro transcription reaction solution to synthesize xelf1-α RNA and the reaction started. When the reactions were carried out in the presence of excess amounts of oligoDNA probes, changes in fluorescence spectra caused by FRET occurred in response to the progression of RNA synthesis, which showed that the fluorescent probes hybridized to synthesizing xelf1-α RNA. Furthermore, when probes hybridizing to synthesized xelf1-α RNA with less efficiency were used to monitor the reaction, almost identical spectral changes in response to RNA synthesis were observed. This result suggests that the probes hybridized to synthesizing RNA molecules before folding to form the secondary structure.
MATERIALS AND METHODS
Oligonucleotides
Oligodeoxynucleotides (oligoDNA), Bodipy493/503-labeled oligoDNAs and 30mer RNA were obtained from TaKaRa (Ohtsu, Japan). Bodipy493/503 (Molecular Probes, Eugene, OR) was conjugated at the 5′-end via a TFAc hexanolamine linker (Perkin Elmer, Applied Biosystems Division). OligoDNAs were dissolved in diethyl pyrocarbonate (DEPC)-treated water.
For labeling oligoDNAs with Cy5, oligoDNAs containing Uni-Link AminoModifier (Clontech) at a position 4 nt from the 3′-end were obtained from TaKaRa. To label the oligoDNA with Cy5, FluoroLink Cy5 Mono Reactive Dye (Amersham Pharmacia Biotech) was dissolved in 100 µl of sterilized water and mixed with oligoDNA in 200 µl of 0.5 M sodium bicarbonate buffer, pH 9.0, and made to react overnight. The reaction mixture was applied to a reverse phase Capcell PakC18 (6 × 250 mm) HPLC column (Shiseido, Tokyo, Japan). The samples were eluted with a linear gradient of 15.5–33.5% CH3CN in 0.05 M triethylammonium acetate at a flow rate of 1 ml/min at 40°C. The peak fraction at 25–30 min was recovered and lyophilized (Cy5-conjugated oligoDNA). Before use, the lyophilized Cy5-conjugated oligoDNA was dissolved in DEPC-treated water and absorbance at 260 and 649 nm was measured. The labeling yield (molar ratio of Cy5 to oligoDNA) was 0.9–1.0. The sequence of each oligoDNA was as follows: 5′-(Bodipy493/503)-AGCCTTTTCCCATCTC-3′, complementary to the 184–199 sequence of xelf1-α RNA; 5′-AGGCATACTTG(Cy5)AAGG-3′, complementary to the 200–214 sequence; 5′-(Bodipy493/503)-TCTTGATGTATGTGC-3′, complementary to the 566–580 sequence; 5′-GGTTGTAACCA(Cy5)ATCT-3′, complementary to the 581–595 sequence; 5′-(Bodipy493/503)-TTAAACTCTGATGGCC-3′, complementary to the 1504–1519 sequence; 5′-ACCAGTCTTTT(Cy5)ACTA-3′, complementary to the 1520–1534 sequence; 5′-(Bodipy493/503)-AGTACCAGTGATCAT-3′, complementary to the 346–360 sequence; 5′-ACAGTCAGCCT(Cy5)GAGA-3′, complementary to the 361–375 sequence; 5′-(Bodipy493/503)-ACAGGGGCAAAGGTA-3′, complementary to the 876–890 sequence; 5′-TCAGTTGTTAC(Cy5)ATTA-3′, complementary to the 891–905 sequence. The sequence of the 30mer RNA having the same sequence as the 566–595 site of xelf1-α RNA was 5′-GCACAUACAUCAAGAAGAUUGGUUACAACC-3′.
Template DNA for in vitro transcription reactions
A linearized plasmid DNA containing the xelf1-α gene, TRIPLEscriptXef, was obtained from Ambion (Austin, TX). About 1.8 kb of xelf1-α DNA was cut off by digesting TRIPLEscriptXef DNA with EcoRI. The EcoRI fragment was inserted downstream of a T3 promoter on pBluescript II KS+ (Strategene, La Jolla, CA) to produce a 4.76 kb plasmid containing the xelf1-α cDNA (pBlueXelf1). pBlueXelf1 was treated with SmaI to produce a linearized plasmid, which was used as template for in vitro transcription reactions to synthesize a full-length xelf1-α RNA.
To obtain a partial length xelf1-α cDNA template deleted 0.96 kb from the 3′-end, pBlueXelf1 was digested with PstI. The product was applied to a low melting point agarose gel, electrophoresed and a band of 3.8 kb on the gel picked up. This was treated with T4 DNA polymerase to produce a blunt end and used as template. For a template to synthesize human c-fos RNA, a pSPT plasmid containing human c-fos cDNA (pSPT-cfos) obtained from the Riken Gene Bank was treated with EcoRI to cut off the c-fos DNA (2.1 kb) and the c-fos DNA fragment was inserted into the EcoRI site of pBluescriptII KS(+). The plasmid containing c-fos cDNA (pBluescript-cfos) was treated with SmaI to produce a linearized plasmid and used as template. SmaI, EcoRI and PstI were obtained from TaKaRa.
Simulation of the secondary structure of xelf1-α RNA
The sequence of xelf1-α RNA used for the simulation was GenBank accession no. M25504. Simulation of the secondary structure of xelf1-α RNA was performed using DNasis software (Hitachi Softair Engineering).
Monitoring of in vitro transcription reactions
In the in vitro transcription reaction experiments in the present study, the in vitro transcription reaction kit T3 MEGAscript (Ambion) was used. Bodipy493/503-labeled oligoDNA (donor probe) and Cy5-labeled oligoDNA (acceptor probe) were mixed at a molar ratio of 1:1 and used as a probe pair. An aliquot of 135 µl of in vitro transcription reaction solution contained 1 pmol of the template DNA and 200–1200 pmol of the pair of fluorescently labeled oligoDNAs. The reaction was initiated by adding 15 µl of T3 RNA polymerase at 37°C. Fluorescence spectra of the reaction solution were measured at appropriate times. For estimation of amounts of synthesized RNA, an aliquot (10 µl) was removed from the reaction solution at the appropriate time. Then, 0.5 µl of DNase I (2 U/µl) was added and incubated for 15 min at 37°C to digest the template DNA. After 20 µl of 0.52 M ammonium acetate, 0.01 M EDTA was added, the synthesized RNA was extracted with phenol/chloroform followed by chloroform and precipitated with isopropyl alcohol. The precipitation was dissolved in 20 µl of RNase-free distilled water. After addition of 480 µl of 1× SSC, absorbance at 260 nm was measured. Synthesis of the RNA was confirmed by 1% agarose gel electrophoresis. The amounts of RNA were estimated from the absorbance at 260 nm, taking 1 absorbance unit as equivalent to 40 µg. 622 800 was used for the molecular weight of xelf1-α RNA.
Fluorescence spectra
Fluorescence spectra were measured using a Hitachi F-4500 fluorescence spectrophotometer.
RESULTS AND DISCUSSION
Detection of RNA having a specific sequence using two fluorescent oligoDNAs
The secondary structure of xelf1-α RNA was simulated. In the predicted structure, three 30mer sites which contained a loop structure (184–214, 566–595, and 1504–1534) and two 30mer sites which had a stem structure (346–375 and 876–905) were selected. Each site was divided into two 15mer parts and a 15mer DNA having a complementary sequence to each part was prepared. One 15mer DNA was labeled at the 5′-end with Bodipy493/503 and another at a position 4 nt from the 3′-end with Cy5. When the labeling positions of the fluorophores on the probes were as above, the two fluorophores were separated by 4 nt on the hybrid formed with two fluorescent 15mer probes and target nucleic acids containing the 30mer sequence. The Bodipy493/503-labeled 15mer DNA and the Cy5-labeled 15mer DNA were mixed at a molar ratio of 1:1 and used as a probe pair to detect the complementary site. We used a combination of Bodipy493/503 and Cy5 as donor and acceptor (7). This combination has several advantages for observing fluorescence spectral changes caused by FRET. The fluorescences from Bodipy493/503 and Cy5 are completely separated and excitation of Cy5 caused by absorption of the excitation wavelength for Bodipy493/503 is negligible. Although the overlap between the fluorescence spectrum of Bodipy493/503 and the absorption spectrum of Cy5 is small, the distance between the two fluorophores on the double strand of the hybrid formed becomes close and FRET then occurs efficiently. The efficiency of FRET on the hybrid formed is dependent on the number of nucleotides that separates the two fluorophores; 2–4 nt are preferable (7).
To observe changes in fluorescence spectra by hybrid formation, 30mer RNA which had the same sequence as the 184–214 site of xelf1-α RNA was prepared. Figure 2A shows changes in fluorescence spectra which occurred by adding 30mer RNA to the pair of fluorescently labeled oligoDNA probes for the 184–214 site. In the spectrum of the probes (a), a strong Bodipy493/503 fluorescence peak at 514 nm and a very weak Cy5 fluorescence peak at 670 nm were observed. When the target 30mer RNA was added, quenching of the Bodipy493/503 fluorescence and enhancement of the Cy5 fluorescence occurred, as shown in Tsuji et al. (7). As more of the target RNA was added, the fluorescence spectra showed larger changes. The ratio of fluorescence intensity at 670 and 514 nm of the spectrum (I670 nm/I514 nm) was plotted against the molar ratio of RNA to probes (Fig. 2B). At a molar ratio of 1:1, the ratio of fluorescence intensity was 0.98. The ratio of fluorescence intensity of the hybrid purified by HPLC was about 2.0 when the two fluorophores were separated by 4 nt on the hybrid (7). Thus, Figure 2B shows that most of the fluorescently labeled 15mer DNA hybridized to the target 30mer RNA at room temperature. Figure 2B is a calibration curve showing the relation between I670 nm/I514 nm of the spectra and the molar ratios of the target RNA to a pair of 15mer DNA probes at room temperature, when the site of the target RNA is accessible. Figure 2 shows that the relationship between I670 nm/I514 nm on spectra and the amounts of RNA is not linear, particularly in the region where molar ratios of RNA to probes are larger than 0.75 and the corresponding I670 nm/I514 nm values are larger than 0.4. However, in the experimental results below the I670 nm/I514 nm values were within 0–0.4, where the relationship between the spectral parameter and amount of RNA is approximately linear.
Figure 2.
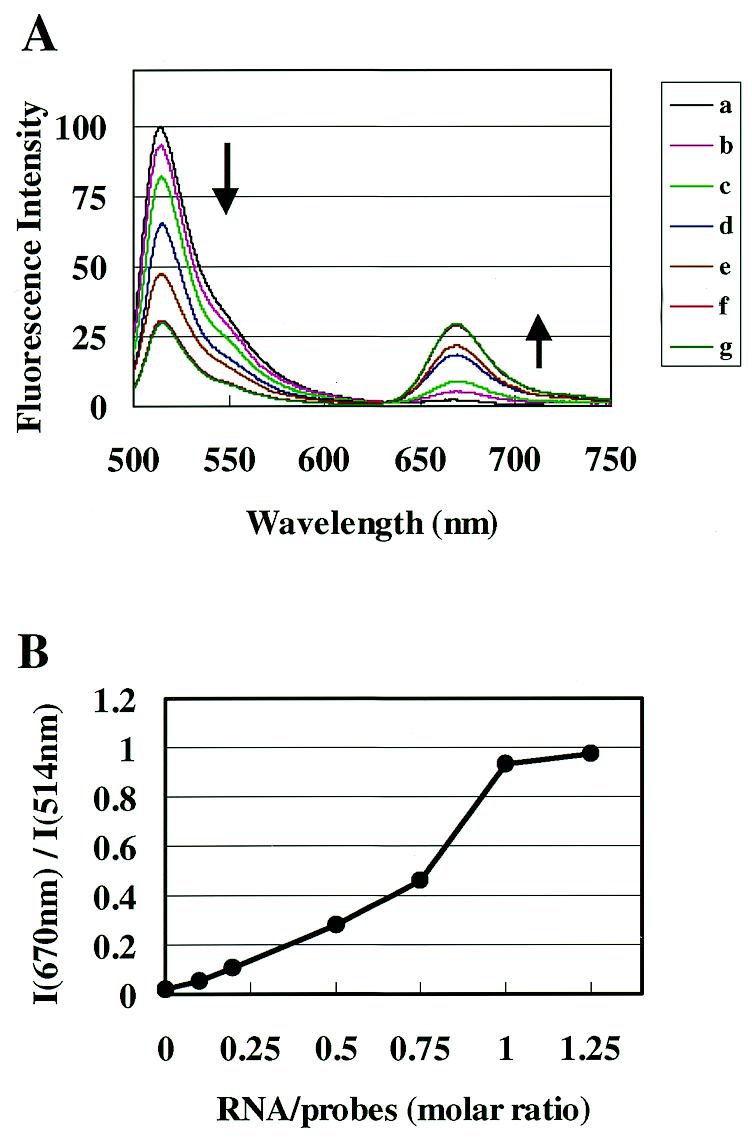
Fluorescence spectral changes caused by hybrid formation. (A) Bodipy493/503-labeled 15mer DNA having a complementary sequence to the 566–580 site of xelf1-α RNA and Cy5-labeled 15mer DNA having a complementary sequence to the 581–595 site were mixed at a molar ratio of 1:1 in 1× SSC solution (final concentration 1 µM). The fluorescence spectrum was measured (a) with excitation at 490 nm. A 30mer RNA having the same sequence as the 566–591 site of xelf1-α RNA was added to the probe solution at molar ratios of RNA to probe of 0.1 (b), 0.2 (c), 0.5 (d), 0.75 (e), 1.0 (f) and 1.25 (g). (B) Ratios of fluorescence intensity at 670 nm (fluorescence of Cy5) and 514 nm (fluorescence of Bodipy493/503) of the spectra in (A) were plotted against molar ratios of RNA to probes.
OligoDNAs for different sites hybridized to folded xelf1-α RNA with different efficiency
Changes in fluorescence spectra by adding xelf1-α RNA to the various probe pairs for various specific sites were measured. Figure 3A shows the fluorescence spectra when xelf1-α RNA synthesized by in vitro transcription reactions was added to the probe pairs at a molar ratio of 1:1. The degree of change in the fluorescence spectra varied with the probes used (Fig. 3B). The I670 nm/I514 nm value was 0.49 when the probes for the 566–595 site were used and 0.10 when the probes for the 346–375 site were used. The I670 nm/I514 nm values for all five probe pairs used were lower than that when the 30mer RNA was used as the target nucleic acid. The probes for the site containing a loop structure (184–214, 566–595 and 1504–1534) caused larger changes than the probes for a stem site (346–375 and 876–905). These different values probably represent differences between accessibility of xelf1-α RNA to the pair of 15mer DNAs for various sites.
Figure 3.
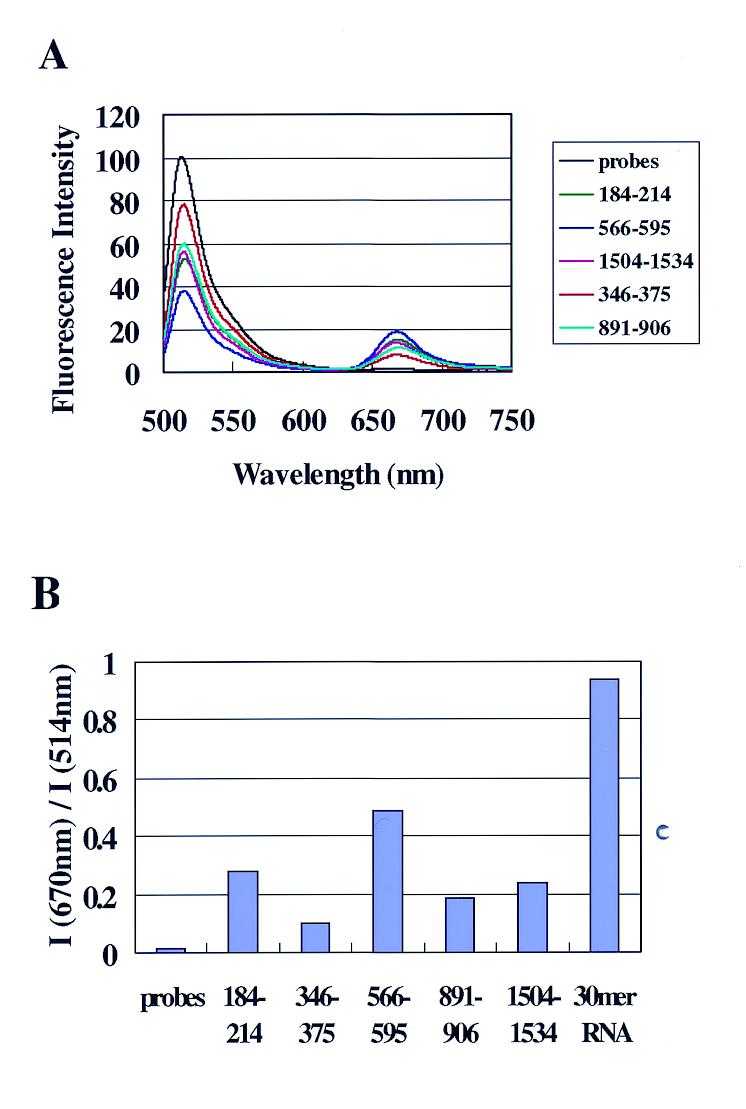
OligoDNAs for different sites hybridize to xelf1-α RNA with different efficiency. (A) Fluorescence spectra of the mixture of xelf1-α RNA and a probe pair for each site at a molar ratio of 1:1. For each specific 30mer site of xelf1-α RNA, a probe pair (Bodipy493/503-labeled 15mer DNA and Cy5-labeled 15mer DNA) was prepared. The fluorescence spectra of the five kinds of probe pairs were the same and only one spectrum (probes for the 184–213 site) is shown. (B) Ratios of fluorescence intensity at 670 and 514 nm (I670 nm/I514 nm) of the spectra in (A). The I670 nm/I514 nm value of a mixture of the probe pair for 184–214 and the 30mer complementary RNA (Fig. 2) is also shown (30mer RNA).
Monitoring of RNA synthesis in in vitro transcription reactions
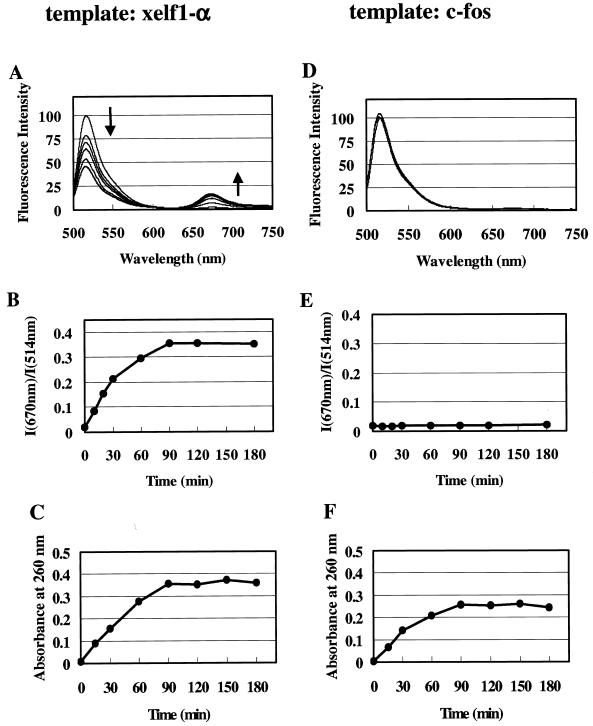
The pair of fluorescent probes for the 566–595 site was added to an in vitro transcription reaction solution and the reaction carried out. Excess amounts (600-fold) of the probes to the template cDNA were added. Figure 4A shows changes in fluorescence spectra during the reaction. The ratio of fluorescence intensity (I670 nm/I514 nm) increased for 90 min; no further changes occurred after 90 min (Fig. 4B). Synthesis of xelf1-α RNA at appropriate times was estimated using absorbance at 260 nm after an aliquot of reaction solution was removed and RNA was extracted with phenol/chloroform and chloroform (Fig. 4C). RNA synthesis was terminated at ~90 min after starting the reaction. The time course of changes in fluorescence spectra was almost the same as that of RNA synthesis. The amounts of synthesized RNA and the time course of the reaction were not affected by the addition of fluorescent oligoDNA probes (data not shown). As a control experiment, a vector containing c-fos cDNA instead of xelf1-α cDNA was used as template DNA. No change in fluorescence spectra was observed (Fig. 4D and E), although synthesis of c-fos RNA occurred, as in the case of xelf1-α RNA (Fig. 4F).
Figure 4.
Monitoring of in vitro transcription reactions by fluorescence spectral changes. (A–C) A 600-fold excess of the probe pair for the 566–585 site of the xelf1-α RNA was added to the in vitro transcription reaction solution and the reaction carried out. A vector containing xelf1-α cDNA was used as template. (A) Changes in fluorescence spectra during the reaction. Fluorescence spectra at 0, 10, 20, 30, 60, 90, 120 and 180 min are shown. (B) Ratios of fluorescence intensity (I670 nm/I514 nm) of the spectra in (A) plotted against incubation time. (C) Time course of xelf1-α RNA synthesis. At each incubation time an aliquot was removed from the reaction solution and the synthesized RNA extracted. The amounts of RNA were estimated by taking 1 absorbance unit at 260 nm as equivalent to 35 µg. (D–F) In vitro transcription reactions were carried out as described in (A)–(C) using a vector containing human c-fos cDNA instead of the vector containing xelf1-α cDNA as template. (D) Changes in fluorescence spectra during the reaction. Fluorescence spectra at 0, 30, 60 and 180 min are shown. (E) Ratios of fluorescence intensity (I670 nm/I514 nm) of spectra in (D) plotted against incubation time. (F) Time course of c-fos RNA synthesis.
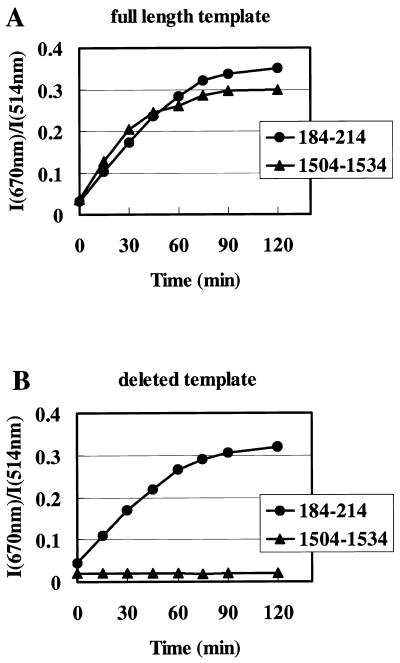
We also performed in vitro transcription reactions using the probes for the 184–214 and 1504–1534 sites, respectively. In Figure 5A, the ratios of fluorescence intensity of the spectra (I670 nm/I514 nm) were plotted against the incubation time. Almost the same results were obtained as those using the probes for the 566–595 site when both the probe pairs for the 184–214 and 1504–1534 sites were used (Fig. 4A). We prepared a template containing a partial length of xelf1-α cDNA, which was deleted of 0.96 kb from the 3′-end. In this template there was no 1504–1533 site on the synthesized RNA. Using this template, in vitro transcription reactions were carried out as in Figure 5A. There was no change in fluorescence spectra while RNA synthesis was progressing when the probes for the 1504–1534 site were used, while almost the same spectral changes occured when the probes for the 184–214 site were used (Fig. 5B). These results clearly show that RNA synthesis in in vitro transcription reactions can be monitored by adding probe pairs to reaction solutions and by measuring fluorescence spectral changes.
Figure 5.
Monitoring of in vitro transcription reactions by fluorescence spectral changes using probes for various sites. Two other probe pairs (for the 184–214 and 1504–1534 sites) were used in monitoring experiments as described in Figure 4A–C. Ratios of fluorescence intensity (I670 nm/I514 nm) are plotted against incubation times. (A) The vector containing xelf1-α cDNA was used as template. (B) The vector containing a partial length of xelf1-α cDNA, which was deleted 0.96 kb from the 3′-end, was used as template. Using this template, the synthesized RNA had an ~1.1 kb length (confirmed on agarose gel electrophoresis) and had no site for probes that were complementary to the 1504–1534 site.
OligoDNAs for any sites can hybridize to synthesizing RNA molecules
Fluorescence spectral changes in response to ongoing RNA synthesis were almost the same when any of three kinds of probe pairs for the different sites (184–214, 566–595 and 1504–1534) were used (Figs 4 and 5). There was no difference in I670 nm/I514 nm values using any of the three sites (0.3–0.35), while the I670 nm/I514 nm values were different (0.24–0.49) between these three sites when the probes were added to pre-synthesized RNA (Fig. 3). In addition, when probes for the 346–375 site were used to monitor the reaction, almost the same result was again obtained (data not shown), although this probe did not hybridize efficiently to pre-synthesized RNA (I670 nm/I514 nm value of 0.10) (Fig. 3). It was reported that oligonucleotides hybridized to the regions of the synthesized RNA which were believed to form stem secondary structures when oligonucleotides were added to in vitro transcription reactions (8). These results were interpreted as indicating that oligonucleotides hybridized to the RNA molecules while synthesis was ongoing, before the RNA molecules folded into the mature secondary structure. Oligonucleotides for any site may hybridize to synthesizing RNA molecules. This means that there is no need to select sites on the RNA for oligonucleotide probes when RNA synthesis is monitored by the present method, which requires the probes to hybridize to folded RNA molecules.
Effect of numbers of added probe pairs on monitoring
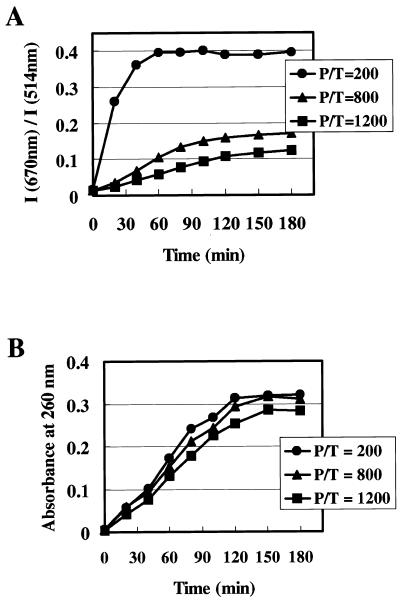
Figure 6 shows the results of monitoring transcription reactions when the amounts of added probe pairs were varied. In all reactions, synthesis of RNA transcripts was carried out for 150 min and the time courses of RNA synthesis estimated by absorbance at 260 nm were the same (Fig. 6B). Changes in fluorescence spectra were different between reactions containing different molar ratios of probes to template (Fig. 6A). Table 1 summarizes the results of Figure 6. The I670 nm/I514 nm values of the spectra represent the ratios of hybridized probe pairs to total probes and are determined by the molar ratios of target RNA to probes in the solutions, as shown in Figure 2. Therefore, we can estimate the number of synthesized RNA molecules from I670 nm/I514 nm values of the spectra. For example, the I670 nm/I514 nm value at 180 min in 800-fold excess probe pairs was 0.17, which indicates that the molar ratio of target RNA to probe pairs in the solution is estimated to be 0.31 using the calibration curve of Figure 2B. The spectrum shows that 248-fold (800 × 0.31) excess RNA over the template was synthesized in 180 min. Table 1 also shows the numbers of RNA molecules synthesized in 180 min estimated by absorbance at 260 nm. About 300-fold excess RNA over template was synthesized in all three reactions. The numbers of RNA molecules estimated from the spectra of 800- and 1200-fold probe pairs were consistent with the numbers of RNA transcripts estimated by absorbance. Also, the time courses of changes in spectra were almost completely superimposed over the time courses for changes in absorbance, indicating that the reactions could be monitored from initiation to termination when 800- to 1200-fold excess probe pairs over template were added to the reaction solutions. Differences in I670 nm/I514 nm values between the 800- and 1200-fold solutions were caused by the presence of different amounts of unhybridized probes. When the same number of RNA transcripts was present, the number of unhybridized probes in the 800-fold solution was smaller than that in the 1200-fold solution, which caused a larger I670 nm/I514 nm value.
Figure 6.
Effects of added amounts of DNA probes on monitoring. Monitoring of in vitro transcription reactions was performed using the probes for the 566–595 site and a vector containing the full-length xelf1-α RNA as template as described in Figure 4A–C. Amounts of probes added to the reaction solutions varied. Molar ratios of probes to template (P/T) were 200, 800 and 1200. (A) Temporal changes in fluorescence spectra. (B) Time course of xelf1-α RNA synthesis.
Table 1. Effect of numbers of probes on monitoring.
| Probe/template molar ratio | Fluorescence spectra | Absorbance | ||
|---|---|---|---|---|
| I670/I514 | Target RNA/probe (molar ratio of hybridizing probes) | Number of hybrids (per template) | Number of transcripts (per template) | |
| 200 | 0.40 | 0.68 | 136 | 309 |
| 800 | 0.17 | 0.31 | 248 | 298 |
| 1200 | 0.12 | 0.22 | 264 | 273 |
The results of Figure 6 are summarized using the values at 180 min. For estimating the number of transcripts from absorbance at 260 nm, 1 absorbance unit was estimated to be equivalent to 40 µg of RNA and 622 800 was used as the molecular weight of xelf1-α RNA.
When 200-fold probe pairs were added to the reaction solution, the number of RNA transcripts exceeded the number of probes at the intermediate stage of the reaction. The number of RNA transcripts at 60 min was estimated by absorbance to be 170-fold over the template. The slight change in fluorescence spectra after 60 min could be caused by the fact that there were few unhybridized probes which could hybridize to newly synthesized RNA molecules. A 600-fold excess of probe pairs over the template would be preferable when the transcription reaction synthesizing 300-fold transcripts is being completely monitored. Under this condition, fluorescence spectra would change in response to ongoing RNA synthesis from initiation of the reaction to termination and the levels of spectral changes would be sufficiently large.
Acknowledgments
ACKNOWLEDGEMENTS
The authors wish to thank Masayo Takayanagi for her excellent technical assistance and Dr Kaname Ishibashi for critical reading of the manuscript.
REFERENCES
- 1.Lakowicz J.R. (1983) Principles of Fluorescence Spectroscopy. Plenum Press, New York, NY.
- 2.Tsien R.Y., Bacskai,B.J. and Adams,S.R. (1993) Trends Cell Biol., 3, 242–245. [DOI] [PubMed] [Google Scholar]
- 3.Miyawaki A., Llopis,J., Heim,R., McCaffery,J.M., Adams,J.A., Ikura,M. and Tsien,T. (1997) Nature, 388, 882–887. [DOI] [PubMed] [Google Scholar]
- 4.Cardullo R.A., Agrawal,S., Flores,C., Zamecnik,P.C. and Wolf,D.E. (1988) Proc. Natl Acad. Sci. USA, 85, 8790–8794. [DOI] [PMC free article] [PubMed] [Google Scholar]
- 5.Sixou S., Szoka,F.C.,Jr, Green,G.A., Giusti,B., Zon,G. and Chin,D.J. (1994) Nucleic Acids Res., 22, 662–668. [DOI] [PMC free article] [PubMed] [Google Scholar]
- 6.Mergny J.-L., Boutorine,A.S., Garestier,T., Belloc,F., Rougee,M., Bulychev,N.V., Koshkin,A.A., Bourson,J., Lebedev,A.V., Valeur,B., Thung,N.T. and Helene,C. (1994) Nucleic Acids Res., 22, 920–928. [DOI] [PMC free article] [PubMed] [Google Scholar]
- 7.Tsuji A., Koshimoto,H., Sato,Y., Hirano,M., Sei-Iida,Y., Kondo,S. and Ishibashi,K. (2000) Biophys. J., 78, in press. [DOI] [PMC free article] [PubMed] [Google Scholar]
- 8.Lu Y., Turner,R.J. and Switzer,R.L. (1996) Proc. Natl Acad. Sci. USA, 93, 14462–14467. [DOI] [PMC free article] [PubMed] [Google Scholar]


