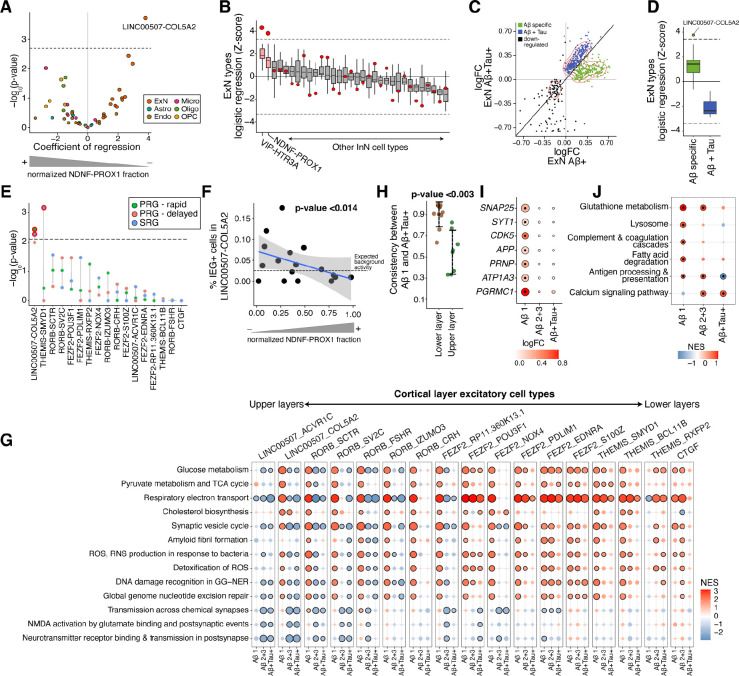
Figure 3. NDNF-PROX1 inhibitory neuron loss is associated with a hyperactivity signature in L2/3 excitatory neurons.
A) Logistic mixed-effect model regression of NDNF-PROX1 proportion versus cell type transcriptional signature in subjects. The dashed horizontal line represents the FDR threshold of 0.05. B) Associations (by logistic mixed-effect model) between the proportion of each inhibitory neuron type with each ExN type’s transcriptional signature in subjects. The red dots indicate the regression Z-score of the LINC00507-COL5A2 neurons with the corresponding inhibitory neuron cell type. The dashed line represents an FDR threshold of 0.05. Center line, median; box limits, upper and lower quartiles; whiskers, 1.5x interquartile range. See Figure S7H for more details. C) Scatter plot comparing the logFC in the ExNs of (x-axis) and samples (y-axis). Visualization is based on the union of top 300 protein-coding DE genes (sorted by jack-knifed p-value) in either group. D) Logistic mixed-effect model regression of NDNF-PROX1 proportion versus early-specific up-regulated DE genes (green dots in C) and up-regulated DE genes shared in both and samples (blue dots in C) for each ExN cell type. The dashed lines represent an FDR threshold of 0.05. Center line, median; box limits, upper and lower quartiles; whiskers, 1.5x interquartile range. E) Logistic mixed-effect model regression of NDNF-PROX1 cell fraction versus expression of neural activity signatures23 in each ExN type in samples (one-sided). The dashed line represents a one-sided FDR threshold of 0.05. PRG, primary response genes; SRG, secondary response genes. F) Scatter plot showing normalized NDNF-PROX1 fraction (x-axis) and the percent of LINC00507-COL5A2 ExNs with high expression of the core immediate early genes FOS, JUNB, ARC, NPAS4, ERG1, and ERG2 (y-axis, Methods) in subjects. A logistic mixed-effect model was used to calculate the p-value. G) GSEA of Reactome pathways on DE results from subjects with varying and tau burdens, across ExN types. Dots outlined in black denote significant terms (FDR-adjusted p-value < 0.05). individuals with burden scores of 2 and 3 are grouped together. H) Concordance of DE genes between different stages of AD pathology within excitatory neuron cell types. The LINC00507+ and RORB+ were selected as upper layer excitatory neurons and FEZF2+, CTGF+, and THEMIS+ populations as lower layer. I) ExN DE genes whose products are involved in synapse vesicle cycle and trafficking (SYT1, SNAP25, and CDK5), amyloid precursor protein (APP), and receptors of oligomeric (PRNP, ATP1A3, and PGRMC1) across different and tau burdens. The outlined dots represent DE genes with jack-knifed FDR-adjusted p-value < 0.01. J) GSEA of human KEGG gene sets using DE genes of WIF1+ homeostatic astrocytes across increasing and tau burden. Outlined dots represent significant terms (FDR-adjusted p-value < 0.1).

