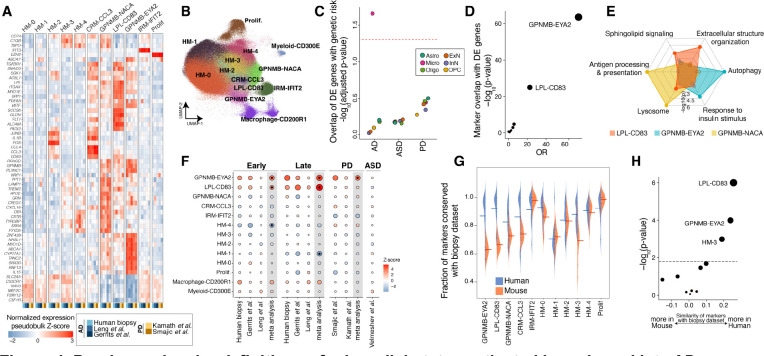
Figure 4. Precise molecular definitions of microglial states activated in early and late AD.
A) Expression of select marker genes (Methods) across human neurodegeneration datasets in the microglia integrative analysis. The expression values represent pseudobulk expression of each marker in each cell state and dataset. B) Uniform manifold approximation and projection (UMAP) representation of microglia profiles from integrative analysis, colored by the 13 identified states. C) Dot plot of −log10-transformed p-values for MAGMA enrichment analysis42 (y-axis) of AD, PD, or ASD genetic risk in the up-regulated DE genes of each cell class. Dots are colored by cell class membership. Dashed line represents an FDR threshold of 0.05. D) Dot plot of −log10-transformed p-values for a Fisher’s exact test assessing the overlap between microglial DE genes with markers of each of the 13 microglial states (Methods). E) Radar plot representation of enriched gene sets in markers of the three GPNMB-LPL states. The marker analysis was conducted by comparing the three cell states against each other. See Table S6 for more details. F) Association of proportion of each microglial state with early and late AD pathology, as well as PD and ASD. In meta-analysis columns, black dots represent microglia states with significant changes in cell state proportions (FDR-adjusted p-value < 0.05). The scale of points is based on the absolute Z-score values. G) Distribution of the fraction of markers shared between the biopsy cohort and each other dataset (y-axis), in each microglial state (x-axis). Datasets are stratified by species. Mean values are denoted with a line. Only genes expressed in more than 1% of cells were considered in the analysis of each dataset. H) Statistical comparison of the differences in (G) by Student’s t-test. The dashed line represents an FDR threshold of 0.05.

