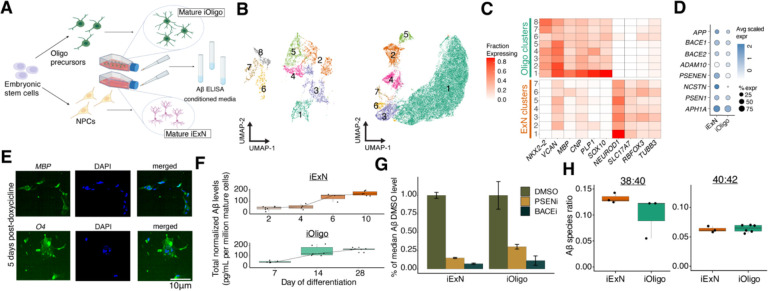
Figure 6. Quantitation of production by human mature oligodendrocytes and excitatory neurons.
A) Schematic of differentiation of ESCs and ELISA-based quantification of from conditioned media. B) Two-dimension UMAP embeddings of single-cell expression profiling for ESC-derived iOligo (left) and iExN (right) cultures. C) Expression of key marker genes in ESC-derived iOligo and iExN cultures. D) Dot plot depicting scaled expression of essential machinery in ESC-derived cultures of iOligos and iExNs. E) Representative images of immunofluorescence stains of O4 and MBP in ESC-derived iOligo cultures five days after doxycycline addition. F) Normalized protein abundance for ESC-derived iExNs (top) and iOligos (bottom) across days of differentiation. Center line, median; box limits, upper and lower quartiles; whiskers, 1.5× interquartile range; points, outliers. G) Fractional abundance of protein levels relative to median protein levels in DMSO condition for PSEN inhibitor-treated and BACE inhibitor-treated conditioned media samples for ESC-derived iOligos and iExNs. Error bars indicate one standard deviation above and below the mean value. H) Ratio of to and to species from conditioned media obtained from ESC-derived cultures of iExNs (left) and iOligos (right). Center line, median; box limits, upper and lower quartiles; whiskers, 1.5× interquartile range; points, outliers.

