

Abstract
Heteroduplex mobility assay (HMA) is a fast and inexpensive method for determining relatedness between DNA sequences. Rapidly evolving viruses such as HIV-1 develop marked sequence differences in their genomes over the course of the epidemic and infection in a single individual. HMA can be used to monitor both processes. Here, we systematically evaluated the influence of single base mismatches on heteroduplex mobility. The impact of mismatches at nine different positions in 559 bp double-stranded DNA molecules, within a background of overall sequence divergence ranging from 1.97 to 9.65%, was evaluated in both non-denaturing and partially-denaturing acrylamide gels. We found that the electrophoretic mobility of heteroduplexes was proportional to the level of mismatch when that level exceeded 4.5%. Overall, mismatches near the center of the fragment and clustered mismatches tended to have an exaggerated influence on the mobility of heteroduplexes. Thus, the use of HMA for quantitative inference of genetic distances under the conditions we describe is of greatest utility at levels of mismatch >5%.
INTRODUCTION
Delwart et al. developed heteroduplex mobility assays (HMA) and heteroduplex tracking assays (HTA) to evaluate viral heterogeneity (1,2) and for genetic typing of HIV-1 (3). An HMA-based HIV-1 genotyping kit (4) has since been used in epidemiological studies of virus representation in different parts of the world (5–8). HMA has also been used to examine quasispecies evolution within an HIV-1 infected individual (2,9) and in the study of HIV transmission (10–12). HMA has found applications in other areas requiring genetic characterization, as illustrated by its use in the study of caprine arthritis-encephalitis (13), influenza (14), feline immunodeficiency (FIV) (15), measles (16), polio (17) and hepatitis C (18,19) viruses, as well as cytochrome b genes (20) and Alagille syndrome (21).
Heteroduplexes are formed when two non-identical but closely related single-stranded DNA fragments anneal. Such molecules will have structural distortions at mismatched base pairs and at unpaired bases, where an insertion or a deletion in the nucleotide sequence has occurred. These structural distortions cause the heteroduplex to migrate more slowly than a homoduplex during acrylamide gel electrophoresis. The extent of this retardation has been shown to be proportional to the degree of divergence between the two sequences (4). The presence of an unpaired base is known to influence the mobility of a heteroduplex more than a mismatched nucleotide (22–26).
The relationship between the mobility of a heteroduplex and divergence between the hybridizing sequences is proportional at levels of mismatch <20–25% when applied to HIV-1 and FIV gene sequences (4,15). Since sequence variants that differ from each other by <5–10% are often encountered within an HIV-1 infected patient, it would be useful to have a method that can reliably assess genetic relatedness among these sequences. The mobility profiles of DNA fragments that differ by a small number of mismatches have not been well characterized. Wilson et al. found a general, but not absolute, correlation between heteroduplex mobility and the number or position of nucleotide substitutions (19). Nelson et al. (27) observed that clustering of mismatches exaggerated the retardation of heteroduplexes.
In the current study, we sought to characterize the mobilities of heteroduplexes formed between closely related sequences, those differing in their DNA sequence by <10%. Since insertions and deletions have a disproportionately greater influence on the mobility of heteroduplexes (3), we restricted our analysis to fragments of identical length, but that differed in the extent of their relatedness. In addition, we attempted to examine how varying the position of a mismatch along the length of the fragment affects heteroduplex mobility.
MATERIALS AND METHODS
We selected a 559-bp region in the HIV-1 envelope gene spanning the C2–V3–C3 domains for analysis (positions 6817–7381 in the prototype HXB2 sequence). The 16 DNA fragments used were selected from among the clones sampled from one HIV-1 infected long-term asymptomatic patient [Pt MA (28)] and from an HMA-based HIV-1 subtyping kit (4). One set of nine sequences, referred to as the ‘core’ pool, was identical except for a single base mismatch unique to each fragment (Fig. 1). Of these nine sequences, eight contained the discriminating mismatch at the following positions: 57 (MA209), 115 (MA202), 150 (MA213), 240 (MA223), 278 (MA204), 322 (MA201), 452 (MA211), 459 (MA203) and 554 (MA206). The unique mismatch at position 554 in MA206 is removed by primer incorporation during PCR amplification, thus heteroduplexes containing MA206 will have slightly reduced sequence differences (1.77, 2.17, 3.35, 4.33, 4.33, 8.27 and 9.45% respectively). The second set of seven sequences, designated the ‘test’ pool, differed from each member of the core group in pairwise nucleotide sequence comparisons by 1.97 (MA21), 2.36 (MA23), 3.54 (MA10), 4.53 (MA6), 4.53 (MA20), 8.46 (B3) and 9.65% (B2). Nucleotide changes were counted and pairwise distance percentages calculated as the number of sequence changes per fragment length, excluding the primers. Each of the mismatches in the core pool was selected to obtain a near-uniform distribution of the mismatches along the length of the molecule as well as not to overlap with any sequence difference with the test pool (Fig. 1). MA6 and MA20 sequences differed from the core sequences by an identical 4.53%. However, they differed from each other at 18 positions.
Figure 1.

Alignment of the 16 DNA sequences used in this study. The 559 bp sequence shown spans the C2–V3–C3 region of the HIV-1 env gene. The core (MA209, MA202, MA213, MA223, MA204, MA201, MA211, MA203 and MA206) and test (MA21, MA23, MA10, MA6, MA20, B3 and B2) groups of sequences are indicated. Individual mismatches characterizing each core sequence are highlighted by a number indicating their position in the alignment and are underlined. The test sequences are arranged according to increasing numbers of mismatches. PCR primer sequences [ED31 (3) and ED33 (3)] are underlined; an arrow shows each end of the alignment. All sequences were compared to core sequence MA209.
For use in HMA, each of the selected DNA sequences were amplified from a plasmid template in PCR reactions using primers ED31 and ED33 (3). Thermal cycling conditions (3) were 94°C for 30 s, 55°C for 30 s and 72°C for 1 min for 35 cycles. Heteroduplexes were generated between a member of the test group and each member of the core group to evaluate the effect of the position of the mismatch upon heteroduplex mobility. For example, when heteroduplexes were formed between each of the nine core sequences and the MA21 test sequence, we evaluated the mobilities of nine heteroduplexes, eight differing by 1.97% but each with a unique mismatch at a varying position.
Heteroduplexes were formed by mixing 5 µl of each PCR product and 1.1 µl of 10× annealing buffer (1 M NaCl, 100 mM Tris, pH 7.8, 20 mM EDTA), denatured in a boiling water bath for 2 min, and rapidly reannealed by cooling on ice for 10 min. The heteroduplexes were resolved on a 5% polyacrylamide gel (30:0.8% acrylamide:bis, BRL-V16 gel apparatus) using a TBE buffer (0.089 M Tris, 0.089 M borate, 2 mM EDTA). Following electrophoresis at 200 V for 3 h, gels were stained with 0.1% ethidium bromide and the fluorescent images captured using a gel documentation system (GelDoc 1000, Bio-Rad Laboratories, Hercules, CA). Images were processed using Photoshop (Adobe Systems, San Jose, CA) and Canvas (Deneba Software, Miami, FL). pGEM DNA Markers (Promega Biotech, Madison, WI) and 1 kb DNA molecular weight marker (Gibco BRL, Bethesda, MD) were run in each gel as standards (400 ng each). The migration of each band from the bottom of the well was measured and a mean Rf for each heteroduplex was calculated. When multiple homoduplex and heteroduplex bands were observed, the mean migration distances were used for comparison.
To enhance differential migration of heteroduplexes and their resolution, we examined migration under partially denaturing conditions. We chose a system containing 10% formamide and 10% ethylene glycol after testing the following combinations: 5% formamide/10% ethylene glycol, 10% formamide/10% ethylene glycol and 20% formamide/10% ethylene glycol (data not shown). These solvents have been shown to accentuate conformational changes by inducing bends in the DNA molecule (29) and hence were expected to enhance the differential migration of heteroduplexes. A 3 cm overlay of non-denaturing gel ensured uniform polymerization of the denaturing gel. This enabled loading all samples at once without denaturants diffusing into the sample and significantly reduced the band smearing that was observed in conventional denaturing gel systems.
RESULTS
The nucleic acid sequence alignment in Figure 1 shows the positions of mismatches in the eight core sequences as well as the mismatches contributing to the differences between core and the test group sequences. Each sequence beginning with the designation ‘MA’ corresponds to a segment of the envelope gene of HIV-1 taken from a single infected individual. The two sequences beginning with the ‘B’ designation were taken from two other HIV-1 infected individuals. As seen in the alignment, mismatches in the core pool of sequences were distributed across the length of the sequence with an average spacing of 62 bases (range 7–150). Differences between core and test sequences resulted from mismatches occurring in clustered sets rather than being uniformly distributed across the fragment, a pattern similar to the developing genetic variation observed within and between HIV-1 infections (30,31).
The migration patterns of heteroduplexes formed between different combinations of DNA fragments are illustrated in Figure 2. The nine lanes within each gel image correspond to heteroduplexes containing a unique mismatch arranged from the 5′ to the 3′ end of the fragment. In most panels, the two heteroduplexes migrate differently, with the exceptions being heteroduplexes formed with MA21 (1.97% divergence) and MA20 (4.53%). Similarly, in most panels, the homoduplexes appear to migrate as one band, with the exception of the B3 (8.27%) and B2 (9.65%) panels. The overall retardation of heteroduplex mobility appears to be greater with increasing sequence divergence as well as with partially denaturing versus native electrophoretic conditions. Within each panel, a few lanes have migration patterns that are different from the rest of the group. For example, heteroduplexes formed with MA223 (position 240) migrate more slowly in the upper four panels (1.97 through 4.53%) as does MA211 (position 452), especially in the panel with 3.54% mismatches. These unique migration patterns become less prominent when tested under partially denaturing conditions. The greatest variation in mobility patterns was observed when core sequences were compared to the B3 sequence (8.46% divergence) under both native and partially denaturing conditions. These relationships were consistent upon repeated analysis.
Figure 2.

Mobility of heteroduplexes in non-denaturing and partially denaturing environments. Each image is an electropherogram of heteroduplexes formed between a test sequence and each of the nine core sequences. The test sequence and degree of sequence mismatch are indicated. Electropherograms on the left are derived from non-denaturing gels and those on the right from a partially denaturing acrylamide gel system containing 10% formamide and 10% ethylene glycol. The numbers at the bottom indicate the position of the mismatch from 5′ to 3′ as illustrated in Figure 1. DNA molecular weight marker fragments are on one or both sides of the images with fragment sizes indicated.
Figure 3 illustrates the mobilities (Rf) of heteroduplexes relative to the position of the mismatch in the core DNA fragment. Few positional effects were noted, with most heteroduplexes within a series migrating with nearly identical mobilities. Exceptions were mismatches at position 322, which had anomalously fast mobilities and with mismatches at positions 278 and 452, which generally had anomalously slow mobilities.
Figure 3.

Relative influence of the position of mismatch on the mobility of heteroduplexes. Rf values were derived from the electropherograms shown in Figure 2. Each line in the panel corresponds to the Rf values derived from nine core sequences in heteroduplex with each of the test sequences as indicated. The points correspond to the position of the mismatch on the linear DNA fragment.
Heteroduplexes between sequences of lower divergence migrated within a narrow range of Rf values, especially under partially denaturing conditions. Overall, heteroduplexes of <5% divergence migrate without a generalizable trend. Among the heteroduplexes with <5% mismatch, there was, if anything, an inverse of the expected relationship between divergence and mobility under native conditions.
The overall relationship between migration of heteroduplexes and the level of mismatches is illustrated in Figure 4. A smooth relationship is most evident under partially denaturing conditions, except for the anomalously fast rate of migration of fragments with 4.53% mismatch (especially MA20). Despite the fact that each fragment was of identical length and displayed identical migration patterns in agarose gels (data not shown), some homoduplex fragments exhibited unique mobilities in polyacrylamide gels (Fig. 5). These differences were in part related to the dissimilarity of sequences. For example, sequences B3 and B2 are divergent from the pool of MA sequences and their migration patterns are also different from those of the MA sequences. Among the pool of MA sequences, MA6 homoduplexes appear to have the fastest mobility while MA20 homoduplexes appear to have the slowest mobility. These differences detract from the ability to determine relatedness among closely related sequences by HMA.
Figure 4.

Relationship between average Rf values and the level of sequence divergence. Rf values depicted in Figure 3 were averaged within each test panel and plotted. A solid line with circle symbols indicates the profile in the non-denaturing gel system; a dotted line with square symbols denotes the profile obtained from a partially denaturing system.
Figure 5.
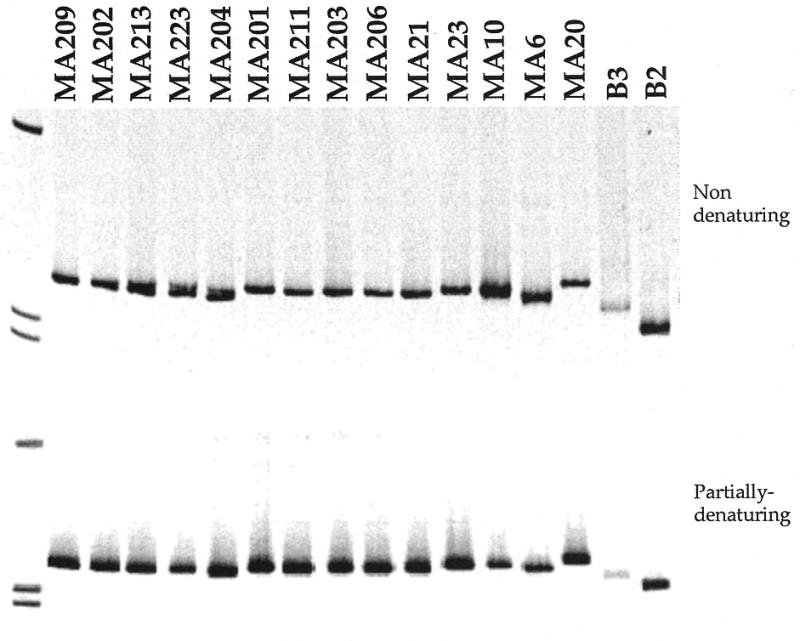
Electrophoretic migration of homoduplexes from each fragment used in this study in a non-denaturing (upper panel) and a partially denaturing (lower panel) environment.
DISCUSSION
Anomalous migration of duplex molecules as has been previously observed for some smaller fragments of DNA (1,29) appears to impact on heteroduplex mobility in acrylamide gels. This precludes accurate estimation of DNA sequence distances of <5% even for fragments of identical length. Electrophoresis in a partially denaturing environment appears to minimize variation caused by these secondary structures.
This study also shows that when a mismatch has the potential to significantly perturb a stretch of homologous sequence, it may be possible to design strategies to exploit this distinction. For example, the cluster of mismatches immediately downstream of position 240 will be made wider in heteroduplexes containing the MA223 sequence resulting in only a slightly greater perturbation of structure. In contrast, the mismatch at position 322 disturbs a 20 base region of homology between clusters of mismatches, and appears to significantly perturb the overall structure and decrease heteroduplex mobility.
Furthermore, as noted previously (1), in almost all cases, heteroduplexes formed between different strands of the same molecule migrated differently. Sequence-dependent anomalous migration in polyacrylamide gels does not significantly influence the relative migration of the heteroduplex if it is formed between sequences with levels of divergence above ~5% (1). One to two percent mismatches are required for the detection of heteroduplexes without fragment length variation (2). Our inferences have been derived from analysis of HIV-1 sequences. It is not clear if the equivalent mobility profiles will be observed using sequences derived from other sources which might differ substantially in base composition. Nevertheless, our data illustrate that HMA, under the conditions we evaluated, should not be used for determining phylogenetic relationships within the 2–5% range.
Acknowledgments
ACKNOWLEDGEMENT
This work was supported by PHS Grants AI37984 and AI34783.
REFERENCES
- 1.Delwart E.L., Shpaer,E.G., McCutchan,F.E., Louwagie,J., Grez,M., Rübsamen-Waigmann,H. and Mullins,J.I. (1993) Science, 262, 1257–1261. [DOI] [PubMed] [Google Scholar]
- 2.Delwart E.L., Sheppard,H.W., Walker,B.D., Goudsmit,J. and Mullins,J.I. (1994) J. Virol., 68, 6672–6683. [DOI] [PMC free article] [PubMed] [Google Scholar]
- 3.Delwart E.L., Herring,B., Rodrigo,A.G. and Mullins,J.I. (1995) PCR Methods Appl., 4, S202–S216. [DOI] [PubMed] [Google Scholar]
- 4.Delwart E.L., Herring,B., Learn,G., Rodrigo,A.G. and Mullins,J.I. (1995) NIH-NIAID AIDS Reference and Reagent Program, Rockville, MD, USA.
- 5.Korber B., Hoelscher,M., McCutchan,F., Williamson,C., von Sonnenburg,F., Mullins,J., Pletschette,M., Weber,J., van der Groen,G., Osmanov,S. and Workshop Report from the European Commission and the Joint United Nations Programme on HIV/AIDS (1997) AIDS, 11, UNAIDS17–UNAIDS36. [Google Scholar]
- 6.Bachmann M.H., Delwart,E.L., Shpaer,E.G., Lingenfelter,P., Singal,R. and Mullins,J.I. and the WHO Network on HIV-Isolation and Characterization (1994) AIDS Res. Hum. Retroviruses, 10, 1343–1351. [DOI] [PubMed] [Google Scholar]
- 7.Bobkov A., Kazennova,E., Selimova,L., Bobkova,M., Khanina,T., Ladnaya,N., Kravchenko,A., Pokrovsky,V., Cheingsong-Popov,R. and Weber,J. (1998) AIDS Res. Hum. Retroviruses, 14, 669–676. [DOI] [PubMed] [Google Scholar]
- 8.Wasi C., Herring,B., Vanichseni,S., Raktham,S., Mastro,T.D., Young,N.L., Rübsamen-Waigmann,H., von Briesen,H., Kalish,M.L., Luo,C.-C., Pau,C.-P., Baldwin,A., Mullins,J.I., Delwart,E.L., Esparza,J., Heyward,W.L. and Osmanov,S. (1995) AIDS, 9, 843–849. [DOI] [PubMed] [Google Scholar]
- 9.Delwart E.L., Pan,H., Sheppard,H.W., Wolpert,D., Neumann,A.U., Korber,B. and Mullins,J.I. (1997) J. Virol., 71, 7498–7508. [DOI] [PMC free article] [PubMed] [Google Scholar]
- 10.McLaughlin S., Herring,B., Contag,C.H., Wolinsky,S., Krogstad,P., Chen,I.S.Y., Korber,B.T. and Mullins,J.I. (1998) in preparation.
- 11.Contag C.H., Ehrnst,A., Duda,J., Bohlin,A.-B., Lindgren,S., Learn,G.H. and Mullins,J.I. (1997) J. Virol., 71, 1292–1300. [DOI] [PMC free article] [PubMed] [Google Scholar]
- 12.Delwart E.L., Busch,M.P., Kalish,M.L., Mosley,J.W. and Mullins,J.I. (1995) AIDS Res. Hum. Retroviruses, 11, 1181–1193. [DOI] [PubMed] [Google Scholar]
- 13.Valas S., Benoit,C., Guionaud,C., Perrin,G. and Mamoun,R.Z. (1997) Virology, 237, 307–318. [DOI] [PubMed] [Google Scholar]
- 14.Zou S. (1997) J. Clin. Microbiol., 10, 2623–2627. [DOI] [PMC free article] [PubMed] [Google Scholar]
- 15.Bachmann M.H., Sodora,D.L., Mathiason-Dubard,C.K., Learn,G.H., Rodrigo,A.G., Hoover,E.A. and Mullins,J.I. (1997) J. Virol., 71, 4241–4253. [DOI] [PMC free article] [PubMed] [Google Scholar]
- 16.Kreis S. and Whistler,T. (1997) Virus Res., 47, 197–203. [DOI] [PubMed] [Google Scholar]
- 17.Chezzi C. and Schoub,B.D. (1996) J. Virol. Methods, 62, 93–102. [DOI] [PubMed] [Google Scholar]
- 18.Gretch D.R., Polyak,S.J., Wilson,J.J., Carithers,R.L.,Jr, Perkins,J.D. and Corey,L. (1996) J. Virol., 70, 7622–7631. [DOI] [PMC free article] [PubMed] [Google Scholar]
- 19.Wilson J.J., Polyak,S.J., Day,T.D. and Gretch,D.R. (1995) J. Gen. Virol., 76, 1763–1771. [DOI] [PubMed] [Google Scholar]
- 20.Moreira M.A., Almeida,C.A., Canavez,F., Olicio,R. and Seu′anez,H.N. (1996) J. Hered., 87, 456–460. [DOI] [PubMed] [Google Scholar]
- 21.Li L., Krantz,I.D., Deng,Y., Genin,A., Banta,A.B., Collins,C.C., Qi,M., Trask,B.J., Kuo,W.L., Cochran,J., Costa,T., Pierpont,M.E., Rand,E.B., Piccoli,D.A., Hood,L. and Spinner,N.B. (1997) Nature Genet., 16, 243–251. [DOI] [PubMed] [Google Scholar]
- 22.Cai S.-P., Eng,B., Kan,Y.W. and Chui,D.H.K. (1991) Hum. Genet., 87, 728–730. [DOI] [PubMed] [Google Scholar]
- 23.Delwart E.L., Sheppard,H.W., Walker,B.D., Goudsmit,J. and Mullins,J.I. (1994) J. Virol., 68, 6672–6683. [DOI] [PMC free article] [PubMed] [Google Scholar]
- 24.Farrar G.J., Kenna,P., Jordan,S.A., Kumar-Singh,R., Humphries,M.M., Sharp,E.M., Sheils,D.M. and Humphries,P. (1991) Nature, 354, 478–480. [DOI] [PubMed] [Google Scholar]
- 25.Hsieh C.H. and Griffith,J.D. (1989) Proc. Natl Acad. Sci. USA, 86, 4833–4837. [DOI] [PMC free article] [PubMed] [Google Scholar]
- 26.Wang Y.-H. and Griffith,J. (1991) Biochemistry, 30, 1358–1363. [DOI] [PubMed] [Google Scholar]
- 27.Nelson J.A.E., Fiscus,S.A. and Swanstrom,R. (1997) J. Virol., 71, 8750–8758. [DOI] [PMC free article] [PubMed] [Google Scholar]
- 28.Kusumi K., Conway,B., Cunningham,S., Berson,A., Evans,C., Iversen,A.K.N., Colvin,D., Gallo,M.V., Coutre,S., Shpaer,E.G., Faulkner,D.V., DeRonde,A., Volkman,S., Williams,C., Hirsch,M.S. and Mullins,J.I. (1992) J. Virol., 66, 875–885. [DOI] [PMC free article] [PubMed] [Google Scholar]
- 29.Ganguly A., Rock,M.J. and Prockop,D.J. (1993) PNAS, 90, 10325–10329. [DOI] [PMC free article] [PubMed] [Google Scholar]
- 30.Shankarappa R., Margolick,J.B., Rodrigo,A.G., Gange,S.J., Upchurch,D., Farzadegan,H., Gupta,P., Rinaldo,C.R., Learn,G.H., Huang,X.-L. and Mullins,J.I. (1999) J. Virol., 73, 10489–10502. [DOI] [PMC free article] [PubMed] [Google Scholar]
- 31.Simmonds P., Balfe,P., Ludlam,C.A., Bishop,J.O. and Leigh Brown,A.J. (1990) J. Virol., 64, 5840–5850. [DOI] [PMC free article] [PubMed] [Google Scholar]