Abstract
Goal: This study validates an approach to characterizing the sounds experienced by tinnitus patients via reverse correlation, with potential for characterizing a wider range of sounds than currently possible. Methods: Ten normal-hearing subjects assessed the subjective similarity of random auditory stimuli and target tinnitus-like sounds (“buzzing” and “roaring”). Reconstructions of the targets were obtained by regressing subject responses on the stimuli, and were compared for accuracy to the frequency spectra of the targets using Pearson's  . Results: Reconstruction accuracy was significantly higher than chance across subjects: buzzing:
  (mean
(mean  s.d.),
  ,
,  ; roaring:
  ,
,  ,
,  ; combined:
  ,
,  ,
,  . Conclusion: Reverse correlation can accurately reconstruct non-tonal tinnitus-like sounds in normal-hearing subjects, indicating its potential for characterizing the sounds experienced by patients with non-tonal tinnitus.
Keywords: Reverse correlation, tinnitus, behavioral assay
I. Introduction
Tinnitus the perception of sound in the absence of any corresponding external stimulus—affects up to 50 million people in the U.S. [1], a third of whom experience functional cognitive impairment and diminished quality of life [2], [3]. Clinical guidelines for tinnitus management involve targeted exposure to external sounds as part of sound therapy or cognitive behavioral therapy [4]. Critically, patient outcomes improve when the employed external sounds are closely informed by the patient's internal tinnitus experience [5], [6], [7], [8]. However, existing strategies for characterizing tinnitus sounds, such as pitch matching (PM), are best suited for patients whose tinnitus resembles pure tones (e.g., ringing) [9], [10], [11], [12]. There is a need for methods to characterize tinnitus sounds in the estimated 20–50% of patients with nontonal (e.g., buzzing, roaring) tinnitus [13], [14].
Nontonal tinnitus sounds are presumed to be complex and heterogeneous [12], although few characteristics have been firmly established. Therefore, we base our approach on reverse correlation (RC), an established behavioral method [15], [16], [17] for estimating internal perceptual representations that is unconstrained by prior knowledge about the representations themselves. RC asks participants to render subjective judgments over ambiguous stimuli, and reconstructs the latent representation by regressing subject responses onto the stimuli. RC is closely related to Wiener theory, which has inspired “white-noise” approaches to system characterization in physiology [18], [19] and engineering [20].
Here, we validate RC as a method for characterizing individuals' internal representations of tinnitus more completely. To that end, normal-hearing participants completed an augmented RC experiment, comparing random stimuli to a target tinnitus-like sound, yielding frequency spectrum estimates of their tinnitus representation. The estimated spectra were subsequently validated against the target tinnitus sounds. Our results demonstrate, for the first time, that tinnitus-like sounds with complex spectra can be accurately estimated using RC.
II. Materials and Methods
A. Stimuli
The frequency space of the stimuli was partitioned into  Mel-spaced frequency bins, which divide the frequency space between
  Hz into contiguous segments of equal amplitude (i.e., “rectangular” bins). Reconstruction detail increases with
  , but
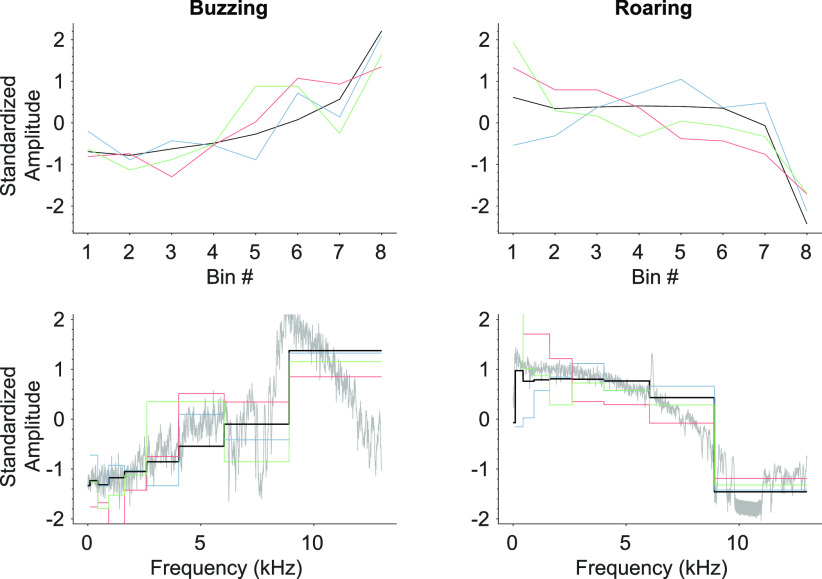
, but  provides a good approximation to the chosen target sounds (cf. Fig. 3).
Fig. 3.
Reconstructions of the tinnitus spectra capture many salient features of the target sounds. The black trace indicates the target, while colored traces plot exemplar human reconstructions. The top row shows standardized power levels within each frequency bin. The bottom row maps the 8-dimensional bin domain to a 11025-dimensional frequency domain with the unbinned power spectral density of the targets shown in gray.
For each stimulus, [2,7] bins were randomly “filled” with power 0 dB. “Unfilled” bins were assigned  dB. All frequencies were assigned random phase. Inverse Fourier transform of the constructed spectrum yields a 500 ms stimulus waveform.1
B. Target Sounds
Two spectrally complex and complementary target sounds (“buzzing” and “roaring”) were downloaded from the American Tinnitus Association [21] and truncated to 500 ms in duration (power-spectral densities are displayed in the botton subplots of Fig. 3).
C. Experiment
Ten ( ) normal-hearing subjects listened to A-X trials containing a target sound (
 ) followed by a stimulus (
 ).
).  was randomly generated for each trial, while
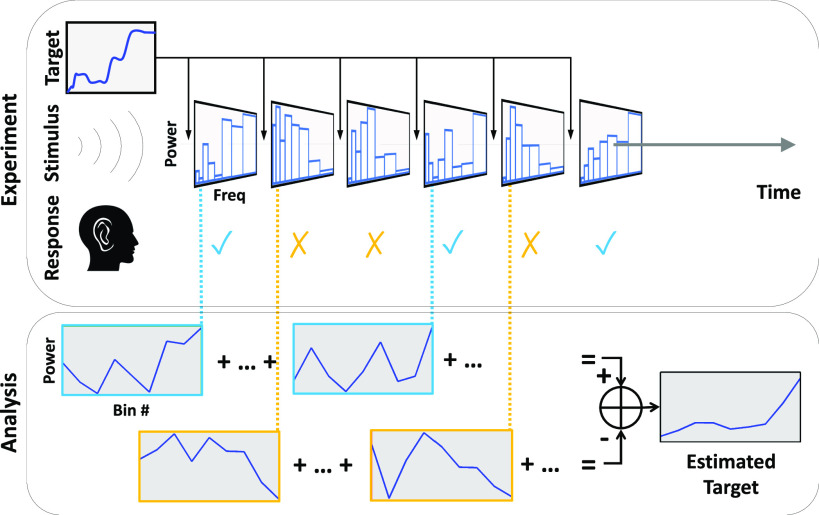
  remained the same within a block of 100 trials (Fig. 1). Subjects completed two (2) blocks per target sound (
 total trials per subject). Subjects were told that some stimuli had
  embedded in them, and were instructed to respond “yes” to such stimuli, otherwise “no.” Subjects listened over earphones at a self-determined comfortable level. Presentation level was not recorded in this study. Procedures were approved by the UMass IRB.
Fig. 1.
Diagram of the experimental protocol. Subjects listen to a series of random stimuli, each preceded by a target sound. Subjects compare the stimulus to the target, and respond either “yes” or “no” depending on their perceived similarity. The recorded stimulus-response pairs are used to form an estimate of the target.
D. Reconstruction
A subject performing  RC trials with
  frequency bins produces a stimulus matrix
  and a response vector
  , where 1 corresponds to a “yes” response and
  to a “no.” RC classically assumes the subject response model:
 |
where  is the subject's internal representation of interest (i.e., of their tinnitus). Inverting this model yields:
 |
which is a restricted form of the Normal equation under the assumption that the stimulus dimensions are uncorrelated [16].
E. Validation
The experimental paradigm allows for direct validation of the reconstructions  and
and  . We represent the spectra of the target sounds as vectors
  and
and  using the same frequency bins as the stimulus with power equal to the mean power at frequencies within that bin. Pearson's
  between
  and
and  and their corresponding reconstructions quantifies reconstruction accuracy. One-sample t-tests were performed on the mean Fisher-transformed Pearson's
  values across subjects to assess significant differences from zero.
F. Synthetic Subjects
To establish bounds on human performance, additional experiments were run with two simulated subjects who give either ideal or random responses. Each experiment ran for  trials and was repeated 1000 times.
The ideal subject gives responses following:
 |
for  , where
  is the quantile function for
  of the similarity calculation
  , and
, and  is the
  column of
  . Thus, the ideal subject has precise knowledge of every stimulus and responds according to (3). The random subject responds
  with uniform random probability, thus ignoring the stimulus entirely.
III. Results
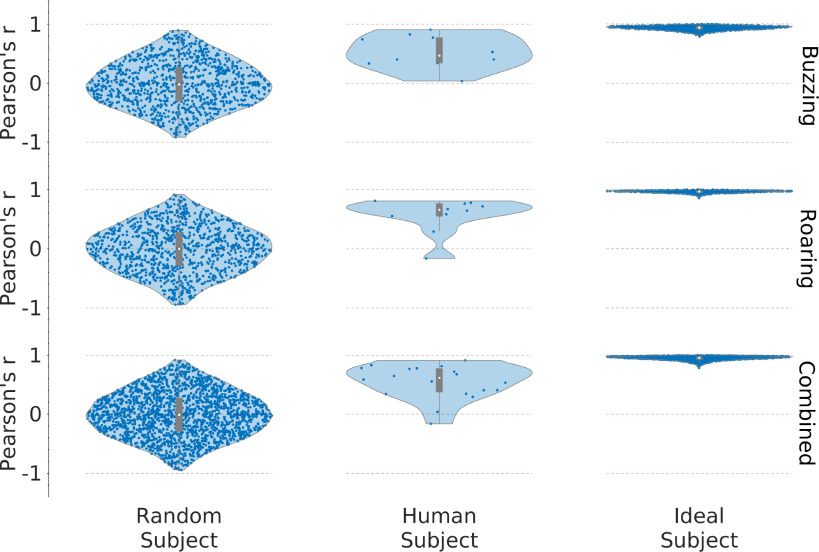
Fig. 2 shows the distribution of Pearson's  for human, ideal, and random subject responses. Human accuracy is statistically significantly higher than random chance and for some subjects, approaches the ideal case. Accuracy from the random subject was
  (mean
(mean  st.dev.) for buzzing and
  for roaring, while mean accuracy from human responses was significantly different from 0 in all conditions: buzzing:
  ,
,  ,
,  ; roaring:
  ,
,  ,
,  ; combined:
  ,
,  ,
,  . From Fig. 2, it appears that the distribution of buzzing results differs from that of the roaring results, however the difference between buzzing and roaring is not statistically significant (two-way ANOVA across subjects (
 ,
,  ) and target signals (
 ,
,  )). Fig. 3 plots the most accurate human reconstructions over the target sound spectra.
Fig. 2.
Human reconstruction accuracy is significantly above baseline, but is not optimal. Random, human, and ideal reconstruction accuracies are shown as violin plots with box plots overlaid. The median is a white dot, the ordinate of the blue points are the Pearson's  values.
IV. Conclusion
Our results show that RC can accurately reconstruct the frequency spectrum of tinnitus-like sounds relevant to non-tonal tinnitus, and therefore represent a proof of concept for using RC to characterize non-tonal tinnitus. Subjects completed the required number of trials within ten minutes, indicating that this procedure could be conducted within a single clinical visit. RC may therefore be useful as the basis for a clinical assay to characterize a wider variety of tinnitus percepts than currently possible. Reconstruction accuracies observed here are below the simulated ideal, which may be attributed to noisy responses universally observed in applications of RC, and which may be mitigated by further optimizing the experimental protocol, stimulus generation, and reconstruction method. For example, recent approaches to improving RC reconstruction methods can boost efficiency, noise robustness and overall accuracy [22]. Future work will focus on more comprehensive validation of this approach, using larger sample sizes, more target sounds, and stricter control of sound presentation level.
Acknowledgment
The authors declare no competing interests.
Funding Statement
This work was supported by the University of Massachusetts Center for Clinical and Translation Science.
Footnotes
Software for the experiments and analysis was written in MATLAB and is freely available at https://github.com/alec-hoyland/tinnitus-reconstruction/
Contributor Information
Alec Hoyland, Email: ahoyland@wpi.edu.
Nelson V. Barnett, Email: nbarnett@wpi.edu.
Benjamin W. Roop, Email: broop@wpi.edu.
Danae Alexandrou, Email: dalexandrou@luc.edu.
Myah Caplan, Email: macaplan@wpi.edu.
Jacob Mills, Email: jmills@wpi.edu.
Benjamin Parrell, Email: bparrell@wisc.edu.
Divya A. Chari, Email: Divya.Chari@umassmemorial.org.
Adam C. Lammert, Email: alammert@wpi.edu.
References
- [1].Bhatt J. M., Lin H. W., and Bhattacharyya N., “Prevalence, severity, exposures, and treatment patterns of tinnitus in the United States,” JAMA Otolaryngol.–Head Neck Surg., vol. 142, no. 10, pp. 959–965, Oct. 2016. [DOI] [PMC free article] [PubMed] [Google Scholar]
- [2].Nondahl D. M. et al. , “The impact of tinnitus on quality of life in older adults,” J. Amer. Acad. Audiol., vol. 18, no. 3, pp. 257–266, Mar. 2007. [DOI] [PubMed] [Google Scholar]
- [3].Tegg-Quinn S., Bennett R. J., Eikelboom R. H., and Baguley D. M., “The impact of tinnitus upon cognition in adults: A systematic review,” Int. J. Audiol., vol. 55, no. 10, pp. 533–540, Oct. 2016. [DOI] [PubMed] [Google Scholar]
- [4].Tunkel D. E. et al. , “Clinical practice guideline: Tinnitus,” Otolaryngol.–Head Neck Surg., vol. 151, no. 2_suppl, pp. S1–S40, Oct. 2014. [DOI] [PubMed] [Google Scholar]
- [5].Okamoto H., Stracke H., Stoll W., and Pantev C., “Listening to tailor-made notched music reduces tinnitus loudness and tinnitus-related auditory cortex activity,” Proc. Nat. Acad. Sci., vol. 107, no. 3, pp. 1207–1210, Jan. 2010. [DOI] [PMC free article] [PubMed] [Google Scholar]
- [6].Schaette R., König O., Hornig D., Gross M., and Kempter R., “Acoustic stimulation treatments against tinnitus could be most effective when tinnitus pitch is within the stimulated frequency range,” Hear. Res., vol. 269, no. 1, pp. 95–101, Oct. 2010. [DOI] [PubMed] [Google Scholar]
- [7].Stein A. et al. , “Inhibition-induced plasticity in tinnitus patients after repetitive exposure to tailor-made notched music,” Clin. Neuriophysiol., vol. 126, no. 5, pp. 1007–1015, May 2015. [DOI] [PubMed] [Google Scholar]
- [8].Schoisswohl S., Arnds J., Schecklmann M., Langguth B., Schlee W., and Neff P., “Amplitude modulated noise for tinnitus suppression in tonal and noise-like tinnitus,” Audiol. Neurotol., vol. 24, no. 6, pp. 309–321, 2019. [DOI] [PMC free article] [PubMed] [Google Scholar]
- [9].Neff P., Langguth B., Schecklmann M., Hannemann R., and Schlee W., “Comparing three established methods for tinnitus pitch matching with respect to reliability, matching duration, and subjective satisfaction,” Trends Hear., vol. 23, 2019, Art. no. 2331216519887247. [DOI] [PMC free article] [PubMed] [Google Scholar]
- [10].Henry J. A., James K. E., Owens K., Zaugg T., Porsov E., and Silaski G., “Auditory test result characteristics of subjects with and without tinnitus,” J. Rehabil. Res. Develop., vol. 46, no. 5, pp. 619–632, 2009. [DOI] [PubMed] [Google Scholar]
- [11].Ukaegbe O. C., Orji F. T., Ezeanolue B. C., Akpeh J. O., and Okorafor I. A., “Tinnitus and its effect on the quality of life of sufferers: A Nigerian cohort study,” Otolaryngol.–Head Neck Surg., vol. 157, no. 4, pp. 690–695, 2017. [DOI] [PubMed] [Google Scholar]
- [12].Vajsakovic D., Maslin M., and Searchfield G. D., “Principles and methods for psychoacoustic evaluation of tinnitus,” in The Behavioral Neuroscience of Tinnitus. Berlin, Germany: Springer, Feb. 2021, pp. 419–451. [DOI] [PubMed] [Google Scholar]
- [13].Henry J. A., “Measurement” of tinnitus,” Otol. Neurotol., vol. 37, no. 8, Sep. 2016, Art. no. e276. [DOI] [PubMed] [Google Scholar]
- [14].Noreña A., Micheyl C., Chéry-Croze S., and Collet L., “Psychoacoustic characterization of the tinnitus spectrum: Implications for the underlying mechanisms of tinnitus,” Audiol. Neuro- otol., vol. 7, pp. 358–69, Nov. 2002. [DOI] [PubMed] [Google Scholar]
- [15].Ahumada A. and Lovell J., “Stimulus features in signal detection,” J. Acoustical Soc. Amer., vol. 49, no. 6B, pp. 1751–1756, Jun. 1971. [Google Scholar]
- [16].Gosselin F. and Schyns P. G., “Superstitious perceptions reveal properties of internal representations,” Psychol. Sci., vol. 14, no. 5, pp. 505–509, Sep. 2003. [DOI] [PubMed] [Google Scholar]
- [17].Brimijoin W. O., Akeroyd M. A., Tilbury E., and Porr B., “The internal representation of vowel spectra investigated using behavioral response-triggered averaging,” J. Acoustical Soc. Amer., vol. 133, no. 2, pp. EL118–EL122, Feb. 2013. [DOI] [PMC free article] [PubMed] [Google Scholar]
- [18].Ringach D. and Shapley R., “Reverse correlation in neurophysiology,” Cogn. Sci., vol. 28, no. 2, pp. 147–166, 2004. [Google Scholar]
- [19].Marmarelis P. Z. and Marmarelis V. Z., “The white-noise method in system identification,” in Analysis of Physiological Systems: The White-Noise Approach (Computers in Biology and Medicine Series), Marmarelis P. Z. and Marmarelis V. Z., Eds. Boston, MA, USA: Springer, 1978, pp. 131–180. [Google Scholar]
- [20].Ljung L., System Identification: Theory for the User. London, U.K.: Pearson Education, Dec. 1998. [Google Scholar]
- [21].“Listen to sample tinnitus sounds (ATA),” Jun. 14, 2022. [Online]. Available: https://www.ata.org/listen-sample-tinnitus-sounds
- [22].Compton A., Roop B. W., Parrell B., and Lammert A. C., “Stimulus whitening improves the efficiency of reverse correlation,” Behav. Res. Methods, to be published, doi: 10.3758/s13428-022-01946-w. [DOI] [PMC free article] [PubMed]


