Abstract
The fitness of a genotype is defined as its lifetime reproductive success, with fitness itself being a composite trait likely dependent on many underlying phenotypes. Measuring fitness is important for understanding how alteration of different cellular components affects a cell’s ability to reproduce. Here, we describe an improved approach, implemented in Python, for estimating fitness in high throughput via pooled competition assays.
Keywords: Barcode, Fitness, Pooled growth, High-throughput phenotyping
Introduction
The fitness of an organism is dependent on many traits which act in concert to determine its reproductive success. Often a single trait can have an outsized role in determining fitness and in these cases, it may be appropriate to use these traits as easily quantifiable proxies of fitness. However, such approaches are limited in that they only measure a single component of fitness and in many cases, other unmeasured components of fitness may be relevant. A better approach involves directly competing genotypes against one another and then inferring fitness based on changes in genotype frequency. This approach captures all components of fitness simultaneously, allowing fitness instead of a proxy for fitness to be quantified. Previous approaches to competitive fitness assays have utilized differentially marked strains to perform pairwise fitness assays (Lenski et al. 1991); however, these approaches are limited in the throughput with which they can be performed. Some modest improvement to the throughput of competitive fitness assays has been achieved by utilizing fluorescently tagged lineages which allows the size of a lineage to be counted via the fluorescent signal instead of plating (Kao and Sherlock 2008; DeLuna et al. 2008).
Advances in molecular biology led to significant improvement to throughput by instead using DNA barcodes to mark and track lineages (Winzeler et al. 1999; Giaever et al. 2002) instead of fluorescent or other markers. At first, this involved transforming unique barcodes into known variants and then pooling 100 s of these barcoded variants into a library. These barcode tags could then be amplified via PCR and counted via hybridization to high-density arrays containing tag complements (Winzeler et al. 1999). A barcoded population could then be grown in a chemostat or via serial dilution for a finite number of generations and the fitness of each barcoded lineage could be inferred by tracking the changes in the barcode frequency over time. This approach was initially applied to yeast deletion libraries to test the fitness effects of 100 s of gene deletions across different environments (Winzeler et al. 1999; Giaever et al. 2002; Steinmetz et al. 2002). Later advances utilized high-throughput sequencing to count barcodes instead of hybridization arrays allowing for better quantification of barcode lineage frequencies within a population (Smith et al. 2009). Improved sequencing throughput allowed for the use of larger barcoded libraries, containing 500,000 barcodes, on an isogenic background to measure the fitness effects of de novo mutations that arise during the course of evolution (Levy et al. 2015).
Pooled competition assays using amplicon sequencing are becoming an increasingly common method for phenotyping large pools of variants simultaneously. This type of high-throughput phenotyping has applications in the characterization of in vivo adaptive mutations (Levy et al. 2015; Venkataram et al. 2016; Li et al. 2019), genetic interaction screening (Du et al. 2017; Jaffe et al. 2017; Díaz-Mejía et al. 2018), protein–protein interaction screening (Yachie et al. 2016; Celaj et al. 2017; Schlect et al. 2017), CRISPR screens (Koike-Yusa et al. 2014; Shalem et al. 2014; Smith et al. 2016; Zhu et al. 2021; Joung et al. 2022), deep mutational scanning (Fowler and Fields 2014), transposon mutagenesis screening (van Opijnen et al. 2009; Michel et al. 2017; Price et al. 2018), deletion collection screening (Smith et al. 2010; Li et al. 2011), rescue screening (Ho et al. 2009), protein cost measurements (Frumkin et al. 2017), and QTL mapping (Nguyen Ba et al. 2022; Matsui et al. 2022). A typical way of analyzing the data generated in these experiments is the fold enrichment, by utilizing two time points and estimating fitness from the change in barcode frequency between these two time points, such as MAGeCK (Li et al. 2014), despite known biases that are introduced when employing this type of method (Li et al. 2018). The fold enrichment method provides an accurate ranked fitness for each barcoded lineage; however, these fitness estimates are biased and cannot be compared across experiments because they are highly sensitive to the presence of the other genotypes in the pool and the duration of the experiment (Li et al. 2018). This problem is highlighted by the fact that two researchers could perform the exact same experiment differing only in the number of generations and many variants would be enriched in the shorter experiment that would be depleted in the longer one. This happens because as the mean fitness of the population increases, genotypes with fitness that were once greater than the mean fitness could now be lower than the mean fitness, resulting in their frequencies going from increasing to decreasing.
We have previously demonstrated that fitness estimates can be improved using a method we call Fit-Seq which uses multiple time points to optimize fitness estimates via a likelihood maximization method so that expected lineage trajectories match the observed data (Li et al. 2018). This method effectively eliminates the bias in fitness estimates that is introduced by fold enrichment-based methods. When using Fit-Seq to estimate fitness, the population mean fitness is taken into consideration, meaning that the estimated fitness of variants are approximately the same regardless of the duration of the competition experiment. Here, we describe several improvements we have made to this method (which we refer as Fit-Seq2.0) and show that Fit-Seq2.0 results in improved estimates of the fitness when it is used to analyze a simulated dataset.
There are four main improvements of Fit-Seq2.0 compared with Fit-Seq. First, a more accurate likelihood function is defined in Fit-Seq2.0, which models various sources of noise more precisely, and thus enable us to estimate the fitness more accurately. Second, a better optimization algorithm is employed in the maximization of the likelihood function. Third, in addition to estimating the fitness as in Fit-Seq, Fit-Seq2.0 also gives an estimated initial cell number for each lineage, which also enables a more accurate estimation for the lineage trajectory. Additionally, Fit-Seq2.0 is implemented in Python with an option of parallel computing, compared with Fit-Seq which was non-parallelized and implemented in MATLAB, making Fit-Seq2.0 more accessible to a broader audience and resulting in a shorter run time.
Methods
Algorithm
Before introducing the algorithm, we first define a list of notations. Let be a list of the sequencing time points, be the read number of a lineage at time point , and be the cell number at the bottleneck of a lineage at time point . Let be the total read depth of all lineages at time point , and be the total number of cells at the bottleneck at time point . Let s be the fitness of a lineage. Here, we use Malthusian fitness, which is defined as the exponential growth rate of a lineage when grown independently. Let be the mean fitness of the population of all lineages at time t. In Fit-Seq, we used an iterative approach. Specifically, we first made an initial estimation of the mean fitness at each sequencing time points by log-linear regression using the read number of the first two time points and . Then for an observed lineage trajectory data , we defined the likelihood function as the joint probability distribution of the read number given the fitness s,
| 1 |
The term for on the right side of Equation (1) represents the theoretical distribution for the number of reads at the current time point conditioned on the previous time point and the fitness s. It is defined based on a birth-branching process (Levy et al. 2015),
| 2 |
Here, is a noise parameter capturing half of per-read variance in offspring number from time point to , which accounts for the noise introduced by cell growth, cell transfer, genomic DNA extraction, PCR, and sequencing (Levy et al. 2015). is a term that accounts for the change in frequency of a lineage due to the mean fitness and the fitness of the lineage between two successive time points, which is defined as
| 3 |
Since we only infer the mean fitness at time points that are sequenced, we linearly interpolate between two successive sequenced time points. We then found the value of s that maximizes the likelihood function and used the optimal value of s as the estimate for the fitness to update the mean fitness at each time point by
| 4 |
with being the optimal fitness of lineage i, and being the read frequency of lineage i at time point . We repeated the optimization process, until the sum of the optimal likelihood value of all lineages does not increase.
However, it should be emphasized that the likelihood function in Fit-Seq is approximated by Equation (1), which is less accurate. In fact, the distribution of the read number directly depends on the cell number , rather than on . To be more strict, we should instead factorize the joint probability distribution of the cell number as,
| 5 |
In Fit-Seq2.0, we use the same iterative strategy as in Fit-Seq. However, we set the initial mean fitness to zero and redefine the likelihood function as the joint probability distribution of the read number given the initial cell number and the fitness s,
| 6 |
with
| 7 |
| 8 |
Here, represents the theoretical distribution for the number of cells at the current time point conditioned on the previous time point and the fitness s, which considers the noise introduced by cell growth and cell transfer. It is defined based on a birth-branching process with per-individual offspring number variance per growth cycle . represents the theoretical distribution for the number of reads at the current time point conditioned on the number of cells at the current time point, which considers the noise introduced by genomic DNA extraction, PCR, and sequencing. It can also be characterized as a branching process, with being the per-read variance. In our simulated model, can be calculated approximately as the sum of (reverse process of dilution, which approximately follows the negative binomial distribution), (genomic DNA extraction), (PCR), and 1 (sequencing). Here, is the average read number per lineage at time point ( in simulation). is the average cell number per lineage at the bottleneck at ( in simulation). is average genomic DNA copy number per lineage at ( in simulation). Thus, in our simulations, takes the value that approximately ranges from 0.57 to 0.85.
Unlike Fit-Seq, where the likelihood function (Equation (1)) is defined conditionally on a single variable, i.e., the fitness s, the likelihood function in Fit-Seq2.0 (Equation (6)) is conditioned on both the fitness s and the initial cell number . This enables us to estimate both the values of s and simultaneously in Fit-Seq2.0. In principle, evaluating the likelihood function in Fit-Seq2.0 involves a high dimensional integral over each of the K variables , which is impractical. Here, we take advantage of the form of and (Equations (7) and (8)) to calculate the approximate likelihood function without high dimensional integration. Since our final goal is to find the optimal s and that maximize the likelihood function , we only keep the exponent that dominates the overall shape of the distribution in Equations (7) and (8), which yields,
| 9 |
| 10 |
Therefore, the likelihood function becomes
| 11 |
For the integral in Equation (11), we can use the maximum of the integrand to approximate its value instead of direct integration. Specifically, we define , , and . Then, we can find the values of that maximize the integrand, which becomes
| 12 |
Since the exponent in the integrand is quadratic in , we can maximize it by solving a set of K equations linear in the ,
| 13 |
This set of constraints can be written in matrix format below,
| 14 |
with
| 15 |
and
| 16 |
The optimization algorithm used in Fit-Seq is L-BFGS-B (Zhu et al. 1997), which is a limited-memory quasi-Newton algorithm for bound-constrained optimization problems. The optimization algorithm used in Fit-Seq2.0 is differential evolution (Storn and Price 1997), which is a population-based metaheuristic search algorithm that is gradient-independent and thus does not require the optimization problem to be differentiable, as is required by quasi-newton methods.
In addition, both Fit-Seq and Fit-Seq2.0 give an estimated lineage trajectory for each lineage. In Fit-Seq, the estimated read number of a lineage at is calculated by for and , with s in term (Equation (3)) being the value that optimized. In Fit-Seq2.0, is calculated by for , with being the value that optimized and for from Equation (13) given solutions of .
Simulation
To evaluate the performance of Fit-Seq2.0 and Fit-Seq, we use a simulated dataset to compare the ground truth in the simulation with the inferred results. Our numerical simulations consider the entire process of a pooled growth experiment of a barcoded cell population using serial batch cultures, which includes five potential sources of noise: cell growth, sampling during cell transfers, genomic DNA extraction, PCR, and sequencing. Specifically, starting from L barcodes, with the initial cell number of each barcode following the distribution , and the fitness of each barcode following the distribution f(s), the population grown for T generations, with a cell transfer of every generations of growth. Let be the cell number of lineage i at generation t, and be the fitness of lineage i. For each batch culture cycle, the growth noise is simulated by updating the number of descendants of a single cell according to
| 17 |
Here represents a Poisson distribution with parameter . After generations, the cells which get transferred to the next batch are sampled with
| 18 |
For each cell transfer time point, 500L cells are sampled from the saturated population to simulate the process of genomic DNA extraction and go through 25 rounds of stochastic doubling to simulate PCR with 25 cycles. Then an extra sampling of the size rL after PCR is performed to simulate the noise introduced by sequencing, with r being the average sequencing read number per lineage per time point. Each step is modeled by a layer of Poisson noise (including for each cycle of PCR). The entire process generates a lineage trajectory over time for each barcode.
Here, , , , and . The distribution of the initial cell number follows the Gamma distribution with parameters and . Three distributions of fitness are used in the simulations, which are a normal distribution (with mean and standard deviation ), a left-skewed normal distribution (with a location parameter of 0, a scale parameter of 0.225, and a skewness parameter of ), and a right-skewed normal distribution (with a location parameter of 0, a scale parameter of 0.225, and a skewness parameter of 3). All fitnesses are normalized and truncated with .
Results
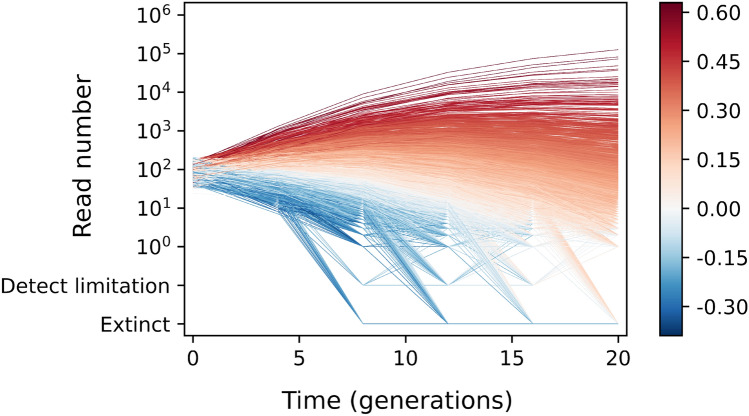
We simulated fitness re-measurement assays of a barcoded yeast library where the fitness of each lineage is known. These simulations include all sources of experimental noise and the resulting lineage trajectories resemble those generated experimentally. The simulated trajectories of lineages with slightly beneficial variants () in Fig. 1 highlight the major problem with fold enrichment methods, that is, these variants can either enriched or depleted depending on the length of the re-measurement period. These trajectories, containing modestly beneficial variants, begin by increasing in frequency (Fig. 1). However, by later time points, the population mean fitness has increased so that they begin to decrease in frequency, in some cases below their initial frequency. At these later time-points, the fold enrichment methods will erroneously count the modestly beneficial variants as deleterious because they have decreased in frequency.
Fig. 1.
Trajectories of lineages. Lineage trajectories from simulation (corresponds to 3rd row and 3rd column in Fig. 3, Section Simulation). Lineages are colored by their fitnesses (red for fitness , and blue for fitness )
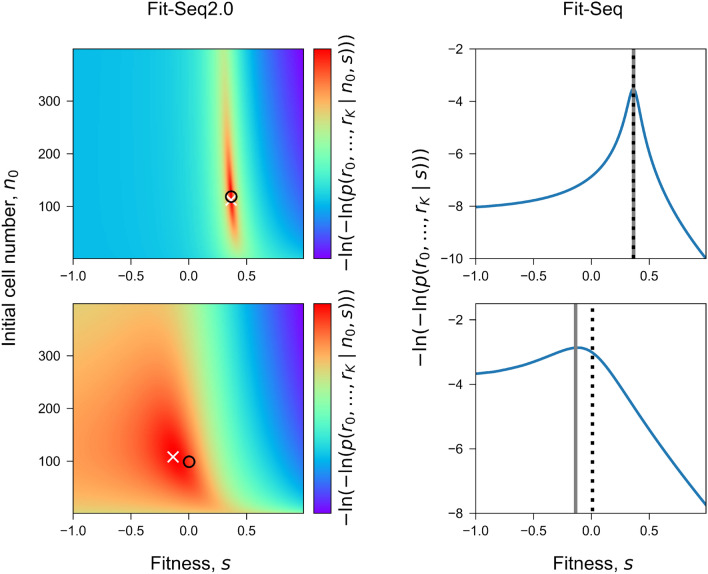
Although both Fit-Seq and Fit-Seq2.0 are based on a likelihood maximization method, Fit-Seq2.0 defines a more accurate likelihood function, which models experimental noise more precisely. The likelihood function in Fit-Seq is a single-variable function of the fitness s, while the likelihood function in Fit-Seq2.0 is a two-variable function of the fitness s and the initial cell number . In addition, Fit-Seq2.0 also utilizes an improved optimization algorithm. Together these improve the quality of the fitness estimates. The likelihood functions used in Fit-Seq2.0 and Fit-Seq for a beneficial lineage () and deleterious lineage () are shown in Fig. 2, together with the optimization results. The likelihood function in Fit-Seq2.0 is presented as a heatmap as it has two variables.
Fig. 2.
Optimization for two lineages. Optimization results (the last iteration) of the likelihood function in Fit-Seq2.0 (left, Equation (11) and in Fit-Seq (right, Equation (1)) is shown for a lineage with fitness (top) and a lineage with fitness (bottom). Fit-Seq2.0 estimates both the fitness and initial cell number, which is shown by the heatmap of the likelihood function, with true value of fitness and initial cell number marked by and optimized result marked by . Fit-Seq only estimates the fitness, which is shown by the curve of the likelihood function, with true value of fitness marked by black vertical dashed line and optimized result marked by gray vertical dashed line
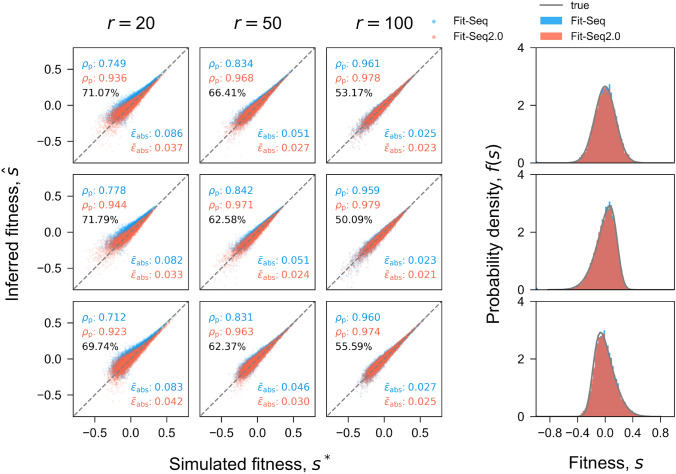
Both Fit-Seq and Fit-Seq2.0 were tested on the simulated data, with both estimates being compared with the true values from the simulation (Fig. 3). The comparison shows that Fit-Seq2.0 has better Pearson correlation coefficients and lower absolute error. These improvements appear to be consistent across a range of initial fitness distributions. It is known that the initial distribution of fitness can impact fitness estimates (Li et al. 2018), because the initial distribution determines how quickly the population mean fitness will increase. Therefore, it is important that any fitness inference algorithm can produce good estimates across a range of initial fitness distributions. Here we tested a normal distribution, a left-skewed normal distribution, and a right-skewed normal distribution. Several empirical studies have found distributions of fitness that follow normal distributions or log-normal distributions which are similar to our left-skewed normal distribution (Sanjuán et al. 2004; Peris et al. 2010; McDonald et al. 2011. In all cases, Fit-Seq2.0 produced better fitness estimates and the distribution of estimated fitness values better matched the true distribution (Fig. 3). The sequencing depth can also impact the fitness estimates. Therefore, we also compared the estimation accuracy of Fit-Seq2.0 and Fit-Seq using simulations with various sequencing read depths, i.e., high (), medium (), and low (). Fit-Seq2.0 resulted in better estimates at all sequencing read depths, and the improvements were the greatest for low depths of sequencing. This means that, by using Fit-Seq2.0, experimenters can now sequence less to produce similar fitness estimates. To further quantify the improvements in Fit-Seq2.0, we also compared the percent of lineages whose fitness estimated is improved using Fit-Seq2.0 instead of Fit-Seq (Fig. 3). Fit-Seq2.0 performs better than Fit-Seq particularly at lower read depths.
Fig. 3.
Inference accuracy of the fitness. Comparison of the true fitness in simulation and the fitness inferred by Fit-Seq2.0 (red) and Fit-Seq (blue) for different sequencing read depths (columns) and distributions of fitness (rows). Each panel in the array corresponds to one simulation (Section Simulation). Each point corresponds to a lineage in the simulation. is the Pearson correlation coefficient. is the average absolute error, which is defined as for each lineage. The 4th column in shows comparison between the true distribution of the fitness f(s) in simulation (gray) and the inferred (blue for Fit-Seq and red for Fit-Seq2.0). Percentage is the fraction of lineages with more accurate estimation for the fitness using Fit-Seq2.0. Estimates generated with Fit-Seq2.0 have a higher Pearson correlation coefficient and lower absolute error when compared with Fit-Seq. The distribution of fitness effects estimated by Fit-Seq2.0 also closely matches the true distribution in the simulation
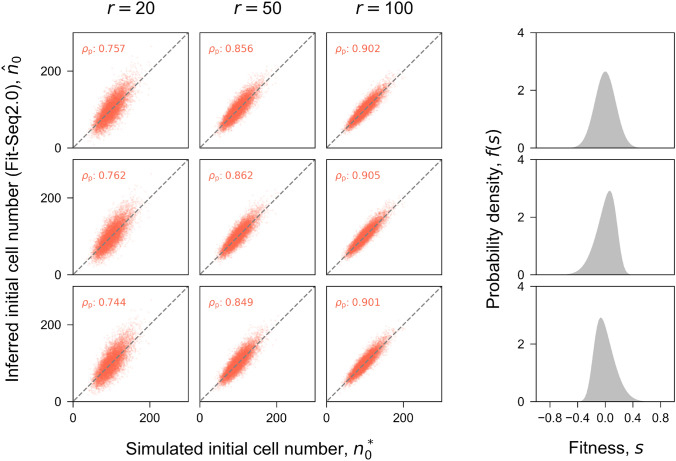
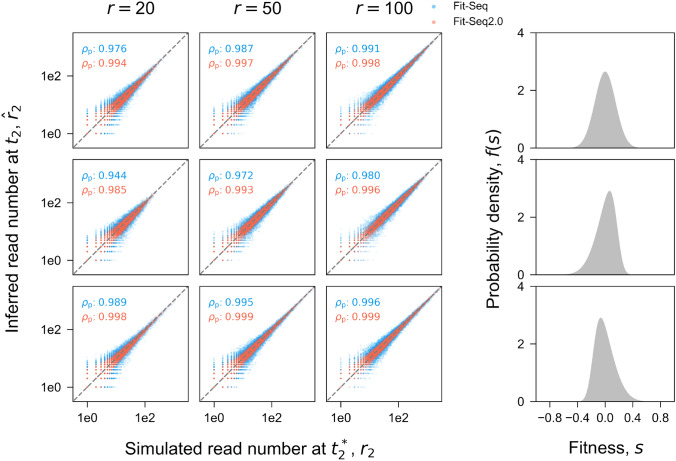
Unlike Fit-Seq which only estimates the fitness, Fit-Seq2.0 infers the fitness and the initial cell number simultaneously. The correlation between initial cell number inferred by Fit-Seq2.0 and the true value in the simulation is shown for different distributions of fitness and different sequencing read depths (Fig. 4). The correlation is consistent across different distributions of fitness, while increasing the sequencing read depth improves the inferred initial cell number. Although initial cell number is estimated only in FitSeq2.0, the read number at each time point is estimated in both FitSeq and FitSeq2.0. We show that FitSeq2.0 is better able to estimate the read number at each time point (Fig. 5). This is accomplished by the improved likelihood function and optimization process.
Fig. 4.
Inference accuracy of the initial cell number. Comparison of the true initial cell number in simulation and the fitness inferred by Fit-Seq2.0 (no estimation for initial cell number in Fit-Seq) for different sequencing read depths (columns) and distributions of fitness (rows). Each panel in the array corresponds to one simulation (Section Simulation). Each point corresponds to a lineage in the simulation. is the Pearson correlation coefficient. is the average absolute error, which is defined as for each lineage. The 4th column in shows the true distribution of the fitness f(s) in simulation. Estimates generated with Fit-Seq2.0 have a high Pearson correlation coefficient across all conditions that we considered
Fig. 5.
Inference accuracy of the read number. Comparison of the true read number at in simulation and the read number inferred by Fit-Seq2.0 (red) and Fit-Seq (blue) for different sequencing read depths (columns) and distributions of fitness (rows). Each panel in the array corresponds to one simulation (Section Simulation). Each point corresponds to a lineage in the simulation. is the Pearson correlation coefficient. is the average absolute error, which is defined as for each lineage. The 4th column in shows the true distribution of the fitness f(s) in simulation. Estimates generated with Fit-Seq2.0 have a higher Pearson correlation coefficient and lower absolute error when compared with Fit-Seq across all conditions that we considered
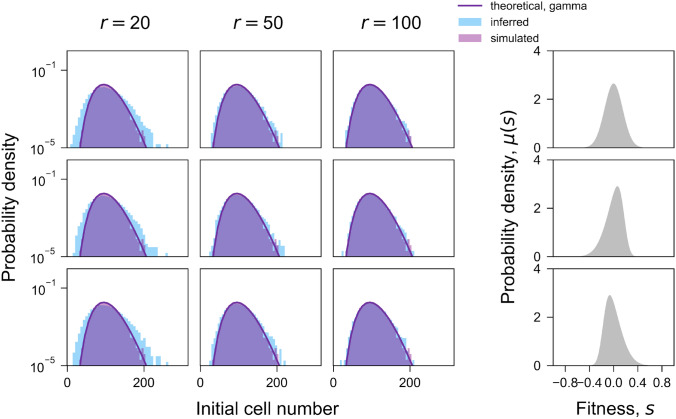
We have also updated some details of the simulations. For simulations in our previous work, the barcoded population started from a population where each barcoded lineage began at the same size (Li et al. 2018). In this work, we used a new approach in the simulations, whereby, the population started with a variable number of cells in each barcoded lineage, which follows a gamma distribution (Fig. 6). This reflects the reality that the initial number of cells for different lineages is usually not the same and therefore better captures how well the algorithm performs on real data. Our updated simulation approach therefore can provide a more robust test dataset for comparison of Fit-Seq and Fit-Seq2.0. The simulated and inferred initial cell number are shown for a range of sequencing read depths and fitness distributions (Fig. 6). We again note that using different fitness distributions makes little difference on the inferences; by contrast, increasing the sequencing read depth improves the inferences.
Fig. 6.
Distribution of initial cell number per lineage. Comparison of the theoretical (purple line), simulated (purple histogram), and inferred (blue histogram) distribution of initial cell number per lineage for different sequencing read depths (columns) and distributions of fitness (rows). Previously simulations have been done using a uniform initial distribution so that every lineage starts with exactly 100 cells
The compute time of Fit-Seq2.0 and Fit-Seq is approximately on the same order without parallelization. However, the option of parallelization in Fit-Seq2.0 reduces the compute time, which has a negative linear correlation with the number of CPU cores. The compute time of Fit-Seq2.0 depends on both the number of lineages and the number of iterations. A greater number of iterations might be needed when the mean fitness increase very quickly. Here, the per iteration for a simulation of 10000 lineages takes about 2 min when using parallelization (MacBook Pro with Apple M1 chip and 8 G Memory).
We have made our code available at https://github.com/FangfeiLi05/Fit-Seq2.0.
Discussion
Fit-Seq2.0 is implemented in Python (instead of MATLAB as in Fit-Seq) making it accessible to a wider audience. Both the optimization algorithm and the modeling of experimental noise are improved here, leading to consistent improvements in fitness estimates across a range of fitness distributions and sequencing read depths.
The ability of researchers to accurately and precisely measure fitness is critical in many biological disciplines. For evolutionary biologists, fitness is the phenotype of interest and the ability to measure fitness in high throughput allows the evolutionary process to be understood a way that was not previously possible (Levy et al. 2015; Li et al. 2019). Bulk growth assays are also an increasingly common way for researchers to phenotype large pools of variants (Schubert et al. 2021; Ipsen et al. 2022). However, these data are usually analyzed using a fold enrichment approach, meaning results are difficult to compare across experiments. Instead of fold enrichment, which is dependent on various aspects of the experimental design, such as the time points used, researchers can estimate an unbiased fitness (relative to the initial mean fitness or a reference strain) by utilizing Fit-Seq2.0. Reference strains can be added to each experiments, to estimate fitness relative to the reference, which allows for comparison of results from different large-scale experiments, so that biological insights can be integrated across multiple experimental approaches.
One limitation of Fit-Seq2.0 is that it is under the assumption that the fitness is constant over time. Fit-Seq2.0 is not designed for situations when fitness is changing over time, e.g., frequency-dependent fitness. Another limitation of Fit-Seq2.0 is that the quality of fitness estimates is dependent on the sequencing read depths, with poor fitness estimates below a sequencing depth of 20. Additionally, Fit-Seq2.0 may perform poorly if the distribution of fitness in the pool is too wide and population mean fitness increases very rapidly. Finally, Fit-Seq2.0 is still unable to estimate the confidence intervals for each fitness estimate; however, this is something we aim to incorporate into further updates of Fit-Seq2.0.
The optimization algorithm used in Fit-Seq is L-BFGS-B, which is a gradient-dependent method. This allows us to calculate an estimation error based on the optimization; however, this error is only partially informative of the error associated with the fitness estimates generated. In Fit-Seq2.0, we use a differential evolution optimization algorithm, which is gradient-independent and therefore the estimation of error is not meaningful in this case.
Acknowledgements
This work was supported by NIH R01 AI136992 to GS and by R35 GM131824. We thank Aditya Mahadevan for useful discussions and suggestions.
Footnotes
The original online version of this article was revised: The legends for Figures 2 and 3 are swapped this has been corrected now.
Fangfei Li and Jason Tarkington have contributed equally to this work.
Change history
2/8/2025
A Correction to this paper has been published: 10.1007/s00239-025-10232-0
References
- Celaj A, Schlect U, Smith JD et al (2017) Quantitative analysis of protein interaction network dynamics in yeast. Mol Syst Biol 13:934 [DOI] [PMC free article] [PubMed] [Google Scholar]
- DeLuna A, Vetsigian K, Shoresh N et al (2008) Exposing the fitness contribution of duplicated genes. Nat Genet 40:676–681 [DOI] [PubMed] [Google Scholar]
- Díaz-Mejía JJ, Celaj A, Mellor JC et al (2018) Mapping dna damage-dependent genetic interactions in yeast via party mating and barcode fusion genetics. Mol Syst Biol 14(5):e7985 [DOI] [PMC free article] [PubMed] [Google Scholar]
- Du D, Roguev A, Gordon DE et al (2017) Genetic interaction mapping in mammalian cells using crispr interference. Nat Methods 14:577–580 [DOI] [PMC free article] [PubMed] [Google Scholar]
- Fowler DM, Fields S (2014) Deep mutational scanning: a new style of protein science. Nat Methods 11:801–807 [DOI] [PMC free article] [PubMed] [Google Scholar]
- Frumkin I, Schirman D, Rotman A et al (2017) Gene architectures that minimize cost of gene expression. Mol Cell 65(1):142–153 [DOI] [PMC free article] [PubMed] [Google Scholar]
- Giaever G, Chu AM, Ni L et al (2002) Functional profiling of the saccharomyces cerevisiae genome. Nature 418:387–391 [DOI] [PubMed] [Google Scholar]
- Ho CH, Magtanong L, Barker SL et al (2009) A molecular barcoded yeast orf library enables mode-of-action analysis of bioactive compounds. Nat Biotechnol 27:369–377 [DOI] [PMC free article] [PubMed] [Google Scholar]
- Ipsen MB, Givskov Sørensen EM, Thomsen EA et al (2022) A genome-wide crispr-cas9 knockout screen identifies novel parp inhibitor resistance genes in prostat. Oncogene 41:4271–4281 [DOI] [PubMed] [Google Scholar]
- Jaffe M, Sherlock G, Levy SF (2017) iseq: A new double-barcode method for detecting dynamic genetic interactions in yeast. G3 7(1):143–153 [DOI] [PMC free article] [PubMed] [Google Scholar]
- Joung J, Kirchgatterer PC, Singh A et al (2022) Crispr activation screen identifies bcl-2 proteins and b3gnt2 as drivers of cancer resistance to t cell-mediated cytotoxicity. Nat Commun 13:1606 [DOI] [PMC free article] [PubMed] [Google Scholar]
- Kao KC, Sherlock G (2008) Molecular characterization of clonal interference during adaptive evolution in asexual populations of saccharomyces cerevisiae. Nat Genet 40(12):1499–1504 [DOI] [PMC free article] [PubMed] [Google Scholar]
- Koike-Yusa H, Li Y, Tan EP et al (2014) Genome-wide recessive genetic screening in mammalian cells with a lentiviral crispr-guide rna library. Nat Biotechnol 32:267–273 [DOI] [PubMed] [Google Scholar]
- Lenski RE, Rose MR, Simpson SC et al (1991) Long-term experimental evolution in escherichia coli. i. adaptation and divergence during 2,000 generations. Am Nat 138(6):1315–1341 [Google Scholar]
- Levy SF, Blundell JR, Venkataram S et al (2015) Quantitative evolutionary dynamics using high-resolution lineage tracking. Nat Genet 519(7542):181–186 [DOI] [PMC free article] [PubMed] [Google Scholar]
- Li F, Salit ML, Levy SF (2018) Unbiased fitness estimation of pooled barcode or amplicon sequencing studies. Cell Syst 7(5):521–525 [DOI] [PMC free article] [PubMed] [Google Scholar]
- Li Z, Vizeacoumar FJ, Bahr S et al (2011) Systematic exploration of essential yeast gene function with temperature-sensitive mutants. Nat Biotechnol 29:361–367 [DOI] [PMC free article] [PubMed] [Google Scholar]
- Li W, Xu H, Xiao T et al (2014) Mageck enables robust identification of essential genes from genome-scale crispr/cas9 knockout screens. Genome Biol 15:554 [DOI] [PMC free article] [PubMed] [Google Scholar]
- Li Y, Petrov DA, Sherlock G (2019) Single nucleotide mapping of trait space reveals pareto fronts that constrain adaptation. Nat Ecol Evol 3:1539–1551 [DOI] [PMC free article] [PubMed] [Google Scholar]
- Matsui T, Mullis MN, Roy KR et al (2022) The interplay of additivity, dominance, and epistasis on fitness in a diploid yeast cross. Nat Commun 13:1463 [DOI] [PMC free article] [PubMed] [Google Scholar]
- McDonald MJ, Cooper TF, Beaumont HJ et al (2011) The distribution of fitness effects of new beneficial mutations in pseudomonas fluorescens. Biol Lett 7(1):98–100 [DOI] [PMC free article] [PubMed] [Google Scholar]
- Michel AH, Hatakeyama R, Kimming P et al (2017) Functional mapping of yeast genomes by saturated transposition. eLife 6:e23570 [DOI] [PMC free article] [PubMed] [Google Scholar]
- Nguyen Ba AN, Lawrence KR, Rego-Costa A et al (2022) Barcoded bulk qtl mapping reveals highly polygenic and epistatic architecture of complex traits in yeast. eLife 11:e73983 [DOI] [PMC free article] [PubMed] [Google Scholar]
- Peris JB, Davis P, Cuevas J et al (2010) Distribution of fitness effects caused by single-nucleotide substitutions in bacteriophage f1. Genetics 185(2):603–609 [DOI] [PMC free article] [PubMed] [Google Scholar]
- Price MN, Wetmore KM, Water JR, et al (2018) Mutant phenotypes for thousands of bacterial genes of unknown function. Nature 557:503–509 [DOI] [PubMed]
- Sanjuán R, Moya A, Elena SF (2004) The distribution of fitness effects caused bysingle-nucleotide substitutions in an rna virus. PNAS 101(22):8396–8401 [DOI] [PMC free article] [PubMed] [Google Scholar]
- Schlect U, Liu Z, Blundell JR et al (2017) A scalable double-barcode sequencing platform for characterization of dynamic protein-protein interactions. Nat Commun 8:15586 [DOI] [PMC free article] [PubMed] [Google Scholar]
- Schubert MG, Goodman DB, Wannier TM et al (2021) High-throughput functional variant screens via in vivoproduction of single-stranded dna. Proc National Acad Sci 118:18 [DOI] [PMC free article] [PubMed] [Google Scholar]
- Shalem O, Sanjana NE, Hartenian E et al (2014) Genome-scale crispr-cas9 knockout screening in human cells. Science 343(6166):84–87 [DOI] [PMC free article] [PubMed] [Google Scholar]
- Smith MA, Heisler LE, Mellor J et al (2009) Quantitative phenotyping via deep barcode sequencing. Genome Res 10:1836–1842 [DOI] [PMC free article] [PubMed] [Google Scholar]
- Smith AM, Heisler LE, St.Onge RP, et al (2010) Highly-multiplexed barcode sequencing: an efficient method for parallel analysis of pooled samples. Nucl Acids Res 38(13):e142 [DOI] [PMC free article] [PubMed] [Google Scholar]
- Smith JD, Suresh S, Schlecht U et al (2016) Quantitative crispr interference screens in yeast identify chemical-genetic interactions and new rules for guide rna design. Genome Biol 17:45 [DOI] [PMC free article] [PubMed] [Google Scholar]
- Steinmetz LM, Scharfe C, Deutschbauer AM et al (2002) Systematic screen for human disease genes in yeast. Nat Genet 31:400–404 [DOI] [PubMed] [Google Scholar]
- Storn R, Price K (1997) Differential evolution - a simple and efficient heuristic for global optimization over continuous spaces. J Glob Optim 11:341–359 [Google Scholar]
- van Opijnen T, Bodi KL, Camilli A (2009) Tn-seq: high-throughput parallel sequencing for fitness and genetic interaction studies in microorganisms. Nat Commun 6:767–772 [DOI] [PMC free article] [PubMed] [Google Scholar]
- Venkataram S, Dunn B, Li Y et al (2016) Development of a comprehensive genotype-to-fitness map of adaptation-driving mutations in yeast. Cell 116(6):1585-1596.e22 [DOI] [PMC free article] [PubMed] [Google Scholar]
- Winzeler EA, Shoemaker DD, Astromoff A et al (1999) Functional characterization of the s. cerevisiae genome by gene deletion and parallel analysis. Science 285(5429):901–906 [DOI] [PubMed] [Google Scholar]
- Yachie N, Petsalaki E, Mellor JC et al (2016) Pooled-matrix protein interaction screens using barcode fusion genetics. Mol Syst Biol 12:863 [DOI] [PMC free article] [PubMed] [Google Scholar]
- Zhu C, Byrd RH, Lu P et al (1997) Algorithm 778: L-bfgs-b: Fortran subroutines for large-scale bound-constrained optimization. ACM Trans Math Softw 23(4):550–560 [Google Scholar]
- Zhu Y, Feng F, Hu G et al (2021) A genome-wide crispr screen identifies host factors that regulate sars-cov-2 entry. Nat Commun 12:961 [DOI] [PMC free article] [PubMed] [Google Scholar]


