

Abstract
Background.
Gray matter morphometry studies have lent seminal insights into the etiology of mental illness. Existing research has primarily focused on adults and then, typically on a single disorder. Examining brain characteristics in late childhood, when the brain is preparing to undergo significant adolescent reorganization and various forms of serious psychopathology are just first emerging, may allow for a unique and highly important perspective of overlapping and unique pathogenesis.
Methods.
A total of 8645 youth were recruited as part of the Adolescent Brain and Cognitive Development study. Magnetic resonance imaging scans were collected, and psychotic-like experiences (PLEs), depressive, and anxiety symptoms were assessed three times over a 2-year period. Cortical thickness, surface area, and subcortical volume were used to predict baseline symptomatology and symptom progression over time.
Results.
Some features could possibly signal common vulnerability, predicting progression across forms of psychopathology (e.g. superior frontal and middle temporal regions). However, there was a specific predictive value for emerging PLEs (lateral occipital and precentral thickness), anxiety (parietal thickness/area and cingulate), and depression (e.g. parahippocampal and inferior temporal).
Conclusion.
Findings indicate common and distinct patterns of vulnerability for varying forms of psychopathology are present during late childhood, before the adolescent reorganization, and have direct relevance for informing novel conceptual models along with early prevention and intervention efforts.
Keywords: Anxiety, depression, psychosis, neuroimaging, MRI, schizophrenia, neural
An accumulating body of work has documented brain structure differences in individuals suffering from mental health conditions including psychosis, depression, and anxiety (Bas-Hoogendam et al., 2018; Castagna et al., 2018; Fraguas, Díaz-Caneja, Pina-Camacho, Janssen, & Arango, 2016; Jeon, Mishra, Ouyang, Chen, & Huang, 2015; Schmaal et al., 2017). Much of this work has centered on adult populations (Canu et al., 2015; Maglanoc et al., 2020; Schmaal et al., 2017; Shepherd, Laurens, Matheson, Carr, & Green, 2012). Further, existing research has emphasized individuals meeting clinical criteria for different disorders (Canu et al., 2015; Chiapponi et al., 2013; Freitas-Ferrari et al., 2010; Frick et al., 2013; Strawn et al., 2014). More recently, dimensional conceptualizations of psychopathology have heralded an era of insights on mechanisms underlying mental illness vulnerability, offering insights on both transdiagnostic and specific factors (Krueger & Markon, 2011). Examining neural features during late childhood, while the brain is in the crux of significant gray matter reorganization and various forms of serious psychopathology are first emerging, could allow for a necessary perspective on overlapping and unique pathogenesis (Cicchetti & Rogosch, 1996; Gogtay et al., 2004; Lyall et al., 2015). Further, adopting a longitudinal perspective could add further nuance to understanding developmental processes during this period. As such, the present investigation aimed to (1) establish whether brain structure relates to psychosis, depressive, and anxiety symptomatology in late childhood, and (2) determine whether structural neural features could predict change trajectories over a 2-year period of psychosis, depressive, and anxiety symptomatology. Taken together, these efforts hold promise for informing early prevention and intervention efforts for mental illness and identifying vulnerability markers.
Depressive and anxiety disorders occur commonly in a significant proportion of adolescents, with rates estimated at 9.9% for anxiety disorders and 9.5% for depressive disorders in adolescents by age 16 (Costello, Mustillo, Erkanli, Keeler, & Angold, 2003). Psychotic-like experiences (PLEs), including unusual beliefs, suspiciousness, and perceptual abnormalities, can occur as early as childhood and are observed in 13–15% of children, while formal psychotic disorder onset typically occurs during late adolescence and early adulthood (Laurens et al., 2007). After clinically impairing illness onset, confounds related to factors such as medication use and functional decline make it difficult to distill factors driving illness onset (Zhao et al., 2017). As such, assessment prior to adolescence of associated symptoms or experiences on spectrums of symptomatology provides a promising alternative for identifying factors relating to disorder etiology prior to the typical age of onset for these disorders.
Dimensional models conceptualize mental disorders as delineating continuous underlying susceptibilities to experience psychopathology, assessing symptomatology on a spectrum of severity ranging from normative to more severe (Krueger & Markon, 2011). Identifying symptomatology dimensionally could aid in predicting vulnerable youth at greater risk of later developing more severe symptomatology during adolescence and young adulthood. For example, subthreshold depressive and anxiety symptoms have been shown to predict later disorder onset through adolescence (Costello et al., 2003). Evidence suggests vulnerability for developing depressive and psychotic disorders can emerge during childhood (Keyes, Gary, O’Malley, Hamilton, & Schulenberg, 2019). PLEs have also been related to pathogenic factors observed in psychotic disorders (Kelleher & Cannon, 2011; Papanastasiou et al., 2020), and experiencing PLEs earlier in life has been linked to later risk for psychotic disorder onset (Kline et al., 2014).
While the literature has harnessed structural magnetic resonance imaging (MRI) methodology to distinguish individuals with different DSM-5 diagnoses, these efforts have largely centered on adolescents and adults with an existing diagnosis (Carnevali et al., 2019; Forbes et al., 2019; Frodl et al., 2017; Molent et al., 2018; Vieira et al., 2020). The existing literature on mental health vulnerability earlier in development, during childhood, has been less frequent, while having yielded critical insights. Childhood and pre-adolescence studies examining mental health vulnerability across different dimensions of symptomatology in the same sample, while adopting a longitudinal perspective, are lacking. The Adolescent Brain and Cognitive Development (ABCD) study provides an excellent opportunity for expanding our understanding, as the largest study to date on adolescent development (Casey et al., 2018). Existing investigations have begun to explore these questions, assessing high risk for depression and relations to gray matter volume (Pagliaccio, Alqueza, Marsh, & Auerbach, 2020), as well as gray matter volume with regards to dimensions of psychopathology in children (Durham et al., 2021). These studies have not examined different dimensions of psychopathology in the same sample while teasing out relations to cortical thickness and surface area more specifically; the perspective is crucial given distinct underlying processes and developmental trajectories that are not captured by volumetric measures alone (Tamnes et al., 2017). Similarly, due to high comorbidity among mental disorders, understanding the dimensional presentation of different disorders within the same sample is critical (Kotov et al., 2021). The approach could aid in distinguishing overlapping and distinct etiological and vulnerability factors (Cicchetti & Rogosch, 1996). Finally, symptom trajectories over time are lacking, rendering missing a nuanced developmental perspective of emerging vulnerability.
Childhood and pre-adolescence mark a dynamic period for neural development – by 9 years old, the brain has already reached 96% of its maximum size (Jeon et al., 2015; Lyall et al., 2015; Tamnes et al., 2017; Wierenga, Langen, Oranje, & Durston, 2014). As such, widespread grey matter volume decreases begin around puberty (Norbom et al., 2021). The developmental timing of volume, thickness, and surface area varies by cortical region, with cortical thickness and surface area developing independently of one another (Wierenga et al., 2014). For example, both cortical thickness and surface area show normative decreases throughout late childhood and adolescence, with cortical thinning happening at a much greater degree compared to surface area (Garcia, Kroenke, & Bayly, 2018; Jeon et al., 2015; Tamnes et al., 2017; Wierenga et al., 2014). While surface area could reflect processes related to cortical folding and gyrification (Garcia et al., 2018), cortical thickness could index developmental processes including synaptic pruning, cell shrinkage, apoptosis, and dendritic arborization (Jeon et al., 2015; Tamnes et al., 2017).
With total grey matter volume decreasing and white matter myelination increasing, cortical thinning and pruning process are particularly marked during adolescence (Tamnes et al., 2017). As such, while existing studies have largely focused on gray matter volume metrics, measures related to gray matter cortical thickness and surface area could provide a unique understanding on developmental processes and underlying biological mechanisms (Jeon et al., 2015; Lyall et al., 2015; Tamnes et al., 2017; Wierenga et al., 2014). While other metrics such as white matter and network cohesion are at earlier stages of development during late childhood, gray matter features are in the crux of foundational developmental processes (Jeon et al., 2015; Wierenga et al., 2014). As such, these metrics could provide insights into emerging vulnerability in the years prior to adolescence and young adulthood, when other contextual, interpersonal, and neurodevelopmental vulnerabilities typically emerge to drive formal illness onset.
The present exploratory study addressed questions related to mental health vulnerability for psychosis, depression, anxiety, and gray matter structure in childhood. The first aim was to relate PLEs, depressive, and anxiety symptoms to cortical thickness and area regions, and subcortical region volume. The second aim was to determine which cortical and subcortical regions would predict symptom trajectories over time. Taken together, the present investigation provides an opportunity for clarifying factors related to trajectories of early vulnerability for mental illness.
Method
Participants
The ABCD dataset release 3.0 includes children aged 9–11 years old across 22 centers in the USA (Barch et al., 2018). All centers obtained the parents’ informed consent as well as the children’s assent. Research procedures followed ethical guidelines laid out by respective Institutional Review Boards. The current sample used baseline data for participants who had available data for PLEs, depressive and anxiety symptoms. A total of 8645 had structural MRI data collected at baseline passing quality control procedures, along with available baseline symptoms and demographics data (see online Supplementary Material). Participants were interviewed at baseline, 1-year follow-up, and 2-year follow-up. Of the baseline sample, a subsample of 5632 had available symptoms data for the three timepoints. Trajectory analyses were conducted in this subgroup. As the ABCD study did not collect information on clinician-rated diagnoses, these were not included.
Measures
Structural MRI
Participants completed a high-resolution T1-weighted structural MRI scan (1 mm isotropic voxels) using scanners from GE Healthcare (Waukesha, Wisconsin), Philips Healthcare (Andover, Massachusetts), or Siemens Healthcare (Erlangen, Germany) (Casey et al., 2018). Structural MRI data were processed using FreeSurfer version 5.3.0 (http://surfer.nmr.mgh.harvard.edu/) (Fischl, Sereno, Tootell, & Dale, 1999) according to standard processing pipelines (Casey et al., 2018). Processing included removal of non-brain tissue, segmentation of gray and white matter structures (Fischl et al., 2002) and cortical parcellation. All scan sessions underwent radiological review whereby scans with incidental findings were identified. Quality control for the structural images comprised visual inspection of T1 images and Free-Surfer outputs for quality (Hagler et al., 2019). Subjects whose scans failed inspection (due to severe artifacts or irregularities) were excluded. The Desikan-Killiany Atlas was used for cortical parcellation (see online Supplementary Material) (Hagler et al., 2019). For subcortical parcellation, the Aseg atlas was used (Fischl et al., 2002).
PLEs
The Prodromal Questionnaire-Brief Child version was administered to youth to assess PLEs (Karcher et al., 2018). The 21-item self-report questionnaire was previously validated in the ABCD study sample. Participants were asked about specific PLEs that could be endorsed with a yes/no response. In addition, youth indicated whether there was distress related to endorsed symptoms on a Likert scale ranging from 1 to 5. PLE scores accounting for distress were calculated consistent with prior research, whereby total number of endorsed symptoms were weighted by the level of distress. A score of 0 indicated no endorsement, 1 indicated endorsement without distress, and 2–6 indicated endorsement with incremental distress levels (Karcher et al., 2018).
Depressive and anxiety symptoms
The Child Behavior Checklist (CBCL) was administered to parents of participants (Barch et al., 2018). The CBCL contains 113 question cores on a three-point Likert scale (with 0 representing ‘not true’, 1 representing ‘somewhat/sometimes’, and 2 indicating ‘very true/often’). DSM-5 oriented empirically based subscales were derived for anxiety and depressive symptoms (Achenbach, Dumenci, & Rescorla, 2003). For the anxiety scale, scores ranged from 0 to 18, with items related to experiencing being dependent, not wanting to sleep alone, not leaving the home, having fears, being upset by separation, being nervous, having nightmares, fearing daycare/school, panicking, and worrying. For the depressive scale, scores ranged from 0 to 19, with items related to experiencing apathy, crying, not eating well, trouble sleeping, looking unhappy, overeating, being overtired, having little interest, sleeping little, being underactive, and being sad. Raw scores were used to extract slopes for change in symptoms over time. The CBCL has been successfully used for assessing anxiety (Wadsworth, Hudziak, Heath, & Achenbach, 2001) and depression (Wadsworth et al., 2001) in youth.
Data analysis
To account for clustering, demographic and socio-economic selection bias, the current study opted for three-level (site, family, individual) multi-level specifications (along with controlling for relevant demographic and socio-economic features including race, sex, and family income), rather than employing multilevel-weighting methods, as current evidence does not suggest that multilevel weighting methods improve the accuracy or precision of the model fit (Heeringa & Berglund, 2020). Results were visualized using R packages ggseg version 1.6.3, and ggseg3d version 1.6.3 (Mowinckel & Vidal-Piñeiro, 2020). The car package, version 3.0.11 was used to calculate variance inflation factor (VIF) to further assess for multicollinearity (Fox, 2019).
Statistical modeling of symptoms over time.
Mixed-effect models were run using the nlme version 3.1.148 (Pinheiro et al., 2021) package in R version 4.0.2 using R studio version 1.2.1335 (Team, 2018). Individual change paths over the three timepoints were calculated for PLEs, depressive and anxiety symptoms. Residual, individual change slope terms were extracted. Adjusted residual slopes were used as the outcome variable. Imputation was done using the MICE package version 3.13.0 in R to account for missing longitudinal data (Zhang, 2016). Results were mostly consistent with or without imputation; see online Supplementary Material for analyses without imputation.
Cortical area/thickness as predictors of baseline symptoms and symptom trajectory.
Desikan-Killiany Atlas cortical regions (68 total, 34 regions with left and right hemisphere) were together used as predictors in a single mixed-effect model accounting for age, sex, and medication use (including antipsychotics, sedatives, serotonin selective reuptake inhibitors, stimulants, and mood stabilizers) as fixed effects, and family and site as random effects, with baseline PLE/depressive/anxiety symptoms and change trajectories for PLE/depressive/anxiety symptoms as outcome variables. Analyses were run such that one model included all the Desikan-Killiany-delineated regions as predictors. The single model controlled for all other brain regions, and different models conducted for area, thickness, and symptoms concerned distinct research questions. Raw symptoms data were log transformed. Prior to analyses, variables were converted to standardized units (z scores). Standardized brain metrics did not correlate highly with each other (r ranging from <0.001 to 0.6); as such, collinearity due to brain metric predictors was not a concern in the models. VIF ranged from 1.014 to 5.199, and remained <5 in 99.99% of cases (see online Supplementary Material).
Analyses were run for cortical thickness and surface area separately, given their earlier mentioned distinct developmental trajectories and underlying neural structural indicators. For analyses, regions were averaged across hemispheres. As an exploratory aim, sensitivity analyses explored whether bilateral region findings were present in only one or more hemispheres (see online Supplementary Material).
Subcortical volumes as predictors of baseline symptoms and symptom trajectory.
Previous studies have already examined volume in baseline/non-longitudinal data (Durham et al., 2021). Given that thickness and area measures were not available for subcortical regions, volumetric measures were used for subcortical regions only. Aseg Atlas subcortical regions (7 total) were together used as predictors in a single mixed-effect model accounting for age, sex, family income, race, and medication use as fixed effects, and family and scanner serial number as random effects, with baseline PLE/depressive/anxiety symptoms as outcome variables (Tables 1–3).
Table 1.
Demographic characteristics
| Variable | Mean (s.d.) |
| Age (years) | 9.926 (0.625) |
| Count (%) | |
| Sex (% female) | 4584 (47.690%) |
| Race/ethnicity | |
| White | 4873 (53.887%) |
| Vietnamese | 13 (0.144%) |
| Samoan | 3 (0.033%) |
| Multi-racial | 927 (10.251%) |
| Latinx | 1572 (17.384%) |
| Korean | 14 (0.155%) |
| Japanese | 2 (0.022%) |
| Filipino | 27 (0.299%) |
| Chinese | 50 (0.553%) |
| Black | 1218 (13.469%) |
| Asian Indian | 33 (0.365%) |
| American Indian | 27 (0.299%) |
| Other Pacific Islander | 6 (0.066%) |
| Other Asian | 17 (0.188%) |
| Othera | 261 (2.886%) |
| Medications | |
| Stimulants | 710 (7.387%) |
| Antipsychotics | 62 (0.645%) |
| Mood stabilizers | 2 (0.021%) |
| Selective serotonin reuptake inhibitors | 183 (1.904%) |
| Sedatives | 77 (0.801%) |
Did not know, refused to answer, missing data.
Table 3.
Summary of regions that showed associations with baseline symptoms or symptom trajectories, while accounting for other cortical and subcortical regions
| Lobe | Psychotic-like experiences | Depressive symptoms | Anxiety symptoms | |||||||||
|---|---|---|---|---|---|---|---|---|---|---|---|---|
| Region | Metric | TPa | ↑↓b | Metric | TPa | ↑↓b | Metric | TPa | ↑↓b | |||
| Temporal | Transverse temporal | Thickness | Slope | ↑↑ | Middle temporal | Thickness | Baseline | ↑↑ | Entorhinal | Area | Baseline | ↑↑ |
| Fusiform | Thickness | Slope | ↑↓ | Inferior temporal | Thickness | Baseline | ↑↓ | Temporal pole | Area | Baseline | ↑↓ | |
| Middle temporal | Area | Slope | ↑↓ | Entorhinal | Area | Baseline | ↑↑ | Fusiform | Thickness | Slope | ↑↓ | |
| Parahippocampal | Area | Baseline | ↑↓ | |||||||||
| Occipital | Lateral occipital | Thickness | Slope | ↑↑ | ||||||||
| Parietal | Postcentral | Thickness | Baseline | ↑↓ | Precuneus | Thickness | Baseline | ↑↑ | ||||
| Inferior parietal | Thickness | Slope | ↑↓ | |||||||||
| Supramarginal | Area | Slope | ↑↑ | |||||||||
| Limbic | Posterior cingulate | Area | Baseline | ↑↑ | Isthmus cingulate | Thickness | Baseline | ↑↑ | ||||
| Posterior cingulate | Area | Baseline | ↑↑ | |||||||||
| Frontal | Precentral | Thickness | Baseline | ↑↓ | Superior frontal | Thickness | Baseline | ↑↓ | Superior frontal | Thickness | Baseline | ↑↓ |
| Superior frontal | Area | Baseline | ↑↓ | Precentral | Area | Baseline | ↑↓ | Caudal middle frontal | Thickness | Slope | ↑↑ | |
| Rostral middle frontal | Thickness | Slope | ↑↓ | |||||||||
Analysis timepoint.
Direction of the association, ↑↓ indicates that as thickness/area/volume goes down, symptoms increase, while ↑↑ indicates that as thickness goes up, symptoms go up.
Results
A series of independent theories were tested in the present study: whether dimensions of symptoms (anxiety, depression, PLEs) would relate to baseline symptomatology, and whether baseline neutral structure would predict symptom trajectories over time (Armstrong, 2014; Cabin & Mitchell, 2000; Fiedler, Kutzner, & Krueger, 2012). There are three distinct theoretically related tests (for anxiety, depression, and PLEs), which were separately predicted for baseline symptomatology as well as symptom trajectories. In addition to correcting for all cortical and subcortical regions within the same model, further correction for comparisons was conducted for each gray matter metric tested (cortical thickness, surface area, and subcortical volume) using Bonferroni thresholds for three tests of one similar hypothesis, resulting in a threshold of 0.016 (see Table 4).
Table 4.
Summary of associations that passed Bonferroni correction
| Region | Metric | TPa | p value | Bonferroni correctionb |
|---|---|---|---|---|
| Psychotic-like experiences | ||||
| Transverse temporal | Thickness | Slope | 0.021 | |
| Fusiform | Thickness | Slope | 0.007 | ✓ |
| Middle temporal | Area | Slope | 0.036 | |
| Lateral occipital | Thickness | Slope | 0.044 | |
| Precentral | Thickness | Baseline | 0.022 | |
| Superior frontal | Area | Baseline | 0.049 | |
| Depressive symptoms | ||||
| Middle temporal | Thickness | Baseline | 0.035 | |
| Inferior temporal | Thickness | Baseline | 0.020 | |
| Entorhinal | Area | Baseline | 0.027 | |
| Parahippocampal | Area | Baseline | 0.012 | ✓ |
| Postcentral | Thickness | Baseline | 0.009 | ✓ |
| Posterior cingulate | Area | Baseline | 0.001 | ✓ |
| Superior frontal | Thickness | Baseline | 0.015 | ✓ |
| Precentral | Area | Baseline | 0.007 | ✓ |
| Anxiety symptoms | ||||
| Entorhinal | Area | Baseline | 0.012 | ✓ |
| Temporal pole | Area | Baseline | 0.038 | |
| Fusiform | Thickness | Slope | 0.044 | |
| Precuneus | Thickness | Baseline | 0.048 | |
| Inferior parietal | Thickness | Slope | 0.035 | |
| Supramarginal | Area | Slope | 0.038 | |
| Isthmus cingulate | Thickness | Baseline | 0.001 | ✓ |
| Posterior cingulate | Area | Baseline | 0.009 | ✓ |
| Superior frontal | Thickness | Baseline | 0.040 | |
| Caudal middle frontal | Thickness | Slope | 0.038 | |
| Rostral middle frontal | Thickness | Slope | 0.037 |
Analysis timepoint.
Threshold set at 0.0167, ✓ indicates the association passed Bonferroni correction.
The baseline sample and symptom trajectory subsample had differences in endorsement of baseline PLEs [those without follow-up data had higher baseline PLE endorsement, t(8643) = −2.552, p = 0.011, Cohen’s d = 0.06], as well as demographic differences in age [those without follow-up data were younger, t (8295.680) = 33.599, p < 0.001, Cohen’s d = 0.71]. These variables were controlled for in trajectory analyses.
PLEs and gray matter morphometry
Lower thickness/area in prefrontal regions including pre-central thickness (β = −0.046, 95% CI −0.086 to 0.007, t = −2.294, p = 0.022) and superior frontal area (β = −0.048, 95% CI −0.096 to −0.0001, t = −1.966, p = 0.049) related to increased baseline PLEs. With regards to symptom trajectories, lower fusiform (β = −0.0289, 95% CI −0.0499 to −0.008, t = −2.696, p = 0.007) and greater transverse temporal thickness (β = 0.0191, 95% CI 0.002–0.035, t = 2.318, p = 0.021) predicted increases in PLEs over time (Fig. 1). Notably, greater lateral occipital (β = 0.024, 95% CI 0.001–0.0480, t = 2.015, p = 0.044) thickness predicted increases in PLEs over time, which was not the case for depressive or anxiety symptoms. Lower middle temporal area (β = −0.029, 95% CI −0.057 to −0.002, t = −2.102, p = 0.036) also predicted increased PLEs over time (Fig. 2).
Fig. 1.

Cortical thickness regions predicting baseline symptoms and symptom trajectories over a 2-year period, accounting for other cortical regions, age, sex, medication use, family income, race, family, and site.
Fig. 2.
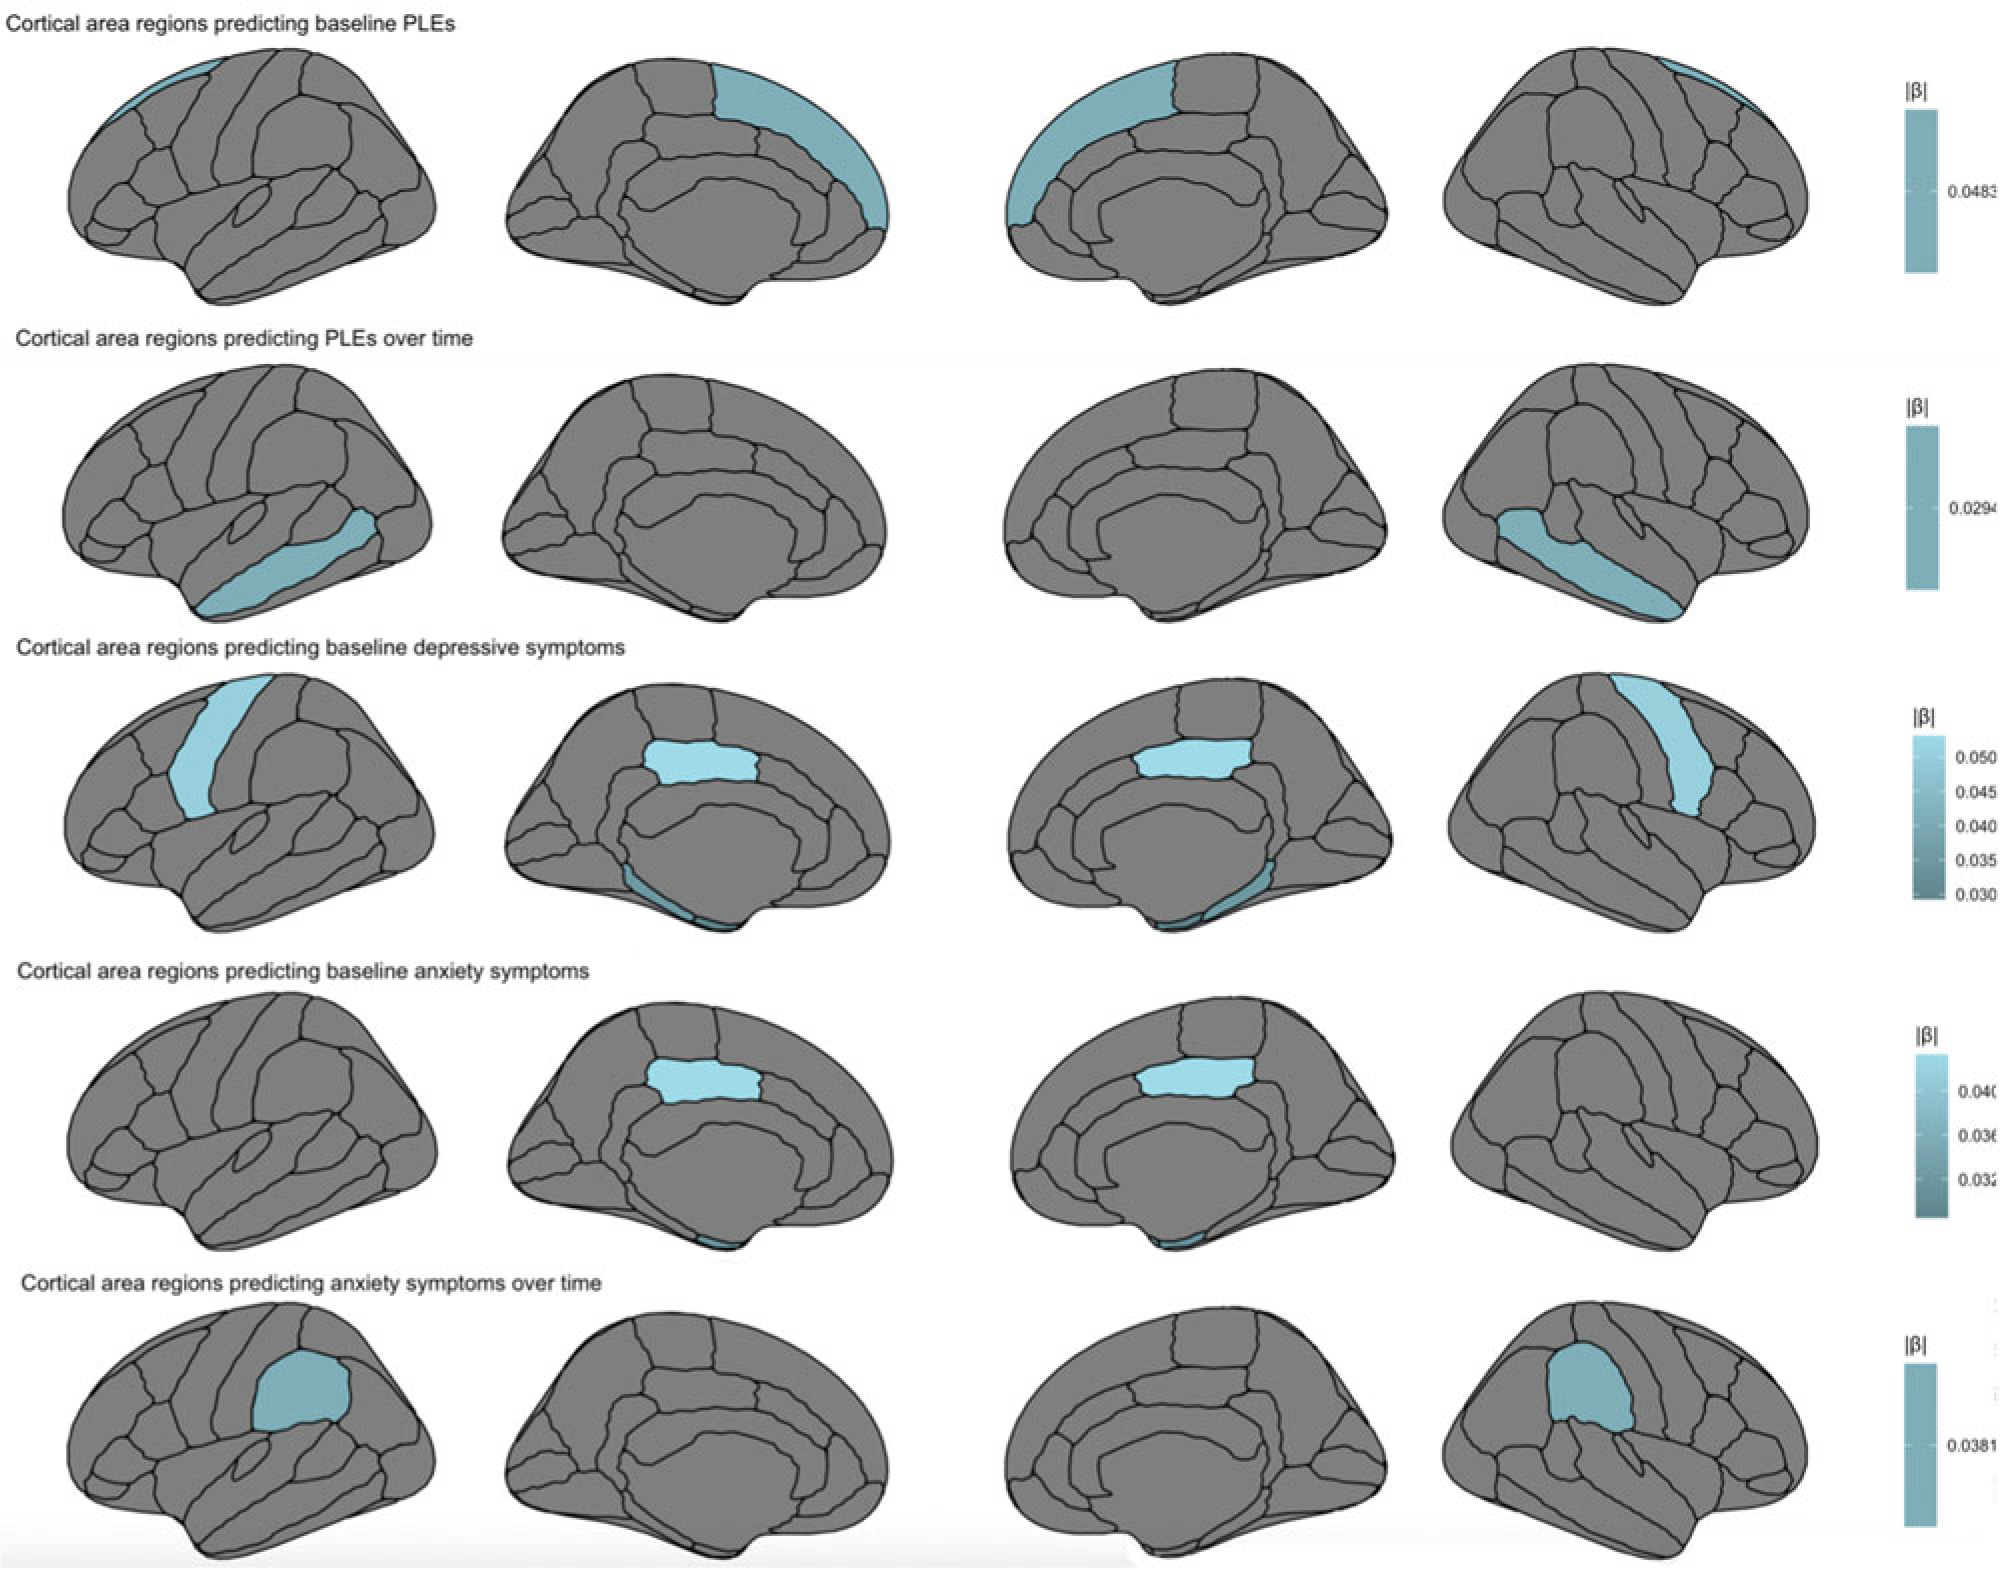
Cortical area regions predicting baseline symptoms and symptom trajectories over a 2-year period, accounting for other cortical regions, age, sex, medication use, family income, race, family, and site.
Depressive symptoms and gray matter morphometry
In temporal regions, lower inferior temporal thickness (β = −0.042, 95% CI −0.078 to 0.007, t = −2.233, p = 0.020) and higher middle temporal thickness (β = 0.043, 95% CI −0.003 to 0.084, t = 2.106, p = 0.035) predicted higher baseline depressive symptoms. In turn, higher entorhinal area (β = −0.029, 95% CI 0.003–0.055, t = −2.217, p = 0.027) and lower parahippocampal area (β = −0.035, 95% CI −0.062 to −0.008, t = −2.525, p = 0.012) predicted greater baseline depressive symptoms. Within parietal regions, lower postcentral thickness (β = −0.045, t = −2.609, p = 0.009) predicted greater baseline depressive symptoms. Similar to PLEs and anxiety symptoms, lower superior frontal thickness (β = −0.057, 95% CI −0.103 to −0.011, t = −2.426, p = 0.015) predicted greater baseline depressive symptoms. Also within frontal lobe, lower precentral area (β = −0.050, 95% CI −0.087 to −0.014, t = −2.693, p = 0.007) predicted increased baseline depressive symptoms. Finally, for limbic regions, greater posterior cingulate area (β = 0.053, 95% CI 0.021–0.086, t = 3.208, p = 0.001) predicted greater baseline depressive symptoms (Fig. 3).
Fig. 3.
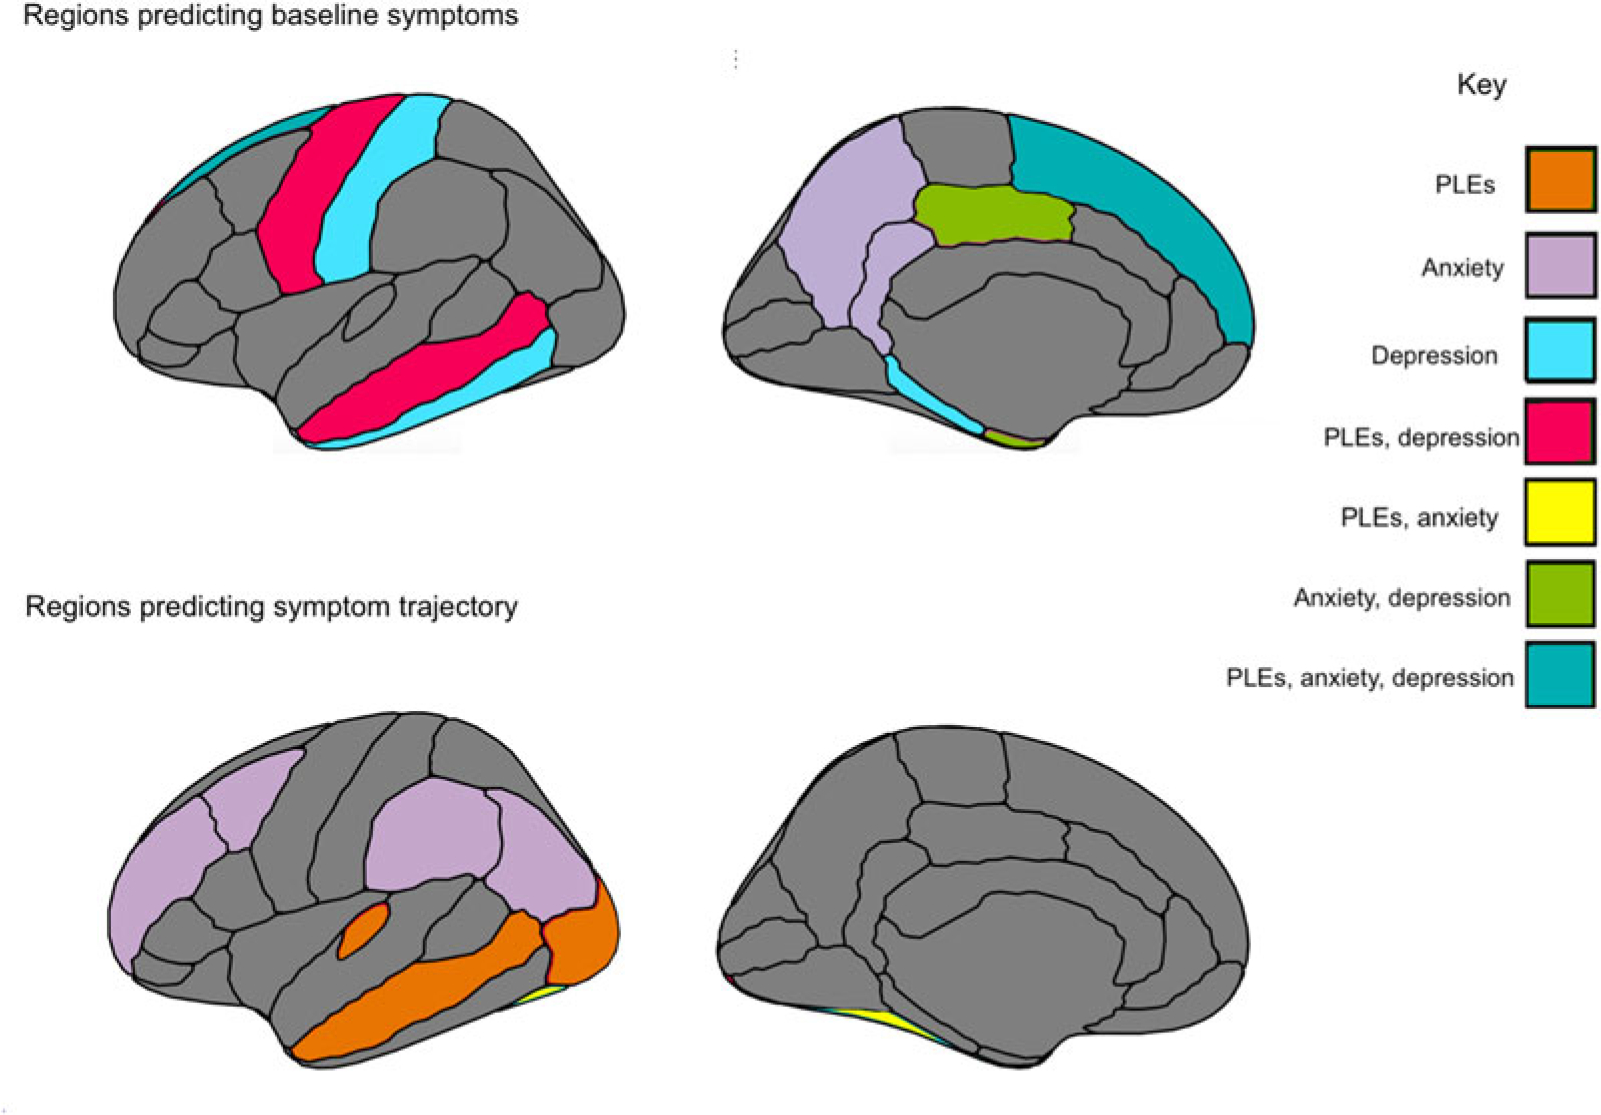
Summary figure of regions for cortical thickness and surface area that related to symptomatology at baseline assessment, and across a 2-year period.
Anxiety symptoms and gray matter morphometry
Several parietal regions related uniquely to anxiety symptoms, including greater precuneus thickness (β = 0.039, 95% CI 0.003–0.079, t = 1.977, p = 0.048) predicting higher baseline anxiety symptoms, and greater supramarginal area (β = 0.038, 95% CI 0.002–0.074, t = 2.082, p = 0.038) predicting increased anxiety symptoms over time, with lower inferior parietal thickness (β = −0.052, 95% CI −0.101 to −0.004, t = −2.113, p = 0.035) predicting increased anxiety symptoms over time. Within temporal lobe, similar to PLEs, lower fusiform thickness (β = −0.037, 95% CI −0.073 to −0.002, t = −2.019, p = 0.044) predicted increased anxiety symptoms over time. Increased entorhinal area (β = 0.031, 95% CI 0.005–0.057, t = 2.333, p = 0.012) predicted increased anxiety symptoms at baseline, as was observed with depressive symptoms. Finally, lower temporal pole area (β = −0.028, 95% CI −0.055 to −0.001, t = −2.069, p = 0.038) uniquely predicted greater anxiety symptoms at baseline (Fig. 4).
Fig. 4.

Symptom trajectories over a 2-year period for PLEs, depressive symptoms, and anxiety symptoms.
Within limbic lobe, higher isthmus cingulate (β = 0.039, 95% CI 0.015–0.062, t = 3.254, p = 0.001) thickness predicted greater baseline anxiety symptoms, as did greater posterior cingulate (β = 0.043, 95% CI 0.012–0.076, t = 2.607, p = 0.009) area. Within prefrontal regions, consistent with depressive symptoms and PLEs, lower superior frontal thickness (β = −0.048, 95% CI −0.094 to −0.002, t = −2.040, p = 0.040) predicted greater baseline anxiety symptoms. Unique to anxiety symptoms, greater caudal middle frontal thickness (β = −0.040, 95% CI 0.0001–0.076, t = 2.075, p = 0.038) and lower rostral middle frontal thickness (β = −0.050, 95% CI −0.095 to −0.002, t = −2.094, p = 0.037) predicted increased anxiety symptoms over time (Table 3).
Discussion
Thickness and area in temporal regions related to symptomatology across PLEs, depressive and anxiety symptoms, offering putative childhood transdiagnostic predictors or neural vulnerability factors (Figure 3). There was also evidence of specificity. PLE symptom trajectory was predicted by lateral occipital thickness, as well as by transverse temporal thickness. With regards to depressive symptoms, symptoms were uniquely predicted by regions implicated in memory recall, including parahippocampal and interior temporal thickness, while both depressive and anxiety symptoms were predicted by limbic cingulate regions implicated in affective and reward processing. Finally, with regards to anxiety symptoms, symptom trajectories were uniquely predicted by parietal regions involved in memory, perception, and multisensory integration; regions included precuneus and inferior parietal thickness, and supramarginal area. The study builds on the broader literature (Ducharme et al., 2014; Durham et al., 2021; Merz, He, & Noble, 2018; Newman et al., 2016; Norbom et al., 2021), contributing additional evidence that vulnerability to psychopathology is observable along with relations to neural structure as early as childhood. Results have the potential toward identifying emergent vulnerability, offering targets for early prevention and intervention.
The current study assessed symptomatology over time and relations to baseline gray matter cortical thickness/surface area and subcortical volume. The whole-brain approach of accounting for all cortical and subcortical regions in the same models allowed for assessing regional effects over and above other cortical and subcortical regions. Notably, superior frontal thickness and area related to PLE, depression, and anxiety symptoms at baseline. In addition, temporal regions predicted symptom trajectories over time, with middle temporal thickness and area relating to PLEs and depressive symptoms, and fusiform thickness relating to PLE and anxiety symptom trajectories across time (Table 2). Perhaps these regions could serve as transdiagnostic vulnerability markers for psychopathology as early as childhood (Beard & Björgvinsson, 2013). Results could represent common vulnerabilities for emerging psychopathology across a 2-year period preceding the tumultuous adolescence period, where further developmental, social, and biological factors further compound vulnerability for mental illness (Cohen, Andrews, Davis, & Rudolph, 2018; Del Re et al., 2021).
Table 2.
Descriptive statistics for baseline symptoms and symptom trajectories
| Variable | Mean (s.d.) | Count (%) symptom increase over timea | Mean (s.d.) slope in participants with symptom increase over time |
|---|---|---|---|
| Psychotic-like experience endorsement | 105 (2.030%) | 0.478 (0.531) | |
| Baseline | 6.080 (6.482) | ||
| Slope | −1.390 (1.554) | ||
| Depressive symptom endorsement | 4206 (81.323%) | 0.163 (0.209) | |
| Baseline | 1.258 (1.431) | ||
| Slope | 0.115 (0.194) | ||
| Anxiety symptom endorsement | 651 (12.587%) | 0.095 (1.091) | |
| Baseline | 2.083 (1.821) | ||
| Slope | −0.096 (0.095) | ||
Participants with a non-zero positive slope.
PLEs
Consistent with predictions, and with a recent investigation on adolescents at clinical high risk for psychosis, PLEs related broadly to thickness across frontal, temporal, and occipital regions, which was not the case with surface area (Del Re et al., 2021). Associations being more prevalent with thickness could reflect vulnerability in related processes, including synaptic pruning, apoptosis, cell shrinkage, and dendritic arborization (Lyall et al., 2015). Specifically, lateral occipital thickness predicted PLE trajectory (which was not the case with anxiety or depressive symptoms), widely consistent with research on youth at clinical high risk for psychosis (Sugranyes et al., 2020; Ziermans et al., 2012), adults with PLEs (Fonville et al., 2019) and early-onset psychosis (Fraguas et al., 2016). PLEs were predicted by regions implicated in language and sensory processing, including transverse temporal, fusiform, medial, and superior temporal regions (Cone, Burman, Bitan, Bolger, & Booth, 2008). Of note, precentral thickness predicted change in PLEs over time, with underlying functions relating to motor control, gestures, and decisionmaking, all critically and etiologically relevant to psychosis pathogenesis (Choudhury et al., 2021; Walther, Mittal, Stegmayer, & Bohlhalter, 2020). The precentral region also predicted depressive symptomatology at baseline, supporting emerging research of motor dysfunction as a transdiagnostic vulnerability marker for both depressive and psychotic disorders (Damme et al., 2021).
Depressive symptomatology
Within the limbic lobe, the posterior cingulate area predicted depressive symptoms, which was also the case with anxiety symptoms. Findings extend observations in the broader adult and adolescent literature involving limbic regions, with underlying functions related to affective processing, in depressive symptomatology (Bora, Fornito, Pantelis, & Yücel, 2012; Hubachek et al., 2021; Jaworska et al., 2016; Wehry et al., 2015). Superior frontal thickness related to increased baseline depressive symptoms, consistent with investigations with diagnosed adolescents and adults (Suh et al., 2019; Wise et al., 2017), as well as cross-sectional and longitudinal studies including children and adolescents (Bos, Peters, van de Kamp, Crone, & Tamnes, 2018; Wehry et al., 2015). With regards to depressive symptoms, there was evidence of specificity with regards to associations within parahippocampal and inferior temporal regions that were not observed for PLEs or anxiety symptoms. Middle temporal regions involved in memory processing and encoding predicted depressive symptoms, including parahippocampal and entorhinal area, with primary projections to the hippocampus, along with middle temporal thickness, consistent with theories of depression and endophenotypes related to memory and recall (Goldstein & Klein, 2014), and with previous neuroimaging findings (Bora et al., 2012; Hubachek, 2021; Jenkins et al., 2020).
Anxiety symptomatology
Anxiety symptoms related to a number of regions relating to memory, multisensory integration, and perception (Newman et al., 2016). Notably, multiple parietal regions predicted symptom trajectory, which was not the case for depressive symptoms or PLEs. Higher supramarginal area and lower inferior parietal thickness predicted increased anxiety symptom endorsement over time. Results are consistent with GAD adult studies, extending these findings to sub-clinical symptomatology in children (Makovac et al., 2016; Molent et al., 2018). Greater precuneus thickness also predicted higher baseline anxiety, consistent with a study in adults with SAD (Syal et al., 2012), a study of volume in adolescents diagnosed with GAD (Strawn et al., 2014), and others of gyrification and volume in adults with GAD (Molent et al., 2018).
Within th temporal lobe, entorhinal and temporal pole area predicted baseline anxiety symptoms, while lower fusiform thickness predicted greater anxiety symptom endorsement over time; results are consistent with a broader literature (Couvy-Duchesne et al., 2018), including adults diagnosed with GAD (Molent et al., 2018) and patients with SAD (Syal et al., 2012). Finally, within the limbic lobe, cingulate regions are related to anxiety symptoms, with isthmus cingulate thickness uniquely relating to anxiety (and not depressive symptoms or PLEs). Greater isthmus cingulate thickness predicted higher anxiety symptoms at baseline, as was found in a study with adults diagnosed with GAD (Carnevali et al., 2019). Additionally, higher posterior cingulate thickness predicted higher anxiety symptoms, consistent with a study on adolescents diagnosed with GAD (Strawn et al., 2013).
Future directions and limitations
Study findings have to bear for conceptualizations of multifinality, finding some evidence of processes contributing to divergence in outcomes given common origins (transdiagnostic vulnerability markers) (Cicchetti & Rogosch, 1996). A growing literature has found evidence for a ‘common’ vulnerability emerging during childhood, theorizing that going into adolescence, structural neurodevelopmental changes and environmental factors ultimately determine distinct trajectories with regards to psychopathology (Cohen et al., 2018). Others have additionally found that even among those that exhibit a common vulnerability, the unique components of anxiety and depression grow independently over time (Conway, Zinbarg, Mineka, & Craske, 2017). Current results are a starting point with regards to conceptualizations of features predicting symptom trajectories in the critical years prior to typical disorder onset during adolescence and early adulthood. Future studies delineating orthogonal and general psychopathology factors and relations to neural structure longitudinally would provide further insight into common v. unique neural vulnerability. Similarly, results lend support to HiTOP and dimensional models of psychopathology, affirming the utility of assessing symptomatology on a spectrum (Kotov et al., 2021; Krueger & Markon, 2011). The identification of neural markers of vulnerability is also in line with RDoC aims of identifying unique and transdiagnostic markers of vulnerability at multiple levels of analysis, including parent and youth-reported symptomatology and brain metrics (Casey, Oliveri, & Insel, 2014).
Notably, anxiety and depressive symptoms did not relate to specific subcortical structures (over and above other subcortical regions), countering a wide literature finding relations with subcortical regions implicated in affect regulation and threat sensitivity (Bos et al., 2018; Kaczkurkin et al., 2019; Kribakaran, Danese, Bromis, Kempton, & Gee, 2020; Taylor et al., 2020). Future studies incorporating more timepoints, a greater variety of symptomatology, and more diverse samples will be helpful to clarify future understanding. With regards to PLEs, relations between symptoms and prefrontal regions were localized to the precentral region, which is partially inconsistent with specificity theories of prefrontal dysfunction in schizophrenia, which posit a broader dysfunction across the frontal lobe (Callicott et al., 2003; Muller, 1985). Future studies examining the emergence of dysfunction relative to stages of neurodevelopment and symptom severity will further inform these questions.
Study observations represent a promising first step in identifying key regions that could have etiological relevance to certain symptom dimensions. The present investigation did not collect information on clinician-rated diagnostic categories, and this is a critical future direction. In addition, studies enriched for a greater proportion of individuals diagnosed with mental disorders would provide a greater understanding of more severe symptom and brain structure manifestation (especially given that restricted range in the current study could have impacted the magnitude of effects (Figure 4)). Future studies expanding beyond this study’s age range across the life span would much strengthen the understanding of neurodevelopmental differences and contributors to vulnerability across the lifetime. Of note, especially given the small effect sizes observed, it will be critical to establish whether effects are clinically meaningful by exploring whether the altered structure in these regions maps on to other functional and social dysfunction related to symptomatology. Further, the current study was exploratory in its aim of determining gray matter morphometry features that could relate to domains of symptomatology. Future investigations could build on results with more specific hypotheses based on specific neural regions, allowing for more targeted correction criteria.
Supplementary Material
Acknowledgements.
Data used in the preparation of this article were obtained from the Adolescent Brain Cognitive Development (ABCD) Study (https://abcdstudy.org), held in the NIMH Data Archive (NDA). This is a multisite, longitudinal study designed to recruit more than 10 000 children age 9–10 and follow them over 10 years into early adulthood. The ABCD Study is supported by the National Institutes of Health and additional federal partners under award numbers U01DA041022, U01DA041028, U01DA041048, U01DA041089, U01DA041106, U01DA041117, U01DA041120, U01DA041134, U01DA041148, U01DA041156, U01DA041174, U24DA041123, U24DA041147, U01DA041093, and U01DA041025. A full list of supporters is available at https://abcdstudy.org/federal-partners.html. A listing of participating sites and a complete listing of the study investigators can be found at https://abcdstudy.org/Consortium_Members.pdf. ABCD consortium investigators designed and implemented the study and/or provided data but did not necessarily participate in the analysis or writing of this report. This manuscript reflects the views of the authors and may not reflect the opinions or views of the NIH or ABCD consortium investigators. The ABCD data repository grows and changes over time. The ABCD data used in this report came from [NIMH Data Archive Digital Object Identifier (DOI) 10.15154/1506121]. DOIs can be found at https://nda.nih.gov/general-query.html?q=query=studies%20~and~%20orderBy=id%20~and~%20orderDirection=Ascending.
Financial support.
The research reported in this manuscript was also supported by the National Institute of Mental Health of the National Institutes of Health under Award Number F31MH119776 (T.V.). The content is solely the responsibility of the authors and does not necessarily represent the official views of the National Institutes of Health.
Footnotes
Conflict of interest. None.
Ethical standards. The authors assert that all procedures contributing to this work comply with the ethical standards of the relevant national and institutional committees on human experimentation and with the Helsinki Declaration of 1975, as revised in 2008. The authors assert that all procedures contributing to this work comply with the ethical standards of the relevant national and institutional guides on the care and use of laboratory animals.
Supplementary material. The supplementary material for this article can be found at https://doi.org/10.1017/S0033291721005304.
References
- Achenbach TM, Dumenci L, & Rescorla LA (2003). DSM-oriented and empirically based approaches to constructing scales from the same item pools. Journal of Clinical Child and Adolescent Psychology, 32(3), 328–340. doi: 10.1207/S15374424JCCP3203_02 [DOI] [PubMed] [Google Scholar]
- Armstrong RA (2014). When to use the Bonferroni correction. Ophthalmic and Physiological Optics, 34(5), 502–508. doi: 10.1111/opo.12131 [DOI] [PubMed] [Google Scholar]
- Barch DM, Albaugh MD, Avenevoli S, Chang L, Clark DB, Glantz MD, … Yurgelun-Todd D (2018). Demographic, physical and mental health assessments in the adolescent brain and cognitive development study: Rationale and description. Developmental Cognitive Neuroscience, 32, 55–66. doi: 10.1016/j.dcn.2017.10.010 [DOI] [PMC free article] [PubMed] [Google Scholar]
- Bas-Hoogendam JM, van Steenbergen H, Tissier RL, Houwing-Duistermaat JJ, Westenberg PM, & van der Wee NJ (2018). Subcortical brain volumes, cortical thickness and cortical surface area in families genetically enriched for social anxiety disorder – A multiplex multigenerational neuroimaging study. EBioMedicine, 36, 410–428. doi: 10.1016/j.ebiom.2018.08.048 [DOI] [PMC free article] [PubMed] [Google Scholar]
- Beard C, & Björgvinsson T (2013). Psychological vulnerability: An integrative approach. Journal of Psychotherapy Integration, 23(3), 281–283. doi: 10.1037/a0032361 [DOI] [Google Scholar]
- Bora E, Fornito A, Pantelis C, & Yücel M (2012). Gray matter abnormalities in major depressive disorder: A meta-analysis of voxel based morphometry studies. Journal of Affective Disorders, 138(1–2), 9–18. doi: 10.1016/j.jad.2011.03.049 [DOI] [PubMed] [Google Scholar]
- Bos MG, Peters S, van de Kamp FC, Crone EA, & Tamnes CK (2018). Emerging depression in adolescence coincides with accelerated frontal cortical thinning. Journal of Child Psychology and Psychiatry, 59 (9), 994–1002. doi: 10.1111/jcpp.12895 [DOI] [PMC free article] [PubMed] [Google Scholar]
- Cabin RJ, & Mitchell RJ (2000). To Bonferroni or not to Bonferroni: When and how are the questions. Bulletin of the Ecological Society of America, 81(3), 246–248. doi: 10.2307/20168454 [DOI] [Google Scholar]
- Callicott JH, Mattay VS, Verchinski BA, Marenco S, Egan MF, & Weinberger DR (2003). Complexity of prefrontal cortical dysfunction in schizophrenia: More than up or down. American Journal of Psychiatry, 160(12), 2209–2215. doi: 10.1176/appi.ajp.160.12.2209 [DOI] [PubMed] [Google Scholar]
- Canu E, Kostić M, Agosta F, Munjiza A, Ferraro PM, Pesic D, … Filippi M (2015). Brain structural abnormalities in patients with major depression with or without generalized anxiety disorder comorbidity. Journal of Neurology, 262(5), 1255–1265. doi: 10.1007/s00415-015-7701-z [DOI] [PubMed] [Google Scholar]
- Carnevali L, Mancini M, Koenig J, Makovac E, Watson DR, Meeten F, … Ottaviani C (2019). Cortical morphometric predictors of autonomic dysfunction in generalized anxiety disorder. Autonomic Neuroscience, 217, 41–48. doi: 10.1016/j.autneu.2019.01.001 [DOI] [PubMed] [Google Scholar]
- Casey B, Cannonier T, Conley MI, Cohen AO, Barch DM, Heitzeg MM, … Garavan H (2018). The adolescent brain cognitive development (ABCD) study: Imaging acquisition across 21 sites. Developmental Cognitive Neuroscience, 32, 43–54. doi: 10.1016/j.dcn.2018.03.001 [DOI] [PMC free article] [PubMed] [Google Scholar]
- Casey B, Oliveri ME, & Insel T (2014). A neurodevelopmental perspective on the research domain criteria (RDoC) framework. Biological Psychiatry, 76(5), 350–353. doi: 10.1016/j.biopsych.2014.01.006 [DOI] [PubMed] [Google Scholar]
- Castagna PJ, Roye S, Calamia M, Owens-French J, Davis TE, & Greening SG (2018). Parsing the neural correlates of anxious apprehension and anxious arousal in the grey-matter of healthy youth. Brain Imaging and Behavior, 12(4), 1084–1098. doi: 10.1007/s11682-017-9772-1 [DOI] [PubMed] [Google Scholar]
- Chiapponi C, Piras F, Fagioli S, Piras F, Caltagirone C, & Spalletta G (2013). Age-related brain trajectories in schizophrenia: A systematic review of structural MRI studies. Psychiatry Research: Neuroimaging, 214(2), 83–93. doi: 10.1016/j.pscychresns.2013.05.003 [DOI] [PubMed] [Google Scholar]
- Choudhury M, Steines M, Nagels A, Riedl L, Kircher T, & Straube B (2021). Neural basis of speech-gesture mismatch detection in schizophrenia spectrum disorders. Schizophrenia Bulletin, 47(6), 1761–1771. doi: 10.1093/schbul/sbab059 [DOI] [PMC free article] [PubMed] [Google Scholar]
- Cicchetti D, & Rogosch FA (1996). Equifinality and multifinality in developmental psychopathology. Development and Psychopathology, 8(4), 597–600. doi: 10.1017/S0954579400007318 [DOI] [Google Scholar]
- Cohen JR, Andrews AR, Davis MM, & Rudolph KD (2018). Anxiety and depression during childhood and adolescence: Testing theoretical models of continuity and discontinuity. Journal of Abnormal Child Psychology, 46(6), 1295–1308. doi: 10.1007/s10802-017-0370-x [DOI] [PMC free article] [PubMed] [Google Scholar]
- Cone NE, Burman DD, Bitan T, Bolger DJ, & Booth JR (2008). Developmental changes in brain regions involved in phonological and orthographic processing during spoken language processing. Neuroimage, 41(2), 623–635. doi: 10.1016/j.neuroimage.2008.02.055 [DOI] [PMC free article] [PubMed] [Google Scholar]
- Conway CC, Zinbarg RE, Mineka S, & Craske MG (2017). Core dimensions of anxiety and depression change independently during adolescence. Journal of Abnormal Psychology, 126(2), 160–172. doi: 10.1037/abn0000222 [DOI] [PMC free article] [PubMed] [Google Scholar]
- Costello EJ, Mustillo S, Erkanli A, Keeler G, & Angold A (2003). Prevalence and development of psychiatric disorders in childhood and adolescence. Archives of General Psychiatry, 60(8), 837–844. doi: 10.1001/archpsyc.60.8.837 [DOI] [PubMed] [Google Scholar]
- Couvy-Duchesne B, Strike LT, de Zubicaray GI, McMahon KL, Thompson PM, Hickie IB, … Wright MJ (2018). Lingual gyrus surface area is associated with anxiety-depression severity in young adults: A genetic clustering approach. Eneuro, 5(1), 1–14. doi: 10.1523/ENEURO.0153-17.2017. [DOI] [PMC free article] [PubMed] [Google Scholar]
- Damme KS, Park JS, Vargas T, Walther S, Shankman SA, & Mittal VA (2021). Motor abnormalities, depression risk, and clinical course in adolescence. Biological Psychiatry Global Open Science. doi: 10.1016/j.bpsgos.2021.06.011 [DOI] [PMC free article] [PubMed] [Google Scholar]
- Del Re EC, Stone WS, Bouix S, Seitz J, Zeng V, Guliano A, … Lyall A (2021). Baseline cortical thickness reductions in clinical high risk for psychosis: Brain regions associated with conversion to psychosis versus non-conversion as assessed at one-year follow-up in the shanghai-at-risk-for-psychosis (SHARP) study. Schizophrenia Bulletin, 47 (2), 562–574. doi: 10.1093/schbul/sbaa127 [DOI] [PMC free article] [PubMed] [Google Scholar]
- Ducharme S, Albaugh MD, Hudziak JJ, Botteron KN, Nguyen T-V, Truong C, … Byars AW (2014). Anxious/depressed symptoms are linked to right ventromedial prefrontal cortical thickness maturation in healthy children and young adults. Cerebral Cortex, 24(11), 2941–2950. doi: 10.1093/cercor/bht151 [DOI] [PMC free article] [PubMed] [Google Scholar]
- Durham EL, Jeong HJ, Moore TM, Dupont RM, Cardenas-Iniguez C, Cui Z, … Kaczkurkin AN (2021). Association of gray matter volumes with general and specific dimensions of psychopathology in children. Neuropsychopharmacology, 46(7), 1–7. doi: 10.1038/s41386-020-00952-w [DOI] [PMC free article] [PubMed] [Google Scholar]
- Fiedler K, Kutzner F, & Krueger JI (2012). The long way from α-error control to validity proper: Problems with a short-sighted false-positive debate. Perspectives on Psychological Science, 7(6), 661–669. doi: 10.1177/1745691612462587 [DOI] [PubMed] [Google Scholar]
- Fischl B, Salat DH, Busa E, Albert M, Dieterich M, Haselgrove C, … Klaveness S (2002). Whole brain segmentation: Automated labeling of neuroanatomical structures in the human brain. Neuron, 33(3), 341–355. doi: 10.1016/s0896-6273(02)00569-x [DOI] [PubMed] [Google Scholar]
- Fischl B, Sereno MI, Tootell RB, & Dale AM (1999). High-resolution intersubject averaging and a coordinate system for the cortical surface. Human Brain Mapping, 8(4), 272–284. doi: [DOI] [PMC free article] [PubMed] [Google Scholar]
- Fonville L, Drakesmith M, Zammit S, Lewis G, Jones DK, & David AS (2019). MRI indices of cortical development in young people with psychotic experiences: Influence of genetic risk and persistence of symptoms. Schizophrenia Bulletin, 45(1), 169–179. doi: 10.1093/schbul/sbx195 [DOI] [PMC free article] [PubMed] [Google Scholar]
- Forbes M, Stefler D, Velakoulis D, Stuckey S, Trudel J-F, Eyre H, … Kisely S (2019). The clinical utility of structural neuroimaging in first-episode psychosis: A systematic review. Australian & New Zealand Journal of Psychiatry, 53(11), 1093–1104. doi: 10.1177/0004867419848035 [DOI] [PubMed] [Google Scholar]
- Fox J WS (2019). An R companion to applied regression (version 3). Thousand Oaks, CA: Sage. Retrieved from https://socialsciences.mcmaster.ca/jfox/Books/Companion/. [Google Scholar]
- Fraguas D, Díaz-Caneja CM, Pina-Camacho L, Janssen J, & Arango C (2016). Progressive brain changes in children and adolescents with early-onset psychosis: A meta-analysis of longitudinal MRI studies. Schizophrenia Research, 173(3), 132–139. doi: 10.1016/j.schres.2014.12.022 [DOI] [PubMed] [Google Scholar]
- Freitas-Ferrari MC, Hallak JE, Trzesniak C, Santos Filho A, Machado-de-Sousa JP, Chagas MHN, … Crippa JAS (2010). Neuroimaging in social anxiety disorder: A systematic review of the literature. Progress in Neuro-Psychopharmacology and Biological Psychiatry, 34 (4), 565–580. doi: 10.1016/j.pnpbp.2010.02.028 [DOI] [PubMed] [Google Scholar]
- Frick A, Howner K, Fischer H, Eskildsen SF, Kristiansson M, & Furmark T (2013). Cortical thickness alterations in social anxiety disorder. Neuroscience Letters, 536, 52–55. doi: 10.1016/j.neulet.2012.12.060 [DOI] [PubMed] [Google Scholar]
- Frodl T, Janowitz D, Schmaal L, Tozzi L, Dobrowolny H, Stein DJ, … Jahanshad N (2017). Childhood adversity impacts on brain subcortical structures relevant to depression. Journal of Psychiatric Research, 86, 58–65. doi: 10.1016/j.jpsychires.2016.11.010 [DOI] [PMC free article] [PubMed] [Google Scholar]
- Garcia K, Kroenke C, & Bayly P (2018). Mechanics of cortical folding: Stress, growth and stability. Philosophical Transactions of the Royal Society B: Biological Sciences, 373(1759), 20170321. doi: 10.1098/rstb.2017.0321 [DOI] [PMC free article] [PubMed] [Google Scholar]
- Gogtay N, Giedd JN, Lusk L, Hayashi KM, Greenstein D, Vaituzis AC, … Toga AW (2004). Dynamic mapping of human cortical development during childhood through early adulthood. Proceedings of the National Academy of Sciences, 101(21), 8174–8179. doi: 10.1073/pnas.0402680101 [DOI] [PMC free article] [PubMed] [Google Scholar]
- Goldstein BL, & Klein DN (2014). A review of selected candidate endophenotypes for depression. Clinical Psychology Review, 34(5), 417–427. doi: 10.1016/j.cpr.2014.06.003 [DOI] [PMC free article] [PubMed] [Google Scholar]
- Hagler DJ Jr, Hatton S, Cornejo MD, Makowski C, Fair DA, Dick AS, … Harms MP (2019). Image processing and analysis methods for the adolescent brain cognitive development study. Neuroimage, 202, 116091. doi: 10.1016/j.neuroimage.2019.116091 [DOI] [PMC free article] [PubMed] [Google Scholar]
- Heeringa SG, & Berglund PA (2020). A guide for population-based analysis of the adolescent brain cognitive development (ABCD) study baseline data. BioRxiv, 202, 116091. https://www.ncbi.nlm.nih.gov/pmc/articles/PMC6981278/pdf/nihms-1543097.pdf. [Google Scholar]
- Hubachek S, Botdorf M, Riggins T, Leong H-C, Klein DN, & Dougherty LR (2021). Hippocampal subregion volume in high-risk offspring is associated with increases in depressive symptoms across the transition to adolescence. Journal of Affective Disorders, 281, 358–366. doi: 10.1016/j.jad.2020.12.017 [DOI] [PMC free article] [PubMed] [Google Scholar]
- Hubachek SQ (2021). Hippocampal subregion volume in high-risk offspring predicts increases in depressive symptoms across the transition to adolescence. Journal of Affective Disorders, 358–366. https://www.proquest.com/docview/2496999030?pqorigsite=gscholar&fromopenview=true [DOI] [PMC free article] [PubMed] [Google Scholar]
- Jaworska N, Yücel K, Courtright A, MacMaster FP, Sembo M, & MacQueen G (2016). Subgenual anterior cingulate cortex and hippocampal volumes in depressed youth: The role of comorbidity and age. Journal of Affective Disorders, 190, 726–732. doi: 10.1016/j.jad.2015.10.064 [DOI] [PubMed] [Google Scholar]
- Jenkins LM, Chiang JJ, Vause K, Hoffer L, Alpert K, Parrish TB, … Wang L (2020). Outward subcortical curvature associated with sub-clinical depression symptoms in adolescents. NeuroImage: Clinical, 25, 102187. doi: 10.1016/j.nicl.2020.102187 [DOI] [PMC free article] [PubMed] [Google Scholar]
- Jeon T, Mishra V, Ouyang M, Chen M, & Huang H (2015). Synchronous changes of cortical thickness and corresponding white matter microstructure during brain development accessed by diffusion MRI tractography from parcellated cortex. Frontiers in Neuroanatomy, 9, 158. doi: 10.3389/fnana.2015.00158 [DOI] [PMC free article] [PubMed] [Google Scholar]
- Kaczkurkin AN, Park SS, Sotiras A, Moore TM, Calkins ME, Cieslak M, … Cui Z (2019). Evidence for dissociable linkage of dimensions of psychopathology to brain structure in youths. American Journal of Psychiatry, 176(12), 1000–1009. doi: 10.1176/appi.ajp.2019.18070835 [DOI] [PMC free article] [PubMed] [Google Scholar]
- Karcher NR, Barch DM, Avenevoli S, Savill M, Huber RS, Simon TJ, … Loewy RL (2018). Assessment of the prodromal questionnaire – brief child version for measurement of self-reported psychotic like experiences in childhood. JAMA Psychiatry, 75(8), 853–861. doi: 10.1001/jamapsychiatry.2018.1334 [DOI] [PMC free article] [PubMed] [Google Scholar]
- Kelleher I, & Cannon M (2011). Psychotic-like experiences in the general population: Characterizing a high-risk group for psychosis. Psychological Medicine, 41(1), 1–6. doi: 10.1017/S0033291710001005 [DOI] [PubMed] [Google Scholar]
- Keyes KM, Gary D, O’Malley PM, Hamilton A, & Schulenberg J (2019). Recent increases in depressive symptoms among US adolescents: Trends from 1991 to 2018. Social Psychiatry and Psychiatric Epidemiology, 54(8), 987–996. doi: 10.1007/s00127-019-01697-8 [DOI] [PMC free article] [PubMed] [Google Scholar]
- Kline E, Thompson E, Bussell K, Pitts SC, Reeves G, & Schiffman J (2014). Psychosis-like experiences and distress among adolescents using mental health services. Schizophrenia Research, 152(2–3), 498–502. doi: 10.1016/j.schres.2013.12.012 [DOI] [PubMed] [Google Scholar]
- Kotov R, Krueger RF, Watson D, Cicero DC, Conway CC, DeYoung CG, … Latzman RD (2021). The hierarchical taxonomy of psychopathology (HiTOP): A quantitative nosology based on consensus of evidence. Annual Review of Clinical Psychology, 17, 83–108. doi: 10.1146/annurev-clinpsy-081219-093304 [DOI] [PubMed] [Google Scholar]
- Kribakaran S, Danese A, Bromis K, Kempton M, & Gee D (2020). Meta-analysis of structural MRI studies in pediatric PTSD and comparison with related conditions. Biological Psychiatry: Cognitive Neuroscience and Neuroimaging, 5(1), 23–34. doi: 10.1016/j.bpsc.2019.08.006 [DOI] [PMC free article] [PubMed] [Google Scholar]
- Krueger RF, & Markon KE (2011). A dimensional-spectrum model of psychopathology: Progress and opportunities. Archives of General Psychiatry, 68(1), 10–11. doi: 10.1001/archgenpsychiatry.2010.188 [DOI] [PubMed] [Google Scholar]
- Laurens KR, Hodgins S, Maughan B, Murray RM, Rutter ML, & Taylor EA (2007). Community screening for psychotic-like experiences and other putative antecedents of schizophrenia in children aged 9–12 years. Schizophrenia Research, 90(1–3), 130–146. doi: 10.1016/j.schres.2006.11.006 [DOI] [PubMed] [Google Scholar]
- Lyall AE, Shi F, Geng X, Woolson S, Li G, Wang L, … Gilmore JH (2015). Dynamic development of regional cortical thickness and surface area in early childhood. Cerebral Cortex, 25(8), 2204–2212. doi: 10.1093/cercor/bhu027 [DOI] [PMC free article] [PubMed] [Google Scholar]
- Maglanoc LA, Kaufmann T, Jonassen R, Hilland E, Beck D, Landrø NI, & Westlye LT (2020). Multimodal fusion of structural and functional brain imaging in depression using linked independent component analysis. Human Brain Mapping, 41(1), 241–255. doi: 10.1002/hbm.24802 [DOI] [PMC free article] [PubMed] [Google Scholar]
- Makovac E, Meeten F, Watson DR, Garfinkel SN, Critchley HD, & Ottaviani C (2016). Neurostructural abnormalities associated with axes of emotion dysregulation in generalized anxiety. NeuroImage: Clinical, 10, 172–181. doi: 10.1016/j.nicl.2015.11.022 [DOI] [PMC free article] [PubMed] [Google Scholar]
- Merz EC, He X, & Noble KG (2018). Anxiety, depression, impulsivity, and brain structure in children and adolescents. NeuroImage: Clinical, 20, 243–251. doi: 10.1016/j.nicl.2018.07.020 [DOI] [PMC free article] [PubMed] [Google Scholar]
- Molent C, Maggioni E, Cecchetto F, Garzitto M, Piccin S, Bonivento C, … Perna G (2018). Reduced cortical thickness and increased gyrification in generalized anxiety disorder: A 3 T MRI study. Psychological Medicine, 48(12), 2001–2010. doi: 10.1017/S003329171700352X [DOI] [PubMed] [Google Scholar]
- Mowinckel AM, & Vidal-Piñeiro D (2020). Visualization of brain statistics with R packages ggseg and ggseg3d. Advances in Methods and Practices in Psychological Science, 3(4), 466–483. doi: 10.1177/2515245920928009 [DOI] [Google Scholar]
- Muller H (1985). Prefrontal cortex dysfunction as a common factor in psychosis. Acta Psychiatrica Scandinavica, 71(5), 431–440. doi: 10.1111/j.1600-0447.1985.tb05055.x [DOI] [PubMed] [Google Scholar]
- Newman E, Thompson WK, Bartsch H, Hagler DJ, Chen C-H, Brown TT, … Libiger O (2016). Anxiety is related to indices of cortical maturation in typically developing children and adolescents. Brain Structure and Function, 221(6), 3013–3025. doi: 10.1007/s00429-015-1085-9 [DOI] [PMC free article] [PubMed] [Google Scholar]
- Norbom LB, Ferschmann L, Parker N, Agartz I, Andreassen OA, Paus T, … Tamnes CK (2021). New insights into the dynamic development of the cerebral cortex in childhood and adolescence: Integrating macro-and microstructural MRI findings. Progress in Neurobiology, 204, 102109. doi: 10.1016/j.pneurobio.2021.102109 [DOI] [PubMed] [Google Scholar]
- Pagliaccio D, Alqueza KL, Marsh R, & Auerbach RP (2020). Brain volume abnormalities in youth at high risk for depression: Adolescent brain and cognitive development study. Journal of the American Academy of Child & Adolescent Psychiatry, 59(10), 1178–1188. doi: 10.1016/j.jaac.2019.09.032 [DOI] [PMC free article] [PubMed] [Google Scholar]
- Papanastasiou E, Mouchlianitis E, Joyce DW, McGuire P, Boussebaa C, Banaschewski T, … Desrivières S (2020). Examination of the neural basis of psychotic-like experiences in adolescence during processing of emotional faces. Scientific Reports, 10(1), 1–11. doi: 10.1038/s41598-020-62026-7 [DOI] [PMC free article] [PubMed] [Google Scholar]
- Pinheiro J, Bates D, DebRoy S, Sarkar D, Heisterkamp S, Van Willigen B, & Maintainer R (2021). nlme: Linear and nonlinear mixed effects models. R package version 3.1–153. Retrieved from https://CRAN.R-project.org/package=nlme. [Google Scholar]
- Schmaal L, Hibar D, Sämann P, Hall G, Baune B, Jahanshad N, … Ikram M (2017). Cortical abnormalities in adults and adolescents with major depression based on brain scans from 20 cohorts worldwide in the ENIGMA major depressive disorder working group. Molecular Psychiatry, 22(6), 900–909. doi: 10.1038/mp.2016.60 [DOI] [PMC free article] [PubMed] [Google Scholar]
- Shepherd AM, Laurens KR, Matheson SL, Carr VJ, & Green MJ (2012). Systematic meta-review and quality assessment of the structural brain alterations in schizophrenia. Neuroscience & Biobehavioral Reviews, 36(4), 1342–1356. doi: 10.1016/j.neubiorev.2011.12.015 [DOI] [PubMed] [Google Scholar]
- Strawn JR, Wegman CJ, Dominick KC, Swartz MS, Wehry AM, Patino LR, … DelBello MP (2014). Cortical surface anatomy in pediatric patients with generalized anxiety disorder. Journal of Anxiety Disorders, 28(7), 717–723. doi: 10.1016/j.janxdis.2014.07.012 [DOI] [PubMed] [Google Scholar]
- Strawn JR, Wehry AM, Chu WJ, Adler CM, Eliassen JC, Cerullo MA, … DelBello MP (2013). Neuroanatomic abnormalities in adolescents with generalized anxiety disorder: A voxel-based morphometry study. Depression and Anxiety, 30(9), 842–848. doi: 10.1002/da.22089 [DOI] [PubMed] [Google Scholar]
- Sugranyes G, de la Serna E, Ilzarbe D, Pariente JC, Borras R, Romero S, … Bernardo M (2020). Brain structural trajectories in youth at familial risk for schizophrenia or bipolar disorder according to development of psychosis spectrum symptoms. Journal of Child Psychology and Psychiatry, 62 (6), 780–789. doi: 10.1111/jcpp.13321 [DOI] [PubMed] [Google Scholar]
- Suh JS, Schneider MA, Minuzzi L, MacQueen GM, Strother SC, Kennedy SH, & Frey BN (2019). Cortical thickness in major depressive disorder: A systematic review and meta-analysis. Progress in Neuro-Psychopharmacology and Biological Psychiatry, 88, 287–302. doi: 10.1016/j.pnpbp.2018.08.008 [DOI] [PubMed] [Google Scholar]
- Syal S, Hattingh CJ, Fouché J-P, Spottiswoode B, Carey PD, Lochner C, & Stein DJ (2012). Grey matter abnormalities in social anxiety disorder: A pilot study. Metabolic Brain Disease, 27(3), 299–309. doi: 10.1007/s11011-012-9299-5 [DOI] [PubMed] [Google Scholar]
- Tamnes CK, Herting MM, Goddings A-L, Meuwese R, Blakemore S-J, Dahl RE, … Crone EA (2017). Development of the cerebral cortex across adolescence: A multisample study of inter-related longitudinal changes in cortical volume, surface area, and thickness. Journal of Neuroscience, 37(12), 3402–3412. doi: 10.1523/JNEUROSCI.3302-16.2017 [DOI] [PMC free article] [PubMed] [Google Scholar]
- Taylor BK, Eastman JA, Frenzel MR, Embury CM, Wang Y-P, Stephen JM, … Wilson TW (2020). Subclinical anxiety and posttraumatic stress influence cortical thinning during adolescence. Journal of the American Academy of Child & Adolescent Psychiatry, 60(10), 1288–1299. doi: 10.1016/j.jaac.2020.11.020 [DOI] [PMC free article] [PubMed] [Google Scholar]
- Team, R. (2018). RStudio: integrated development for R. RStudio, PBC, Boston, MA. Retrieved from http://www.rstudio.com/. [Google Scholar]
- Vieira S, Gong Q-Y, Pinaya WH, Scarpazza C, Tognin S, Crespo-Facorro B, … Scheepers FE (2020). Using machine learning and structural neuroimaging to detect first episode psychosis: Reconsidering the evidence. Schizophrenia Bulletin, 46(1), 17–26. doi: 10.1093/schbul/sby189 [DOI] [PMC free article] [PubMed] [Google Scholar]
- Wadsworth ME, Hudziak JJ, Heath AC, & Achenbach TM (2001). Latent class analysis of child behavior checklist anxiety/depression in children and adolescents. Journal of the American Academy of Child & Adolescent Psychiatry, 40(1), 106–114. doi: 10.1097/00004583-200101000-00023 [DOI] [PubMed] [Google Scholar]
- Walther S,Mittal VA,Stegmayer K,&Bohlhalter S.(2020).Gesturedeficitsand apraxia in schizophrenia. Cortex, 133, 65–75. doi: 10.1016/j.cortex.2020.09.017 [DOI] [PMC free article] [PubMed] [Google Scholar]
- Wehry AM., McNamara RK., Adler CM, Eliassen JC, Croarkin P, Cerullo MA, … Strawn JR. (2015). Neurostructural impact of co-occurring anxiety in pediatric patients with major depressive disorder: A voxel-based morphometry study. Journal of Affective Disorders, 171, 54–59. doi: 10.1016/j.jad.2014.09.004 [DOI] [PubMed] [Google Scholar]
- Wierenga LM, Langen M, Oranje B, & Durston S (2014). Unique developmental trajectories of cortical thickness and surface area. Neuroimage, 87, 120–126. doi: 10.1016/j.neuroimage.2013.11.010 [DOI] [PubMed] [Google Scholar]
- Wise T, Radua J, Via E, Cardoner N, Abe O, Adams T, … Périco CDAM (2017). Common and distinct patterns of grey-matter volume alteration in major depression and bipolar disorder: Evidence from voxel-based meta-analysis. Molecular Psychiatry, 22(10), 1455–1463. doi: 10.1038/mp.2016.72 [DOI] [PMC free article] [PubMed] [Google Scholar]
- Zhang Z (2016). Multiple imputation with multivariate imputation by chained equation (MICE) package. Annals of Translational Medicine, 4 (2), 30. doi: 10.3978/j.issn.2305-5839.2015.12.63 [DOI] [PMC free article] [PubMed] [Google Scholar]
- Zhao Y, Chen L, Zhang W, Xiao Y, Shah C, Zhu H, … Jia Z (2017). Gray matter abnormalities in non-comorbid medication-naive patients with major depressive disorder or social anxiety disorder. EBioMedicine, 21, 228–235. doi: 10.1016/j.ebiom.2017.06.013 [DOI] [PMC free article] [PubMed] [Google Scholar]
- Ziermans TB, Schothorst PF, Schnack HG, Koolschijn PCM, Kahn RS, van Engeland H, & Durston S (2012). Progressive structural brain changes during development of psychosis. Schizophrenia Bulletin, 38(3), 519–530. doi: 10.1093/schbul/sbq113 [DOI] [PMC free article] [PubMed] [Google Scholar]
Associated Data
This section collects any data citations, data availability statements, or supplementary materials included in this article.