

Summary
Undifferentiated neural stem and progenitor cells (NSPCs) encounter extracellular signals that bind plasma membrane proteins and influence differentiation. Membrane proteins are regulated by N-linked glycosylation, making it possible that glycosylation plays a critical role in cell differentiation. We assessed enzymes that control N-glycosylation in NSPCs and found that loss of the enzyme responsible for generating β1,6-branched N-glycans, N-acetylglucosaminyltransferase V (MGAT5), led to specific changes in NSPC differentiation in vitro and in vivo. Mgat5 homozygous null NSPCs in culture formed more neurons and fewer astrocytes compared with wild-type controls. In the brain cerebral cortex, loss of MGAT5 caused accelerated neuronal differentiation. Rapid neuronal differentiation led to depletion of cells in the NSPC niche, resulting in a shift in cortical neuron layers in Mgat5 null mice. Glycosylation enzyme MGAT5 plays a critical and previously unrecognized role in cell differentiation and early brain development.
Keywords: neural stem cell, neuron, astrocyte, brain, cerebral cortex, N-glycan branching, glycosylation, MGAT5
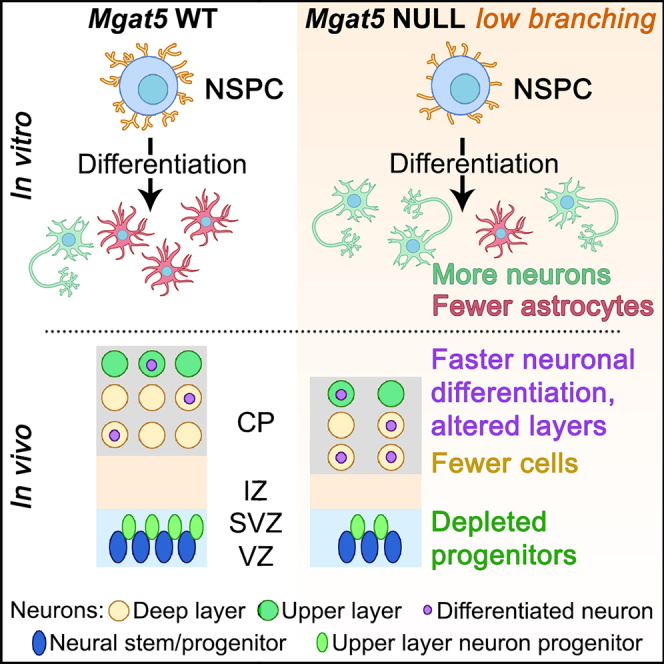
Graphical abstract
Highlights
-
•
Glycosylation enzyme MGAT5 produces branched N-glycans and influences stem cell fate
-
•
Loss of branching increases neuron differentiation and decreases astrocytes in vitro
-
•
Neuron differentiation in vivo is accelerated when branching is lost
-
•
Accelerated differentiation depletes progenitors, altering cortical neuron layers
Glycosylation is a post-translational modification that affects how cells respond to their environment. Flanagan and colleagues identify a new role for glycosylation in stem cell differentiation and show that the enzyme MGAT5 and the production of highly branched N-glycans are critical regulators of neural development.
Introduction
In the central nervous system (CNS), neural stem and progenitor cells (NSPCs) differentiate into neurons at early stages and later form glia (astrocytes and oligodendrocytes) to construct the brain and spinal cord. Neural stem cells in the cerebral cortex of the developing brain occupy a niche next to the lateral ventricle termed the ventricular zone. During neurogenesis, neural stem cells produce progenitors that form newborn neurons that migrate away from the ventricular surface to construct the cortical plate. The earliest born neurons create the deep layers of the cortical plate, and later-born neurons migrate past the deep layers to make superficial neuronal layers near the pial surface. This wave of neurogenesis is followed by the formation of astrocytes. Cortical NSPCs can differentiate into oligodendrocytes, but most oligodendrocytes derive from the ganglionic eminence and migrate into the cortex (He et al., 2001). Identifying the cellular processes controlling NSPC differentiation into neurons and astrocytes is critical for understanding cortical development.
Undifferentiated stem cells encounter myriad extracellular signals, such as cell adhesion molecules, growth factors, and morphogens, that have an impact on differentiation through their binding to plasma membrane proteins (Taverna et al., 2014). Glycosylation is a major plasma membrane protein post-translational modification in which sugar molecules, known as glycans, are attached to asparagine (N-linked) or serine/threonine (O-linked) amino acids (Ohtsubo and Marth, 2006). Most cell-surface protein extracellular domains are N-link glycosylated, and the presence and type of glycans can regulate protein function, localization at the cell surface, and ligand affinity (Ohtsubo and Marth, 2006).
Distinct patterns of plasma membrane N-glycans distinguish neuron- and astrocyte-biased NSPCs (Yale et al., 2018). Specifically, the N-glycan branching pathway that generates complex, highly branched sugars on plasma membrane proteins differs in these cells; branching is low on neuron-biased NSPCs and high on astrocyte-biased cells (Yale et al., 2018). Expression of branched N-glycans on NSPCs in the ventricular zone/subventricular zone (VZ/SVZ) of the developing embryonic cortex in vivo is low at early, neurogenic stages but high during later astrogenesis (Yale et al., 2018). Pharmacologically enhancing N-glycan branching on cultured NSPCs reduces neuron formation and stimulates differentiation into astrocytes without affecting cell viability or proliferation (Yale et al., 2018). Glycosylation thus regulates neural differentiation, and it will be important to identify enzymes in the branching pathway that influence NSPC differentiation and test whether they regulate NSPC function in vitro and in vivo.
N-Glycan branching is controlled by sequentially acting enzymes in the endoplasmic reticulum and Golgi apparatus. Particularly important are the mannosidase enzymes that remove mannose, freeing sites for attachment of N-acetylglucosamine (GlcNAc) residues, and the N-acetylglucosaminyltransferases (MGATs) that add GlcNAc to available sites to create N-glycan branches. MGAT activity is essential for proper CNS development, since reducing the expression of enzymes that generate branched N-glycans results in severe developmental abnormalities (Schachter, 2001). For example, deficiency of MGAT1 causes failure in neural tube closure and is embryonic lethal (Ioffe and Stanley, 1994; Metzler et al., 1994). Patients with mutations in the MGAT2 gene (congenital disorder CDG IIa) and mice with Mgat2 deletions exhibit CNS symptoms, including psychomotor retardation and cognitive deficits, and die prematurely (Schachter, 2001; Wang et al., 2002).
Despite the importance of glycosylation in CNS development, no links between specific glycosylation enzymes and NSPC differentiation have been described. Here, we use pharmacologic agents and knockout mice to determine whether enzymes of the N-glycan branching pathway have an impact on NSPCs and serve as critical regulators of cell differentiation.
Results
Increasing N-glycan branching alters NSPC fate, but blocking early branching enzymes does not
We found previously that treating undifferentiated NSPCs with the substrate GlcNAc to stimulate N-glycan branching reduced neurogenesis and enhanced astrogenesis (Yale et al., 2018). We hypothesized that decreasing branched N-glycans would have the opposite effect and tested this by blocking enzymes early in the branching pathway. We used kifunensine (Kif) to inhibit α-mannosidase 1 (MAN1) (Males et al., 2017), which cleaves excess mannose residues to enable addition of GlcNAc to initiate N-glycan branching (Figure 1A). We treated mouse embryonic day 12.5 (E12) cortical NSPCs with a Kif dose range, used L-PHA lectin to detect branched N-glycans, and determined that 0.5 μM Kif resulted in an almost complete reduction in L-PHA binding (Figures S1A and S1B).
Figure 1.

Kifunensine treatment alters multiple N-glycan species and does not affect neuron and astrocyte differentiation
(A) Schematic of N-glycans formed by glycosylation enzymes, culminating in highly branched N-glycans with β1,6 branches recognized by L-PHA. Kif blocks MAN1, while GlcNAc provides substrate that enhances branched N-glycan formation.
(B) N-glycans; symbols denote particular sugar moieties. Boxed regions indicate structures recognized by lectins ConA, E-PHA, DSL, L-PHA, LCA, SNA, and LEA.
(C) E12 NSPCs treated with GlcNAc had significantly more branched N-glycans detected by DSL (p = 0.0001) and L-PHA (p = 0.015) compared with untreated (Untr) controls. MFI, mean fluorescence intensity.
(D) Kif-treated E12 NSPCs had higher levels of N-glycans detected by ConA (p = 0.0025) and LEA (p = 0.04), but lower levels of those that bind E-PHA (p = 0.0002), DSL (p < 0.0001), L-PHA (p < 0.0001), and LCA (p = 0.001).
(E) E12 NSPCs treated with GlcNAc or Kif or untreated controls were differentiated and immunostained to detect neurons (microtubule-associated protein 2, MAP2, and TuJ1) or astrocytes (glial fibrillary acidic protein, GFAP). GlcNAc treatment reduced neuron formation (p < 0.0001) and increased generation of astrocytes (p = 0.0014), while Kif had no effect. All nuclei were stained with Hoechst. Analyses used unpaired two-tailed Student’s t test, n ≥ 3 independent biological repeats. Box plots show median with Tukey whiskers, ∗p < 0.05, ∗∗p < 0.01, ∗∗∗p < 0.001, ∗∗∗∗p < 0.0001.
E12 NSPCs were treated with GlcNAc to increase or with Kif to reduce N-glycan branching, and lectin flow cytometry was used to compare cell-surface N-glycans. GlcNAc-treated NSPCs had significantly increased β1,4- (MGAT4 product) and β1,6- (MGAT5 product) branched N-glycans detected by lectins DSL and L-PHA (Figures 1A–1C). NSPCs treated with Kif had reduced levels of bisecting branches (E-PHA), β1,4 branches (DSL), β1,6 branches (L-PHA), and core fucose (LCA) and increased levels of high mannose (ConA) and LEA binding (Figure 1D). LEA detects N-acetyllactosamine but also binds high-mannose structures, which LEA is likely detecting on Kif-treated cells, since they have increased ConA binding and reduced β1,4 and β1,6 branches, from which N-acetyllactosamine extends (Oguri, 2005). Hence, Kif treatment induced widespread changes to cell-surface N-glycans that included, but were not limited to, branched N-glycans.
We tested whether N-glycan branching affected differentiation by treating undifferentiated E12 NSPCs with GlcNAc or Kif, differentiating the cells, and measuring the formation of neurons and astrocytes. As we found previously, NSPCs treated with GlcNAc differentiated into significantly fewer neurons and more astrocytes compared with untreated controls (Figures 1E and S1C) (Yale et al., 2018). In contrast, differentiation was not affected by Kif treatment (Figure 1E). NSPCs from later developmental stages (E16 and E18) express higher levels of branched N-glycans, so they might be more affected by Kif (Yale et al., 2018). However, Kif treatment of E16 and E18 NSPCs did not significantly affect differentiation (Figures S1D and S1E). We also tested whether other agents that affect early enzymes in the branching pathway or treatment of NSPCs throughout differentiation would have an impact. We used deoxymannojirimycin (DMJ) to inhibit MAN1 or swainsonine (SW) to block MAN2 and treated E12 and E16 NSPCs for 3 days as undifferentiated cells and during 3 days of differentiation (Figure S1F). There was no significant difference in the differentiation of E12 or E16 NSPCs treated with DMJ or SW (Figure S1G). These data agree with the Kif data (Figures 1E, S1D, and S1E) and confirm that blocking early enzymes in the N-glycan branching pathway does not alter NSPC differentiation. Thus, NSPC neuronal and astrocytic differentiation is altered by GlcNAc treatment that enhances branching, but not by disruption of MAN1 or MAN2.
MGAT5 knockout blocks the production of β1,6-branched N-glycans and alters NSPC fate in vitro
Since blocking mannosidase enzymes early in the N-glycan branching pathway did not alter differentiation, we hypothesized that later enzymes might be critical. We assessed N-glycosylation enzyme expression in mouse NSPCs by RNA sequencing (RNA-seq) and identified those affecting mannose, branching, fucose, sialic acid, and polylactosamine (Figure S2) (Yale et al., 2018). Since GlcNAc treatment alters NSPC fate, we focused on MGATs that add GlcNAc to create branches (Figures 1A and 1E). NSPCs express MGAT5, which adds a β1,6 GlcNAc to the tri-mannosyl core to produce branched N-glycans detected by L-PHA (Figures 1A and 2A). L-PHA binding is increased after GlcNAc treatment, which affects NSPC differentiation (Figures 1C and 1E), and is higher at astrogenic compared with neurogenic stages of cortical development (Yale et al., 2018). In addition, astrocyte-biased NSPCs express higher levels of MGAT5 compared with neurogenic NSPCs (Yale et al., 2018). We therefore wondered whether disruption of MGAT5 would decrease β1,6 branching and alter differentiation.
Figure 2.

E12 NSPCs lacking MGAT5 have reduced branched N-glycans and generate more neurons and fewer astrocytes in vitro
(A) RNA-seq analysis of E12 NSPCs shows expression levels of N-acetylglucosaminyltransferases. Data are from three independent biological repeats and the scatterplot displays average reads per kilobase of transcript per million mapped reads (RPKM) values for each enzyme (error is SEM). Genes are clustered into high (>10 RPKM), moderate (1–10 RPKM), and low to no (<1 RPKM) expression. For comparison, β-actin and the stem cell marker Prominin 1 (CD133) are highly expressed, the γ-secretase involved in Notch signaling is moderately expressed, and the muscle marker MyoD shows low to no expression.
(B) Comparison of glycosylation enzyme transcripts by qRT-PCR shows loss of Mgat5 in null NSPCs (p < 0.0001). Expression is relative to control total cortex, error bars show standard deviation, and WT and null were compared by unpaired two-tailed Student’s t test.
(C) Analysis of E12 NSPCs from Mgat5 WT, heterozygous (het), and null mice showed that het (p = 0.0004) and null (p < 0.0001) NSPCs exhibited lower levels of β1,6-branched N-glycans detected by L-PHA compared with WT cells. Null cells had lower levels of β1,4-branched N-glycans detected by DSL compared with WT (p = 0.0001) and het (p < 0.0001). Heterozygous NSPCs showed a slight increase in polylactosamine detected by LEA (p = 0.019).
(D) Compared with WT, Mgat5 het (p = 0.008) and null (p = 0.00009) E12 NSPCs differentiated into more neurons. All nuclei were stained with Hoechst in (D) and (E).
(E) The percentage of GFAP-positive astrocytes formed by null E12 NSPCs was significantly reduced compared with WT (p = 0.027).
(F) No difference in Ki67 or phosphorylated histone H3 labeling was observed. However, Mgat5 E12 null NSPCs had significantly increased EdU incorporation compared with WT (p = 0.002) and heterozygous (p = 0.006).
(G) Cell-cycle analysis by propidium iodide labeling and flow cytometry revealed no significant difference in the proportion of cells in G0/G1, S, or G2/M phase among WT, heterozygous, and null E12 NSPCs.
(H) The percentage of live cells was assessed by co-staining with propidium iodide and calcein-AM. No difference in cell viability was detected between Mgat5 WT, het, and null NSPCs. Analyses used one-way ANOVA and Tukey’s post hoc; n ≥ 3 independent biological repeats. Box plots show median with Tukey whiskers, ∗p < 0.05, ∗∗p < 0.01, ∗∗∗p < 0.001, ∗∗∗∗p < 0.0001.
We analyzed E12 NSPCs isolated from Mgat5 wild-type (WT), heterozygous, and null animals (Granovsky et al., 2000). Comparison of WT and null NSPC glycosylation enzyme transcripts by qRT-PCR revealed the expected Mgat5 loss but no change in other enzymes (Figure 2B). Lectin flow cytometry showed that L-PHA binding (β1,6-branched N-glycans) was significantly reduced on Mgat5 heterozygous and virtually abolished on null NSPCs (Figure 2C). While null NSPCs did not have lower expression of the Mgat4a and 4b enzymes that generate the β1,4 branch, they showed reduced DSL binding (Figures 2B and 2C). This could be due to the fact that DSL has higher affinity for β1,4-branched glycans that also contain a β1,6 branch (Abbott and Pierce, 2010; Hirabayashi et al., 2015).
We assessed differentiation and found that Mgat5 heterozygous and null E12 NSPCs formed significantly more neurons compared with WT cells (Figure 2D), while Mgat5 null NSPCs generated significantly fewer astrocytes (Figure 2E). Although E12 cortical NSPCs generate relatively few oligodendrocytes, we measured oligodendrocyte differentiation and found no difference among Mgat5 WT, heterozygous, and null NSPCs (Figure S2B). These experiments demonstrate that MGAT5 loss enhances neuron differentiation and reduces astrocyte formation in vitro. Increasing branching with GlcNAc treatment (Figure 1) and decreasing branching with targeted disruption of MGAT5 (Figure 2) produce opposite effects on NSPC differentiation, showing that N-glycan branching regulates NSPC differentiation and fate.
Altered NSPC proliferation or viability could have an impact on differentiation, so we tested whether Mgat5 WT and mutant NSPCs differed in these parameters. NSPC proliferation was analyzed by multiple assays. Ki67 detects cycling cells, and we found no difference among Mgat5 WT and mutant NSPCs (Figure 2F). 5-ethynyl-2′-deoxyuridine (EdU) incorporation measures cells in S phase, and there was a significant increase in Mgat5 null compared with WT or heterozygous NSPCs (Figure 2F). Phosphorylated histone H3 labels cells in M phase, and there was no difference among Mgat5 WT, heterozygous, and null cells (Figure 2F). Thus, the only difference between WT and mutant cells was in EdU incorporation, which reflects new DNA synthesis. Since DNA synthesis can occur independent of cell division, as happens during gene duplication, repair, or apoptosis (Breunig et al., 2007), we used an additional assay to detect dividing cells. Flow cytometry with propidium iodide labeling of nuclear content to measure all cell-cycle stages in the same population of cells showed no significant differences in the percentages of cells in G0/G1, S, or G2/M phases across genotypes (Figure 2G). Cell viability did not differ for Mgat5 WT and mutant NSPCs (Figure 2H). Taken together, these data suggest that WT and Mgat5 null NSPCs are similar in proliferative ability and viability.
MGAT5 loss in vivo increases neuronal differentiation
We assessed the role of MGAT5 in cell differentiation during development by analyzing WT and mutant brains. We measured L-PHA binding to E16 mouse brain sections and found that β1,6-branched N-glycans were somewhat reduced in the Mgat5 heterozygous brain and absent in the null brain (Figure S3A). These data, coupled with the flow cytometry analysis of WT and Mgat5 mutant NSPCs (Figure 2C), confirm that loss of MGAT5 significantly decreases β1,6-branched N-glycans in the brain.
We assessed NSPC differentiation in vivo by staining E16 brain sections with antibodies for neurons: class III β tubulin (TuJ1 antibody, detects neuronal processes) or RBFOX3 (NeuN antibody, detects fully differentiated neuron nuclei). There was a notable increase in TuJ1 and NeuN staining in the E16 Mgat5 null cortex compared with WT (Figures 3A and 3B). We found a significant increase in the percentage of NeuN-positive cells in Mgat5 null cortical plate (CP) at three spatially distinct regions of the cortex: medial (toward the midline), dorsal (at the apex of the cortex), and lateral (near the junction with the ganglionic eminence) (Figure 3C). Similarly, there was a significant increase in the number of NeuN-positive cells per square millimeter in the dorsal CP (Figure 3C). These data show that Mgat5 null mice have a higher proportion of fully differentiated NeuN-positive neurons compared with WT at E16.
Figure 3.

Mgat5 null mice have more differentiated neurons in the developing embryonic cortex but no change in cell proliferation or death
(A) Greater TuJ1 neuronal staining is evident in coronal sections of E16 null brain compared with WT. Sections show medial (M), dorsal (D), and lateral (L) regions and CP, IZ, VZ/SVZ, and lateral ventricle (LV).
(B) Coronal sections show enhanced NeuN in the Mgat5 null brain CP at E16.
(C) Quantification shows a significant increase in the percentage of NeuN-positive cells in the Mgat5 null brain CP compared with WT in medial (p = 0.027), dorsal (p = 0.029), and lateral (p = 0.049) regions. There was a significant increase in the number of NeuN-positive cells per area (cells/mm2) in the Mgat5 null dorsal CP compared with WT (p = 0.031).
(D) P7 coronal sections of WT and Mgat5 null brains were immunostained to detect NeuN. Images show the neocortex (Ncx) and corpus callosum (CC) in lateral cortical regions.
(E) There was a non-significant increase in the percentage and number per square millimeter of NeuN-positive cells in Mgat5 null neocortex compared with WT at P7.
(F) Staining with Ki67 in the E16 lateral VZ/SVZ showed no difference between WT and null brains.
(G) There was no difference in the number of cleaved caspase-3-positive cells per square millimeter in the P7 neocortex between WT and Mgat5 null brains. The lateral ventricle is toward the bottom of the images; analyses used unpaired two-tailed Student’s t test, WT vs. null, n = 3–4 mice per genotype and for caspase-3 staining multiple fields per animal. Lines and error bars in dot plots show mean with SEM, respectively; ∗p < 0.05.
We tested whether Mgat5 null mice have defects in the localization of differentiated neurons by analyzing NeuN in the intermediate zone (IZ), which contains newly born and migrating neurons, and the VZ/SVZ, which is the NSPC niche. Very few NeuN-positive cells were detected in the E16 IZ and VZ/SVZ, and there was no difference across genotypes (Figures S3B–S3D), indicating that MGAT5 depletion did not alter the spatial distribution of differentiated neurons or their migration to the CP.
Since neurogenesis is still underway at E16, we analyzed WT and Mgat5 null brains at post-natal day 7 (P7), when neurogenesis is complete. By P7, the increase in fully differentiated neurons in Mgat5 null compared with WT was dampened (Figures 3D and 3E). These data suggest that neuronal differentiation in WT animals caught up to that of Mgat5 nulls by post-natal stages.
Enhancing branched N-glycans on NSPCs with GlcNAc treatment increased generation of GFAP-positive astrocytes, and NSPCs lacking MGAT5 form fewer astrocytes in vitro (Figures 1E and 2E) (Yale et al., 2018). We therefore assessed GFAP-positive astrocytes in Mgat5 WT and null brains. In the brain, GFAP expression is high in fibrous astrocytes (Rowitch and Kriegstein, 2010). GFAP-positive astrocytes were not detected in E16 or P1 brains (data not shown). By P7, GFAP-positive astrocytes were apparent and primarily restricted to regions near the pial surface of the medial cingulate cortex and the white matter tracts of the external capsule, cingulum, and corpus callosum (Figures S4A and S4B). We quantified GFAP labeling and found a slight, but not statistically significant, reduction in GFAP staining in the Mgat5 null brain (Figure S4C). A caveat for comparing the GFAP in vitro and in vivo findings is that GFAP is not a nuclear marker, making it difficult to determine the percentage of GFAP-positive cells in vivo.
We assessed cell proliferation and death in Mgat5 WT and null brains, since these could affect neuronal differentiation in vivo. We found no difference in Ki67-positive cycling cells in the E16 WT and Mgat5 null VZ/SVZ (Figures 3F and S4D). Neuronal number in the cortex is influenced by both generation of neurons and later pruning mechanisms in which unnecessary neurons undergo apoptosis. We stained for cleaved caspase-3, a marker of apoptotic cells, and found no staining at E16 in WT or Mgat5 null brains (data not shown). At P7, there was no difference in the number of cells labeled with cleaved caspase-3 between WT and null brains (Figures 3G and S4E), and the distribution of labeled cells across the neocortex was similar across genotypes. Our data indicate that cell proliferation and viability are not substantially altered in the absence of MGAT5 (Figures 2 and 3).
Decreased cell numbers and thickness of Mgat5 null brains
The increase in NeuN-positive differentiated neurons in Mgat5 null animals could cause an overall increase in cell number or CP thickness if excess neurons are generated. However, analysis of the E16 CP showed that loss of MGAT5 caused significant decreases in cell density (cells/mm2) in medial and lateral CP, the thickness of dorsal and lateral CP, and the total number of cells in medial, dorsal, and lateral CP (Figure 4A). The entire E16 cortex, which includes the CP, IZ, and VZ/SVZ, showed significant decreases in cell density in lateral cortex, thickness of dorsal and lateral cortex, and total number of cells in dorsal and lateral cortex in Mgat5 null animals compared with WT (Figure 4A). Overall, these data show that the E16 Mgat5 null brain has significantly decreased numbers of cells and thickness compared with the WT brain.
Figure 4.

Mgat5 null brains display decreased cell numbers and thickness
(A) At E16, cell density (cells/mm2) was significantly decreased in the medial (p = 0.0009) and lateral (p = 0.032) null CP and in the null lateral cortex (p = 0.003) compared with WT. In Mgat5 null brains, the thickness of the CP and cortex were reduced compared with WT: CP dorsal (p = 0.0001), CP lateral (p = 0.017), cortex dorsal (p = 0.011), cortex lateral (p = 0.006). The total number of cells was reduced in the medial (p = 0.025), dorsal (p = 0.008), and lateral (p = 0.0005) null CP and in the null dorsal (p = 0.008) and lateral (p = 0.0004) cortex compared with WT.
(B) At P7, the cell density in Mgat5 null was significantly reduced in layers 2/3 (p = 0.0004) and layers 5/6 (p = 0.007) compared with WT.
(C) Thickness of the neocortex was significantly reduced in the Mgat5 null brain compared with WT at P7 (p = 0.018). The thickness of layer 4 (p = 0.0496) and layers 5/6 (p = 0.01) was significantly reduced in the Mgat5 null brain compared with WT. Analyses used unpaired two-tailed Student’s t test, WT vs. null, n = 3–5 mice per genotype and, for P7, 3 regions per animal. Lines and error bars in dot plots show mean with SEM, respectively; ∗p < 0.05, ∗∗p < 0.01, ∗∗∗p < 0.001.
We analyzed P7 WT and Mgat5 null neocortex to determine whether MGAT5 loss had an impact on the total number of cells or cortical architecture at post-natal stages. The cell density in upper layers 2/3 and deep layers 5/6 was significantly lower in Mgat5 null compared with WT (Figure 4B). We analyzed the neocortex from the pial surface to the top of the corpus callosum and found significantly reduced thickness in Mgat5 null brains (Figure 4C). Layer analysis revealed that layer 2/3 thickness did not differ between WT and null, but there was a significant decrease in the thickness of layers 4 and 5/6 in the Mgat5 null brain compared with WT (Figure 4C).
Mgat5 null animals have an increase in NeuN-positive fully differentiated neurons but a decrease in cell number, suggesting that the NeuN findings are not due to an increase in neuron number. Further, we did not observe shifts in cell proliferation, migration, or death that could account for the lower cell numbers in Mgat5 nulls. These data raise the possibility that MGAT5 loss could lead to an acceleration of neuronal differentiation, causing depletion of progenitors and subsequent reduction in the total number of cells. We therefore analyzed progenitors in the VZ/SVZ at E16.
MGAT5 deficiency depletes a subset of neural progenitors in the embryonic VZ/SVZ
To assess progenitors, we focused on the VZ/SVZ stem and progenitor cell niche. There was a significant decrease in both cell density and total cell number in the Mgat5 null dorsal and lateral E16 VZ/SVZ compared with WT, but no change in thickness (Figure 5A). These data indicate reduced numbers of stem and progenitor cells in Mgat5 nulls that are not due to an overt change in the number of proliferating or viable cells (Figures 2 and 3). We stained the VZ/SVZ with BRN2, which is expressed by upper layer neuron progenitors at E16 and is critical for instructing upper layer neuron identity (Sugitani et al., 2002; Dominguez et al., 2013). There was a significant decrease in the percentage and total number of BRN2-positive progenitors in the VZ/SVZ of Mgat5 null mice compared with WT (Figures 5B and S5A). We analyzed SOX2, a general progenitor marker, and TBR2, a neuron progenitor marker. SOX2 primarily labeled cells along the ventricle and showed no significant difference between WT and Mgat5 nulls (Figure S5B). There was no difference in TBR2-positive cells between WT and Mgat5 null brains (Figure S5C). These data indicate that some, but not all, progenitors are decreased in the Mgat5 null VZ/SVZ, suggesting a partial depletion of the progenitor pool that could lead to a reduction in neuron numbers in the cortex.
Figure 5.

MGAT5 deficiency causes depletion of embryonic VZ/SVZ cells and upper layer neuron progenitors
(A) Cell density was significantly decreased in the E16 Mgat5 null dorsal (p = 0.034) and lateral (p = 0.012) VZ/SVZ compared with WT. The total number of Hoechst-stained cells was significantly reduced in the Mgat5 null dorsal (p = 0.037) and lateral (p = 0.0009) VZ/SVZ compared with WT. The thickness of the VZ/SVZ did not differ between WT and null brains.
(B) The percentage (p = 0.004) and total number (p = 0.002) of BRN2-positive upper layer neuron progenitors in the dorsal VZ/SVZ were reduced in E16 Mgat5 nulls compared with WT. All nuclei were stained with Hoechst; the ventricle is toward the bottom of the images. Analyses used unpaired two-tailed Student’s t test, WT vs. null, n = 3–5 mice per genotype. Lines and error bars in dot plots show mean with SEM, respectively; ∗p < 0.05, ∗∗p < 0.01, ∗∗∗p < 0.001.
The E16 IZ contains cells migrating from the VZ/SVZ to the CP. We assessed cell number and thickness of the E16 IZ and found that Mgat5 null animals had significant decreases in the number of cells in lateral regions and decreased IZ thickness in dorsal and lateral regions (Figure S5D). In contrast, there was an increase in cells/mm2 in the Mgat5 null medial region (Figure S5D). Since there was a decrease in VZ/SVZ and IZ cells and fewer upper layer neuron progenitors in Mgat5 nulls at E16, we analyzed cortical layer formation.
Progenitor depletion in mice lacking MGAT5 alters neuronal layers
The cortex is composed of six neuronal layers; the deep layers form first during development, followed by the upper layers. We stained E16 brains with TBR1 (for earlier-born deep layer 6 neurons), CTIP2 (deep layers 5/6), and BRN2 (upper layers 2/3). Since the medial region includes the newly developing hippocampus, we focused analyses on dorsal and lateral cortical regions. There was a significant decrease in TBR1-positive deep layer neurons in the Mgat5 null lateral CP and cortex at E16 (Figures 6A and S6A). CTIP2-positive deep layer neurons showed a slight, but not significant, decrease in the null dorsal CP and cortex and no difference between WT and nulls in the lateral CP and cortex at E16 (Figure S6B). There was a modest and not significant decrease in the number of BRN2-positive upper layer neurons in the Mgat5 null dorsal CP compared with WT at E16 (Figure S6C). These data suggest that at E16, when cortical layers are still developing, the only detectable difference between WT and null is the earlier-born deep layer 6 neurons.
Figure 6.

Progenitor depletion in the absence of MGAT5 causes greater effects on later-born upper layer neurons
(A) Coronal sections of E16 brain were immunostained to detect the deep layer 6 neuron marker TBR1. The ventricle is toward the bottom left corner of the image. TBR1-positive neurons were significantly reduced (p = 0.007) in the Mgat5 null lateral CP compared with WT.
(B) Coronal sections of P7 WT and Mgat5 null brains were immunostained to detect the upper layer neuron marker BRN2 (red) and the deep layer 5/6 neuron marker CTIP2 (green). The ventricle is toward the bottom left corners of the images.
(C) BRN2-positive upper layer 2/3 neurons were significantly reduced in Mgat5 null neocortex compared with WT at P7 (p = 0.0001).
(D) Deep layer 5/6 neurons detected by CTIP2 were significantly reduced in the Mgat5 null brain compared with WT (p = 0.02).
(E) There was a significant decrease in the ratio of BRN2:CTIP2 neurons in the Mgat5 null brain compared with WT (p = 0.003) at P7. All nuclei were stained with Hoechst, and analyses used unpaired two-tailed Student’s t test, WT vs. null, n = 3–5 mice per genotype and 3 regions per animal for P7. Lines and error bars in dot plots show mean with SEM, respectively; ∗p < 0.05, ∗∗p < 0.01, ∗∗∗p < 0.001.
We analyzed cortical layers at P7, when neurogenesis is complete and all layers are fully formed. Mgat5 null animals have a significant reduction in the number of BRN2-positive upper layer neurons at P7 (Figures 6B and 6C). These data are consistent with the observed decrease in BRN2-positive progenitors in the VZ/SVZ at E16 in Mgat5 nulls compared with WT (Figure 5B). There was a significant decrease in CTIP2-positive deep layer neurons in Mgat5 null animals compared with WT at P7 (Figures 6B and 6D). Progenitor depletion would be expected to affect upper layers more profoundly than deep, since fewer progenitors would be present at later developmental stages when upper layers are formed. We generated a ratio of the number of upper to deep layer neurons (BRN2:CTIP2) for WT and Mgat5 null brains and found a significant decrease in the ratio in null animals compared with WT, suggesting that later-born upper layer neurons were disproportionately affected during Mgat5 null brain development (Figure 6E). Collectively, our data are consistent with accelerated neuronal differentiation and depletion of progenitors in the Mgat5 null brain, leading to fewer cells in the cortex and a greater impact on later-born upper layer neurons since the effect of progenitor depletion is more profound at later stages.
Discussion
Glycosylation, cell differentiation, and brain development
Extracellular cues affect differentiation, but how cells regulate the plasma membrane to modulate responses to these cues is not well understood. N-Glycan branching affects cell-surface residence time, ligand affinity, and the function of many plasma membrane proteins, directly transforming the ability of receptors to bind extracellular cues and stimulate intracellular cascades. Cell-surface proteins regulated by N-glycan branching include cell adhesion molecules, growth factor receptors, and ion channels that could affect cell differentiation (Zhao et al., 2008; Dennis et al., 2009; Scott and Panin, 2014). Our data now show that cells can alter the plasma membrane glycome via the enzyme MGAT5 to influence cell differentiation. MGAT5 affects NSPC differentiation in several key ways. Loss of MGAT5 decreases β1,6-branched N-glycans and accelerates neuronal differentiation in vitro and in vivo, leading to a depletion of progenitors in vivo that alters layer formation (Figure 7).
Figure 7.

Model: Accelerated neuronal differentiation and progenitor depletion during cortical development in the Mgat5 null brain
Our data suggest a model in which Mgat5 null NSPCs rapidly form fully differentiated neurons, leading to an increase in NeuN-expressing cells (purple nuclei) in the Mgat5 null CP at E16. Rapid neuronal differentiation in Mgat5 nulls leads to progenitor depletion, reducing VZ/SVZ cell numbers and upper layer neuron progenitors. Progenitor reduction leads to a decrease in deep layer neurons and cortical thickness at E16 in Mgat5 nulls. By P7, the Mgat5 null brain has decreased cortical cell numbers and thickness and a more profound reduction in later-born upper layer neurons compared with earlier-born deep layers. Thus, loss of MGAT5 leads to a more rapid production of differentiated neurons that depletes progenitors, causing reduced cell numbers and cortical thickness and more severe reductions in neurons formed later in development.
Mgat5 null NSPCs lack β1,6 branches and form more neurons in vitro compared with WT cells. This is consistent with our finding that increasing β1,6 branches on NSPCs in vitro with GlcNAc treatment decreases neuronal differentiation (Yale et al., 2018). In vivo, rapid neuron generation leads to more fully differentiated neurons in the Mgat5 null E16 CP compared with WT. Our data do not suggest that MGAT5 alters neuronal migration, since there is no increase in NeuN-positive neurons in the E16 VZ/SVZ or IZ of Mgat5 null animals, which would be expected if neurons were stuck in those regions instead of migrating properly to the CP.
Rapid neuronal differentiation decreases progenitors in the Mgat5 null NSPC niche, shown by cell reduction in the VZ/SVZ and fewer BRN2-positive upper layer neuron progenitors at E16 in Mgat5 nulls compared with WT. Since there was no clear difference in proliferation between WT and Mgat5 null cells in vitro and in vivo, reduced cells in the Mgat5 null VZ/SVZ are not caused by a proliferation defect. Cell death is also not a likely cause, since there was no difference in either the live cell percentage between Mgat5 null and WT NSPCs in vitro or the cleaved caspase-3 apoptotic cells in vivo between null and WT. Coupled with the NeuN data, the reduced numbers of progenitors are likely due to their rapid progression from progenitor cells to fully differentiated neurons in Mgat5 null brains.
As progenitors decrease during Mgat5 null brain development, there are fewer left to generate neurons. This can be seen with analysis of layer-specific markers at different developmental stages. At E16, early-born TBR1-positive deep layer neurons are decreased in Mgat5 nulls, but it is too early to see a clear effect on upper layer neurons. By P7, both deep and upper layers are reduced in Mgat5 nulls, but the effect is more profound for the later-born upper layer neurons. This is consistent with the observed reduction in BRN2-positive upper layer neuron progenitors in the Mgat5 null VZ-SVZ at E16 and indicates gradual progenitor depletion over time that leaves fewer progenitors at later stages to form upper layer neurons.
The data lead to a model in which MGAT5 activity during normal cortical development increases cell-surface β1,6-branched N-glycans that in turn prevent precocious neuronal differentiation. These findings identify a new role for glycosylation in neural development and show that the enzyme MGAT5 and the production of β1,6-branched N-glycans are critical determinants of cell differentiation.
The rapid neuronal differentiation in MGAT5-deficient mice could affect brain function. Mgat5 null mice appear grossly normal, but exhibit behavioral abnormalities, including failure to nurture pups and decreased depressive-like behaviors (Granovsky et al., 2000; Soleimani et al., 2008; Feldcamp et al., 2016). A human genome-wide association study found a link between symptoms of depression and a site in the genome near Mgat5 (Luciano et al., 2012). Early, subtle or transient abnormalities during brain development can have long-lasting impacts on adult behavior. For example, mutations in disheveled, which is important in the Wnt/β-catenin pathway, cause abnormal expansion of deep layer neurons due to rampant neuron progenitor expansion and early neuronal differentiation (Belinson et al., 2016). The effects are transient, however, and the adult brain appears normal. Despite normal brain morphology, adult mutant mice display a number of behavioral deficits, including abnormal social interactions and repetitive behaviors (Belinson et al., 2016). Transient pharmacological activation of the Wnt pathway during embryonic stages revived signaling, reversed the developmental abnormality in neuron production, and corrected the adult behavioral phenotype (Belinson et al., 2016). Thus, events occurring early in development can have profound effects on later brain function, even if the adult brain morphology is grossly normal.
A concern for any transgenic or knockout mouse experiment is whether genetic background influences the phenotype. For example, gene loss may be lethal in an inbred mouse strain but not in an outbred strain. Ideally, phenotype would be assessed across multiple strains in any knockout mouse experiment, but this is not always feasible. We suspect our Mgat5 null mice findings are not purely strain dependent, since we see consistent effects of branched N-glycans on NSPC fate across mouse strains and in multiple species. Loss of β1,6-branched N-glycans in C57BL/6 Mgat5 nulls increased neuron differentiation (Figures 2 and 3), whereas GlcNAc treatment to increase β1,6-branched N-glycans on CD1 mouse NSPCs (Figure 1 and Yale et al., 2018) and human NSPCs (our unpublished data) had the opposite effect. Thus, the effects of β1,6-branched N-glycans on cell differentiation are not limited to a single mouse strain.
Regulation of glycosylation and cell differentiation
We identify here the importance of MGAT5 in NSPC differentiation, but an outstanding question is whether other enzymes, such as MGAT3 and MGAT4, also play a role. Mouse NSPCs express MGAT3, which adds a bisecting GlcNAc that prevents further branching by MGAT5; MGAT3 thus antagonizes MGAT5 function, and high MGAT3 activity would reduce β1,6 branches and mimic loss of MGAT5 (Brockhausen et al., 1988; Zhao et al., 2006). We previously reported that astrocyte-biased NSPCs expressed higher levels of Mgat5 RNA, whereas neuron-biased NSPCs express more Mgat3 (Yale et al., 2018). Neurons differentiated from pluripotent stem cells upregulate MGAT3 and have high cell-surface bisecting N-glycans compared with differentiated astrocytes (Terashima et al., 2014). The balance of MGAT5 and MGAT3 activity regulates several cell-surface proteins, affecting cell function, particularly integrins and cadherins (Zhao et al., 2006; Pinho et al., 2009). Mouse NSPCs express Mgat4a and Mgat4b but little to no Mgat4c. MGAT4 adds a β1,4 branch (detected by DSL) to contribute to N-glycan branching. The loss of Mgat5 did not affect expression of Mgat4a and Mgat4b, but DSL binding was increased on NSPCs after GlcNAc treatment and decreased on Mgat5 null NSPCs (Figures 1 and 2). This could be due to several factors, including the higher affinity of DSL for glycans containing both β1,4 and β1,6 branches (Abbott and Pierce, 2010; Hirabayashi et al., 2015). MGAT4 expression did not prevent the functional consequences of MGAT5 loss in NPSCs, but analysis of cells and tissue lacking MGAT4 will be important for determining the importance of the β1,4 branch in cell differentiation and neural development. Of note, MGAT3 activity also blocks further branching by MGAT4 (Brockhausen et al., 1988). Future studies of MGAT3, MGAT4, and MGAT5 will investigate their interconnected roles in NSPC differentiation and map which N-glycans vary on cells that differ in fate.
Glycosylation could affect differentiation of many cell types. An electrophysiological measure, whole-cell membrane capacitance, reflects cell-surface glycosylation and distinguishes NSPCs on the basis of neuron or astrocyte fate bias (Labeed et al., 2011; Nourse et al., 2014; Yale et al., 2018; Adams et al., 2020). Treatment of NSPCs with GlcNAc increases membrane capacitance and shifts differentiation (Yale et al., 2018). Membrane capacitance is also linked to differentiation in the mesenchymal/adipose-derived, hematopoietic, and embryonic stem cell lineages (Lee et al., 2018). Mesenchymal stem cell differentiation to adipose vs. osteogenic lineages is accompanied by differences in both membrane capacitance (Hildebrandt et al., 2010; Bagnaninchi and Drummond, 2011) and glycosylation (Heiskanen et al., 2009; Hamouda et al., 2013). Ties between glycosylation, membrane capacitance, and cell differentiation are evident in multiple stem cell lineages and should be explored further.
Experimental procedures
Resource availability
Corresponding author
Further information and requests for resources and reagents should be directed to and will be fulfilled by the corresponding author, Lisa Flanagan (lisa.flanagan@uci.edu).
Materials availability
This study did not generate new unique reagents.
Data and code availability
Data will be shared with the research community upon request to the authors. No code or standardized datasets were generated.
Animals
All animal procedures were in accordance with protocols approved by the University of California, Irvine Institutional Animal Care and Use Committee, and adhered to the National Institutes of Health “Guidelines for the Care and Use of Laboratory Animals.” Mice were CD1 (Charles River) or Mgat5 C57BL/6 nulls (Lee et al., 2007). Genotyping was as described in the supplemental information.
Cell culture, treatment, and analysis
NSPCs were isolated from E12 mouse dorsal forebrain cortical tissue and grown in culture and differentiated as described in Yale et al. (2018) and the supplemental information. For CD1 mice, tissues from multiple embryos in the same litter were pooled, and the culture from a single litter was considered a biological repeat. For Mgat5 mice, tissues from each embryo were kept separate for genotyping and culture and considered a biological repeat. Comparisons across genotypes utilized at least three embryos per genotype from separate litters (not littermates). NSPCs were treated with 80 mM GlcNAc and 0.5 μM Kif as described in Yale et al. (2018) and the supplemental information. Live E12 NSPCs were dissociated for flow cytometry and RNA isolation or fixed, immunostained, and quantified as described in Yale et al. (2018) and the supplemental information (Table S1 for qRT-PCR primers and Table S2 for antibodies and lectins). RNA-seq data were from E12 CD1 mouse NSPCs from three separate litters as described in Yale et al., 2018 and the supplemental information.
Preparation, staining, and analysis of brain sections
Whole brains were dissected from Mgat5 mice, fixed in paraformaldehyde, frozen, and 12 μm coronal sections were prepared as described in the supplemental information. Brain sections were stained as described in Yale et al. (2018) and the supplemental information.
Locations along the rostral-caudal axis of the E16 brain were matched as described in the supplemental information to account for gradients in the developing brain. Boxes for quantitation of the E16 brain were drawn to encompass the entire layer within the region (for example, lateral CP, IZ, and VZ/SVZ), and the summation of CP, IZ, and VZ/SVZ boxes corresponded to the total cortex. For P7, images were taken of coronal sections from lateral regions of the somatosensory cortex of the anterior forebrain as described in the supplemental information. Quantitation focused on the P7 neocortex (defined as the region above the corpus callosum white matter tracts). Boxes were drawn from the upper edge of the white matter tracts to the pial surface for analysis. For analysis of layers 2/3, 4, and 5/6, nuclei patterns were used to discern the layers, and three boxes (200 × 100 μm) were drawn within the layer, enabling analysis in the middle of each layer to avoid boundaries.
Data were analyzed from three or more brains per genotype. Antibody and Hoechst staining was used to quantify the following: the percentage of positively stained cells (number positively stained/total number Hoechst-stained cells), cells/mm2 (number positively stained per unit area), and total cell number (total number positively stained in the region). The thickness of regions or layers was measured using Hoechst staining to define architectural boundaries and ImageJ to determine distance between boundaries.
Graphs and statistical analysis
Lines in dot plots show the mean and the bars show the standard error of the mean. For box plots, the box extends from the 25th to the 75th percentile, the line in the middle of the box is the median, and the boxes have Tukey whiskers. Comparison of two samples utilized two-tailed unpaired Student’s t tests. Datasets containing more than two samples were analyzed by one-way ANOVA with Tukey’s post hoc correction for multiple samples.
Author contributions
Conceptualization, A.R.Y., E.K., J.L.N., and L.A.F.; methodology, R.F.H., E.S.M., and L.A.F.; investigation, A.R.Y., E.K., B.G., J.N.H., N.S.L., J.L.N., and M.S.; resources, L.A.F.; writing – original draft, A.R.Y.; writing – review & editing, L.A.F.; funding acquisition, A.R.Y. and L.A.F.; supervision, L.A.F.
Acknowledgments
The authors gratefully acknowledge Dr. Michael Demetriou for Mgat5 knockout mice. This work was supported in part by NSF IOS-2019400 (L.A.F.), NSF Career Award IOS-1254060 (L.A.F.), NIH NINDS T32 NS082174 (predoctoral fellowship to A.R.Y.), and a Brython Davis Fellowship (A.R.Y.).
Conflict of interests
The authors declare no competing interests.
Published: May 11, 2023
Footnotes
Supplemental information can be found online at https://doi.org/10.1016/j.stemcr.2023.04.007.
Supplemental information
References
- Abbott K.L., Pierce J.M. Lectin-based glycoproteomic techniques for the enrichment and identification of potential biomarkers. Methods Enzymol. 2010;480:461–476. doi: 10.1016/S0076-6879(10)80020-5. [DOI] [PubMed] [Google Scholar]
- Adams T.N.G., Jiang A.Y.L., Mendoza N.S., Ro C.C., Lee D.H., Lee A.P., Flanagan L.A. Label-free enrichment of fate-biased human neural stem and progenitor cells. Biosens. Bioelectron. 2020;152:111982. doi: 10.1016/j.bios.2019.111982. [DOI] [PMC free article] [PubMed] [Google Scholar]
- Bagnaninchi P.O., Drummond N. Real-time label-free monitoring of adipose-derived stem cell differentiation with electric cell-substrate impedance sensing. Proc. Natl. Acad. Sci. USA. 2011;108:6462–6467. doi: 10.1073/pnas.1018260108. [DOI] [PMC free article] [PubMed] [Google Scholar]
- Belinson H., Nakatani J., Babineau B.A., Birnbaum R.Y., Ellegood J., Bershteyn M., McEvilly R.J., Long J.M., Willert K., Klein O.D., et al. Prenatal beta-catenin/Brn2/Tbr2 transcriptional cascade regulates adult social and stereotypic behaviors. Mol. Psychiatry. 2016;21:1417–1433. doi: 10.1038/mp.2015.207. [DOI] [PMC free article] [PubMed] [Google Scholar]
- Breunig J.J., Arellano J.I., Macklis J.D., Rakic P. Everything that glitters isn't gold: a critical review of postnatal neural precursor analyses. Cell Stem Cell. 2007;1:612–627. doi: 10.1016/j.stem.2007.11.008. [DOI] [PubMed] [Google Scholar]
- Brockhausen I., Narasimhan S., Schachter H. The biosynthesis of highly branched N-glycans: studies on the sequential pathway and functional role of N-acetylglucosaminyltransferases I, II, III, IV, V and VI. Biochimie. 1988;70:1521–1533. doi: 10.1016/0300-9084(88)90289-1. [DOI] [PubMed] [Google Scholar]
- Dennis J.W., Lau K.S., Demetriou M., Nabi I.R. Adaptive regulation at the cell surface by N-glycosylation. Traffic. 2009;10:1569–1578. doi: 10.1111/j.1600-0854.2009.00981.x. [DOI] [PubMed] [Google Scholar]
- Dominguez M.H., Ayoub A.E., Rakic P. POU-III transcription factors (Brn1, Brn2, and Oct6) influence neurogenesis, molecular identity, and migratory destination of upper-layer cells of the cerebral cortex. Cereb. Cortex. 2013;23:2632–2643. doi: 10.1093/cercor/bhs252. [DOI] [PMC free article] [PubMed] [Google Scholar]
- Feldcamp L., Doucet J.S., Pawling J., Fadel M.P., Fletcher P.J., Maunder R., Dennis J.W., Wong A.H.C. Mgat5 modulates the effect of early life stress on adult behavior and physical health in mice. Behav. Brain Res. 2016;312:253–264. doi: 10.1016/j.bbr.2016.06.033. [DOI] [PubMed] [Google Scholar]
- Granovsky M., Fata J., Pawling J., Muller W.J., Khokha R., Dennis J.W. Suppression of tumor growth and metastasis in Mgat5-deficient mice. Nat. Med. 2000;6:306–312. doi: 10.1038/73163. [DOI] [PubMed] [Google Scholar]
- Hamouda H., Ullah M., Berger M., Sittinger M., Tauber R., Ringe J., Blanchard V. N-glycosylation profile of undifferentiated and adipogenically differentiated human bone marrow mesenchymal stem cells: towards a next generation of stem cell markers. Stem Cells Dev. 2013;22:3100–3113. doi: 10.1089/scd.2013.0108. [DOI] [PMC free article] [PubMed] [Google Scholar]
- He W., Ingraham C., Rising L., Goderie S., Temple S. Multipotent stem cells from the mouse basal forebrain contribute GABAergic neurons and oligodendrocytes to the cerebral cortex during embryogenesis. J. Neurosci. 2001;21:8854–8862. doi: 10.1523/JNEUROSCI.21-22-08854.2001. [DOI] [PMC free article] [PubMed] [Google Scholar]
- Heiskanen A., Hirvonen T., Salo H., Impola U., Olonen A., Laitinen A., Tiitinen S., Natunen S., Aitio O., Miller-Podraza H., et al. Glycomics of bone marrow-derived mesenchymal stem cells can be used to evaluate their cellular differentiation stage. Glycoconj. J. 2009;26:367–384. doi: 10.1007/s10719-008-9217-6. [DOI] [PubMed] [Google Scholar]
- Hildebrandt C., Büth H., Cho S., Impidjati, Thielecke H. Detection of the osteogenic differentiation of mesenchymal stem cells in 2D and 3D cultures by electrochemical impedance spectroscopy. J. Biotechnol. 2010;148:83–90. doi: 10.1016/j.jbiotec.2010.01.007. [DOI] [PubMed] [Google Scholar]
- Hirabayashi J., Tateno H., Shikanai T., Aoki-Kinoshita K.F., Narimatsu H. The Lectin Frontier Database (LfDB), and data generation based on frontal affinity chromatography. Molecules. 2015;20:951–973. doi: 10.3390/molecules20010951. [DOI] [PMC free article] [PubMed] [Google Scholar]
- Ioffe E., Stanley P. Mice lacking N-acetylglucosaminyltransferase I activity die at mid-gestation, revealing an essential role for complex or hybrid N-linked carbohydrates. Proc. Natl. Acad. Sci. USA. 1994;91:728–732. doi: 10.1073/pnas.91.2.728. [DOI] [PMC free article] [PubMed] [Google Scholar]
- Labeed F.H., Lu J., Mulhall H.J., Marchenko S.A., Hoettges K.F., Estrada L.C., Lee A.P., Hughes M.P., Flanagan L.A. Biophysical characteristics reveal neural stem cell differentiation potential. PLoS One. 2011;6:e25458. doi: 10.1371/journal.pone.0025458. [DOI] [PMC free article] [PubMed] [Google Scholar]
- Lee A.P., Aghaamoo M., Adams T.N.G., Flanagan L.A. It’s electric: when technology gives a boost to stem cell science. Curr. Stem Cell Rep. 2018;4:116–126. doi: 10.1007/s40778-018-0124-x. [DOI] [PMC free article] [PubMed] [Google Scholar]
- Lee S.U., Grigorian A., Pawling J., Chen I.J., Gao G., Mozaffar T., McKerlie C., Demetriou M. N-glycan processing deficiency promotes spontaneous inflammatory demyelination and neurodegeneration. J. Biol. Chem. 2007;282:33725–33734. doi: 10.1074/jbc.M704839200. [DOI] [PubMed] [Google Scholar]
- Luciano M., Huffman J.E., Arias-Vásquez A., Vinkhuyzen A.A.E., Middeldorp C.M., Giegling I., Payton A., Davies G., Zgaga L., Janzing J., et al. Genome-wide association uncovers shared genetic effects among personality traits and mood states. Am. J. Med. Genet. B Neuropsychiatr. Genet. 2012;159B:684–695. doi: 10.1002/ajmg.b.32072. [DOI] [PMC free article] [PubMed] [Google Scholar]
- Males A., Raich L., Williams S.J., Rovira C., Davies G.J. Conformational analysis of the mannosidase inhibitor kifunensine: a quantum mechanical and structural approach. Chembiochem. 2017;18:1496–1501. doi: 10.1002/cbic.201700166. [DOI] [PubMed] [Google Scholar]
- Metzler M., Gertz A., Sarkar M., Schachter H., Schrader J.W., Marth J.D. Complex asparagine-linked oligosaccharides are required for morphogenic events during post-implantation development. EMBO J. 1994;13:2056–2065. doi: 10.1002/j.1460-2075.1994.tb06480.x. [DOI] [PMC free article] [PubMed] [Google Scholar]
- Nourse J.L., Prieto J.L., Dickson A.R., Lu J., Pathak M.M., Tombola F., Demetriou M., Lee A.P., Flanagan L.A. Membrane biophysics define neuron and astrocyte progenitors in the neural lineage. Stem Cell. 2014;32:706–716. doi: 10.1002/stem.1535. [DOI] [PMC free article] [PubMed] [Google Scholar]
- Oguri S. Analysis of sugar chain-binding specificity of tomato lectin using lectin blot: recognition of high mannose-type N-glycans produced by plants and yeast. Glycoconj. J. 2005;22:453–461. doi: 10.1007/s10719-005-5329-4. [DOI] [PubMed] [Google Scholar]
- Ohtsubo K., Marth J.D. Glycosylation in cellular mechanisms of health and disease. Cell. 2006;126:855–867. doi: 10.1016/j.cell.2006.08.019. [DOI] [PubMed] [Google Scholar]
- Pinho S.S., Reis C.A., Paredes J., Magalhães A.M., Ferreira A.C., Figueiredo J., Xiaogang W., Carneiro F., Gärtner F., Seruca R. The role of N-acetylglucosaminyltransferase III and V in the post-transcriptional modifications of E-cadherin. Hum. Mol. Genet. 2009;18:2599–2608. doi: 10.1093/hmg/ddp194. [DOI] [PubMed] [Google Scholar]
- Rowitch D.H., Kriegstein A.R. Developmental genetics of vertebrate glial-cell specification. Nature. 2010;468:214–222. doi: 10.1038/nature09611. [DOI] [PubMed] [Google Scholar]
- Schachter H. Congenital disorders involving defective N-glycosylation of proteins. Cell. Mol. Life Sci. 2001;58:1085–1104. doi: 10.1007/PL00000923. [DOI] [PMC free article] [PubMed] [Google Scholar]
- Scott H., Panin V.M. The role of protein N-glycosylation in neural transmission. Glycobiology. 2014;24:407–417. doi: 10.1093/glycob/cwu015. [DOI] [PMC free article] [PubMed] [Google Scholar]
- Soleimani L., Roder J.C., Dennis J.W., Lipina T. Beta N-acetylglucosaminyltransferase V (Mgat5) deficiency reduces the depression-like phenotype in mice. Genes Brain Behav. 2008;7:334–343. doi: 10.1111/j.1601-183X.2007.00358.x. [DOI] [PubMed] [Google Scholar]
- Sugitani Y., Nakai S., Minowa O., Nishi M., Jishage K.I., Kawano H., Mori K., Ogawa M., Noda T. Brn-1 and Brn-2 share crucial roles in the production and positioning of mouse neocortical neurons. Genes Dev. 2002;16:1760–1765. doi: 10.1101/gad.978002. [DOI] [PMC free article] [PubMed] [Google Scholar]
- Taverna E., Götz M., Huttner W.B. The cell biology of neurogenesis: toward an understanding of the development and evolution of the neocortex. Annu. Rev. Cell Dev. Biol. 2014;30:465–502. doi: 10.1146/annurev-cellbio-101011-155801. [DOI] [PubMed] [Google Scholar]
- Terashima M., Amano M., Onodera T., Nishimura S.I., Iwasaki N. Quantitative glycomics monitoring of induced pluripotent- and embryonic stem cells during neuronal differentiation. Stem Cell Res. 2014;13:454–464. doi: 10.1016/j.scr.2014.10.006. [DOI] [PubMed] [Google Scholar]
- Wang Y., Schachter H., Marth J.D. Mice with a homozygous deletion of the Mgat2 gene encoding UDP-N-acetylglucosamine:alpha-6-D-mannoside beta1,2-N-acetylglucosaminyltransferase II: a model for congenital disorder of glycosylation type IIa. Biochim. Biophys. Acta. 2002;1573:301–311. doi: 10.1016/s0304-4165(02)00397-5. [DOI] [PubMed] [Google Scholar]
- Yale A.R., Nourse J.L., Lee K.R., Ahmed S.N., Arulmoli J., Jiang A.Y.L., McDonnell L.P., Botten G.A., Lee A.P., Monuki E.S., et al. Cell surface N-glycans influence electrophysiological properties and fate potential of neural stem cells. Stem Cell Rep. 2018;11:869–882. doi: 10.1016/j.stemcr.2018.08.011. [DOI] [PMC free article] [PubMed] [Google Scholar]
- Zhao Y., Nakagawa T., Itoh S., Inamori K.i., Isaji T., Kariya Y., Kondo A., Miyoshi E., Miyazaki K., Kawasaki N., et al. N-acetylglucosaminyltransferase III antagonizes the effect of N-acetylglucosaminyltransferase V on alpha3beta1 integrin-mediated cell migration. J. Biol. Chem. 2006;281:32122–32130. doi: 10.1074/jbc.M607274200. [DOI] [PubMed] [Google Scholar]
- Zhao Y.Y., Takahashi M., Gu J.G., Miyoshi E., Matsumoto A., Kitazume S., Taniguchi N. Functional roles of N-glycans in cell signaling and cell adhesion in cancer. Cancer Sci. 2008;99:1304–1310. doi: 10.1111/j.1349-7006.2008.00839.x. [DOI] [PMC free article] [PubMed] [Google Scholar]
Associated Data
This section collects any data citations, data availability statements, or supplementary materials included in this article.
Supplementary Materials
Data Availability Statement
Data will be shared with the research community upon request to the authors. No code or standardized datasets were generated.