

Abstract
Super-enhancer (SE) plays a vital role in the determination of cell identity and fate. Up-regulated expression of coding genes is frequently associated with SE. However, the transcription dysregulation driven by SE, from the viewpoint of long non-coding RNA (lncRNA), remains unclear. Here, SE-associated lncRNAs in HCC are comprehensively outlined for the first time. This study integrally screens and identifies several novel SE-associated lncRNAs that are highly abundant and sensitive to JQ1. Especially, HSAL3 is identified as an uncharacterized SE-driven oncogenic lncRNA, which is activated by transcription factors HCFC1 and HSF1 via its super-enhancer. HSAL3 interference negatively regulates NOTCH signaling, implying the potential mechanism of its tumor-promoting role. The expression of HSAL3 is increased in HCC samples, and higher HSAL3 expression indicates an inferior overall survival of HCC patients. Furthermore, siHSAL3 loaded nanoparticles exert anti-tumor effect on HCC in vitro and in vivo. In conclusion, this is the first comprehensive survey of SE-associated lncRNAs in HCC. HSAL3 is a novel SE-driven oncogenic lncRNA, and siHSAL3 loaded nanoparticles are therapeutic candidates for HCC. This work sheds lights on the merit of anchoring SE-driven oncogenic lncRNAs for HCC treatment.
Keywords: super-enhancer, long non-coding RNA, HSAL3, hepatocellular carcinoma, nanoparticle, oncogene, target therapy, enhancer, transcription regulation, HCC
Graphical abstract
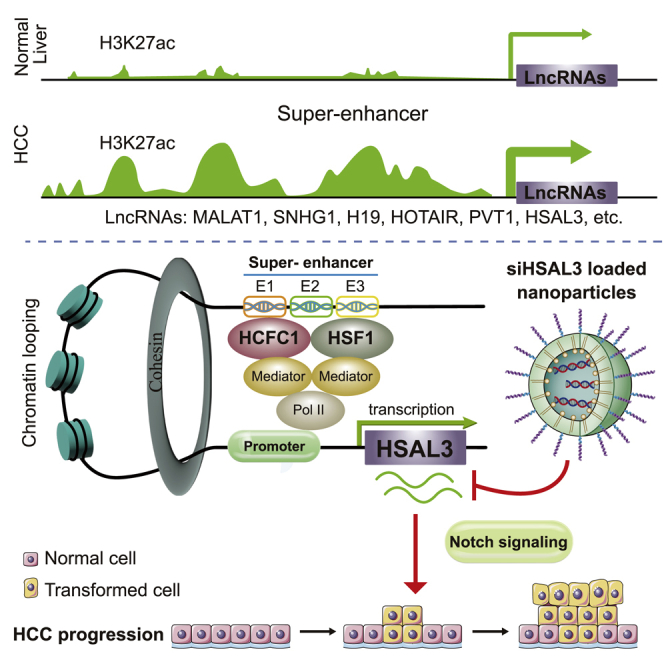
Peng and colleagues comprehensively screened super-enhancer-associated lncRNAs in hepatocellular carcinoma (HCC). HSAL3 was found as an uncharacterized super-enhancer-driven oncogenic lncRNA, and its siRNA-loaded nanoparticles as a novel and potential therapy for HCC. This work helps lay the basis of using super-enhancer-driven oncogenic lncRNA to develop anti-tumor agents.
Introduction
With an estimated number of 905,677 (4.7%) new cases and 830,180 (8.3%) new deaths in 2020, liver cancer is the sixth most frequent cancer and the third leading cause of cancer death worldwide.1 In China, liver cancer ranked fourth in terms of morbidity (392,868 cases; 9.2%) and third in terms of mortality (368,960 cases; 12.9%) in 2018.2 The incidence of liver cancer also keeps elevating annually in the United States.3 Hepatocellular carcinoma (HCC) is the most common form of liver cancer, accounting for ∼90% of diagnosed cases.4,5 Currently, available therapeutics for HCC contain resection, local ablative therapy, liver transplantation, transhepatic arterial chemoembolization, hepatic artery infusion chemotherapy, and systemic therapies.6 Although there is a marked increase in the overall survival and quality of life of HCC patients owing to the substantial technical progress in HCC treatment,7,8 the clinical outcome remains poor, with a 5-year relative survival rate of 20% in the United States.3 Thus, there is a growing need for further characterizing molecular pathogenesis of HCC to explore prognostic biomarkers and therapeutic targets.
Super-enhancers (SEs) are cis-acting genomic DNA elements composed of a cluster of active constituent regulatory enhancers.9 SEs play vital roles in the determination of cell identity and cell fate by controlling cell- and/or tissue-specific gene regulation,10,11 thus contribute to disease progression and severity.12 It was reported that the upregulation of coding-gene expression is frequently associated with SEs.13,14,15,16 A prior study has characterized the landscape of SEs in HCC,17 but there is no comprehensive study of SE-associated non-coding RNA in HCC. A growing amount of evidence supports the vital role of long non-coding RNA (lncRNA) in the occurrence and progression of tumors.18,19,20,21 In our earlier work, we found that SE can also transcriptionally activate the expression of a cancer-driving lncRNA.22 Therefore, it will be of much intrigue to panoramically screen and identify SE-associated oncogenic lncRNAs as biomarkers and therapeutic targets for cancer.
In the present study, the landscape of SE-associated lncRNAs in HCC cells is established. SE-associated lncRNAs are preferentially sensitive to JQ1 treatment. This study further screens and identifies a few novel SE-associated lncRNAs including HCC-specific SE-associated oncogenic lncRNA RP13-890H12.2 (HSAL3). Importantly, siHSAL3 loaded nanoparticles (NPs) are preliminarily confirmed as a novel treatment candidate for HCC in vitro and in vivo.
Results
The landscape of SE-associated lncRNAs in HCC
To characterize SE-associated lncRNAs in HCC, we generated the landscape of SE-associated lncRNAs in two HCC cell lines (HepG2 and LM3) and a normal liver tissue through chromatin immunoprecipitation sequencing (ChIP-seq) with anti-H3K27ac. A total of 186, 948, and 761 SE-associated lncRNAs were identified in normal liver tissue, HepG2, and LM3 cells, respectively (Figure S1A). To further systematically investigate alterations of SE-associated lncRNAs’ landscape during hepatocarcinogenesis, we compared SE-associated lncRNAs between normal adult liver tissue and both HCC cell lines. A total of 218 SE-associated lncRNAs were identified both in HepG2 and LM3 cells (Figure S1A). As expected, many well-known oncogenic lncRNAs of HCC were observed as SE-associated lncRNAs in HCC cells, such as SNHG1 (Figure S1B). There were more up-regulated lncRNAs than down-regulated lncRNAs in HCC samples (Figures S1C–S1E). Also, H3K27ac signals of SE-associated lncRNAs were prominently stronger than those of typical-enhancer (TE)-associated lncRNAs or all lncRNAs (Figures S1F–S1I).
JQ1 preferred to inhibit SE-associated lncRNA transcription in HCC
As a wide-spectrum SE inhibitor, JQ1 selectively binds to the amino-terminal twin bromodomains of bromodomain containing 4 (BRD4) as well as preferentially affects coding genes with SEs.23 BRD4 is involved in the control of transcriptional elongation by RNA polymerase II (RNA Pol II; pol2).24 We examined the effect of JQ1 on pol2-mediated transcription of SE-associated lncRNAs in HCC cells. At first, we detected protein content of BRD4 and RNA Polymerase II Subunit A (POLR2A; the largest subunit of pol2), as well as phosphorylation level of Phospho-POLR2A-Ser2, -Ser5, and -Ser7. It showed that the phosphorylation level of Phospho-POLR2A-Ser2, -Ser5, and -Ser7 prominently decreased in HepG2 and LM3 cells exposed to JQ1 (Figures S2A and S2B); the protein content of POLR2A and BRD4 also reduced (Figures S2A and S2B). Secondly, we compared the transcription level of SE-associated lncRNAs with that of all lncRNAs after JQ1 treatment. For all lncRNAs, there was a subtle difference between the number of up-regulated and down-regulated lncRNAs (Figures S2C, S2D, S2G, and S2H). For SE-associated lncRNAs, there were ∼3 times more down-regulated than up-regulated lncRNAs (Figures S2E–S2H). Consistently, we found that JQ1 treatment preferentially inhibited the transcription of SE-associated lncRNAs, compared with all lncRNAs or TE-associated lncRNAs (Figures S2I and S2J). In addition, gene set enrichment analysis (GSEA) confirmed that SE-associated lncRNAs were more sensitive to JQ1 exposure than TE-associated lncRNAs (Figures S2K and S2L).
Discovery of SE-associated oncogenic lncRNAs in HCC
To identify novel SE-associated candidate lncRNAs in HCC, a dynamic integration analysis of both ChIP-seq data and lncRNA-seq data was performed. It is increasingly recognized that SE-associated genes tend to be more highly expressed in cancer and more sensitive to transcriptional suppression than TE-associated genes. The screening of SE-associated candidate lncRNAs was performed as follows: (1) identifying 218 SE-associated lncRNAs in HepG2 and LM3 cells (Figure S1A); (2) identifying 22 SE-associated lncRNAs that were up-regulated in HCC and related to HCC prognosis (Figure S3), based on the result from step (1); and (3) identifying eight SE-associated candidate lncRNAs that were down-regulated by JQ-1 and ranked at top 20% of the most abundant lncRNAs in HCC cells (Figure 1A), based on the result from step (2). Of note, the involvement of these 8 SE-associated candidate lncRNAs in HCC biology has not been studied by others. As shown in Figure 1B, there exist obvious SE peaks in the upstream and/or downstream of these candidate lncRNAs in HCC cells. Accordingly, their remarkable sensitivity to JQ1 treatment was confirmed through qRT-PCR in HepG2 and LM3 cells (Figures 1C and 1D). Meanwhile, their expression abundances are high, ranking within the top 20% of the ranked list (Figure 1E).
Figure 1.

Integrative analysis of ChIP-seq and lncRNA-seq data to screen novel SE-associated oncogenic lncRNAs
(A) Identification of SE-associated candidate lncRNAs in HCC. (B) H3K27ac ChIP-seq profiles of eight uncharacterized candidate lncRNAs in HepG2 and LM3 cells. (C and D) The expression level of candidate lncRNAs following JQ1 or vehicle treatment in HepG2 and LM3 cells (n = 4). PC, positive control. The results are presented as mean ± SD. ∗p < 0.05; ∗∗p < 0.01; ∗∗∗p < 0.001 by two-tailed Student’s t test. (E) Expression rank of all lncRNAs in HCC cells from CCLE database (https://portals.broadinstitute.org/ccle). Red dots denote candidate lncRNAs in HCC cells. (F and G) Effect of siRNAs interfering eight candidate lncRNAs on cell proliferation of HepG2 and LM3 cells, measured by CCK-8 assay (n = 4). The results are presented as mean ± SD. ∗p < 0.05; ∗∗p < 0.01; ∗∗∗p < 0.001 by two-tailed Student’s t test. (H) Effect of siRNAs interfering eight candidate lncRNAs on cell migration of HepG2 and LM3 cells, measured by Transwell assay. Scale bar, 100 μm.
To investigate their biological functions, we silenced these SE-associated lncRNAs by small interfering RNA (siRNA) pools (three different siRNAs per lncRNA; Figures S4A and S4B). It was shown that the interference of these SE-associated lncRNAs can decelerate cellular growth (Figures 1F and 1G) and migration (Figure 1H) of HepG2 and LM3 cells. The potential clinical value of these SE-associated lncRNAs was further evaluated in HCC patients from The Cancer Genome Atlas (TCGA). The expression of these SE-associated lncRNAs was increased in HCC samples (Figure S5A; Figure 5J), and high lncRNA expression indicated a poor clinical outcome of HCC patients (Figures S5B–S5H; Figure 5N).
Figure 5.

HSAL3 promoting HCC cell growth and metastasis indicated a poor prognosis of HCC patients
(A and B) CCK-8 assay examining the effect of HSAL3 interference on proliferation ability of HepG2 and LM3 cells (n = 4). ∗p < 0.05; ∗∗∗p < 0.001 by two-tailed Student’s t test. (C and D) EdU assay examining the effect of HSAL3 interference on DNA synthesis of HepG2 and LM3 cells. Scale bar, 50 μm. (E) The growth and (F) weights of tumor xenograft after intratumor treatment with 2′-o-Me and 5′-cholesterol modified siHSAL3 or siNC (negative control). Six mice per group. ∗p < 0.05, ∗∗p < 0.01 by two-tailed Student’s t test. (G–J) Relative expression of HSAL3 was significantly higher in HCC tissues than in normal liver tissues in training set (n Normal = 26; n HCC = 64), test set (n Normal = 18; n HCC = 61), training set + test set (n Normal = 44; n HCC = 125), and TCGA HCC set (n Normal = 50; n HCC = 371), respectively. The p value was calculated by two-tailed Student’s t test. (K–N) Kaplan-Meier survival curves of overall survival (OS) or 5-year OS based on HSAL3 expression in HCC patients in training set (n HCC = 64), test set (n HCC = 61), training set + test set (n HCC = 125), and TCGA HCC set (n HCC = 371). The p value was calculated by Log rank (Mantel-Cox) test, and HR value was estimated by hazard ratio (Mantel-Haenszel). Results in (J) and (N) were analyzed based on the HCC dataset downloaded from TCGA (https://cancergenome.nih.gov/).
Identification of HSAL3 as a novel SE-driven lncRNA in HCC
We further selected an uncharacterized SE-associated lncRNA RP13-890H12.2 (HSAL3), which had the most obvious down-regulation with the treatment of JQ1. Through ChIP-seq analysis of H3K27ac, we identified an SE of HSAL3 in HepG2 cells (Figure 2A); and the co-occupancy of both pol2 and H3K4me1 confirmed the active state of this SE (Figure 2A). Moreover, there are direct interactions between this SE and the promoter region of HSAL3, as is illustrated by chromatin interaction analysis by paired-end tag (ChIA-PET) analysis in HepG2 cells (Figure 2B). The SE of HSAL3 was further divided into three constituents (E1–E3) and was constructed into the pGL3-promoter vector for luciferase reporter assay. The enhancer activity of E2 was significantly higher in HCC cells compared with negative control DNA segment (Figures 2C and 2D), indicating E2 as a regulation region of the HSAL3 SE. In addition, ChIP-qPCR data of liver cancer samples exhibited that the signal of super-enhancer marker H3K27ac was obviously enriched in enhancer region E2 within HSAL3 SE (Figures 2E–2H). These results confirmed that HSAL3 is a novel SE-driven lncRNA in HCC.
Figure 2.

Identification of HSAL3 as a novel SE-driven lncRNA in HCC
(A) ChIP-seq profiles of HCFC1, HSF1, pol2, and indicated histone markers (H3K4me1, H3K4me3, and H3K27ac) in HepG2 cells. Three constituent enhancers (E1–E3) within the super-enhancer region were cloned into luciferase reporter vector pGL3-promoter. (B) ChIA-PET data displaying spatial interactions between the super-enhancer and promoter of HSAL3 in HepG2 cells. Results in (A) and (B) were respectively reanalyzed from ChIP-seq and ChIA-PET data of HepG2 cells from the ENCODE project (https://www.encodeproject.org/). (C and D) The luciferase activities of these three constituent enhancer elements in HepG2 and LM3 cells (n = 3). The results are presented as mean ± SD. ∗∗∗p < 0.001 by two-tailed Student’s t test. (E–H) ChIP assay of H3K27ac on the enhancer of HSAL3 in tissues from three liver cancer patients. ∗∗∗p < 0.001 by two-tailed Student’s t test.
HCFC1 and HSF1 up-regulated the expression of HSAL3 via its SE
We screened for TFs binding to the SE of HSAL3 by FIMO (Table S1). Pearson correlation analysis among the expression of TFs and HSAL3 was performed in HCC samples from TCGA. Top 11 TFs (including BRCA1, E2F1, FOXM1, HCFC1, HSF1, MYBL2, NELFE, RAD21, SETDB1, SMARCA4, and TRIM28) correlated with the expression of HSAL3 were chosen for further study (Figure 3A). Unsupervised clustering analysis clearly showed that HCC samples were segregated from normal tissues by these 11 TFs (Figure S6). Silencing HCFC1 and HSF1 lowered HSAL3 expression (Figures S7A–S7D; Figures 3B and 3C). On the contrary, overexpression of HCFC1 and HSF1 increased HSAL3 expression (Figures S8A–S8D; Figures 3D and 3E). Apparently, transcription factors HCFC1 and HSF1 can bind to both the promoter and identified SE of HSAL3, which were accompanied by their co-occupancy of both H3K27ac and pol2 binding (Figure 2A). Furthermore, ChIP-qPCR data displayed that HCFC1 (Figures 3F and 3G) and HSF1 (Figures 3H and 3I) bound to E2 within HSAL3 SE, confirming the ChIP-seq result. TFs often do not work alone. Unsurprisingly, co-IP assay followed by immunoblotting demonstrated that HCFC1 can interact with HSF1 in HepG2 and LM3 cells (Figure 3J). Consistently, HSF1 was also found to interact with HCFC1 (Figure 3K). Importantly, the expression levels of HCFC1 and HSF1 were observably increased in HCC patients (Figures 3L and 3M; Figures S9A–S9F). Higher expression of HCFC1 and HSF1 indicated a worse overall survival of HCC patients (Figures 3N and 3O).
Figure 3.

HCFC1 and HSF1 directly bound to the SE of HSAL3
(A) Pearson correlation among the expression of candidate TFs and HSAL3 in HCC patients (n = 371). (B and C) qRT-PCR assay determining the expression of HSAL3 upon silencing of these candidate TFs in HepG2 and LM3 cells (n = 3). The results are presented as mean ± SD. ∗∗p < 0.01; ∗∗∗p < 0.001 by two-tailed Student’s t test. (D and E) qRT-PCR assay testing the effect of HCFC1 and HSF1 overexpression on HSAL3 expression in HepG2 and LM3 cells (n = 3). The results are presented as mean ± SD. ∗∗∗p < 0.001 by two-tailed Student’s t test. (F–I) ChIP assay of (F and G) HCFC1 and (H and I) HSF1 on the enhancer of HSAL3 in HepG2 and LM3 cells (n = 3). The results are presented as mean ± SD. NS, not significant; ∗p < 0.05; ∗∗p < 0.01; ∗∗∗p < 0.001 by two-tailed Student’s t test. (J) The protein interaction of HCFC1 with HSF1 in HepG2 and LM3 cells as determined by endogenous co-IP assay coupled with immunoblotting. (K) The protein interaction of HSF1 with HCFC1 in HepG2 and LM3 cells as validated by endogenous co-IP assay coupled with immunoblotting. (L and M) The expression of HCFC1 and HSF1 in HCC samples (n = 371) and normal liver tissues (n = 50). The p value was calculated by two-tailed Student’s t test. (N and O) Five-year overall survival of TCGA HCC patients (n = 371) stratified based on the expression of HCFC1 and HSF1, respectively. Results in (A) and (L–O) were analyzed based on the HCC dataset downloaded from TCGA (https://cancergenome.nih.gov/). The p value was calculated by Log rank (Mantel-Cox) test, and HR value was estimated by hazard ratio (Mantel-Haenszel).
HSAL3 interference negatively regulates NOTCH signaling pathway
The experiments for subcellular segregation and FISH showed that HSAL3 was mainly distributed in the cytoplasm (Figures S10A–S10D). To figure out the potential pathway and biological function of HSAL3 in HCC cells, three siRNAs (siHSAL3#1, siHSAL3#2, and siHSAL3#3) targeting HSAL3 were tested. The interference efficiency of siHSAL3 sequences in both HCC cell lines was confirmed (Figures S11A and S11B). RNA-seq was performed upon HSAL3 interference in HepG2 and LM3 cells to explore the downstream pathway of HSAL3 in HCC. First, we selected two siRNA targets, siHSAL3#2 and siHSAL3#3, for RNA-seq in two HCC cells. We analyzed differentially expressed genes (DEGs) by comparing siHSAL3 with siNC (negative control). We set the cut-off as |FC| ≥ 1.5 and Q < 0.05 for the identification of down-regulated and up-regulated genes following HSAL3 knockdown in both HepG2 and LM3 cells (Figures S12A and S12B). Samples with or without siHSAL3 treatment were separated from each other by DEGs (Figures S12C and S12D). We acquired 427 shared DEGs in two HCC cells between two siRNA groups (Figure 4A) for following KEGG pathway analysis. KEGG analysis showed that HSAL3 regulates apoptosis, glycolysis, hypoxia, mTOR/mTORC1 signaling, NOTCH signaling, and p53 pathway in HCC cells (Figure 4B). GSEA analysis revealed that HSAL3 interference is negatively correlated with NOTCH signaling (Figures 4C and 4D) in both HCC cells with siRNA treatment. Thus, NOTCH signaling was chosen as a candidate downstream pathway to underlie mechanism of HSAL3’s oncogenic function. Furthermore, HSAL3 interference can reduce mRNA expression and protein level of NOTCH signaling related genes in HepG2 and LM3 cells (Figures 4E–4H). These data suggested that HSAL3 is likely involved in the regulation of NOTCH signaling in HCC.
Figure 4.

NOTCH signaling acts as a candidate downstream pathway of HSAL3 in HCC cells
(A) Overlapping differentially expressed genes (DEGs) among different siRNA groups between two HCC cells (filtered by Q-value ≤ 0.05). DEGs were evaluated by DESeq2 (Love et al.25). (B) Top 10 enriched KEGG pathways of the overlapping DEGs. KEGG analysis of DEGs was conducted by Phyper in R based on hypergeometric test. (C and D) NOTCH pathway was enriched by GSEA analysis in replicated HSAL3 interferences in both HCC cells. NES, Normalized enrichment score; FDR, false discovery rate. NES, p value, and FDR were evaluated by the GSEA software. (E and F) The effect of HSAL3 interference on mRNA level of NOTCH signaling related genes in HepG2 and LM3 cells (n = 3). ∗p < 0.05, ∗∗p < 0.01, ∗∗∗p < 0.001 by two-tailed Student’s t test. (G and H) The effect of HSAL3 interference on protein content of NOTCH signaling related genes in HepG2 and LM3 cells.
HSAL3 promoting HCC cell growth and metastasis indicated a poor prognosis of HCC patients
Next, the biological function of HSAL3 was studied in HCC cells. siRNA-mediated HSAL3 interference prominently decelerated HCC cell proliferation (Figures 5A–5D) but accelerated cell apoptosis induced by oxaliplatin (Figures S13A–S13E). Moreover, siRNA-mediated HSAL3 silencing can strongly suppress HCC cell migration (Figures S14A–S14C). Additionally, siHSAL3 and its control siNC with a modification of 2′-o-Me and 5′-cholesterol were synthesized and intratumorally injected into nude mice. The results revealed that double-modified-siRNA of HSAL3 inhibited tumor xenograft growth of HCC cells (Figures 5E and 5F). Similar to the functional results of siRNAs targeting HSAL3, antisense oligonucleotide (ASO)-mediated HSAL3 silencing can also inhibit cell growth and migration (Figures S15A–S15J). The oncogenic role of HSAL3 in HCC cells was confirmed by HSAL3 overexpression and rescue experiments. HSAL3 overexpression can promote cell proliferation and migration in HCC cells, and siHSAL3 abrogated the increase of cell proliferation and migration by HSAL3 overexpression (Figures S16A–S16G).
To further explore the potential clinical value of HSAL3 in HCC, we examined HSAL3 expression by qRT-PCR in a training set (n = 90) of human HCC tissues. We found that the transcription level of HSAL3 in HCC samples was notably higher than that in normal liver tissues (Figure 5G). In an independent test set (n = 79), the expression of HSAL3 was enhanced in HCC samples as well (Figure 5H). When the training set and the independent test were aggregated (a total of n = 169), the expression level of HSAL3 was also elevated in HCC tissues (Figure 5I). Notably, increased expression of HSAL3 in HCC samples was confirmed by the TCGA-LIHC cohort (n = 421, Figure 5J). Furthermore, with a consistent trend, higher HSAL3 expression can indicate a worse overall survival of HCC patients in the training set, test set, aggregated set (training set + test set) and TCGA set (Figures 5K–5N).
Synthesis and characterization of siHSAL3 loaded nanoparticles (NPs)
Recently, mRNA vaccine delivered via lipid nanoparticles has evolved as a front-runner during the COVID-19 pandemic.26,27 Nanoparticles are a suitable platform as the delivery system of siRNA, and they have been widely approved for the treatment of various diseases.28 The cationic lipid assisted PEG-b-PLGA nanoparticles (CLANs), which is prepared by Food and Drug Administration-approved polymer PEG-PLGA and cationic lipid DOTAP (Figure 6A), was used to encapsulate siRNA through a double emulsion technique. At first, we tested the physiochemical properties of the NPs loading with siRNA. The well-defined spherical FAM-siNC loaded NPs (NPs_FAM-siNC) can be formed with an average size of around 70 nm (Figures 6B and 6C), and its zeta potential is 17.9 mV (Figure 6D). The average size (Figures S17A–S17D) and zeta potential (Figures S17E–S17H) of NPs, NPs_siNC, NPs_siHSAL3#2, and NPs_siHSAL3#3 were similar to those of NPs_FAM-siNC. In vitro release test showed that more than 25% of NPs loading with siRNA were released within 100 h at pH = 5.5, while less than 20% of NPs_siRNAs were released at a pH = 7.4 (Figure 6E). After incubating NPs_FAM-siNC in HepG2 and LM3 cells for 6 h, most of the internalized siRNAs (green fluorescence) entered the cytoplasm where siRNA functions, and similar phenomena were observed in the group of positive control incubating FAM-siNC with transfection reagent in HCC cells (Figures 6F and 6G). To evaluate the safety of NPs_siHSAL3 as a possible therapy, the half maximal inhibitory concentration (IC50) of NPs_siHSAL3 was examined in both HCC cells (Figures 6H and 6I). NPs_siHSAL3 can efficiently inhibit HSAL3 expression in both HCC cells at a dose of 150 nM and 300 nM (Figures 6J and 6K). The effective dose (150 nM) is far lower than the IC50 concentration (501.5 nM in HepG2 and 506.1 nM in LM3), indicating the safety of NPs_siHSAL3.
Figure 6.

Synthesis and characterization of siHSAL3 loaded NPs
(A) Molecular structures of PEG-PLGA, DOTAP, and siRNA, and schematic illustration of the nanoparticles (NPs) platform for systemically delivery of siRNA for HCC treatment. (B) Morphology of NPs_FAM-siNC observed by transmission electron microscope. Scale bar, 100 nm. (C) Diameter and (D) Zeta Potential of NPs_FAM-siNC calculated by Nano ZSE. (E) Cumulative siRNA release from NPs_FAM-siNC incubated in PB buffer at a pH of 5.5 or 7.4. (F and G) Cellular uptake assay exhibiting DNA uptake of HepG2 and LM3 cells treated respectively with FAM-siNC, FAM-siNC transfected with transfection reagent, and NPs_FAM-siNC for 6 h. The cytoskeleton was labeled by Phalloidin-iFluor 555, and the cytonuclear was marked by DAPI. Scale bar, 50 μm. (H and I) The IC50 of NPs_siNC and NPs_siHSAL3 in HepG2 and LM3 cells (n = 5). NPs_siNC was used as a negative control. (J and K) The expression of HSAL3 in HepG2 and LM3 cells treated with NPs_siHSAL3 at different concentrations (n = 4). NS, not significant; ∗p < 0.05; ∗∗∗p < 0.001 by two-tailed Student’s t test. NPs, blank nanoparticles; NPs_siNC, siNC loaded NPs; NPs_FAM-siNC, FAM-siNC loaded NPs; NPs_siHSAL3, siHSAL3 loaded NPs.
siHSAL3 loaded NPs as a novel drug candidate for HCC in vitro and in vivo
To explore the potential therapeutic value of HSAL3, we employed CLAN for systematic delivery of siHSAL3 (Figure 6A). At first, we validated the interference effect of siHSAL3 loaded nanoparticles (NPs_siHSAL3) in HCC cells. Similar to the silencing effect on HSAL3 by in vitro transfection reagent, HSAL3 siRNA#2 loaded nanoparticles (NPs_siHSAL3#2) and HSAL3 siRNA#3 loaded nanoparticles (NPs_siHSAL3#3) yielded a preferable interference effect (Figures 7A and 7B). And then, we performed a series of in vitro exploration to test the effect of NPs_siHSAL3 on HCC cell proliferation. CCK-8 assay showed that NPs_siHSAL3#2 and NPs_siHSAL3#3 restrained cell growth (Figures 7C and 7D). These results were also supported by cell counting (Figures 7E and 7F) and EdU assay (Figures 7G and 7H). The above results demonstrate that siHSAL3 loaded NPs can suppress cellular proliferation of HCC cells.
Figure 7.

NPs-mediated HSAL3 silencing suppressed HCC cell proliferation in vitro
(A and B) HSAL3 expression measured by qRT-PCR in HepG2 and LM3 cells with indicated treatments (n = 4). NS, not significant; ∗∗∗p < 0.001 by two-tailed Student’s t test. (C and D) Cell proliferation ability measured by CCK-8 assay in HepG2 and LM3 cells with indicated treatments (n = 4). ∗∗p < 0.01; ∗∗∗p < 0.001 by two-tailed Student’s t test. (E and F) Cell number of HepG2 and LM3 cells with indicated treatments (n = 4). NS, not significant; ∗p < 0.05; ∗∗p < 0.01; ∗∗∗p < 0.001 by two-tailed Student’s t test. (G and H) DNA synthesis measured by EdU assay in HepG2 and LM3 cells with indicated treatments. NPs, blank nanoparticles; NPs_siNC, negative control; NPs_siHSAL3, siHSAL3 loaded NPs. Scale bar, 50 μm.
Next, NPs_siHSAL3 was intravenously injected into the HCC cell xenograft tumor-bearing mice once every 3 days (Figure 8A). We found that NPs_siHSAL3 can alleviate tumor burden including tumor growth rate (Figure 8B) and tumor weight (Figure 8C). FOLFOX containing folinic acid (FOL), 5-fluorouracil (F), and oxaliplatin (OX; OxP) are recommended as a standard chemotherapy for HCC patients at advanced stages.29 In this study, oxaliplatin was treated as a positive control, and it unsurprisingly alleviated tumor burden such as tumor growth and tumor weight (Figures 8B and 8C). Startlingly, almost equal inhibitory effect on tumor growth and weight was observed between NPs_siHSAL3 and oxaliplatin. The morphological structure of tumor tissues was stained by H&E (Figure 8D). NPs_siHSAL3 and oxaliplatin (positive control) resulted in fewer Ki-67 and more TUNEL-positive cells (Figures 8E and 8F), which mirrored that NPs_siHSAL3 and oxaliplatin can suppress cell proliferation while promoting cell apoptosis in vivo. There was no significant difference in mice weight among all groups (Figure S18). These results indicated the potential of siHSAL3 loaded NPs as a novel therapeutic method for HCC.
Figure 8.

NPs-mediated HSAL3 silencing diminished xenogeneic growth of HCC cells in vivo
(A) Systemic illustration of tumor inoculation and intravenous injections in the HCC cell tumor-bearing nude mice. (B) Tumor xenograft growth and (C) tumor xenograft weights after systemic treatment with vehicle, NPs, NPs_siNC (negative control), NPs_siHSAL3, and oxaliplatin. Six mice per group. NS, not significant; ∗p < 0.05 by two-tailed Student’s t test. (D) H&E, (E) Ki67, and (F) TUNEL staining of tumor tissues; representative H&E staining images are under ×200 magnification (scale bar, 100 μm), and other staining images are under ×400 magnification (scale bar, 100 μm). (G) Graphical illustration of the comprehensive identification of SE-associated lncRNAs in HCC (up). HSAL3 is identified as a novel SE-driven oncogenic lncRNA, which is activated by transcription factors HCFC1 and HSF1 via its super-enhancer (below). HSAL3 interference negatively regulates NOTCH signaling, implying the potential mechanism of its tumor-promoting role (below). Furthermore, siHSAL3 loaded nanoparticles exert anti-tumor effect on HCC (below). NPs, blank NPs; NPs_siNC, NPs loading with siNC; NPs_siHSAL3, NPs loading with siHSAL3.
Discussion
Increasing research underlines that transcriptional events driven by abnormal enhancers are fundamental drivers of cancer initiation and progression.30 SE was considered as a large cluster of active enhancers across a long genomic region,11,23 and it can be distinguished from TE by ChIP-seq with H3K27ac.31 Our team and others have focused on the identification of SE-associated coding oncogenes in various cancers such as nasopharyngeal carcinoma,15 esophageal squamous cell carcinoma,14 Ewing sarcoma,16 anaplastic thyroid carcinoma,13 and HCC.17 The present study comprehensively screened SE-associated oncogenes from the point of lncRNA in HCC for the first time and identified several SE-associated lncRNAs in HCC cells. As two inhibitors of broadly expressed transcriptional regulatory proteins, THZ1 and JQ1 can selectively inhibit cancer-associated SEs.23,32 Several studies have demonstrated that when exposed to THZ113,14,15,16 or JQ1,33 the transcription of SE-associated coding genes decreased more than that of TE-associated coding genes. Furthermore, it was reported that recruitment of pol2 occurs in a large number of enhancers.34 Consistently, we found that pol2-mediated transcription of SE-associated lncRNAs was more sensitive to JQ1 treatment in a genome-wide manner.
Many prognostic biomarkers or molecules classified as encoding genes have been reported in HCC research, such as CDK1,35 SLC25A11,36 and CD147.37 In recent years, lncRNA has been found to play an important role in the metastasis and prognosis of HCC.38,39 For example, ATB,40 TUG1,41 and SNHG642 are frequently up-regulated in HCC samples and associated with a poor prognosis. What’s more, our team and others found that the expression of certain lncRNA was driven by SE, such as LINC01503,43 CCAT1,44 and HCCL5.22 These studies mainly focused on a single lncRNA, and the high expression of the lncRNA was due to the activation of its SE and promoter. In this study, we further integrally screened and identified some known and novel SE-associated lncRNAs that owned a relatively higher abundance as well as were more sensitive to JQ1 treatment. These known SE-lncRNA profiles identified by us are reported to play a core role in HCC, such as MALAT1,45,46,47 SNHG1,48 H19,49,50 HOTAIR,51 and PVT1.52 As an example, HSAL3 is an uncharacterized SE-driven oncogenic lncRNA, and it accelerated cell growth and migration of HCC cells. Furthermore, the expression of HSAL3 was increased in HCC samples, and its high expression indicated an inferior overall survival of HCC patients. These results mirrored that the lncRNAs as both SE-associated and JQ1-sensitive are crucial for HCC malignant phenotypes. The result also suggested that SE-associated lncRNAs can provide more specific prognostic biomarkers and drug targets to HCC.
Enhancers including SEs work momentously in the command of cell type-specific gene expression programs by the binding of TFs and interactions with promoters.53 Here, we showed that there exist interactions between the SE of HSAL3 and its promoter. Meanwhile, we found that the two TFs (HCFC1 and HSF1) bound to HSAL3 at the SE locus and activated its transcription. HCFC1 (also named HCF-1) is a crucial transcription factor involved in the control of cell cycle and proliferation.54,55 HSF1 is the guardian of the cellular proteome and insults damage,56,57,58 and its activity is momentous for many signaling pathways including p53 signaling.56 We further found that the expression of HCFC1 and HSF1 were elevated in HCC samples, and their high expression indicated a poor prognosis of HCC patients, which was consistent with previous reports.59,60 These results indicated that HCFC1 and HSF1 may be vital SE-promoting TFs during HCC oncogenesis.
Recently, nanoparticles as a delivery system of therapeutic agents have expanded into a broad range of clinical applications, and a variety of nanoparticle-based drugs have been approved for cancer therapy. They have been used as a delivery system for small molecule, protein, antibody, and nucleic acid drugs. Actually, the first vaccine candidate launched into clinical trials is an mRNA vaccine for COVID-19 delivered via lipid nanoparticles.26 The first siRNA drug Patisirna also used nanoparticles to achieve successful clinical application. Nanoparticles have been reported to deliver siRNAs of lncRNA AFAP1-AS1 to reverse radio-resistance in triple-negative breast cancer patients.61 We used cationic lipid assisted PEG-b-PLGA nanoparticles (CLANs)62 to deliver siRNAs of HSAL3, which can suppress cell proliferation in vitro as well as decelerate tumor growth in vivo. These results displayed that siHSAL3 loaded nanoparticles have the potential to act as a promising strategy for HCC treatment.
In a nutshell, this is the first comprehensive study of SE-associated lncRNAs in HCC. HSAL3 was identified as a novel SE-driven oncogenic lncRNA, which is activated by transcription factors HCFC1 and HSF1 via its super-enhancer. HSAL3 interference negatively regulates NOTCH signaling, implying the potential mechanism of its tumor-promoting role. Importantly, siHSAL3 loaded nanoparticles displayed a novel and potential therapeutic efficacy for HCC in vitro and in vivo (Figure 8G). This work may help uncover the merit of anchoring SE-driven oncogenic lncRNAs for HCC treatment.
Materials and methods
HCC cell lines and samples
HCC cell lines HepG2 and HCC-LM3 (LM3) were purchased from BlueFBio Biology Technology Development Corporation (China) and FuHeng Biology Corporation (China), respectively. The cell lines were cultured in DMEM (Thermo Fisher Scientific, USA) supplemental with 10% fetal bovine serum (FBS) (Gibco, USA) and penicillin and streptomycin (Hyclone, USA) in an incubator with 5% CO2 at 37°C.
Fresh liver cancer tissues (three samples) were collected from Sun Yat-Sen Memorial Hospital (Guangzhou, China). Written informed consent was obtained from the patients and the experiment was approved by the Institutional Review Board of the Sun Yat-sen Memorial Hospital of Sun Yat-sen University. Commercial cDNA arrays of HCC and adjacent liver tissues (MecDNA-HLivH090Su01 and MecDNA-HLivH087Su02) were purchased from Outdo (Shanghai Outdo Biotech Company, China), and were approved by the Ethics Committee of Shanghai Outdo Biotech Company.
Chemicals and antibodies
JQ1 was acquired from APExBIO (APExBIO Technology LLC., USA), dissolved in dimethyl sulfoxide (DMSO), and kept at −80°C after subpackage. Oxaliplatin was purchased from Selleck (Selleck Chemicals LLC, USA) and then dissolved in 5% glucose (with warming).
Transfection of siRNA, antisense oligonucleotide, and overexpression vectors
siRNAs were designed and synthesized by Ribobio or GenePharma (China). Antisense oligonucleotides (ASOs) were designed and synthesized by Ribobio (China). siRNAs or ASOs were transfected into HCC cell lines by Lipofectamine RNAiMAX Transfection Reagent (Invitrogen, USA). The sequences of siRNA (Table S2) and ASO (Table S3) are provided in the supplemental information.
HSAL3, HCFC1, and HSF1 full-length HSAL3, HCFC1, and HSF1 were respectively synthesized and then cloned into the pcDNA3.1(+) overexpression vector (Dahong Biotechnology Corporation, China). These three overexpression vectors were transfected into HCC cells by using ViaFect Transfection Reagent (Promega, USA).
Quantitative RT-PCR
Total RNA was collected by RNA Quick Purification kit (ESscience, China) and reversely transcribed to cDNA by RevertAid First Strand cDNA Synthesis Kit (Fermentas, USA). qRT-PCR was conducted with LightCycler 480 SYBR Green I Master (Roche, Germany) in Roche LightCycler 480 II (Roche, Germany). The primer sequences are provided in the supplemental information (Table S4).
Western blot
Total protein concentrations were quantitated, then mixed and denatured for 10 min with 5 × SDS sample buffer. Equal amounts of total protein were loaded onto an acrylamide gel, separated by electrophoresis and blotted onto a PVDF membrane (Millipore, USA). Membranes were blocked for 1 h with 5% skimmed milk powder in PBST buffer. After washing with PBST, membranes were kept at 4°C overnight with the primary antibodies. Membranes were then washed three times with PBST and incubated for 1 h with second antibodies at room temperature. Following three washings with PBST, bands were visualized using ECL Chemiluminescence Detection Kit (Proteintech, China) and/or SuperSignal West Femto Maximum Sensitivity Substrate (Invitrogen, USA). β-tubulin was used as loading control. More information about this method is provided in the supplemental information (Table S5).
Co-immunoprecipitation
HCC cells were lysed and the supernatants were collected. The cell lysates were incubated with IP antibodies (Table S5) for 2 h at 4°C with rotation, and then incubated together with protein A/G beads (Thermo Fisher Scientific, USA) at 4°C with rotation overnight. The pellets were washed and boiled in SDS-PAGE loading buffer, which were subsequently subjected to immunoblot.
Subcellular segregation
Nuclear and cytoplasmic RNAs were extracted from fresh HCC cells using the Protein And RNA Isolation System (PARIS system; Invitrogen, USA) according to the manufacturer’s instructions. The nuclear and cytoplasmic cDNA was respectively synthesized by RevertAid First Strand cDNA Synthesis Kit (Fermentas, USA) and then determined by qRT-PCR as previously described.22
Fluorescence in situ hybridization
The sequence of the lncRNA HSAL3 probe is 5′-CGCACUCAGACCCACCCUUCCCCAGACACC-3′. HepG2 and LM3 cells were seeded into Confocal Dish and cultured overnight. The cells were fixed, incubated with probe, and stained with DAPI. Images were acquired using a Laser Scanning Confocal Microscope (Zeiss LSM 800 with airyscan; Zeiss, Germany).
CCK-8 assay
The viability of cells and IC50 of NPs were measured using the Cell Counting Kit-8 (CCK-8) assay (Dojindo, Japan). Cells were seeded in a 96-well plate, with four replicates per group. CCK-8 reagent was added into each well at different time points (1, 3, 5 days), and incubated for an additional 2 h at 37°C away from light. The absorbance at 450 nm was examined on Automatic Microplate Reader (Spark10M; TECAN, Switzerland). The cell growth curve was plotted, and IC50 values were determined using GraphPad Prism 8.0.
EdU assay
We performed the EdU assay to assess DNA synthesis, which indicates cell proliferation, using an EdU Apollo567 Kit (RiboBio, China). Stained HCC cells were photographed using a Laser Scanning Confocal Microscope (Zeiss LSM 800 with airyscan; Zeiss, Germany).
Transwell assay
HCC cells were seeded into the upper chamber of Transwell chambers (Corning, USA) with FBS-free DMEM. DMEM supplemented with 20% FBS was added to the lower chamber as a chemoattractant. Migrated cells were stained by 0.1% crystal violet for 10 min, fixed in 4% paraformaldehyde for 30 min, and then photographed under a microscope.
Wound-healing scratch assay
To determine cell motility, transfected HCC cells with siRNAs or ASOs were seeded into 24-well plates. Following the adherence of cells to plates overnight, the monolayers were scratched by a 200-μL pipet tip to produce a wound, and then were washed five times with sterile PBS. Images from the same field were photographed by an optical microscope at 0 h and 48 h. For each image, width between the scratch at the same magnification was calculated by Image Pro-Plus software (IPP; Media Cybernetics). Migration rate was determined as a percentage of the migrating gap to initial wound distance.
Annexin V apoptosis detection
Annexin V Apoptosis Detection Kit (eBioscience, USA) was used to detect the apoptosis rate of HCC cells transfected with siRNA and treated by oxaliplatin. The cells were analyzed with flow cytometry (BD Biosciences, USA) equipped with Cell Quest software (BD Biosciences, USA).
ChIP-seq and ChIP-qPCR
LM3 cells were cross-linked with 1% formaldehyde at room temperature for 10 min, followed by the addition of glycine to terminate cross-linking. After washing with cold PBS, cell sonication was conducted by Bioruptor (Diagenode, Belgium) and the cleared chromatin samples were incubated with histone-3-lysine-27 acetylation (H3K27ac) conjugated Protein A/G Magnetic Beads (Pierce, USA) overnight at 4°C. Beads bound with chromatin were then extensively washed and eluted. Eluted chromatin was de-cross-linked overnight at 65°C, followed by proteinase K and RNase A digestion and DNA purification with GENEJET RNA PURIFICATION KIT (Invitrogen, USA). The purified ChIP DNA samples and their input DNA were diluted and send to BGI Genomics (BGI-Shenzhen, China) for library construction and sequencing.
For ChIP-qPCR, around 100 mg liver cancer tissues were minced and dispersed adequately by a Hand Disperser (Kinematica AG, Switzerland). Dispersed tissues and fresh cells (HepG2 and LM3) were cross-linked with 1% formaldehyde at room temperature for 30 min and 10 min, respectively. The subsequent steps were the same as that for ChIP-seq. The purified ChIP DNA samples and their input DNA were used for qRT-PCR. Primers for ChIP-qPCR are provided in the supplemental information (Table S6).
Clean data of H3K27ac ChIP-seq in LM3 cells were afforded by BGI Genomics (BGI-Shenzhen, China), which have already had low-quality and adaptor sequences removed. ChIP-seq data (bigwig files) of pol2, H3K4me1, H3K4me3, and H3K27ac profiles in HepG2 were downloaded from UCSC (http://genome.ucsc.edu/ENCODE/downloads.html). ChIP-seq data (bigwig files) of transcription factors HCFC1 and HSF1 in HepG2 were respectively downloaded from NCBI GEO using GSE91846 (sample GSM2423623) and GSE31477 (sample GSM935626). ChIP-seq data (fastq file) for the H3K27ac profiles of normal liver tissue and HepG2 cells, including their matched input chromatin, were downloaded from EMBL-EBI (https://www.ebi.ac.uk/; sample SRR2002343) and UCSC (http://genome.ucsc.edu/ENCODE/downloads.html), respectively.
For the analysis of ChIP-seq data, Bowtie2 was used to align sequencing reads onto the human reference genome hg19, MACS2 was used to call peaks, deeptools was used to visualize read coverages, and ROSE was used to identify SEs.
lncRNA-seq and data analysis
HCC cell lines were treated with JQ1, a well-known SE inhibitor. Total RNA was isolated using RNAiso Plus reagent (Takara, Japan) at 24 h post treatment. Concentration and integrity of total RNA were assessed with a Nano Drop and Agilent 2100 Bioanalyzer system (Thermo, USA). Afterward, 1 μg total RNA per sample was prepared to deplete rRNA and build library. The cDNA libraries were subjected to paired-end sequencing on Hiseq 4000 platform (BGI-Shenzhen, China). The library preparation and sequencing were conducted by BGI Genomics.
The sequencing reads of clean data were successively mapped to the human genome by HISAT2, aligned to the gene database by Bowtie2, quantified by RSEM, and analyzed by DESeq2. Finally, a list of lncRNAs, including expression level, fold change, and Q-value, was acquired.
ChIA-PET sequencing analysis
The raw high-throughput sequencing data of RAD21 ChIA-PET in human HepG2 cells was downloaded from ENCODE (https://www.encodeproject.org) using the experiment identifier ENCSR146FPM. All data files of read 1 from paired-end sequencing were merged into a single FASTQ file, so were the files of read 2. ChIA-PET2 is a versatile and flexible pipeline that integrates all steps required for ChIA-PET data analysis, including linker trimming, read alignment, duplicate removal, peak calling and chromatin loop calling.63 Therefore, ChIA-PET2 was used to analyze chromatin loops from the raw sequencing reads using parameters -e 1 -k 2. In the end, Washu Epigenome Browser (http://epigenomegateway.wustl.edu/browser/) was used to visualize the identified chromatin loops.
RNA-seq and analysis
Total RNA was extracted from HCC cells transfected with siHSAL3 or siNC by Trizol method. Final libraries were constructed and subjected to sequencing on BGI Genomics (BGI-Wuhan, China).
The sequencing data were successively filtered with SOAPnuke, mapped to genome using HISAT2, aligned to reference genes by Bowtie2, quantified by RSEM.64 DEGs were evaluated by DESeq2.25 The heatmap was drawn by R’s pheatmap package in RStudio. KEGG analysis of DEGs was conducted by Phyper in R based on hypergeometric test.
Gene set enrichment analysis
GSEA for expressed lncRNAs in HepG2 or LM3 cells treated with JQ1 was performed by clusterProfiler.65 The rank of lncRNAs was determined according to their expression measured by lncRNA-seq in HCC cells. Gene sets with a p < 0.05 after 1,000-time permutation test were considered enriched significantly. SE-associated lncRNAs, TE-associated lncRNAs, and all lncRNAs were used as three pre-defined gene sets, and they were obtained from the result of previous ChIP-seq analysis of H3K27ac in HepG2 or LM3 cells. The difference between the enrichment scores of SE-associated lncRNAs and those of TE-associated lncRNAs was tested by two-tailed t test in R.
Motif discovery
The transcription factor motif binding to SE sequence of lncRNA was predicted using FIMO. The Pearson correlation coefficient between expression levels of these statistically significant transcription factors and lncRNA were calculated by R. Plots were created using R packages corrplot and RColorBrewer.
Dual-luciferase reporter assay
The identified SE of HSAL3 was divided into three regions: E1, E2, and E3. The sequences of three enhancers (i.e., E1, E2, and E3) and non-enhancers (i.e., NC, negative control) were acquired through Integrative Genomics Viewer (IGV). The sequences of E1, E2, E3, and NC (Table S7) were synthesized and cloned into pGL3-promoter luciferase vector (Igebio, China). These well-constructed vectors and pRL-TK were co-transfected into HCC cells using ViaFect Transfection Reagent (Promega, USA). After 48 h of transfection, luciferase activity was automatically detected by GloMax Navigator (Promega, USA) with the Dual-Luciferase Reporter Assay Kit (Promega, USA). Relative luciferase activity was reckoned by the ratio of firefly/renilla luminance.
Characterizations of nanoparticles
Purified, sterile, and endotoxin-free nanoparticles (NPs) enveloped with target siRNAs were acquired from Kelanbio (China). Morphology of NPs was viewed by transmission electron microscope (HT7800, Hitachi, Japan). Diameter and zeta potential of NPs were calculated by Nano ZSE (Zetasizer Nano ZSE, Malvern, UK).
In vitro release test of siRNA-loaded nanoparticles
The FAM-siRNA-loaded nanoparticles were used to determine the release behavior of nanoparticles. Briefly, the FAM-siRNA-loaded nanoparticles were resuspended in the PB buffer (0.02 M, pH 5.5 or 7.4) in triplicate at 37°C with gentle shaking. At predetermined time intervals, the samples were taken and centrifuged (12,000 rpm, 2 h) to collect the supernatant. And then, the concentration of FAM-siRNA was measured by Spectrofluorophotometer (RF-6000, Shimadzu, Japan) according to a previous report.66
Cellular uptake assay
The HepG2 and LM3 cells were plated in confocal dishes, and then incubated with the FAM-siNC loaded nanoparticles for 6 h. The medium containing nanoparticles was abandoned and washed with PBS for three times. After respectively staining the cell membrane with Phalloidin-iFluor 555 and the cell nucleus with DAPI, the cellular uptake efficiency was observed under Confocal Laser Scanning Microscope (CLSM; Zeiss LSM 800 with airyscan, Zeiss, Germany).
Subcutaneous xenotransplanted tumor model
Immunocompromised male BALB/c nude mice were used in this study. Given that global HCC is more common in men than in women,1 we chose to use male BALB/c mice for the present study. All animal procedures were performed under the guidelines approved by the Laboratory Animal Ethics Committee of the Guangzhou Huateng Biomedical Technology or the Institutional Animal Care and Use Committee of Sun Yat-Sen University. At the same time, all animal experiments conformed to the Animal Research: Reporting of In Vivo Experiments (ARRIVE) guidelines.
For siRNA-related in vivo experiment, HCC cells were digested and resuspended in PBS at a concentration of 2 × 10⁶ cells/50 μL and mixed with Matrigel at a ratio of 1:1 respectively. The mixture (100 μL) was subcutaneously injected into the right flank of immunocompromised male BALB/c nude mice (3 weeks old). After 8 days of treatment, mice were divided into two groups: in vivo siHSAL3 and siNC according to balanced tumor volume. In vivo siHSAL3 and its control siNC with a modification of 2′-o-Me and 5′-cholesterol were synthesized by GenePharma (China). All mice were intratumorally injected with double-modified siHSAL3 or siNC (5 nmol per injection) every 3 days. After five times of injection, mice were killed, and their tumors were collected and weighed.
For nanoparticle (NP) related in vivo experiment, HCC cells were digested and resuspended in PBS at a concentration of 1 × 10⁶ cells/50 μL and mixed with Matrigel at a ratio of 1:1, respectively. The mixture (100 μL) was subcutaneously injected into the right flank of immunocompromised male BALB/c nude mice (4 weeks old). After 12 days of treatment, mice were divided into five groups: Vehicle, NPs (5 nmol per injection), NPs_siNC, NPs_siHSAL3, and oxaliplatin according to balanced tumor volume and weight. All mice were injected with isovolumetric vehicle (1×PBS, 100 μL), NPs (50 mg/kg, 100 μL), NPs_siNC (50 mg/kg, 100 μL), NPs_siHSAL3 (50 mg/kg, 100 μL), or oxaliplatin (5 mg/kg, 100 μL) every 3 days via tail vein. After injection with five times, mice were killed, and their tumors were collected and weighed. Histological evaluation of the tumor samples was performed as well.
For siRNA and NP-related in vivo experiments, tumor size was measured once every 3 days using a Vernier caliper across its two perpendicular diameters, and tumor volume was calculated using the following formula: V = 1/2×L×W2; where V is the tumor volume, L is the largest diameter, and W is the smallest diameter.
H&E staining
Tumor tissues from nude mice were fixed using 4% paraformaldehyde, and then underwent embedding, slicing, and deparaffinizing. H&E staining was implemented following the standard protocols. Optical microscope (Nikon, Japan) was used for observing results and capturing pictures.
Ki-67 staining
To assess the proliferation of tumor cells, Ki-67 staining was detected in xenograft tumor tissues. The dewaxed tumor sections were incubated with Ki-67 antibody. Positively stained (Ki67+) cells were inspected by optical microscope (Nikon, Japan).
TUNEL staining
Apoptotic cells of tumor tissues were detected by Terminal deoxynucleotidyl transferase (TdT) dUTP Nick-End Labeling (TUNEL) kit following the manufacturer’s protocol. Positively stained (TUNEL+) cells were imaged by optical microscope (Nikon, Japan).
Statistical analysis
Statistical analysis was conducted using R (version 3.6.1), SPSS software (version 17.0, SPSS Inc), or GraphPad Prism 8 (GraphPad software), whichever was appropriate. Statistical significance was evaluated using two-tailed Student’s t test between independent groups, paired t test between paired groups, or one-way ANOVA among three or more groups. Data were expressed as mean ± SD, and p < 0.05 was defined as statistical significance.
Data availability
All data presented in this work are available from the authors upon reasonable request. The raw sequencing data generated in this study are available in NCBI GEO under the accession number GSE181755. The H3K27ac ChIP-seq data of LM3 cells were stored in GEO under the accession number GSE181753; the lncRNA-seq data of HepG2 and LM3 cells with the treatment of JQ1 or DMSO were stored in GEO under the accession number GSE181754.
Acknowledgments
This work was supported by National Natural Science Foundation of China (grant no. 81972658 and 81802812 to L.P., grant no. 81803636 to X.-Q.Y.), Guangdong Basic and Applied Basic Research Foundation (grant no. 2019A1515012114 and 2018A030313129 to L.P., grant no. 2018A0303130329 to X.-Q.Y.), National Postdoctoral Program for Innovation Talents (grant no. BX20190395 to L.P.), China Postdoctoral Science Foundation (grant no. 2019M663254 to L.P.), and the Fundamental Research Funds for the Central Universities (grant no. 20ykpy105 to L.P.).
Author contributions
Study concept and design, L.P. and X.-Q.Y.; acquisition of data, X.-Q.Y., N.Z., J.-P.W., L.P., S.W., and C.-Y.Z.; analysis and interpretation of data, N.Z., X.-Q.Y., and L.P.; drafting of the manuscript, X.-Q.Y. and L.P.; critical revision of the manuscript for important intellectual content, J.-P.W., X.-Q.Y., N.Z., X.-Z.Y., and L.P.; statistical analysis, N.Z. and L.P.; obtained funding, L.P. and X.-Q.Y.; administrative, technical, or material support, L.P., J.-P.W., X.-Z.Y., and G.-C.L.; study supervision, L.P.
Declaration of interests
The authors declare no competing interests.
Footnotes
Supplemental information can be found online at https://doi.org/10.1016/j.ymthe.2022.11.013.
Supplemental information
References
- 1.Sung H., Ferlay J., Siegel R.L., Laversanne M., Soerjomataram I., Jemal A., et al. Global cancer statistics 2020: GLOBOCAN estimates of incidence and mortality worldwide for 36 cancers in 185 countries. CA Cancer J. Clin. 2021;71:209–249. doi: 10.3322/caac.21660. [DOI] [PubMed] [Google Scholar]
- 2.Feng R.M., Zong Y.N., Cao S.M., Xu R.H. Current cancer situation in China: good or bad news from the 2018 Global Cancer Statistics? Cancer Commun. (Lond) 2019;39:22. doi: 10.1186/s40880-019-0368-6. [DOI] [PMC free article] [PubMed] [Google Scholar]
- 3.Siegel R.L., Miller K.D., Fuchs H.E., Jemal A. Cancer statistics, 2021. CA Cancer J. Clin. 2021;71:7–33. doi: 10.3322/caac.21654. [DOI] [PubMed] [Google Scholar]
- 4.Llovet J.M., Kelley R.K., Villanueva A., Singal A.G., Pikarsky E., Roayaie S., Lencioni R., Koike K., Zucman-Rossi J., Finn R.S. Hepatocellular carcinoma. Nat. Rev. Dis. Primers. 2021;7:6. doi: 10.1038/s41572-020-00240-3. [DOI] [PubMed] [Google Scholar]
- 5.Huang A., Yang X.R., Chung W.Y., Dennison A.R., Zhou J. Targeted therapy for hepatocellular carcinoma. Signal Transduct. Target. Ther. 2020;5:146. doi: 10.1038/s41392-020-00264-x. [DOI] [PMC free article] [PubMed] [Google Scholar]
- 6.Kudo M. Recent advances in systemic therapy for hepatocellular carcinoma in an aging Society: 2020 Update. Liver Cancer. 2020;9:640–662. doi: 10.1159/000511001. [DOI] [PMC free article] [PubMed] [Google Scholar]
- 7.Llovet J.M., Montal R., Sia D., Finn R.S. Molecular therapies and precision medicine for hepatocellular carcinoma. Nat. Rev. Clin. Oncol. 2018;15:599–616. doi: 10.1038/s41571-018-0073-4. [DOI] [PMC free article] [PubMed] [Google Scholar]
- 8.Jemal A., Ward E.M., Johnson C.J., Cronin K.A., Ma J., Ryerson B., et al. Annual report to the Nation on the Status of cancer, 1975-2014, Featuring survival. J. Natl. Cancer Inst. 2017;109:djx030 doi: 10.1093/jnci/djx030. [DOI] [PMC free article] [PubMed] [Google Scholar]
- 9.Wang X., Cairns M.J., Yan J. Super-enhancers in transcriptional regulation and genome organization. Nucleic Acids Res. 2019;47:11481–11496. doi: 10.1093/nar/gkz1038. [DOI] [PMC free article] [PubMed] [Google Scholar]
- 10.Whyte W.A., Orlando D.A., Hnisz D., Abraham B.J., Lin C.Y., Kagey M.H., Rahl P.B., Lee T.I., Young R.A. Master transcription factors and mediator establish super-enhancers at key cell identity genes. Cell. 2013;153:307–319. doi: 10.1016/j.cell.2013.03.035. [DOI] [PMC free article] [PubMed] [Google Scholar]
- 11.Hnisz D., Abraham B.J., Lee T.I., Lau A., Saint-Andre V., Sigova A.A., Hoke H.A., Young R.A. Super-enhancers in the control of cell identity and disease. Cell. 2013;155:934–947. doi: 10.1016/j.cell.2013.09.053. [DOI] [PMC free article] [PubMed] [Google Scholar]
- 12.Li Y., Gao J., Kamran M., Harmacek L., Danhorn T., Leach S.M., O'Connor B.P., Hagman J.R., Huang H. GATA2 regulates mast cell identity and responsiveness to antigenic stimulation by promoting chromatin remodeling at super-enhancers. Nat. Commun. 2021;12:494. doi: 10.1038/s41467-020-20766-0. [DOI] [PMC free article] [PubMed] [Google Scholar]
- 13.Cao X., Dang L., Zheng X., Lu Y., Lu Y., Ji R., Zhang T., Ruan X., Zhi J., Hou X., et al. Targeting super-enhancer-driven oncogenic transcription by CDK7 inhibition in anaplastic thyroid carcinoma. Thyroid. 2019;29:809–823. doi: 10.1089/thy.2018.0550. [DOI] [PubMed] [Google Scholar]
- 14.Jiang Y.Y., Lin D.C., Mayakonda A., Hazawa M., Ding L.W., Chien W.W., Xu L., Chen Y., Xiao J.F., Senapedis W., et al. Targeting super-enhancer-associated oncogenes in oesophageal squamous cell carcinoma. Gut. 2017;66:1358–1368. doi: 10.1136/gutjnl-2016-311818. [DOI] [PMC free article] [PubMed] [Google Scholar]
- 15.Yuan J., Jiang Y.Y., Mayakonda A., Huang M., Ding L.W., Lin H., Yu F., Lu Y., Loh T.K.S., Chow M., et al. Super-enhancers promote transcriptional dysregulation in nasopharyngeal carcinoma. Cancer Res. 2017;77:6614–6626. doi: 10.1158/0008-5472.CAN-17-1143. [DOI] [PMC free article] [PubMed] [Google Scholar]
- 16.Lin L., Huang M., Shi X., Mayakonda A., Hu K., Jiang Y.Y., Guo X., Chen L., Pang B., Doan N., et al. Super-enhancer-associated MEIS1 promotes transcriptional dysregulation in Ewing sarcoma in co-operation with EWS-FLI1. Nucleic Acids Res. 2019;47:1255–1267. doi: 10.1093/nar/gky1207. [DOI] [PMC free article] [PubMed] [Google Scholar]
- 17.Tsang F.H., Law C.T., Tang T.C., Cheng C.L., Chin D.W., Tam W.V., Wei L., Wong C.C., Ng I.O., Wong C.M. Aberrant super-enhancer landscape in human hepatocellular carcinoma. Hepatology. 2019;69:2502–2517. doi: 10.1002/hep.30544. [DOI] [PubMed] [Google Scholar]
- 18.Daneshvar K., Ardehali M.B., Klein I.A., Hsieh F.K., Kratkiewicz A.J., Mahpour A., et al. lncRNA DIGIT and BRD3 protein form phase-separated condensates to regulate endoderm differentiation. Nat. Cell Biol. 2020;22:1211–1222. doi: 10.1038/s41556-020-0572-2. [DOI] [PMC free article] [PubMed] [Google Scholar]
- 19.Li G., Kryczek I., Nam J., Li X., Li S., Li J., et al. LIMIT is an immunogenic lncRNA in cancer immunity and immunotherapy. Nat. Cell Biol. 2021;23:526–537. doi: 10.1038/s41556-021-00672-3. [DOI] [PMC free article] [PubMed] [Google Scholar]
- 20.Allou L., Balzano S., Magg A., Quinodoz M., Royer-Bertrand B., Schöpflin R., Chan W.L., Speck-Martins C.E., Carvalho D.R., Farage L., et al. Non-coding deletions identify Maenli lncRNA as a limb-specific En1 regulator. Nature. 2021;592:93–98. doi: 10.1038/s41586-021-03208-9. [DOI] [PubMed] [Google Scholar]
- 21.Feretzaki M., Pospisilova M., Valador Fernandes R., Lunardi T., Krejci L., Lingner J. RAD51-dependent recruitment of TERRA lncRNA to telomeres through R-loops. Nature. 2020;587:303–308. doi: 10.1038/s41586-020-2815-6. [DOI] [PMC free article] [PubMed] [Google Scholar]
- 22.Peng L., Jiang B., Yuan X., Qiu Y., Peng J., Huang Y., Zhang C., Zhang Y., Lin Z., Li J., et al. Super-enhancer-associated long noncoding RNA HCCL5 is activated by ZEB1 and promotes the malignancy of hepatocellular carcinoma. Cancer Res. 2019;79:572–584. doi: 10.1158/0008-5472.CAN-18-0367. [DOI] [PubMed] [Google Scholar]
- 23.Lovén J., Hoke H.A., Lin C.Y., Lau A., Orlando D.A., Vakoc C.R., Bradner J.E., Lee T.I., Young R.A. Selective inhibition of tumor oncogenes by disruption of super-enhancers. Cell. 2013;153:320–334. doi: 10.1016/j.cell.2013.03.036. [DOI] [PMC free article] [PubMed] [Google Scholar]
- 24.Jang M.K., Mochizuki K., Zhou M., Jeong H.S., Brady J.N., Ozato K. The bromodomain protein Brd4 is a positive regulatory component of P-TEFb and stimulates RNA polymerase II-dependent transcription. Mol. Cell. 2005;19:523–534. doi: 10.1016/j.molcel.2005.06.027. [DOI] [PubMed] [Google Scholar]
- 25.Love M.I., Huber W., Anders S. Moderated estimation of fold change and dispersion for RNA-seq data with DESeq2. Genome Biol. 2014;15:550. doi: 10.1186/s13059-014-0550-8. [DOI] [PMC free article] [PubMed] [Google Scholar]
- 26.Shin M.D., Shukla S., Chung Y.H., Beiss V., Chan S.K., Ortega-Rivera O.A., et al. COVID-19 vaccine development and a potential nanomaterial path forward. Nat. Nanotechnol. 2020;15:646–655. doi: 10.1038/s41565-020-0737-y. [DOI] [PubMed] [Google Scholar]
- 27.Kim J., Eygeris Y., Gupta M., Sahay G. Self-assembled mRNA vaccines. Adv. Drug Deliv. Rev. 2021;170:83–112. doi: 10.1016/j.addr.2020.12.014. [DOI] [PMC free article] [PubMed] [Google Scholar]
- 28.Yonezawa S., Koide H., Asai T. Recent advances in siRNA delivery mediated by lipid-based nanoparticles. Adv. Drug Deliv. Rev. 2020;154-155:64–78. doi: 10.1016/j.addr.2020.07.022. [DOI] [PMC free article] [PubMed] [Google Scholar]
- 29.Guo J., Yu Z., Sun D., Zou Y., Liu Y., Huang L. Two nanoformulations induce reactive oxygen species and immunogenetic cell death for synergistic chemo-immunotherapy eradicating colorectal cancer and hepatocellular carcinoma. Mol. Cancer. 2021;20:10. doi: 10.1186/s12943-020-01297-0. [DOI] [PMC free article] [PubMed] [Google Scholar]
- 30.Xiong L., Wu F., Wu Q., Xu L., Cheung O.K., Kang W., Mok M.T., Szeto L.L.M., Lun C.Y., Lung R.W., et al. Aberrant enhancer hypomethylation contributes to hepatic carcinogenesis through global transcriptional reprogramming. Nat. Commun. 2019;10:335. doi: 10.1038/s41467-018-08245-z. [DOI] [PMC free article] [PubMed] [Google Scholar]
- 31.Heinz S., Romanoski C.E., Benner C., Glass C.K. The selection and function of cell type-specific enhancers. Nat. Rev. Mol. Cell Biol. 2015;16:144–154. doi: 10.1038/nrm3949. [DOI] [PMC free article] [PubMed] [Google Scholar]
- 32.Sur I., Taipale J. The role of enhancers in cancer. Nat. Rev. Cancer. 2016;16:483–493. doi: 10.1038/nrc.2016.62. [DOI] [PubMed] [Google Scholar]
- 33.Jia Y., Chng W.J., Zhou J. Super-enhancers: critical roles and therapeutic targets in hematologic malignancies. J. Hematol. Oncol. 2019;12:77. doi: 10.1186/s13045-019-0757-y. [DOI] [PMC free article] [PubMed] [Google Scholar]
- 34.Gurumurthy A., Yu D.T., Stees J.R., Chamales P., Gavrilova E., Wassel P., et al. Super-enhancer mediated regulation of adult β-globin gene expression: the role of eRNA and integrator. Nucleic Acids Res. 2021;49:1383–1396. doi: 10.1093/nar/gkab002. [DOI] [PMC free article] [PubMed] [Google Scholar]
- 35.Cai J., Li B., Zhu Y., Fang X., Zhu M., Wang M., et al. Prognostic biomarker identification through integrating the gene signatures of hepatocellular carcinoma properties. EBioMedicine. 2017;19:18–30. doi: 10.1016/j.ebiom.2017.04.014. [DOI] [PMC free article] [PubMed] [Google Scholar]
- 36.Pan G., Wang R., Jia S., Li Y., Jiao Y., Liu N. SLC25A11 serves as a novel prognostic biomarker in liver cancer. Sci. Rep. 2020;10:9871. doi: 10.1038/s41598-020-66837-6. [DOI] [PMC free article] [PubMed] [Google Scholar]
- 37.Peng F., Li H., You Q., Li H., Wu D., Jiang C., et al. CD147 as a novel prognostic biomarker for hepatocellular carcinoma: a meta-analysis. Biomed. Research International. 2017;2017:5019367. doi: 10.1155/2017/5019367. [DOI] [PMC free article] [PubMed] [Google Scholar]
- 38.Abbastabar M., Sarfi M., Golestani A., Khalili E. LncRNA involvement in hepatocellular carcinoma metastasis and prognosis. EXCLI J. 2018;17:900–913. doi: 10.17179/excli2018-1541. [DOI] [PMC free article] [PubMed] [Google Scholar]
- 39.Li C., Yang J., Liu C., Wang X., Zhang L. Long non-coding RNAs in hepatocellular carcinoma: ordering of the complicated lncRNA regulatory network and novel strategies for HCC clinical diagnosis and treatment. Pharmacol. Res. 2020;158:104848. doi: 10.1016/j.phrs.2020.104848. [DOI] [PubMed] [Google Scholar]
- 40.Yuan J.H., Yang F., Wang F., Ma J.Z., Guo Y.J., Tao Q.F., Liu F., Pan W., Wang T.T., Zhou C.C., et al. A long noncoding RNA activated by TGF-β promotes the invasion-metastasis cascade in hepatocellular carcinoma. Cancer Cell. 2014;25:666–681. doi: 10.1016/j.ccr.2014.03.010. [DOI] [PubMed] [Google Scholar]
- 41.Liu Y., Mao X., Ma Z., Chen W., Guo X., Yu L., et al. Aberrant regulation of lncRNA TUG1-microRNA-328-3p-SRSF9 mRNA axis in hepatocellular carcinoma: a promising target for prognosis and therapy. Mol. Cancer. 2022;21:36. doi: 10.1186/s12943-021-01493-6. [DOI] [PMC free article] [PubMed] [Google Scholar]
- 42.Chen K., Hou Y., Liao R., Li Y., Yang H., Gong J. LncRNA SNHG6 promotes G1/S-phase transition in hepatocellular carcinoma by impairing miR-204-5p-mediated inhibition of E2F1. Oncogene. 2021;40:3217–3230. doi: 10.1038/s41388-021-01671-2. [DOI] [PubMed] [Google Scholar]
- 43.Xie J.J., Jiang Y.Y., Jiang Y., Li C.Q., Lim M.C., An O., et al. Super-enhancer-driven long non-coding RNA LINC01503, regulated by TP63, is over-expressed and oncogenic in squamous cell carcinoma. Gastroenterology. 2018;154:2137–2151. doi: 10.1053/j.gastro.2018.02.018. [DOI] [PubMed] [Google Scholar]
- 44.Jiang Y., Jiang Y.Y., Xie J.J., Mayakonda A., Hazawa M., Chen L., Xiao J.F., Li C.Q., Huang M.L., Ding L.W., et al. Co-activation of super-enhancer-driven CCAT1 by TP63 and SOX2 promotes squamous cancer progression. Nat. Commun. 2018;9:3619. doi: 10.1038/s41467-018-06081-9. [DOI] [PMC free article] [PubMed] [Google Scholar]
- 45.Malakar P., Shilo A., Mogilevsky A., Stein I., Pikarsky E., Nevo Y., Benyamini H., Elgavish S., Zong X., Prasanth K.V., Karni R. Long noncoding RNA MALAT1 promotes hepatocellular carcinoma development by SRSF1 upregulation and mTOR activation. Cancer Res. 2017;77:1155–1167. doi: 10.1158/0008-5472.CAN-16-1508. [DOI] [PMC free article] [PubMed] [Google Scholar]
- 46.Malakar P., Stein I., Saragovi A., Winkler R., Stern-Ginossar N., Berger M., et al. Long noncoding RNA MALAT1 regulates cancer glucose metabolism by enhancing mTOR-mediated translation of TCF7L2. Cancer Res. 2019;79:2480–2493. doi: 10.1158/0008-5472.CAN-18-1432. [DOI] [PubMed] [Google Scholar]
- 47.Goyal B., Yadav S.R.M., Awasthee N., Gupta S., Kunnumakkara A.B., Gupta S.C. Diagnostic, prognostic, and therapeutic significance of long non-coding RNA MALAT1 in cancer. Biochim. Biophys. Acta Rev. Cancer. 2021;1875:188502. doi: 10.1016/j.bbcan.2021.188502. [DOI] [PubMed] [Google Scholar]
- 48.Li W., Dong X., He C., Tan G., Li Z., Zhai B., et al. LncRNA SNHG1 contributes to sorafenib resistance by activating the Akt pathway and is positively regulated by miR-21 in hepatocellular carcinoma cells. J. Exp. Clin. Cancer Res. 2019;38:183. doi: 10.1186/s13046-019-1177-0. [DOI] [PMC free article] [PubMed] [Google Scholar]
- 49.Huang Z., Chu L., Liang J., Tan X., Wang Y., Wen J., et al. H19 promotes HCC bone metastasis through reducing osteoprotegerin expression in a protein phosphatase 1 catalytic subunit alpha/p38 mitogen-activated protein Kinase-dependent manner and sponging microRNA 200b-3p. Hepatology. 2021;74:214–232. doi: 10.1002/hep.31673. [DOI] [PubMed] [Google Scholar]
- 50.Tietze L., Kessler S.M. The good, the bad, the question-H19 in hepatocellular carcinoma. Cancers. 2020;12:1261. doi: 10.3390/cancers12051261. [DOI] [PMC free article] [PubMed] [Google Scholar]
- 51.Yang L., Peng X., Li Y., Zhang X., Ma Y., Wu C., Fan Q., Wei S., Li H., Liu J. Long non-coding RNA HOTAIR promotes exosome secretion by regulating RAB35 and SNAP23 in hepatocellular carcinoma. Mol. Cancer. 2019;18:78. doi: 10.1186/s12943-019-0990-6. [DOI] [PMC free article] [PubMed] [Google Scholar]
- 52.Wang F., Yuan J.H., Wang S.B., Yang F., Yuan S.X., Ye C., Yang N., Zhou W.P., Li W.L., Li W., Sun S.H. Oncofetal long noncoding RNA PVT1 promotes proliferation and stem cell-like property of hepatocellular carcinoma cells by stabilizing NOP2. Hepatology. 2014;60:1278–1290. doi: 10.1002/hep.27239. [DOI] [PubMed] [Google Scholar]
- 53.Maezawa S., Sakashita A., Yukawa M., Chen X., Takahashi K., Alavattam K.G., Nakata I., Weirauch M.T., Barski A., Namekawa S.H. Super-enhancer switching drives a burst in gene expression at the mitosis-to-meiosis transition. Nat. Struct. Mol. Biol. 2020;27:978–988. doi: 10.1038/s41594-020-0488-3. [DOI] [PMC free article] [PubMed] [Google Scholar]
- 54.Wilson A.C., LaMarco K., Peterson M.G., Herr W. The VP16 accessory protein HCF is a family of polypeptides processed from a large precursor protein. Cell. 1993;74:115–125. doi: 10.1016/0092-8674(93)90299-6. [DOI] [PubMed] [Google Scholar]
- 55.Levine Z.G., Walker S. The biochemistry of O-GlcNAc transferase: which functions make it essential in mammalian cells? Annu. Rev. Biochem. 2016;85:631–657. doi: 10.1146/annurev-biochem-060713-035344. [DOI] [PubMed] [Google Scholar]
- 56.Toma-Jonik A., Vydra N., Janus P., Widłak W. Interplay between HSF1 and p53 signaling pathways in cancer initiation and progression: non-oncogene and oncogene addiction. Cell Oncol. (Dordr) 2019;42:579–589. doi: 10.1007/s13402-019-00452-0. [DOI] [PubMed] [Google Scholar]
- 57.Wang G., Cao P., Fan Y., Tan K. Emerging roles of HSF1 in cancer: cellular and molecular episodes. Biochim. Biophys. Acta Rev. Cancer. 2020;1874 doi: 10.1016/j.bbcan.2020.188390. [DOI] [PubMed] [Google Scholar]
- 58.Boellmann F., Guettouche T., Guo Y., Fenna M., Mnayer L., Voellmy R. DAXX interacts with heat shock factor 1 during stress activation and enhances its transcriptional activity. Proc. Natl. Acad. Sci. USA. 2004;101:4100–4105. doi: 10.1073/pnas.0304768101. [DOI] [PMC free article] [PubMed] [Google Scholar]
- 59.Xiong D.D., Feng Z.B., Lai Z.F., Qin Y., Liu L.M., Fu H.X., et al. High throughput circRNA sequencing analysis reveals novel insights into the mechanism of nitidine chloride against hepatocellular carcinoma. Cell Death Dis. 2019;10:658. doi: 10.1038/s41419-019-1890-9. [DOI] [PMC free article] [PubMed] [Google Scholar]
- 60.Wan T., Shao J., Hu B., Liu G., Luo P., Zhou Y. Prognostic role of HSF1 overexpression in solid tumors: a pooled analysis of 3,159 patients. Onco Targets Ther. 2018;11:383–393. doi: 10.2147/OTT.S153682. [DOI] [PMC free article] [PubMed] [Google Scholar]
- 61.Bi Z., Li Q., Dinglin X., Xu Y., You K., Hong H., et al. Nanoparticles (NPs)-meditated lncRNA AFAP1-AS1 silencing to block Wnt/β-Catenin signaling pathway for synergistic reversal of radioresistance and effective cancer radiotherapy. Adv. Sci. (Weinh) 2020;7:2000915. doi: 10.1002/advs.202000915. [DOI] [PMC free article] [PubMed] [Google Scholar]
- 62.Xu C.F., Iqbal S., Shen S., Luo Y.L., Yang X., Wang J. Development of “CLAN” nanomedicine for nucleic acid therapeutics. Small. 2019;15:e1900055. doi: 10.1002/smll.201900055. [DOI] [PubMed] [Google Scholar]
- 63.Li G., Chen Y., Snyder M.P., Zhang M.Q. ChIA-PET2: a versatile and flexible pipeline for ChIA-PET data analysis. Nucleic Acids Res. 2017;45:e4. doi: 10.1093/nar/gkw809. [DOI] [PMC free article] [PubMed] [Google Scholar]
- 64.Li B., Dewey C.N. RSEM: accurate transcript quantification from RNA-Seq data with or without a reference genome. BMC Bioinformatics. 2011;12:323. doi: 10.1186/1471-2105-12-323. [DOI] [PMC free article] [PubMed] [Google Scholar]
- 65.Yu G., Wang L.G., Han Y., He Q.Y. clusterProfiler: an R package for comparing biological themes among gene clusters. Omics. 2012;16:284–287. doi: 10.1089/omi.2011.0118. [DOI] [PMC free article] [PubMed] [Google Scholar]
- 66.Yang X.Z., Dou S., Sun T.M., Mao C.Q., Wang H.X., Wang J. Systemic delivery of siRNA with cationic lipid assisted PEG-PLA nanoparticles for cancer therapy. J. Control Release. 2011;156:203–211. doi: 10.1016/j.jconrel.2011.07.035. [DOI] [PubMed] [Google Scholar]
Associated Data
This section collects any data citations, data availability statements, or supplementary materials included in this article.
Supplementary Materials
Data Availability Statement
All data presented in this work are available from the authors upon reasonable request. The raw sequencing data generated in this study are available in NCBI GEO under the accession number GSE181755. The H3K27ac ChIP-seq data of LM3 cells were stored in GEO under the accession number GSE181753; the lncRNA-seq data of HepG2 and LM3 cells with the treatment of JQ1 or DMSO were stored in GEO under the accession number GSE181754.