

Abstract
Purpose:
To investigate whether rates of standard automated perimetry (SAP) mean deviation (MD) over an initial 2-year follow-up period were predictive of events of visual field progression over an extended follow-up.
Design:
Longitudinal prospective observational study.
Participants:
246 eyes of 168 patients with glaucoma followed every 6 months for up to 5 years.
Methods:
Subjects were required to have a minimum of 5 reliable SAP tests during the first 2 years of follow-up. Events of progression were evaluated using two methods: the Guided Progression Analysis (GPA) and a U.S. Food and Drug Administration (FDA) suggested endpoint. The date of the first test showing progression after the first 2 years was considered as the event date. Rates of change in SAP MD were calculated for the first 2 years of follow-up and joint longitudinal survival models were used to assess the risk of faster initial MD loss for subsequent progression based on each event analysis.
Main outcome measure:
Risk of having an event of progression based on initial rates of SAP MD change.
Results:
56 (22.8%) eyes developed an event of progression by the GPA and 51 (20.7%) by the FDA endpoint. Each 0.1dB/year faster rate of SAP MD loss in the first 2 years was associated with a 26% increase in risk of developing a GPA progression endpoint (R2=76%) and 32% risk of developing an FDA-based endpoint (R2=83%). A reduction of 30% in the rate of MD change in the first 2 years was associated with a 20% reduction in the cumulative probability of developing a progression event over 5 years of follow-up.
Conclusions:
Rates of SAP MD change for eyes with glaucoma calculated over the initial 2 years of follow-up were strongly predictive of events of progression over a subsequent follow-up. Our findings give support for the use of slopes of MD change as suitable endpoints of progression in clinical trials.
Keywords: glaucoma, progression, clinical trial endpoint, mean deviation, perimetry
PRÉCIS
In this prospective study, rates of MD change in the initial 2 years of follow-up were strongly predictive of glaucomatous progression over subsequent years. MD slopes are suitable endpoints for clinical trials in glaucoma.
Standard automated perimetry (SAP) remains the method of choice for monitoring functional changes in glaucoma, a progressive optic neuropathy that is the leading cause of irreversible blindness in the world.1, 2 In addition to its role in clinical care, visual field assessment may serve as an endpoint to evaluate new therapies aimed at slowing down or halting glaucoma progression. The use of this potential endpoint is especially important in the context of potential neuroprotective therapies, which do not rely on intraocular pressure (IOP) reduction.
Several algorithms have been proposed to identify visual field progression over time using different approaches to separate true change from test-retest variability. These approaches can be broadly divided into two categories: event- versus trend-based methods.3 In event-based methods, the differences in visual field sensitivities of follow-up tests are compared to those of previously established baseline exams and if they exceed a certain threshold in a specific number of test locations, significant visual field progression is declared to have occurred. This approach is used by the commercially available Guided Progression Analysis (GPA) software from the Humphrey Field Analyzer (HFA, Carl-Zeiss Meditec, Inc., Dublin, CA).4–6 The GPA is a refinement of the previous event-based Glaucoma Change Probability (GCP), which was used to define the primary clinically relevant endpoint in the oral Memantine trial for glaucoma.7 The difference between GCP and GPA is that while the former uses total deviation values to determine significant change, the latter is based on the pattern deviation values, which decreases potential confounding effects from media opacity.6 The United Kingdom Glaucoma Treatment Study (UKGTS) used GPA as the primary outcome metric in a clinical trial comparing latanoprost to placebo for prevention of visual field loss.8
The Memantine trial enrolled 2298 patients followed for 48 months.7 The size, duration and costs of the trial, however, have been seen as major challenges for setting up similar trials to evaluate new neuroprotective candidates.9, 10 Although the UKGTS estimated a sample size requirement of only 516 participants, this number would most likely not be applicable for clinical trials investigating a new treatment compared to an existing treatment, rather than placebo due to a likely much smaller effect size.8 Recent investigations, however, have proposed that trend-based analyses of visual field data may dramatically reduce the required sample size for such trials.11 In trend-based analyses, visual field sensitivities of all tests available during the follow-up period of interest are analyzed.12–14 Unlike the event-based method, trend analysis does not rely on previously established thresholds (i.e., population-based cut-offs for change) and uses information available from all tests during follow-up. A potential advantage of trend-based methods is that they can provide estimates of rates of visual field change over time.15–17 These estimates are essential in order to identify those patients with fast disease progression who could be at higher risk for developing disability from the disease.
A clinical trial using trend-based analysis would likely rely on evaluating the trend of a global metric such as mean deviation (MD) in treated and control groups. The mean slope of the treatment group would then be compared to that of the control group to determine whether a statistically significant effect resulted from the treatment, using standard statistical methodology such as linear mixed models.18 A current challenge of using trend-based methods, however, is that there is a paucity of information linking the predictive value of slopes of MD change to clinically relevant events of progression in glaucoma. This is especially important given the desirability of assessing those rates of change over relatively short periods of follow-up, e.g., 2 years, to expedite the assessment of potential candidate drugs. Such information is essential to validate slopes of change as suitable endpoints for clinical trials. A particular concern relates to MD potentially being nonspecific for glaucoma change as it may also be affected by media opacities, such as cataract.19, 20 However, if slopes of MD change, especially over short observation periods, are shown to be highly predictive of future clinically relevant events of glaucoma progression as determined by specific methods such as the GPA, such concern would then be alleviated.
In the present study, we investigated whether rates of SAP MD measured over a 2-year follow-up period were predictive of subsequent development of clinically relevant events of visual field progression over an extended follow-up time.
METHODS
This was an observational cohort study. Participants from this study were included in a prospective longitudinal study designed to evaluate optic nerve structure and visual function in glaucoma, conducted at the Duke Vision, Imaging, and Performance (VIP) Laboratory, at Duke University. The institutional review board approved the study methodology, which adhered to the tenets of the Declaration of Helsinki and to the Health Insurance Portability and Accountability Act. Written informed consent was obtained from all participants.
At each visit during follow-up, subjects underwent a comprehensive ophthalmologic examination including review of medical history, best-corrected visual acuity, slit-lamp biomicroscopy, intraocular pressure (IOP) measurement, central corneal thickness (CCT), gonioscopy, dilated fundoscopic examination, stereoscopic optic disc photography, and automated perimetry using Swedish Interactive Threshold Algorithm (SITA Standard 24–2). Only subjects with open angles on gonioscopy were included. Subjects were excluded if they presented with a best-corrected visual acuity less than 20/40, spherical refraction outside ± 5.0 diopters and/or cylinder correction outside 3.0 diopters, or any other ocular or systemic disease that could affect the optic nerve or the visual field. Visual fields with more than 33% false-negative errors or more than 15% false-positive errors were excluded. Visual fields were further reviewed for artifacts such as lid and rim artifacts, fatigue effects, inappropriate fixation, evidence that the visual field results were due to a disease other than glaucoma (such as homonymous hemianopia), and inattention.
For inclusion, subjects had to be diagnosed with primary open-angle glaucoma at the baseline visit. Eyes were included if they had repeatable (two consecutive) abnormal visual field test results on the baseline visits, defined as a pattern standard deviation (PSD) outside of the 95% normal confidence limits, or a Glaucoma Hemifield Test result outside normal limits. Eyes were also required to have glaucomatous appearing optic discs.
Eyes were followed every 6 months for up to 5 years and were required to have a minimum of 5 SAP tests obtained during the initial 2 years of follow-up. The rationale for this requirement was based on the purpose of the study to investigate whether rates of visual field loss measured over the initial 2 years of follow-up were associated with clinically significant “events of progression” occurring during the extended follow-up.
Event-based Analyses
We used 2 methods to assess events of progression. The first method was based on the Guided Progression Analysis from the Humphrey Field Analyzer.5, 6 The GPA performs an analysis of change of each follow-up test compared to the average of 2 baseline tests, based on the pattern deviation points. The pointwise tests of statistical significance for deterioration are based on comparisons to an internal normative database of test-retest variability in glaucomatous eyes. Progression by SAP GPA was defined as a statistically significant decrease from baseline at 3 or more of the same test points on 3 consecutive tests, which is classified by the software as “likely progression”. The date when “likely progression” was flagged for the first time, after the first 2 years of follow-up, was considered as the event date.
We also used an alternative method for assessing events requiring at least 5 visual field points showing a significant depression of at least 7 dB. This endpoint was based on the National Eye Institute (NEI), and the Food and Drug Administration Center for Drug Evaluation and Research (FDA CDER) Glaucoma Clinical Trial Design and Endpoints Symposium report suggesting 7dB as a clinically significant change in the visual field.21 It was also based on an endpoint recently used in a clinical trial investigating visual function effects of a new gene-based therapy for X-linked retinitis pigmentosa, which required improvement of at least 7dB in 5 points.22 This alternative method for assessing events is referred to as “FDA-consistent” endpoint in our study. For confirmed progression, we required the same 5 points to be repeatable on a subsequent test. The date of the first test showing progression, i.e., when progression was flagged for the first time, after the first 2 years was considered as the event date for this analysis.
Statistical Analysis
Rates of SAP mean deviation (MD) were calculated over the first 2 years of follow-up using linear mixed models. These models have been described in detail elsewhere and are optimally suited for analysis of correlated longitudinal data.23 In brief, mixed models take into account the natural correlation of such data over time, as well as the fact that each patient may contribute 2 eyes for the analyses. Differences in rates of change between eyes and subjects are considered by introducing random slopes and random intercepts.
The primary hypothesis of the study was that time to develop an event of progression over the 5 years of follow-up was significantly associated with the rates of SAP MD change calculated over the first 2 years of follow-up. If the hypothesis was true, then this would provide evidence to support slopes of SAP MD change obtained during a relatively short follow-up of 2 years as valid alternative endpoints to predict clinically relevant events of glaucoma progression. The null hypothesis of no association between rates of SAP MD change and time to progression was assessed by a survival Cox proportional hazards model, where failure was considered as development of a progression event. Eyes that did not develop a progression event were censored at the last follow-up. Joint longitudinal survival models were used to jointly estimate parameters of the longitudinal and survival models, as described previously.24 Predictive strength was quantified by survival-adjusted R2.
We stratified slopes of MD change during the first 2 years into slow (slower than −0.5dB/year) and moderate/fast (faster than −0.5dB/year)25, 26 to quantify the increased risk of having a fast slope on developing an event of progression. Multivariable models were built adjusting for baseline age, sex, race, baseline disease severity (as assessed by baseline MD), CCT, mean IOP and number of SAP tests during overall follow-up. Mean IOP was estimated as the average of IOP measurements from the first 2 years of follow-up.
We were also interested in estimating the minimum detectable difference in slopes of SAP change that would translate into pre-specified differences in the cumulative probability of developing a progression endpoint over 5 years. We estimated what difference in slopes in the first 2 years would be needed to result in final differences in 10%, 20% and 30% of cumulative probabilities of developing an endpoint at 5 years. This may assist in determining minimum clinically significant detectable differences in slopes of change for sample size calculations in clinical trials.
Statistical analyses were performed with Stata 17.2 (Statacorp LP, College Station, TX). The alpha level was set at 0.05.
RESULTS
The study included 246 eyes of 168 patients with glaucoma. Mean ± standard deviation (SD) age at baseline was 67.7 ± 10.8 years and 91 (54.1%) subjects were female. 42 (25%) subjects were self-identified as Black. Eyes had a median of 10 SAP tests during the entire follow-up (interquartile range [IQR]: 8 to 16), and a median of 6 tests (IQR: 5 to 9) during the initial 2 years of follow-up.
Of the 246 eyes, 56 (22.8%) developed an event of progression during follow-up, as determined by the GPA. Table 1 shows demographic and clinical characteristics of eyes that developed a GPA endpoint during follow-up versus those that did not. Mean rates of SAP MD change during the first 2 years of follow-up were −0.82 ± 0.61 dB/year in eyes that developed an endpoint versus 0.08 ± 0.34 dB/year in those that did not (P<0.001). Figure 1 shows histograms with the distribution of 2-year rates of MD change in the two groups. Table 2 shows univariable and multivariable model results investigating the association between rates of change and time to progression event. Each 0.1dB/year faster rate of SAP MD loss during the first 2 years was associated with a 26% increase in risk of developing a GPA progression endpoint occurring in the subsequent 3 years (HR: 1.26; 95% CI: 1.20 to 1.32; P<0.001). The survival-adjusted R2 for the 2-year slopes of MD change in explaining time to progression event was 76% (95% CI: 67% - 81%). When adjusted for baseline age, gender, race, baseline MD, mean IOP, CCT and overall number of SAP tests during follow-up, each 0.1dB/year faster rate of SAP MD during the first 2 years was associated with a 29% increased risk of a progression event (HR of 1.29; 95% CI: 1.22 to 1.37; P<0.001).
Table 1.
Demographic and clinical characteristics of eyes that had a progression endpoint based on the Guided Progression Analysis (GPA) versus those that did not.
| Progression on GPA, yes (n = 56 eyes) | Progression on GPA, no (n = 190 eyes) | P | |
|---|---|---|---|
| Baseline age, years | 70.5 ± 9.2 | 66.9 ± 10.8 | 0.028 |
| Sex, % female | 44.6% | 58.9% | 0.058 |
| Race, % Black | 14.3% | 26.3% | 0.062 |
| Baseline MD, dB | −10.5 ± 7.2 | −4.9 ± 5.6 | <0.001 |
| Mean IOP, mmHg | 14.9 ± 4.4 | 15.2 ± 3.0 | 0.543 |
| CCT, μm | 533.5 ± 31.7 | 541.1 ± 39.3 | 0.189 |
| Number of SAP tests during overall follow-up † | 13 (9 – 18) | 10 (7 – 15) | 0.001 |
| Number of SAP tests during initial 2 years of follow-up † | 6 (5 – 10) | 6 (5 – 9) | 0.782 |
| Rate of SAP MD change calculated from the first 2 years of follow-up, dB/year | −0.82 ± 0.61 | 0.08 ± 0.34 | <0.001 |
CCT = central corneal thickness; GPA = Guided Progression Analysis; IOP = intraocular pressure; MD = mean deviation; SAP = standard automated perimetry.
Values are shown as mean ± standard deviation, unless otherwise noted.
median (interquartile range)
Figure 1.
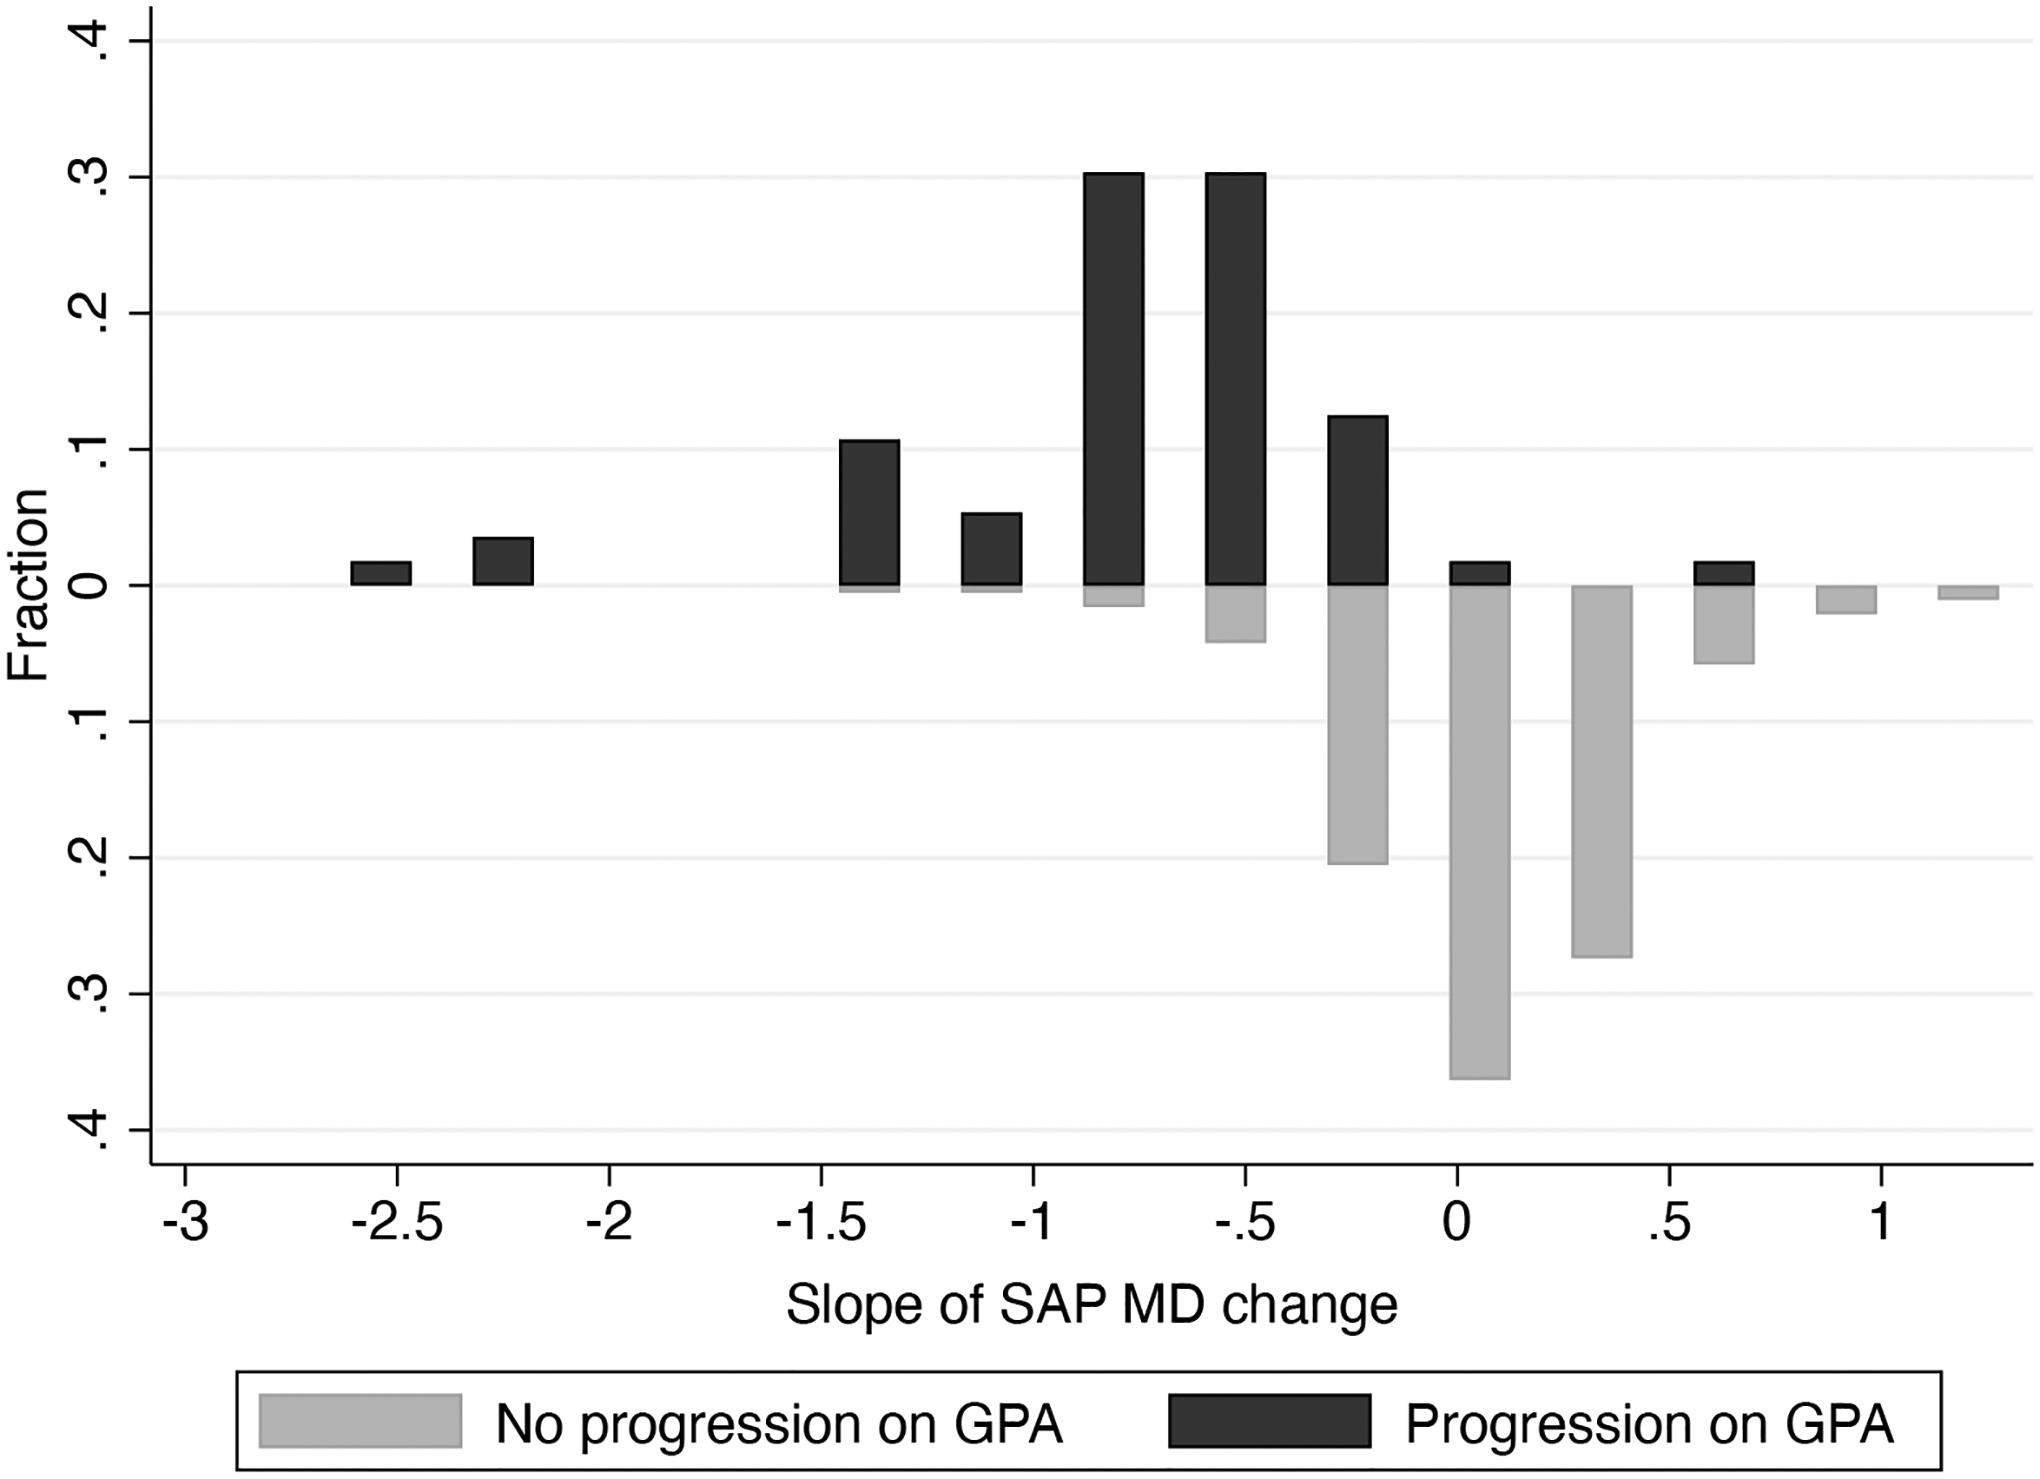
Distribution of 2-year rates of change in standard automated perimetry (SAP) mean deviation (MD) in the eyes progressing (top) and not progressing (bottom) on Guided Progression Analysis (GPA).
Table 2.
Results of univariable and multivariable joint longitudinal survival analyses investigating the relationship between slopes of standard automated perimetry (SAP) mean deviation (MD) calculated from the first 2 years and time to development of an event of progression by the Guided Progression Analysis (GPA).
| Univariable | Multivariable | |||
|---|---|---|---|---|
| Coefficient (95% CI) | P | Coefficient (95% CI) | P | |
| Slope of SAP MD, per 0.1dB faster * | 1.26 (1.20 – 1.32) | <0.001 | 1.29 (1.22 – 1.37) | <0.001 |
| Age, per decade older | 1.11 (0.87 – 1.42) | 0.415 | 0.73 (0.53 – 1.02) | 0.063 |
| Sex, female | 0.63 (0.35 – 1.13) | 0.121 | 0.43 (0.24 – 0.77) | 0.005 |
| Race, Black | 0.46 (0.20 – 1.09) | 0.078 | 0.32 (0.07 – 1.46) | 0.141 |
| Baseline MD, per 1dB lower | 1.10 (1.07 – 1.13) | <0.001 | 1.07 (1.03 – 1.11) | <0.001 |
| Mean IOP, per 1mmHg higher | 0.95 (0.85 – 1.06) | 0.352 | 0.95 (0.85 – 1.05) | 0.307 |
| CCT, per 100μm thinner | 1.72 (0.87 – 3.42) | 0.120 | 1.18 (0.54 – 2.56) | 0.678 |
| Number of SAP tests during overall follow-up | 1.09 (1.04 – 1.15) | 0.001 | 1.02 (0.95 – 1.10) | 0.544 |
CCT = central corneal thickness; IOP = intraocular pressure; MD = mean deviation; SAP = standard automated perimetry.
Slope was calculated from SAP tests over the first 2 years of follow-up for each eye.
Figure 2 shows cumulative probabilities of developing a progression endpoint for eyes with slopes faster than −0.5dB/year versus those slower than −0.5dB/year. At 5 years (i.e, 3 years after the end of the 2-year initial follow-up period), the cumulative probability of developing a progression event was 98% for those with slopes faster than −0.5dB/year versus only 14% for those with slopes slower than −0.5dB/year. The mean slopes in these 2 groups were −1.00 ± 0.53 dB/year vs. 0.09 ± 0.30 dB/year, respectively.
Figure 2.
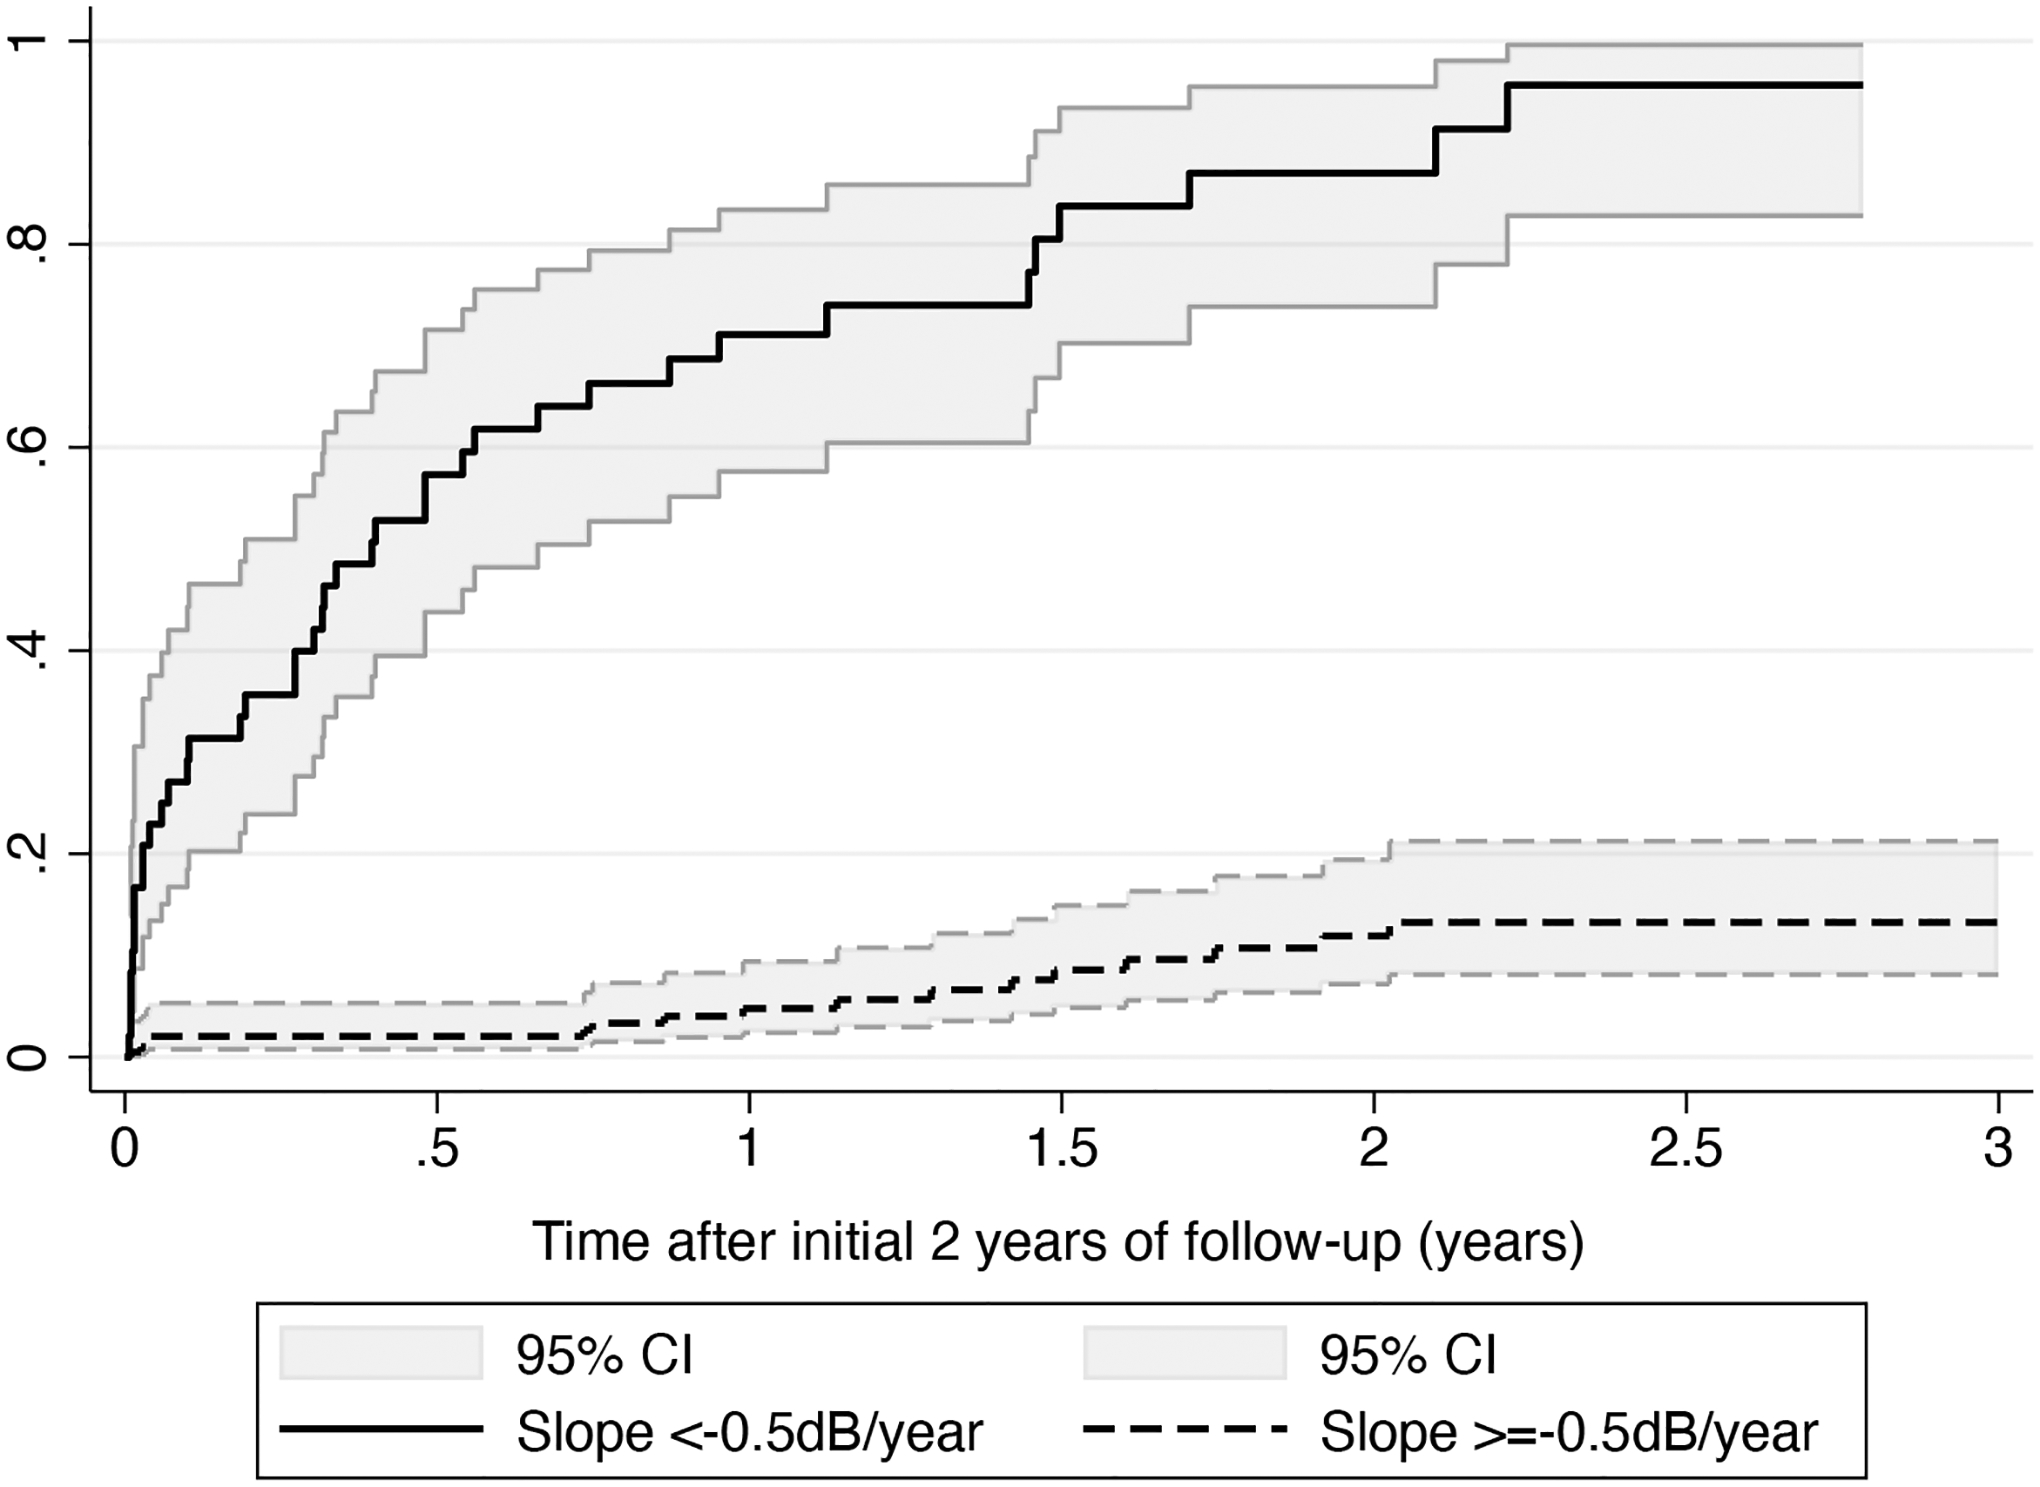
Cumulative probabilities of developing a progression endpoint for eyes with slopes faster than −0.5dB/year versus those equal or slower than −0.5dB/year. Shaded areas represent 95% confidence intervals.
We also estimated the minimum detectable difference in the 2-year slopes of SAP change that would translate into pre-specified differences in the cumulative probability of developing a progression endpoint over 5 years. We assumed a “control” group with mean rate of change of −1.0dB/year and estimated what the mean rate of the other group would have to be in order to result in the pre-specified differences in endpoints at 5 years. These results are shown in Table 3. Slowing the slope of change by 0.3dB/year, from −1.0dB/year to −0.7dB/year would result in a difference of 20% in the cumulative probability of developing an endpoint at the end of 5 years. Figure 3 represents this difference by showing predicted curves for probability of developing a progression endpoint for an eye with slope of −1.0dB/year versus an eye with slope of −0.7dB/year.
Table 3.
Minimum difference in slopes of standard automated perimetry (SAP) mean deviation (MD) change during the initial 2 years of follow-up that would translate into pre-specified differences in the cumulative probability of developing a progression endpoint over 5 years. *
| GPA endpoint | FDA endpoint | |
|---|---|---|
| Difference in cumulative proportion of progression events at 5 years | Minimum difference in slope of SAP MD change during the first 2 years, dB/year | Minimum difference in slope of SAP MD change during the first 2 years, dB/year |
| 10% | 0.18 | 0.21 |
| 20% | 0.30 | 0.33 |
| 30% | 0.42 | 0.43 |
GPA = Guided Progression Analysis; FDA = U.S. Food and Drug Administration recommended endpoint; MD = mean deviation; SAP = standard automated perimetry.
Difference calculated by assuming a “control” group with mean slope of change of −1.0dB/year and estimating what the mean rate of the other group would have to be in order to produce the pre-specified difference in endpoints at 5 years.
Figure 3.
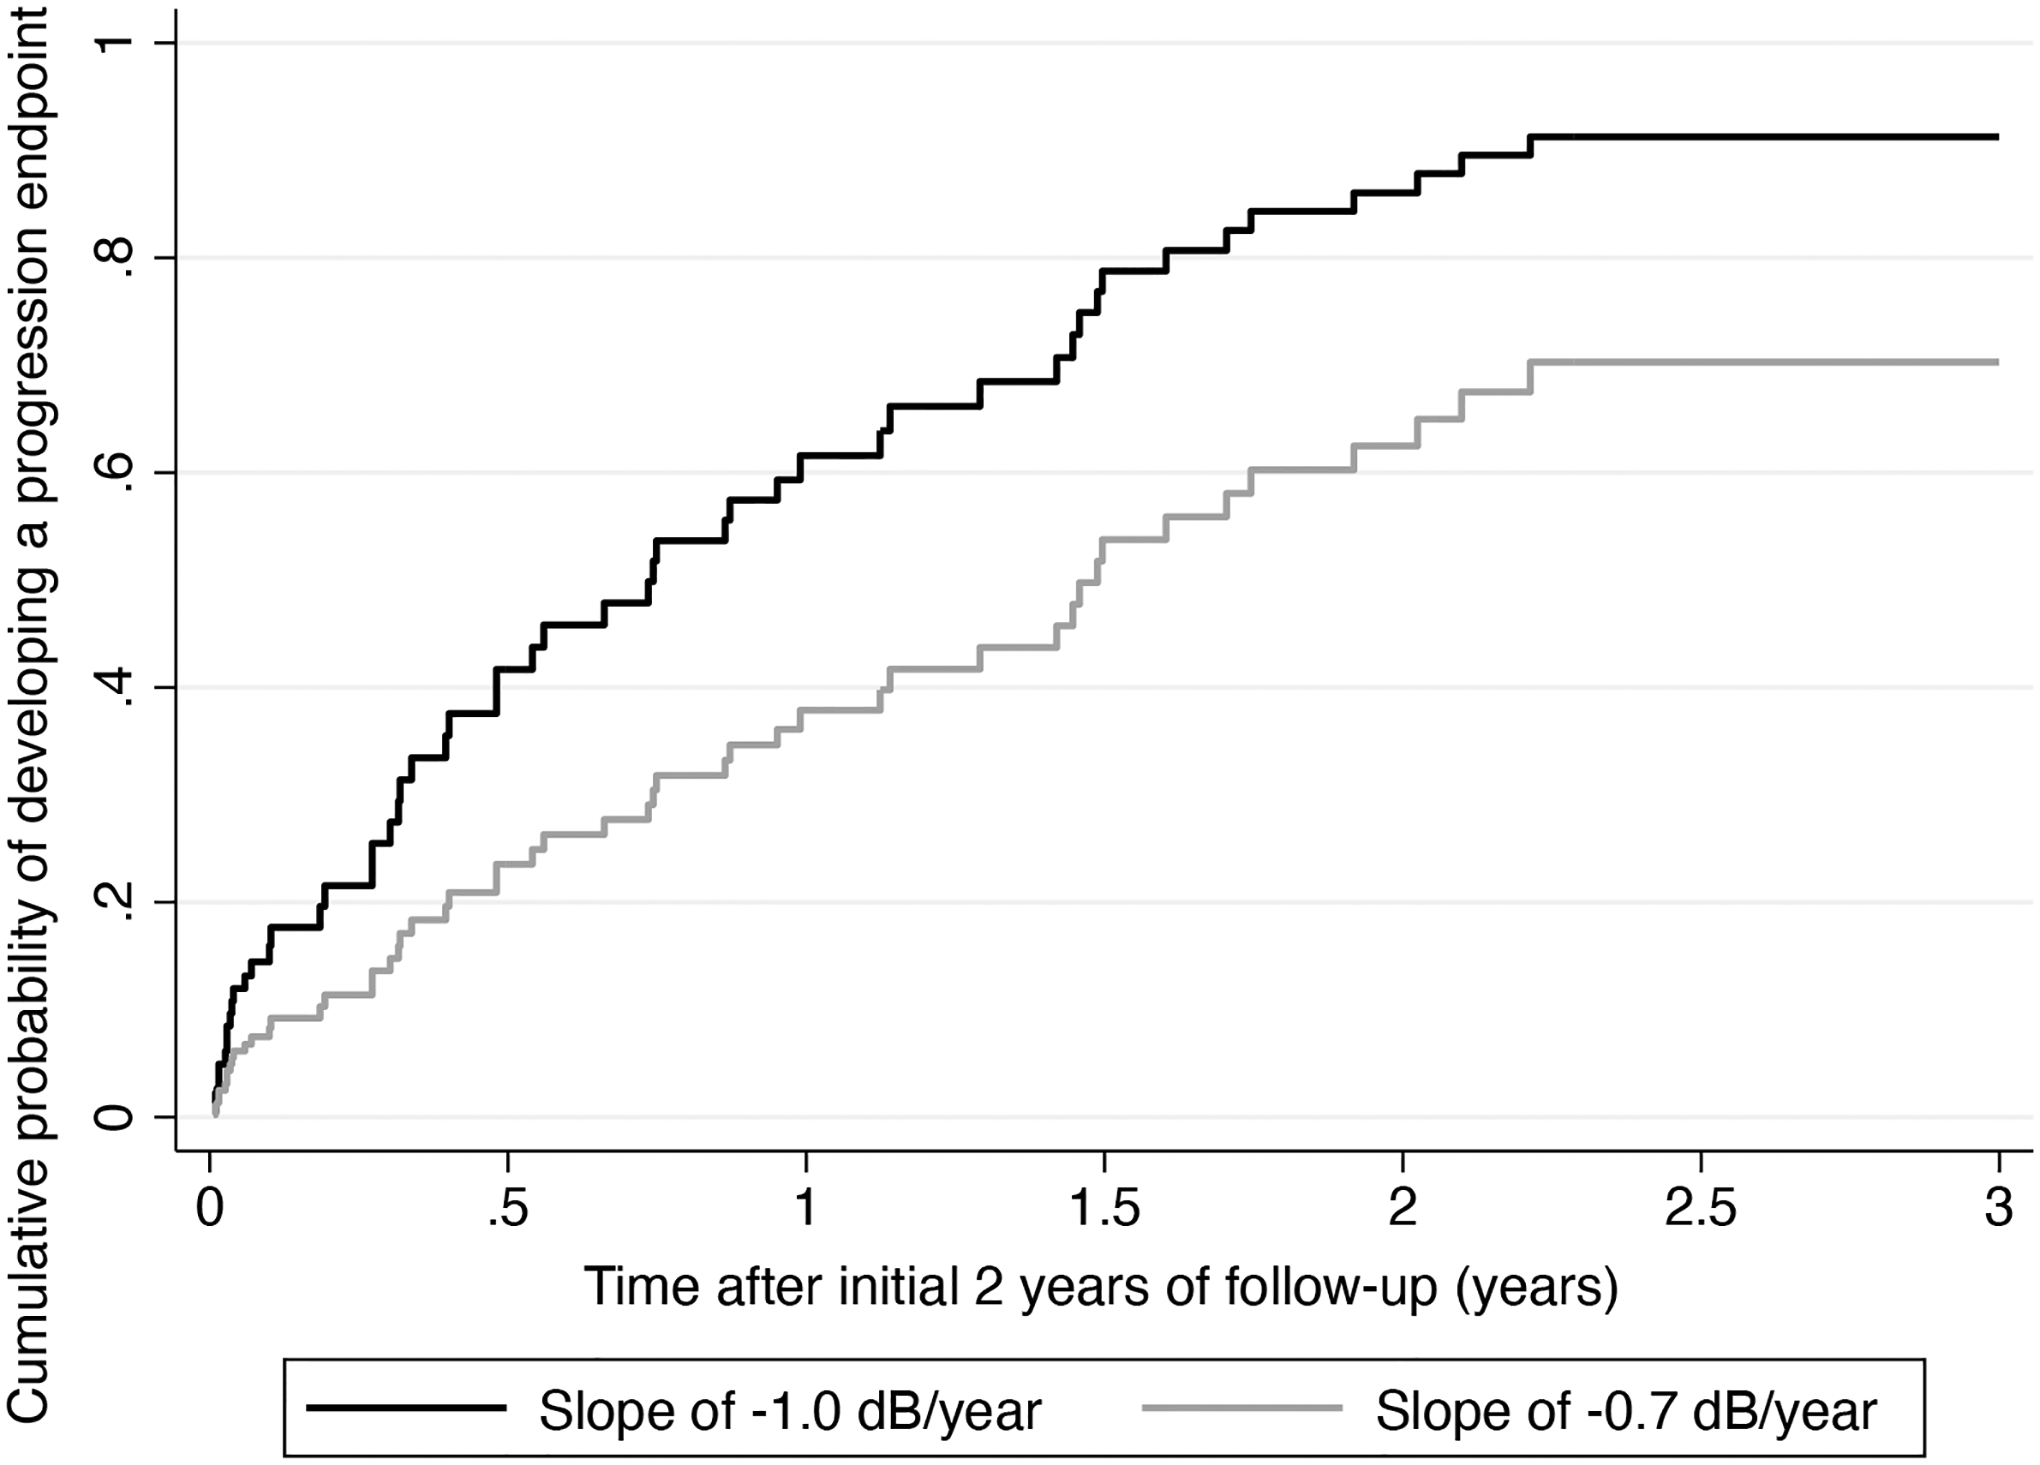
Predicted curves for probability of developing a progression endpoint for an eye with slope of −1.0dB/year versus an eye with slope of −0.7dB/year.
Analysis based on the FDA-consistent endpoint had similar results. Of the 246 eyes, 51 (20.7%) developed a progression event during follow-up. Mean 2-year rates of SAP MD change were −1.00 ± 0.55 dB/year in eyes that developed an endpoint versus 0.11 ± 0.30 dB/year in those that did not. Each 0.1dB/year faster slope of SAP MD loss was associated with 32% increase in the risk of developing an endpoint (HR: 1.32; 95% CI: 1.24 – 1.40; P<0.001). The survival-adjusted R2 for the 2-year slopes of MD change in explaining time to progression based on the FDA-consistent endpoint was 83% (95% CI: 77% - 88%). When adjusted for baseline age, gender, race, baseline MD, mean IOP, CCT and overall number of SAP tests during follow-up, each 0.1dB/year faster rate of SAP MD was associated with a 37% increased risk of a event of progression (HR of 1.37; 95% CI: 1.27 to 1.47; P<0.001).
Table 3 also shows the estimated minimum detectable difference in the 2-year slopes of MD change that would translate into pre-specified differences in the cumulative probability of developing an FDA-consistent progression endpoint over 5 years. Results were very similar to those with the GPA endpoint.
DISCUSSION
This study showed that rates of SAP MD change of glaucomatous eyes calculated over the initial 2 years of follow-up were strongly predictive of events of progression over the course of subsequent years. The results were similar whether progression events were defined based on the conventional GPA algorithm or using an FDA-consistent endpoint. Our findings give support for the use of slopes of MD change as suitable endpoints in clinical trials investigating potential new therapies in glaucoma.
Eyes that developed a progression endpoint had, on average, much faster slopes of MD change during the initial 2 years of follow-up than those that did not (−0.82 dB/year vs. 0.08 dB/year; P<0.001). Each 0.1dB/year faster 2-year rate of SAP MD loss was associated with a 26% increase in risk of developing a GPA progression endpoint and 32% risk of developing an FDA-consistent endpoint. Importantly, when the predictive strength was quantified by survival-adjusted R2, approximately 80% of the variability in times to a progression event could be explained by the slopes of change. When adjusted for potentially confounding variables, slopes of MD change remained significantly predictive of progression with similar HRs compared to the univariable models.
The rationale for the use of rates of SAP MD change as endpoints in a glaucoma clinical trial comes from the increased statistical power that this approach offers compared to the conventional event-based approach.11, 27–29 This may increase the feasibility of such trials by leading to a reduction in the required sample sizes, duration and costs of the studies.10 Shorter duration studies may expedite bringing successful drugs to patients, and avoid potential biases from loss of follow-up during the trial. Wu et al showed major reductions in sample size when the difference in rate of MD change between treatment and control groups was used as endpoint in a 2-year clinical trial scenario, as compared to the use of a GPA.11 However, despite such benefit, acceptance of rates of MD change as valid endpoints in a clinical trial requires clear demonstration that such rates are predictive of clinically relevant endpoints. Given that MD is a global metric potentially susceptible to artifacts from media opacities,20 there have been concerns about whether such rates would be specific enough to indicate glaucoma progression. Our results indicated that rates of MD change obtained over a 2-year period were highly predictive of subsequent events of progression over the subsequent 3 years of follow-up. Such predictive strength can be visualized by inspecting Figure 2 which shows cumulative probabilities of event for eyes with fast vs. slow slopes of change. While the former group with average slope of −1.0dB/year had almost 100% probability of developing an event at the end of follow-up, the latter with average slope close to zero had only 14% probability of showing an event.
In our study, rates of MD change were calculated for the initial 2 years of follow-up, while progression events were observed for up to 5 years, i.e., 3 more years after the initial 2 years. The rationale for this design was based on the desire to show that rates of MD change would be suitable endpoints to be used in a relatively short 2-year clinical trial. Even though it is possible that some eyes may have developed a progression event if followed for longer periods of time, 5 years is a reasonable timeframe to consider for the implications of slopes estimated from early follow-up. Progression seen after much longer timeframes would likely be disconnected from the findings occurring in the first 2 years. The clinical trial investigating the effectiveness of oral Memantine7 as a neuroprotectant to slow down glaucoma followed patients for 48 months, and used the GCP originally described by Heijl et al30 as a progression endpoint. In our study, we used GPA to define an event of progression, which is closely related to the GCP, but uses pattern deviation points instead of total deviation ones. This has been shown to improve the specificity of the method.6 The GPA is widely used in clinical practice and a “likely progression” result has been shown to be a very specific marker for disease progression.31, 32 As an alternative, we also conducted analyses using an endpoint consistent with a NEI/FDA CDER report21 that suggested that a large repeatable deterioration of at least 7 dB would be clinically significant. We required at least 5 points to show such magnitude of change in a repeatable pattern. A recent clinical trial investigating visual function effects of a new gene-based therapy for X-linked retinitis pigmentosa used a similar endpoint requiring a change of 7dB in 5 points, although to demonstrate improvement rather than deteriorarion.22 Our analyses based on the FDA-consistent endpoint showed very similar results to those of GPA, with eyes demonstrating faster slopes of MD change having much higher risk of developing an event of progression compared to those eyes with slower rates of change.
Besides demonstrating that rates of MD change would be valid alternative endpoints for assessing progression, it is also important to quantify the difference in rates that would be relevant in the context of a trial. We therefore assessed the impact of different reductions in the rate of MD change on the subsequent probability of developing progression events. We assumed a control group progressing at an average rate of −1.0dB/year and showed that if the average rate were to be slowed down to −0.7dB year, i.e., a difference of 0.3dB, this would translate into a difference of 20% in the cumulative probability of developing a progression event over 5 years of follow-up. Calculations for other meaningful differences are shown in Table 3 and they may help investigators estimate sample sizes based on minimum detectable differences deemed to be clinically relevant, according to the desired power. For example, the Memantine trial had 85% power to detect a difference of 10% in the progression events among the memantine and placebo groups. Such difference would correspond to approximately a 0.2dB/year difference in mean slopes of MD change over a 2-year follow-up, according to our study.
It is interesting to make parallels of the validation approach taken in our study to those used to validate endpoints in other fields of medicine. For example, in the field of chronic kidney disease (CKD) investigators have faced a similar problem in that traditional endpoints may only develop after many years of observation. The National Kidney Foundation, in collaboration with the FDA and the European Medicines Agency, held a meeting in 2018 to discuss the validity of surrogate endpoints for CKD. In one of the publications from the meeting, Grams and colleagues33 provide evidence to support rate of decline in estimated glomerular filtration rate (eGFR) as an alternative endpoint, by performing analyses essentially identical to ours in which linear mixed models were used to estimate eGFR rates over time and their association with clinically relevant time-to-event outcomes was assessed by Cox models.
It should be noted that estimates of slopes of change with LMMs may be influenced by the composition of the sample and choice of random slope distribution. Although LMMs are a standard technique used for analysis of longitudinal data in clinical trials, in clinical practice slopes for individual eyes are more often obtained using ordinary least squares (OLS) linear regression. When OLS slopes were calculated for our sample, we also found that mean rates of SAP MD change during the first 2 years of follow-up were much faster in eyes that developed a GPA endpoint than in those that did not (−1.02 ± 2.16 dB/year vs. 0.11 ± 0.90 dB/year; P<0.001). As expected, OLS slopes were highly correlated to LMM slopes (r = 0.94; P<0.001), with some shrinkage observed (Supplemental Figure 4, available at https://www.aaojournal.org). Each 0.1dB/year faster rate of SAP MD loss estimated by OLS during the first 2 years was associated with a 18% increase in risk of developing a GPA progression endpoint occurring in the subsequent 3 years (HR: 1.18; 95% CI: 1.14 to 1.22; P<0.001), with a survival-adjusted R2 of 42% (95% CI: 23% - 57%). Slowing the OLS slope of change by 0.3dB/year, from −1.0dB/year to −0.7dB/year would result in a difference of 12% in the cumulative probability of developing an endpoint at the end of 5 years, a smaller number compared to when using LMM slopes (see Table 3). Analyses for the FDA-consistent endpoint using OLS slopes gave similar results as those with GPA (not shown). Overall, these analyses show that slopes obtained with OLS were also predictive of future events of progression and give further support to our conclusions. Although the predictive ability of OLS slopes was not as strong as that of LMM slopes, this is to be expected because OLS slopes are likely more affected by noise. In fact, inspection of the scatterplot of 5-year OLS slopes versus 2-year OLS slopes (Supplemental Figure 5, available at https://www.aaojournal.org) shows that several of the 2-year OLS slopes seem quite far from the 5-year estimates. The 2-year LMM slopes in general appear closer to the 5-year OLS slopes (Supplemental Figure 6, available at https://www.aaojournal.org). In fact, using the 5-year OLS slopes as the reference, the mean absolute error of the 2-year LMM slopes (0.38 dB) was significantly lower than that of the 2-year OLS slopes (0.59 dB; P<0.001).
It is important to note that besides the demonstration of predictive ability, there are still other important issues related to the use of slopes of change as endpoint in clinical trials. For example, it is not clear how different treatments may affect the distribution of slopes of change and whether differences in mean slopes may indeed be the best parameter for comparison between treatment groups. Testing a difference in mean slopes between two groups is conceptually different from individualized estimates of risk (such as from analysis of events) because it may not directly relate to how many people are likely to benefit from a particular treatment without assumptions on how that difference translates to individual eyes. For example, a 30% difference in mean might equivalently be obtained from a mild benefit for all the subjects or from a large benefit for a minority. Furthermore, comparisons of mean of slopes of change do not give a metric of absolute risk, which would be needed, for example, for considerations on cost effectiveness. Further studies should be conducted to investigate these issues.
Our findings show that the assessment of early rates of change during follow-up carries important prognostic information to determine subsequent disease deterioration. This result is not surprising given previous works investigating the clinical implications of rates of visual field loss in glaucoma.35–37 It is important to note, however, that our study sought to obtain unbiased estimates of the “true” relationship between slopes of MD and progression events, by investigating mean effects over a prospective sample of subjects followed over time and applying statistical methods linking longitudinal and survival measurements that account for measurement error. When evaluating slopes of change in individual eyes, clinicians need to be aware of the potential imprecision of such slopes and the need to obtain an adequate number of tests that will ensure enough confidence around the slope estimate.
Our study had limitations. We sought to evaluate the long-term prognostic significance of early slopes of MD change with the goal of validating their use as endpoints in clinical trials. However, although subjects were prospectively followed over time, our design did not involve a randomized clinical trial. Subjects were treated at the discretion of attending ophthalmologists and this may have affected some of our results. For example, it is conceivable that eyes showing faster slopes during early follow-up may have received more treatment which decreased their chance of progression during later follow-up. However, had this effect not been present, this would likely have resulted in even stronger relationships than those found in our study. As another limitation, eyes had many different forms of treatment during follow-up, and it would not be possible to investigate the impact of different treatments on the outcomes of our study.
In conclusion, our results showed that rates of SAP MD change obtained during the initial 2 years of follow-up were highly predictive of subsequent events of progression of visual field loss in glaucoma. These findings give support to the use of rates of change as valid alternative endpoints in clinical trials investigating new candidate therapies to slow down glaucoma progression.
Supplementary Material
Supplemental Figure 4. Scatterplot of slopes obtained by linear mixed models (LMM) versus ordinary least squares (OLS) linear regression. Although the slopes were highly correlated, it is possible to note some “shrinkage” of LMM slopes towards the population mean.
Supplemental Figure 5. Scatterplot of the 5-year slopes obtained by ordinary least squares (OLS) linear regression versus 2-year OLS slopes.
Supplemental Figure 6. Scatterplot of the 5-year slopes obtained by ordinary least squares (OLS) linear regression versus 2-year linear mixed model (LMM) slopes.
Funding/Support:
Supported in part by National Institutes of Health/National Eye Institute grant EY029885 and EY031898. The funding organization had no role in the design or conduct of this research.
Financial Disclosures:
FAM is a consultant for Allergan, Aerie Pharmaceuticals, Santen, Reichert, Gallimedix, Stuart Therapeutics, Carl-Zeiss Meditec, and Annexon and receives research support from Genentech, Google, Carl-Zeiss Meditec, Reichert, Heidelberg Engineering, and Novartis. AAJ declares no potential competing interest.
Footnotes
Publisher's Disclaimer: This is a PDF file of an unedited manuscript that has been accepted for publication. As a service to our customers we are providing this early version of the manuscript. The manuscript will undergo copyediting, typesetting, and review of the resulting proof before it is published in its final form. Please note that during the production process errors may be discovered which could affect the content, and all legal disclaimers that apply to the journal pertain.
REFERENCES
- 1.Steinmetz JD, Bourne RRA, Briant PS, et al. Causes of blindness and vision impairment in 2020 and trends over 30 years, and prevalence of avoidable blindness in relation to VISION 2020: the Right to Sight: an analysis for the Global Burden of Disease Study. The Lancet Global Health 2021;9(2):e144–e60. [DOI] [PMC free article] [PubMed] [Google Scholar]
- 2.Gedde SJ, Vinod K, Wright MM, et al. Primary Open-Angle Glaucoma Preferred Practice Pattern(R). Ophthalmology 2021;128(1):P71–P150. [DOI] [PubMed] [Google Scholar]
- 3.Spry PG, Johnson CA. Identification of progressive glaucomatous visual field loss. Surv Ophthalmol 2002;47(2):158–73. [DOI] [PubMed] [Google Scholar]
- 4.Morgan RK, Feuer WJ, Anderson DR. Statpac 2 glaucoma change probability. Arch Ophthalmol 1991;109(12):1690–2. [DOI] [PubMed] [Google Scholar]
- 5.Birch MK, Wishart PK, O’Donnell NP. Determining progressive visual field loss in serial Humphrey visual fields. Ophthalmology 1995;102(8):1227–34; discussion 34–5. [DOI] [PubMed] [Google Scholar]
- 6.Katz J A comparison of the pattern- and total deviation-based Glaucoma Change Probability programs. Invest Ophthalmol Vis Sci 2000;41(5):1012–6. [PubMed] [Google Scholar]
- 7.Weinreb RN, Liebmann JM, Cioffi GA, et al. Oral Memantine for the Treatment of Glaucoma: Design and Results of 2 Randomized, Placebo-Controlled, Phase 3 Studies. Ophthalmology 2018;125(12):1874–85. [DOI] [PubMed] [Google Scholar]
- 8.Garway-Heath DF, Crabb DP, Bunce C, et al. Latanoprost for open-angle glaucoma (UKGTS): a randomised, multicentre, placebo-controlled trial. Lancet 2015;385(9975):1295–304. [DOI] [PubMed] [Google Scholar]
- 9.Sena DF, Lindsley K. Neuroprotection for treatment of glaucoma in adults. Cochrane Database of Systematic Reviews 2017(1). [DOI] [PMC free article] [PubMed] [Google Scholar]
- 10.Quigley HA. Clinical trials for glaucoma neuroprotection are not impossible. Curr Opin Ophthalmol 2012;23(2):144–54. [DOI] [PubMed] [Google Scholar]
- 11.Wu Z, Crabb DP, Chauhan BC, et al. Improving the feasibility of glaucoma clinical trials using trend-based visual field progression end points. Ophthalmology Glaucoma 2019. [DOI] [PMC free article] [PubMed] [Google Scholar]
- 12.Fitzke FW, Hitchings RA, Poinoosawmy D, et al. Analysis of visual field progression in glaucoma. Br J Ophthalmol 1996;80(1):40–8. [DOI] [PMC free article] [PubMed] [Google Scholar]
- 13.Gardiner SK, Crabb DP. Examination of different pointwise linear regression methods for determining visual field progression. Invest Ophthalmol Vis Sci 2002;43(5):1400–7. [PubMed] [Google Scholar]
- 14.Bengtsson B, Patella VM, Heijl A. Prediction of glaucomatous visual field loss by extrapolation of linear trends. Arch Ophthalmol 2009;127(12):1610–5. [DOI] [PubMed] [Google Scholar]
- 15.Caprioli J The importance of rates in glaucoma. Am J Ophthalmol 2008;145(2):191–2. [DOI] [PubMed] [Google Scholar]
- 16.Medeiros FA, Alencar LM, Sample PA, et al. The relationship between intraocular pressure reduction and rates of progressive visual field loss in eyes with optic disc hemorrhage. Ophthalmology 2010;117(11):2061–6. [DOI] [PubMed] [Google Scholar]
- 17.Medeiros FA, Zangwill LM, Alencar LM, et al. Rates of progressive retinal nerve fiber layer loss in glaucoma measured by scanning laser polarimetry. Am J Ophthalmol 2010;149(6):908–15. [DOI] [PubMed] [Google Scholar]
- 18.Laird NM, Ware JH. Random-effects models for longitudinal data. Biometrics 1982;38(4):963–74. [PubMed] [Google Scholar]
- 19.Heuer DK, Anderson DR, Knighton RW, et al. The influence of simulated light scattering on automated perimetric threshold measurements. Arch Ophthalmol 1988;106(9):1247–51. [DOI] [PubMed] [Google Scholar]
- 20.Budenz DL, Feuer WJ, Anderson DR. The effect of simulated cataract on the glaucomatous visual field. Ophthalmology 1993;100(4):511–7. [DOI] [PubMed] [Google Scholar]
- 21.Weinreb RN, Kaufman PL. The glaucoma research community and FDA look to the future: a report from the NEI/FDA CDER Glaucoma Clinical Trial Design and Endpoints Symposium. Invest Ophthalmol Vis Sci 2009;50(4):1497–505. [DOI] [PubMed] [Google Scholar]
- 22.MacLaren RE, Lam BL, Lotery AJ, et al. Visual function improvements with BIIB112 (NSR-RPGR) in X-linked retinitis pigmentosa: XIRIUS (dose-expansion) and XOLARIS (natural disease progression) studies. Investigative Ophthalmology & Visual Science 2021;62(8):1479-. [Google Scholar]
- 23.Laird NM, Ware JH. Random-Effects Models for Longitudinal Data. Biometrics 1982;38(4):963–74. [PubMed] [Google Scholar]
- 24.Henderson R, Diggle P, Dobson A. Joint modelling of longitudinal measurements and event time data. Biostatistics 2000;1(4):465–80. [DOI] [PubMed] [Google Scholar]
- 25.Chauhan BC, Malik R, Shuba LM, et al. Rates of Glaucomatous Visual Field Change in a Large Clinical Population. Investigative Opthalmology & Visual Science 2014;55(7):4135–43. [DOI] [PubMed] [Google Scholar]
- 26.Jammal AA, Thompson AC, Mariottoni EB, et al. Rates of Glaucomatous Structural and Functional Change From a Large Clinical Population: The Duke Glaucoma Registry Study. Am J Ophthalmol 2021;222:238–47. [DOI] [PMC free article] [PubMed] [Google Scholar]
- 27.Vesti E, Johnson CA, Chauhan BC. Comparison of Different Methods for Detecting Glaucomatous Visual Field Progression. Investigative Ophthalmology & Visual Science 2003;44(9):3873–9. [DOI] [PubMed] [Google Scholar]
- 28.De Moraes CG, Liebmann JM, Levin LA. Detection and measurement of clinically meaningful visual field progression in clinical trials for glaucoma. Progress in Retinal and Eye Research 2017;56:107–47. [DOI] [PMC free article] [PubMed] [Google Scholar]
- 29.Montesano G, Quigley HA, Crabb DP. Improving the Power of Glaucoma Neuroprotection Trials Using Existing Visual Field Data. Am J Ophthalmol 2021;229:127–36. [DOI] [PubMed] [Google Scholar]
- 30.Heijl A. Extended empirical statistical package for evaluation of single and multiple fields in glaucoma: Statpac 2. Perimetry update 1990/1991. 1991:303–15. [Google Scholar]
- 31.Artes PH, O’Leary N, Nicolela MT, et al. Visual field progression in glaucoma: what is the specificity of the Guided Progression Analysis? Ophthalmology 2014;121(10):2023–7. [DOI] [PubMed] [Google Scholar]
- 32.Antón A, Pazos M, Martín B, et al. Glaucoma progression detection: agreement, sensitivity, and specificity of expert visual field evaluation, event analysis, and trend analysis. European journal of ophthalmology 2013;23(2):187–95. [DOI] [PubMed] [Google Scholar]
- 33.Grams ME, Sang Y, Ballew SH, et al. Evaluating Glomerular Filtration Rate Slope as a Surrogate End Point for ESKD in Clinical Trials: An Individual Participant Meta-Analysis of Observational Data. Journal of the American Society of Nephrology 2019;30(9):1746–55. [DOI] [PMC free article] [PubMed] [Google Scholar]
- 34.Vonesh E, Tighiouart H, Ying J, et al. Mixed-effects models for slope-based endpoints in clinical trials of chronic kidney disease. Stat Med 2019;38(22):4218–39. [DOI] [PubMed] [Google Scholar]
- 35.Lisboa R, Chun YS, Zangwill LM, et al. Association between rates of binocular visual field loss and vision-related quality of life in patients with glaucoma. JAMA Ophthalmol 2013;131(4):486–94. [DOI] [PMC free article] [PubMed] [Google Scholar]
- 36.Baig S, Diniz-Filho A, Wu Z, et al. Association of fast visual field loss with risk of falling in patients with glaucoma. JAMA ophthalmology 2016;134(8):880–6. [DOI] [PubMed] [Google Scholar]
- 37.Diniz-Filho A, Abe RY, Cho HJ, et al. Fast visual field progression is associated with depressive symptoms in patients with glaucoma. Ophthalmology 2016;123(4):754–9. [DOI] [PMC free article] [PubMed] [Google Scholar]
Associated Data
This section collects any data citations, data availability statements, or supplementary materials included in this article.
Supplementary Materials
Supplemental Figure 4. Scatterplot of slopes obtained by linear mixed models (LMM) versus ordinary least squares (OLS) linear regression. Although the slopes were highly correlated, it is possible to note some “shrinkage” of LMM slopes towards the population mean.
Supplemental Figure 5. Scatterplot of the 5-year slopes obtained by ordinary least squares (OLS) linear regression versus 2-year OLS slopes.
Supplemental Figure 6. Scatterplot of the 5-year slopes obtained by ordinary least squares (OLS) linear regression versus 2-year linear mixed model (LMM) slopes.