

Abstract
We have investigated the analysis of RNA by use of terminal transferase-dependent PCR (TDPCR), a procedure previously used for the analysis of DNA and chromatin [J.Komura and A.D.Riggs, Nucleic Acids Res., 26, 1807–1811 (1998)]. When preceded by reverse transcription (RT), TDPCR provides an extremely sensitive, versatile, quantitative and nucleotide-level assay for detecting RNA lesions or structures that block primer extension during the RT step. The procedure is: (i) RT using a gene-specific oligonucleotide; (ii) ribo-tailing of the single-stranded cDNA product by use of terminal deoxynucleotidyl transferase; (iii) ligation of a DNA linker to the tailed cDNA by use of T4 DNA ligase; and (iv) PCR using a nested, gene-specific primer and a linker-specific primer. This procedure combines the versatility of a primer extension assay with nucleotide-level resolution, the specificity of nested primers and the sensitivity of PCR. Band patterns obtained are reproducible and quantifiable. We successfully used the technique for the study of yeast RNA structure, splicing intermediates and ribozyme cleavage. Also, in vivo footprint experiments, using mammalian cells and RNase T1, revealed the binding of iron-responsive element binding protein to iron responsive elements in the mRNAs of transferrin receptor and ferritin H-chain.
INTRODUCTION
Numerous methods, all dependent on reverse transcription (RT), have been devised for cDNA cloning and transcription start-site analysis in eukaryotic cells, including a method commonly called RACE for rapid amplification of cDNA ends (1,2). However, these and other methods (3) have been little used for in vivo analysis of eukaryotic RNA structure and protein–RNA interactions. This is in spite of the fact that all functions of RNA depend on specific secondary and tertiary structure determined by RNA–RNA or RNA–protein interactions, and these are likely to be quite different in vivo than they are in vitro. Knowledge of in vivo RNA structure is also crucial for development of efficient antisense oligonucleotides and/or ribozymes, because secondary and tertiary structure renders many RNA regions inaccessible. Computer predictions are not yet adequate, so also for this purpose, sensitive, robust methods for in vivo RNA structure determination are needed.
An important improvement in the RACE procedure was made by Schmidt and Mueller (2) who introduced the use of ribo-tailing with terminal deoxynucleotidyl transferase (TdT) and then ligation to a DNA linker. Komura and Riggs (4) improved the linker, applied the technique to the study of DNA and chromatin structure, and named the procedure terminal transferase-dependent PCR (TDPCR) because of its relation to ligation-mediated PCR (LMPCR), a technique that has been much used for in vivo chromatin structure analysis and in vivo footprinting. There have now been >100 publications reporting use of LMPCR, which provides both qualitative and quantitative data with nucleotide-level resolution, nested primer specificity and PCR sensitivity (for reviews see 5,6). LMPCR cannot, however, be used for analysis of RNA because the procedure requires the use of T4 DNA ligase for addition of an oligodeoxynucleotide linker to the 5′ end of a DNA molecule.
Bertrand et al. (3) were the first to successfully adapt the linker-ligation concept for the analysis of RNA. They did this by adding an RNA oligonucleotide to the 5′ end of RNA molecules by use of RNA ligase. The ligated RNA was then reverse transcribed into DNA, which was then used for PCR. This method, named RLPCR, has enough sensitivity to do LMPCR-type experiments in mammalian cells, and Bertrand and his colleagues (3,7) were able to detect in vivo protein–RNA footprints and ribozyme cleavage. Though this method seems to have good potential, there have been only a few reports of its successful use (3,7,8).
We report here that the application of the TDPCR approach to cDNA resulting from RT of mRNA leads to a powerful, versatile and extremely sensitive method for qualitative and quantitative RNA analysis, and it can be readily applied to yeast and mammalian cells. For study of prokaryotes, numerous less sensitive, and/or less specific, methods have been frequently used for the analysis of RNA structure (reviewed in 9). One common method involves treatment of cells, nuclei or isolated RNA with nucleases or chemicals, and then detection of RNA cleavage or adduct formation by use of RT for primer extension. Since RT–TDPCR, as described here, is merely a sensitive, specific primer-extension assay, all such procedures previously used for prokaryotic cells should now be applicable to the study of RNA and RNA–protein interactions in eukaryotic cells. We find that RT–TDPCR is a robust, high-resolution, sensitive and quantitative method, suitable for analysis of yeast and mammalian RNA structure. The feasibility of the method is demonstrated by its use to detect splicing intermediates and ribozyme cleavage sites in yeast, as well as in vivo protein–RNA footprints in mammalian cells.
MATERIALS AND METHODS
Yeast strains, plasmid constructs, and RNA preparation
Saccharomyces cerevisiae JM43 (MATa, leu2, ura3, trp1, his3) was kindly provided by J. McEwen. The vectors transformed into this yeast strain are shown in Figure 2 and have been described previously (10,11). Briefly, pJYH7 contains a S.cerevisiae actin (ACT)–lacZ protein fusion that depends on splicing of the yeast ACT-1 intron for β-galactosidase expression. pJYH7MtRz was made by cloning a mutant, non-cleaving form of a cis-ribozyme (MtRz) into a unique SalI site, which is located at the ACT–lacZ fusion point (Fig. 2). pWC1Rz and pWC1MtRz were constructed by cloning a 192 nt XhoI–SalI fragment (nt positions 1648–1840) from exon II of the ACT gene into SalI digested pJYH7. The Rz and MtRz constructs were made by using two sets of complementary oligonucleotides: active ribozyme, 5′-TCGACCGCCGGCGAAACACCGGGTTCGCC-TGGTGTCTCGGACCTTCGGGTCCGACTGATGAGCCGGCGG and 3′-GCGGCCGCTTTGTGGCCCAAGCGGACC-ACAGAGCCTGGAAGCCCAGGCTGACTACTCGGCCG-CCAGCT; mutant ribozyme, 5′-TCGACCGCCGGCGAAAC-ACCGGGTTCGCCTGGTGTCTCGGACCTTCGGGTCCG-ACTAATGAGCCGGCGG and 3′-GCGGCCGCTTTGTGG-CCCAAGCGGACCACAGAGCCTGGAAGCCCAGGCTG-ATTACTCGGCCGCCAGCT.
Figure 2.

Yeast plasmid constructs and ribozymes. Ex I and Ex II depict exon I and II, respectively, of the of yeast actin gene. For pJYH7, the size of the RNA transcript components and the position of the GG, AG1 and AG2 splice sites in the actin intron are indicated. For pWC1Rz, the element labeled 192 nt is a yeast exon II fragment that does not have a splice site. The location of the ribozyme, either Rz or MtRz, at the junction of the 192 nt and exon II fragments is shown. Also shown above the constructs is the 25 nt linker, as a reminder that this linker becomes a component of each RT–TDPCR fragment and must be taken into account when calculating the size of expected fragments. The last gene-specific primer used, in these cases β-Gal Nest, also becomes a component of each TDPCR fragment. These ribozymes and constructs have been described previously (11). The ribozymes used in this study, Rz and MtRz, differ only at one position in the active site, as indicated by the circled bases. The arrow indicates the site at which cleavage will occur after transcription.
Yeast transformants were grown in 10 ml of yeast synthetic minimal media (12) to an OD600 of 0.8. The cultures were centrifuged at 1500 g for 5 min at 4°C, the supernatants were discarded and total RNA was prepared from the yeast pellets by a hot-phenol procedure (13,14).
Enzymes, oligonucleotides and other reagents
Magnetic beads. Streptavidin-coated magnetic beads (Dynabeads M-280) were obtained from Dynal Inc. The beads are supplied by the manufacturer as a suspension containing 6.7 × 10⁸ Dynabeads/ml (10 mg/ml), dissolved in phosphate-buffered saline (PBS), pH 7.4, containing 0.1% BSA and 0.02% sodium azide. The capacity of the beads for oligonucleotides is ~200 pmol/mg, as stated by the manufacturer.
Enzymes. The following enzymes were used: AMV reverse transcriptase (20 U/µl; Life Science), Moloney M-MLV reverse transcriptase (200 U/ml; Gibco BRL); C. therm. polymerase (4 U/µl; Boehringer Mannheim), TdT (15 U/µl; Gibco BRL), T4 DNA ligase (3 U/µl; Promega), AmpliTaq polymerase (5 U/µl; Perkin Elmer) and T4 polynucleotide kinase (10 U/µl; New England Biolabs).
Linker oligonucleotides. As previously described (4,15), the TDPCR linker [linker gamma described by Komura and Riggs (4)] is double-stranded DNA with a 3′ CCC overhang. The lower strand is a 24mer with an aminopentyl blocking group at the 3′ end [5′-AATTCAGATCTCCCGGGTCACCGC-NH2, see (4)]. This oligonucleotide must be 5′ phosphorylated before use. The upper strand is a 27mer (5′-GCGGTGACCCGGGAGATCTGAATTCCC-3′). To prepare double-stranded linker, an equimolar amount of upper strand was added directly to the post-kinased lower strand in kinase buffer. The mixture was heated to 95°C and cooled gradually to room temperature. The linker was stored at –20°C. Before use it was thawed and kept on ice. The oligonucleotide used for the linker primer is a 25mer (LP25), the same linker primer as conventionally used for LMPCR (5,15). The sequence of LP25 is the same as the upper strand of the TDPCR linker shown above except 2 nt shorter, i.e. only one C at the 3′ end.
Gene specific primers. The sequences of primers used in this study are given in the figure legends. Usually, three nested primers should be used for TDPCR or RT–TDPCR, but in favorable cases only two may be needed, such as is the case for the yeast experiments shown here. Primer 1 is a 5′-biotinylated primer used for first strand synthesis by RT (Fig. 1). Primer 2 is a nested primer used for the PCR and primer 3 is used for the final labeling step. The P1 primers for AMV and M-MLV RTs were designed to be specific at 42°C. For experiments using C. therm., P1 primer had a Tm of 70°C. Tm was calculated using the Oligo™ 4.0 computer program (National Biosciences, Plymouth, MN) with default settings (50 mM salt and 250 pM oligonucleotide concentrations). P2, the nested gene-specific primer, was designed to have a Tm within 5°C of LP25, the common linker primer, which has a calculated Tm of 63°C. The annealing temperature in the PCR step was chosen to be at the Tm of the gene-specific primer. Primer 3 was designed to have a Tm greater than primer 2, so that competition during direct labeling would be minimized.
Figure 1.

Schematic outline of the RT–TDPCR procedure. RNA is reverse transcribed using a biotin-labeled, gene-specific primer (P1) and the newly synthesized cDNA strand is ribo-tailed using TdT and riboGTP. An oligonucleotide linker with a blocked 3′-terminus is then ligated to the tailed, 3′ end of the cDNA strand. The cDNA molecules, now having a defined sequence on both the 5′ and 3′ ends, are PCR amplified using a nested gene-specific primer (P2) and a linker-specific primer (LP). The amplified DNA fragments are labeled, usually by using a third gene-specific primer (P3), separated by use of a DNA sequencing gel and visualized by autoradiography or phosphorimaging.
RNase T1 treatment (in vivo footprinting) of Hep G2 cells
Human Hep G2 cells were grown, treated and used for RNA preparation as described by Bertrand et al. (3). In brief, cells were first grown in 10-cm plates in DMEM medium plus 10% calf serum to near 80% confluency. The cells were washed with 1× PBS and then incubated overnight in serum-free DMEM in the presence of either 100 µM hemin or desferrioxamine. The cells were trypsinized, washed once with 1× PBS, resuspended in 1× PBS and counted. For RNase T1 treatment, 1 × 10⁶ cells in 100 µl of ice-cold physiological buffer (3) were mixed with 100 µl of ice-cold physiological buffer containing 0.4% Nonidet P-40 and various amounts (0–200 U) of RNase T1. After incubation at 4°C for 3 min, nuclei were removed by centrifugation and cytosolic RNA was prepared by SDS/phenol extraction as described (3).
The RT–TDPCR procedure
First strand synthesis for yeast RNA using AMV RT. An annealing mixture was made by adding 5 µg of total yeast RNA to 0.6–1 pmol of biotinylated primer 1 (see figure legends for primer sequences) in 1× RT buffer (50 mM Tris, pH 8.6 at 25°C, 60 mM NaCl, 10 mM DTT) in a total volume of 10 µl. The mixture was heated at 80–85°C for 3–5 min in a heat block, allowed to cool slowly to room temperature, spun briefly and placed on ice. While on ice, 2 µl of 36 mM Mg(OAC)2 in 1× RT buffer was added. Three microliters of the annealed sample was transferred to a new tube. Two microliters of a freshly prepared RTase/dNTP mix [dilute AMV RTase to 4–5 U/µl with 1× RT buffer plus 6 mM Mg(OAC)2 and add to an equal volume of 5× dNTP (1.875 mM each) in the same buffer] was added and the reaction was incubated at 42°C for 45 min.
First strand synthesis for mammalian cells using Moloney MuLV RT. A pre-RT mixture (10 µl) was made containing 250 ng of total Hep G2 RNA, 1 pmol of biotinylated primer 1 in 1× PCR buffer II (10 mM Tris, pH 8.3, 50 mM KCl) containing 5 mM MgCl2, 2.5 mM dNTP and 6 U RNasin (Promega). The mixture was overlaid with mineral oil, heated to 85°C for 5 min in a heat block, allowed to cool slowly to 42°C and then put at room temperature. An RT reaction mixture (10 µl) was added which contained 1× PCR buffer II, 5 mM MgCl2, 10 U of RNasin and 70 U of Moloney M-LV RT. The reaction was mixed, spun briefly, incubated at 42°C for 45 min, denatured at 95°C for 5 min and then placed on ice.
First strand synthesis for mammalian cells using C. therm. polymerase. An RT reaction mixture (20 µl) was made according to manufacturer’s instructions for C. therm. polymerase (Boehringer Mannheim). The reaction contained 4 µl of 5× RT buffer supplied by the manufacturer (with 25 mM MgCl2 and 10% DMSO), 1 µl of 100 mM DTT, 0.64 µl of 25 mM dNTP, 0.6 µl of 100% DMSO, 20 pmol of biotinylated primer 1, 250 ng of total Hep G2 RNA and 1.5 µl of C. therm. polymerase (6 U). The mixture was overlaid with mineral oil, incubated at 70°C for 30 min and then placed on ice.
Extension product capture and enrichment using magnetic beads. Usually 200 µl of streptavidin-coated beads, enough for 10 samples, were washed as a batch in a 1.5 ml eppendorf tube 2–3 times with 400 µl of 2× B&W buffer (10 mM Tris–HCl, pH 7.5, 1 mM EDTA, 2 M NaCl). A magnetic particle concentrator was used to separate the beads. The washed beads were suspended in 200 µl of 2× B&W buffer. Twenty microliters of washed bead suspension was added to 5–20 µl of the cDNA product from the previous step and the mixture was rotated or gently agitated at room temperature for 15–60 min (longer incubation for longer products, following the suggestion from the manufacturer). The supernatant was removed and the beads washed once with 60 µl of 2× B&W buffer. Fifty microliters of 0.15 M NaOH then was added and the suspension was incubated at 37°C for 5–10 min. This step removes the mRNA template but leaves the DNA on the beads. The supernatant was removed and the beads were washed once more with 50 µl of 0.15 M NaOH. The beads were neutralized by washing twice with 100 µl TE, pH 7.5 (10 mM Tris–HCl, 1 mM EDTA) and suspending them in 10 µl of 0.1× TE, pH 7.5.
Ribo-tailing of cDNA on the beads using TdT. To the neutralized beads was added 10 µl of a TdT mixture containing 10 U of TdT and 4 mM riboGTP in the 2× TdT buffer supplied by the manufacturer. The reaction mixture was incubated at 37°C for 15 min. The supernatant was removed and the beads were washed twice with 100 µl TE, pH 7.5, and then suspended in 15 µl of 0.1× TE, pH 7.5.
Ligation of the riboG-tailed DNA to a double-stranded DNA linker. To the bead suspension was added 15 µl of 2× ligation mix consisting of 7.95 µl of H2O, 1.5 µl of 1 M Tris–HCl, pH 7.5, 0.3 µl of 1 M MgCl2, 0.3 µl of 1 M DTT, 0.3 µl of 100 mM ATP, 0.15 µl of 10 mg/ml BSA, 3 µl of TDPCR linker and 1.5 µl T4 DNA ligase. The reaction was incubated overnight in a 17°C water bath. The beads were washed twice with 100 µl TE, pH 8.0 and resuspended in 30 µl 0.1× TE, pH 8.0.
PCR. Usually 10 µl (out of 30 µl total) of the washed beads from the step above was transferred to a new tube. However, much less can often be used. With yeast RNA, for example, even 1 µl of beads gave a good signal. To the beads was added 40 µl of PCR mix consisting of 27.4 µl H2O, 10 µl of 5× Taq buffer [200 mM NaCl, 50 mM Tris–HCl, pH 8.9, 0.05% (w/v) gelatin], 0.1 µl of 1 M MgCl2, 0.5 µl of 25 mM dNTP mix, 0.5 µl of 20 µM primer 2, 0.5 µl of 20 µM LP25 (the linker primer) and 1 µl of AmpliTaq (5 U/µl). The reaction was overlayed with 50 µl mineral oil and 20 thermocycles were done (45 s at 95°C, 2 min at 63°C, or a temperature close to the Tm of primer 2, and 3 min at 74°C). The PCR product was kept at 4°C until used for labeling and/or electrophoresis. Freezing was avoided so that AmpliTaq will remain adequately active for the subsequent labeling step. For reactions containing betaine, the PCR was done as previously described, with the exception that 15 µl of 5 M betaine was included in the reaction mixture to make the final concentration 1.5 M.
Direct labeling. Ten microliters of the PCR product was transferred to a new tube and 1 µl of 5′ 32P-labeled primer 3 (~1 pmol) was added. The reaction was overlayed with 10 µl of mineral oil and 3–6 thermocycles were done (45 s at 95°C, 2 min at 65°C and 3 min at 72°C). Gel electrophoresis. Five microliters of labeled sample was mixed with 5 µl of loading dye. This sample was heated at 95°C for 2 min just before loading 1–10 µl on a 6–8% standard denaturing DNA sequencing gel. After electrophoresis the separated fragments of the gel ladder were visualized by autoradiography or by use of a phosphorimager. An alternative to direct labeling is transfer of the unlabeled gel-separated fragments to a membrane and then visualization by hybridization with a labeled probe. This procedure, which is commonly used for LMPCR (15), can give increased specificity and increased signal for large fragments. We have so far not found transfer and hybridization to be necessary for RT–TDPCR, but it could be useful in future applications needing extra specificity.
RESULTS
The RT–TDPCR method
As illustrated in Figure 1, the key steps in the use of TDPCR for RNA analysis are (i) RT of mRNA using a gene-specific primer, (ii) the addition, by ribo-tailing with TdT, of 3 nt to the 3′ end of the cDNA molecules and (iii) the ligation of a linker to the 3′ end of each rG-tailed, single-stranded DNA molecule. After linker ligation, PCR is used for fragment amplification and this is followed by size fractionation of the fragments on a sequencing gel. Any RNA lesion, or structure, that blocks primer extension will show as a positive band after separation of RT–TDPCR-generated fragments on an acrylamide sequencing gel. One minor disadvantage of the procedure is that TdT tailing is not precisely limited to 3 nt. However, as shown by Schmidt and Mueller (2), if ribonucleotides instead of deoxyribonucleotides are used, only a few ribonucleotides are added. This fact, along with selection during ligation, leads to the predominance of a 3 nt addition in the final TDPCR or RT–TDPCR product. There are ‘shadow’ bands (see Fig. 3), but these generally do not prevent correct interpretation of the results; usually the center of a cluster of bands is easily identified. TDPCR can even be used to confirm DNA sequence (4 and unpublished data). TDPCR has already proven to be extremely sensitive and versatile for the analysis of in vivo DNA structure, DNA adducts and protein footprints (4,16). Here we discuss only the use of RT–TDPCR for the analysis of RNA.
Figure 3.
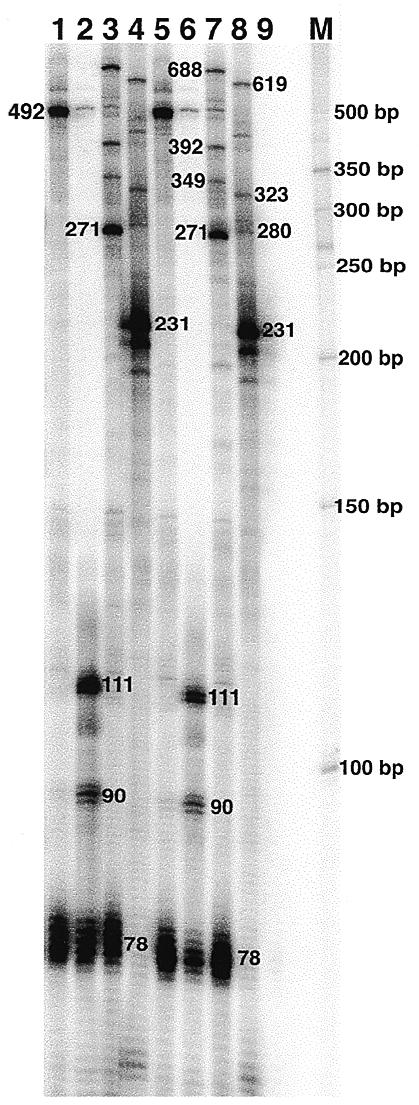
RT–TDPCR analysis of ribozyme cleavage and splicing. Total RNA isolated from untransformed S.cerevisiae strain JM43 (lane 9), or the various transformants shown in Figure 2, were analyzed by RT–TDPCR. pWC1MtRz, lanes 1 and 5; pWC1Rz, lanes 2 and 6; pJYH7MtRz, lanes 3 and 7; pJYH7, lanes 4 and 8. Lane M shows a 50 bp DNA ladder. Two nested primers were used: primer 1 (β-Gal 23, Fig. 2), 5′-biotin-TTAAGTTGGGTAACGCCAGGGTT; primer 2 (β-Gal Nest, Fig. 2), 5′-ACGCCAAGGTTTTCCCAGTCACGAC. Primer 2 was 32P-labeled by kination and used for visualization of the PCR product fragments by the direct-labeling procedure (see Materials and Methods). A phosphorimager was used for detection of bands; exposure was for only a few minutes.
Ribozyme cleavage in yeast
We have employed RT–TDPCR to analyze RNA from yeast transformed with three different ribozyme-expressing constructs (Fig. 2). The RNA products of transcription initiating at the actin promoter contain a cis-acting ribozyme and thus, for the active ribozyme, should self-cleave at the site indicated by the arrow at the bottom of Figure 2. Total RNA was prepared from yeast transformants by the hot-phenol method and used without additional purification. In the plasmid construct pWC1Rz, the first exon of the actin gene is followed by a 192 nt fragment that does not have any splice sites and contains an open reading frame fused with a cis-ribozyme-encoding sequence (Rz). The Rz sequence is followed by the actin exon II and a lacZ reporter gene (11). Plasmid pWC1MtRz is identical to pWC1Rz except that it contains a mutant, non-cleaving form of the ribozyme (MtRz). The only difference between the active ribozyme and its non-cleaving form is a G5→A5 transition mutation in the catalytic core (17) (Fig. 2).
As shown in Figure 3, RT–TDPCR analysis of RNA from pWC1MtRz (Fig. 3, lanes 1 and 5), which has the mutant, inactive ribozyme, shows a strong 492 nt band which corresponds to the full size transcript (53+69+192+151+27; Fig. 2). pWC1Rz (Fig. 3, lanes 2 and 6) contains an active cis-cleaving ribozyme and shows a strong 111 nt band corresponding to the expected size of the 3′ ribozyme cleavage product. RT–TDPCR is able to detect the remaining uncleaved transcript even though the intensity of the band representing full-length transcripts is only 4% of that seen for the mutant ribozyme construct. The identity of the 111 nt cleavage product was confirmed by isolating the band from the gel and determining its sequence. As shown in Figure 4, cleavage was exactly at the expected site; plasmid sequence is followed by the ribozyme sequence to the cleavage site, the guanosines added by TdT and then the sequence of the linker. This is a generally useful feature of RT–TDPCR; any band can be isolated from the gel and its sequence determined by sequencing either directly or after cloning.
Figure 4.

Sequence of the ribozyme cleavage product. Total RNA from yeast transformed with the plasmid construct pWC1Rz (Fig. 2) was used for RT–TDPCR as described in the Materials and Methods except that 35 thermocycles were done instead of 20. After PCR, the 111 nt product (Fig. 3) was isolated from a 2% agarose gel and sequenced using the β-Gal Nest primer. The sequence determined shows from left to right: the vector sequence of WC1 (underlined), the SalI (GTCGAC) site where the ribozyme was inserted, the ribozyme sequence, the ribozyme self-cleave site (marked with arrow; also see Fig. 2) followed by three guanines (marked with asterisks) that are derived from the ribo-guanines added by TdT. The sequence following the three guanines was of lower quality, as expected due to the variable number of Gs added by TdT; nevertheless the linker primer sequence (LP25, underlined) could be identified.
Structurally determined pause sites
In addition to a strong 492 nt band representing extension to the 5′ end of the mRNA, the lanes with both the active and inactive ribozyme have a cluster of bands centered at 78 nt. This band cluster is at the site of insertion of the ribozyme and probably results from structure-induced pausing of RT during primer extension. This is to be expected, since previous work has shown ribozyme structure to cause pausing of AMV RT (18). A cluster of bands is seen, not a single band, because of variable addition of Gs by TdT.
The bands centered at 90 nt, which are present in pWC1Rz but not in pWC1MtRz, are of interest because they demonstrate that RT–TDPCR is detecting subtle RNA structural changes that are occurring after ribozyme cleavage. A pause site at 90 nt is consistent with structural predictions based on nucleotide base interactions detected by NMR in the cleaved ribozyme after cleavage (19,20).
Alternative pre-mRNA splicing
Transcripts of pJYH7 and pJYH7MtRz (Fig. 2) are known to undergo alternative pre-mRNA splicing (21). We used pJYH7 and pJYH7MtRz constructs to see if alternative splice products could be detected by RT–TDPCR as well as structural features of the RNA transcripts that may be important for the splicing reaction. pJYH7 and pJYH7MtRz contain three different 3′ splice sites GG, AG1 and AG2 (21) which are shown in Figure 2. An exon II primer that has its 5′ end located 53 nt downstream of the last 3′ splice site should generate RT–TDPCR products of 231 (153+53+27), 280 (151+102+27) and 323 (151+145+27) nt with pJYH7, whereas pJYH7MtRZ should generate 349 and 392 nt products. (The 27 nt is added because the RT–TDPCR products each will have an additional 27 nt due to the LP25 linker.) The difference in mRNA sizes between pJYH7 and pJYH7MtRz is due to the presence of 69 nt from the mutant ribozyme in exon 2 of the pJYH7MtRz spliced products. pJYH7MtRz should generate only two spliced products, since the insertion of the ribozyme in exon 2 completely blocks splicing at the last 3′ splice site (18). The sizes of the RT–TDPCR products from the unspliced pre-mRNA transcripts are 619 nt for pJYH7 and 688 nt for pJYH7MtRz.
Figure 3 shows that the expected RT–TDPCR products from unspliced and spliced mRNAs are seen, as well as the ribozyme cleavage products. For example, since the insertion of the mutant ribozyme blocks splicing at the 3′-most splice site AG2, we would expect branch point accumulation within this transcript. The RT–TDPCR analysis of this construct is able to detect a 271 nt fragment, which corresponds to an RT stop at the branch site of this pre-mRNA (Fig. 3, lanes 3 and 7). As expected, the 78 nt product that is a result of pausing caused by the presence of the cis-ribozyme in the RNA transcripts is absent in pJYH7 (Fig. 3, lanes 4 and 8).
RNase T1 footprinting to detect protein–RNA interactions in mammalian cells
To demonstrate that RT–TDPCR can be used to study in vivo protein–RNA interactions as well as RNA structure in mammalian cells, we first chose the transferrin receptor system. This is the same system previously used by Bertrand et al. (3) to demonstrate that RLPCR can be used for in vivo RNA footprinting by RNase T1 treatment of permeabilized cells. In the absence of iron, iron-responsive-element binding protein (IRE-BP) binds RNA elements (IREs) which are found in several mRNAs and thought to fold into a stem–loop structure (see Fig. 8). Several IREs of various binding affinities are located in the 3′-UTR of transferrin receptor mRNA (22). In the absence of iron, IRE-BP binds to transferrin receptor mRNA and inhibits its degradation. Iron inhibits the binding of IRE-BP, increases mRNA degradation and thus reduces the level of transferrin receptor protein.
Figure 8.

Possible structure for the ferritin H-chain IRE. The mfold program (25,26) (http://www.ibc.wustl.edu/~zuker/rna/ ) was used with default parameters to model the first 300 bp of ferritin H-chain mRNA (accession no. L20941). The predicted stem–loop structure for IRE region is shown. Sites of strong RNase T1 cleavage in the loop of the IRE are shown by thick arrows. Thin arrows show sites of minor cleavage in the stem. The nucleotide positions are relative to the transcription start.
RNase T1 is specific for Gs in single-stranded RNA (9). As was done by Bertrand et al. (3), we treated human hepatoma cells (Hep G2) with RNase T1 and purified total cytosolic RNA. We then did RT–TDPCR using primers specific for the 3′-UTR of the transferrin receptor mRNA. Figure 5 shows that RNA from cells treated with RNase T1 show numerous bands (Fig. 5, lanes 1 and 3) that are not seen in mock treated cells (Fig. 5, lanes 2 and 4). A site of strong RNase T1 cleavage is seen at the position expected for IRE-B (Fig. 5, band #4) for cells grown in the presence of hemin (+Fe; Fig. 5, lanes 1 and 3), but this band is much less for cells grown in the presence of the iron chelator desferrioxamine (–Fe; Fig. 5, lane 3). IRE-B is known to be a high-affinity site for IRE-BP (22). At IRE-A, a second, lower affinity site previously identified by in vitro studies (22), the change induced by iron is not so obviously dramatic; but when a dose–response curve is done and corrections made for loading, there is a similar response to iron as seen for IRE-B (Fig. 6). These results obtained using RT–TDPCR thus confirm and extend the earlier in vitro (22) and in vivo (3) studies.
Figure 5.
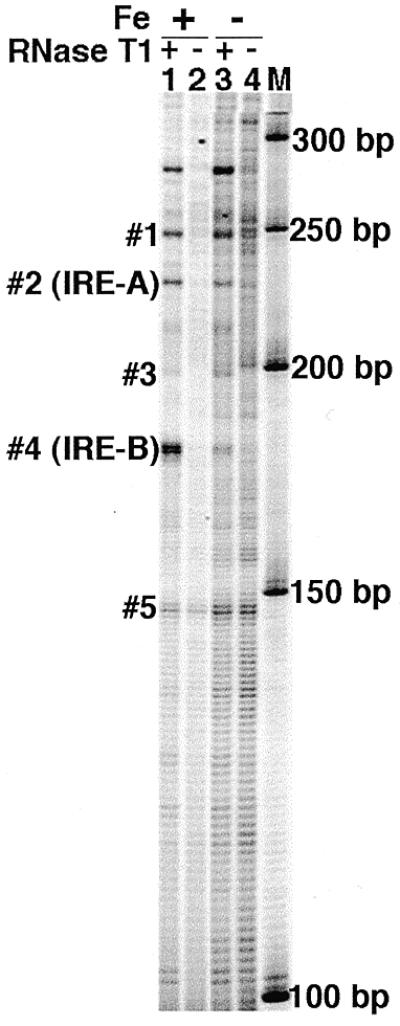
In vivo RNase T1 footprinting of human transferrin receptor mRNA by RT–TDPCR. Hepatoma cells (38) were treated overnight with either 100 µM hemin (+Fe, lanes 1 and 2) or desferrioxamine (–Fe, lanes 3 and 4) added to the medium. Cells were treated with 200 U of RNase T1 (lanes 1 and 3) or no RNase T1 (lanes 2 and 4) according to the procedure in Materials and Methods (3). Cytosolic mRNA was isolated and used for TDPCR. The primer set used was: primer 1, 5′-biotin-CTAAATCTTAGCTTCAAC; primer 2, 5′-AACTTTATTCAATTACATTTGGCTG and primer 3, 5′-ATTCAATTACATTTGGCTGACGGCTG. Lane M shows a 50 bp DNA ladder. The iron-reponse elements IRE-A and IRE-B are indicated, as are the bands (#1–#5) used for quantitative analysis (Fig. 6).
Figure 6.

Dose dependence and quantitative analysis of transferrin receptor mRNA footprinting. Integrated band intensities were determined for the bands marked #1 to #5 in Figure 5 and for experiments not shown. To aid correction for loading and other variations, the bands were normalized to band #5, which is a band that is independent of RNase T1. As indicated in the figure, unshaded bars are from cells treated with hemin (+Fe) and shaded bars are cells treated with desferrioxamine (–Fe). The various concentrations of RNase T1 (0–200 U) used to treat the cells are indicated by different patterns, as shown in the figure.
The level of ferritin protein is also controlled by iron, but in contrast to transferrin receptor, it is upregulated by iron, rather than downregulated. In vivo footprinting studies have not previously been reported, but previous studies led to identification of an IRE near the 5′ end of the ferritin H-chain message (23). In the absence of iron, the IRE-binding protein is thought to bind at this IRE and inhibit translation. In our initial studies on ferritin H-chain mRNA, we found that full-length RT–TDPCR fragments were difficult to obtain. This problem was solved by using C.therm. polymerase, a thermostable RT, and including betaine in the PCR reaction. Though the use of C. therm. gives a somewhat lower background (data not shown), the presence of betaine during PCR gave the main improvement (Fig. 7). Apparently, the sequence at the 5′ end of ferritin is difficult for Taq polymerase to amplify. Betaine is known to aid PCR amplification of difficult sequences (24). Figure 7 thus shows that excellent results can be obtained even for a difficult sequence that is 73% G+C. Note the reproducibility between lanes, even for low intensity bands. Importantly, one sees a dramatic effect of iron on RNase T1 susceptibility at the IRE, which is known to be located between –151 and –186, ~46 nt from the transcription start site (23). As evidenced by little change in the RNase T1 cleavage pattern, the overall structure of the 5′ region analyzed was not changed by iron. There are 22 Gs located within the first 80 bp of the ferritin H-chain mRNA, and all except for those in the IRE react weakly with RNase T1. These results are consistent with the structure of the IRE loop and stem predicted by the mfold program (25,26) and shown in Figure 8. In vitro NMR studies using synthetic RNA have detected interactions between G47 and C43 in the hexaloop (using the base numbering shown in Fig. 8), and also between U35 and G55 in the internal loop/bulge (27,28). Our studies do not add information at this level of detail, but do provide evidence that the structure of ferritin IRE in vivo is quite similar to that in vitro.
Figure 7.
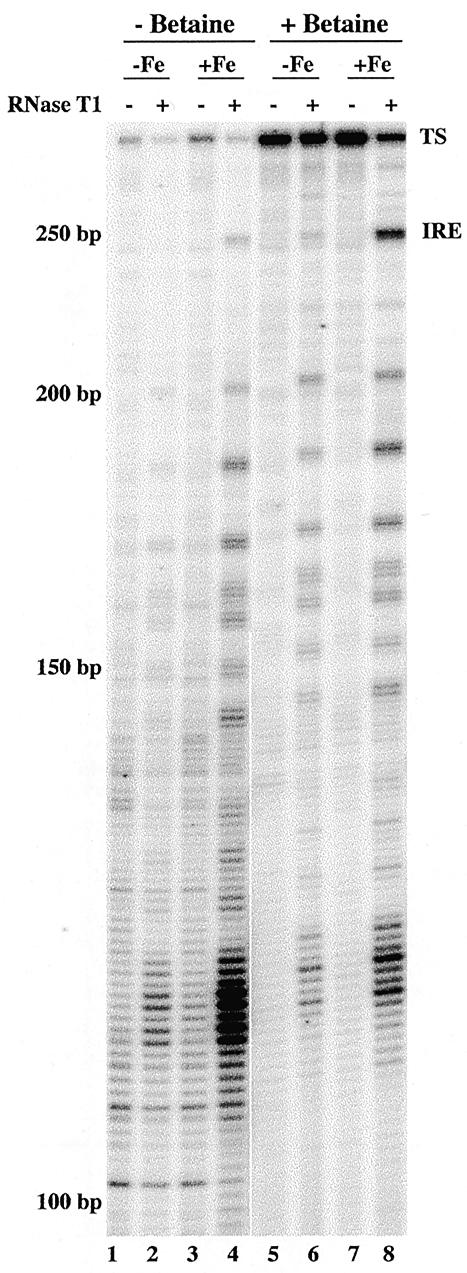
RNase T1 footprinting of ferritin H-chain mRNA by RT–TDPCR. Hepatoma cells were treated as in Figure 5 with either 100 µM desferrioxamine (–Fe, lanes 1, 2, 5 and 6) or 100 µM hemin (+Fe, lanes 3, 4, 7 and 8). Cytosolic mRNA was isolated after RNase T1 treatments (0 U, lanes 1, 3, 5 and 7, or 100 U, lanes 2, 4, 6 and 8). The primer set used was: primer 1, 5′-biotin-GCTCCAGGTTGATCTGGCGGTTGATG; primer 2, 5′-CGGTTGATGGCGGCCTCTGAGTC and primer 3, 5′-GGCGGCCTCTGAGTCCTGGTGGTAG. The PCR step was done either with (lanes 5–8) or without (lanes 1–4) 1.5 M betaine. TS denotes the transcription start site and IRE denotes the iron response element.
Reproducibility and quantitation
Previous studies established that LMPCR and TDPCR can be used for both qualitative and quantitative analysis of DNA (4,29). The pattern of relative band intensities is quite reproducible. The method is quantitative and rather robust in this aspect. We find that RT–TDPCR is similarly quantitative. Two separate experiments are shown in Figure 3. The RNAs were prepared at different times and one sample was stored for months before RT–TDPCR assay. Inspection of the patterns shows excellent reproducibility. Even minor bands are at the same relative intensities in the two experiments. Moreover, the relative ratios of utilization of the various 3′ splice sites detected by RT–TDPCR are similar to results obtained in earlier studies that utilized PCR but only visualized spliced transcripts (21). Good reproducibility is also seen for mammalian studies. The relative intensity of even faint bands, including those in the lanes without RNase T1 (Fig. 7, compare lanes 5 and 7), is quite reproducible. Thus TdT tailing seems to be rather robust, as are other steps in the procedure. These studies with RNA thus show excellent reproducibility, as did the previous studies using TDPCR to study DNA (4).
The change in RNaseT1 susceptibility in response to iron at the IRE-B element in transferrin receptor mRNA is obvious by visual inspection of Figure 5. However, quantitative analysis can be even more informative, as shown in Figure 6. Digitized data, obtained by use of a phosphorimager, were used to calculate integrated band intensities for the bands labeled #1–#5 in Figure 5. To correct for variable gel loading (e.g. lane 2 of Fig. 5 has weaker bands than lane 4), the data were normalized using a band showing no RNase T1 dose dependence. Band #5 is present in all lanes and shows no dose response to RNase T1 (Fig. 5 and data not shown). This band, which likely comes from pausing due to RNA structure during primer extension, was used to normalize, and Figure 6 shows the results obtained. Both the dose response to RNase T1 and the changes in susceptibility in the presence of iron are clearly seen. For example, the susceptibility of IRE-B is increased 18-fold by iron.
DISCUSSION
RNA structure and protein–RNA interactions (9,30) have been studied greatly because they are crucial for RNA function. However, most of the techniques used, including those that depend on primer extension, work well for prokaryotes but have seen limited use for mammalian cells because of detection and specificity limitations. For example, primer extension reactions to determine transcription start sites for mammalian mRNA require as much as 60 µg of RNA and long exposure times (31–33). Detection of low abundance RNA lesions, such as those expected due to splicing intermediates, ribozyme cleavage and protein–RNA footprinting agents, cannot be done by primer extension without some additional signal amplification technique. Bertrand et al. (3) developed the first technique with sensitivity adequate for detection of in vivo footprints (3) and ribozyme cleavage (7). Their technique, which they named RLPCR, only detects 5′-phosphorylated RNA ends to which an RNA linker has been ligated before the primer extension reaction. RNA structure or lesions that stop primer extension are not detected. This may often be an advantage, since, theoretically, the background should be low and due only to RNA strand breaks. However, in their experiments significant background was seen in RNA from cells not treated with RNase T1; presumably this was due to endogenous RNase cleavage before or during RNA preparation, kination and ligation (3). We find that RT–TDPCR analysis of RNA from cells not treated with RNase T1 can have a relatively low background (Fig. 7, lanes 5 and 7).
TDPCR for DNA studies (4) and, as we report here, RT–TDPCR for RNA studies each retains most of the advantages of LMPCR, a technique that has been much used for the study of in vivo protein–DNA interactions because it gives PCR sensitivity, nested primer specificity and nucleotide-level resolution (5,15,29,34). Usually LMPCR needs for detection only about 100 template molecules at a specific size for each band seen in the gel ladder. TDPCR can be several-fold more sensitive than LMPCR for DNA (4), but for RNA, sensitivity is similar to LMPCR. RT–TDPCR should thus need for detection only a few hundred RNA molecules. Experiments reported here were not directed at determining the ultimate sensitivity of the method, but we have been able to determine transcription initiation sites using as little as 6 ng of total RNA (data not shown), and, as reported in a companion paper, even single cells can be analyzed by using a variation of the method (35).
In addition to being extremely sensitive, both LMPCR and TDPCR have proven to be quite quantitative; being capable of detecting reproducibly even 2-fold differences (29), as long as the primers and active enzyme are in vast excess, which is the case for at least the first 20 PCR cycles. The ratio of nearby bands is very reproducible, so changes in the ratio of bands within the same lane are diagnostic of changes in DNA structure or protein–DNA interactions. This feature of TDPCR should be the same for RT–TDPCR, and experiments reported here have confirmed this expectation. In fact, the primary finding of this paper is that RT–TDPCR can be used to derive reproducible, quantitative information from the less than full-length cDNA transcripts that result from RT pausing or stopping due to intrinsic RNA structure or experimentally introduced breaks or lesions.
We have successfully used RT–TDPCR to (i) detect cis-ribozyme cleavage of mRNA in transformed yeast cells (Fig. 3), (ii) confirm the location of a transcription start site in yeast (Fig. 3) and mammalian cells [Ferritin H-chain, Fig. 7; Xist, data not shown; Snrpn, Buettner et al. (35)], (iii) detect mRNA splicing intermediates (Fig. 3), (iv) detect protein–RNA interactions by in vivo RNase T1 footprinting (Figs 5 and 7) and (v) gain information on RNA structure, as evidenced by pause sites (Fig. 3) and susceptibility to RNase T1 (Figs 5–7). We expect that any agent that cleaves or modifies RNA and blocks the progression of primer extension can be used for analysis. This category includes a large number of agents, such as alkylating chemicals, UV and psoralen that have been used for structure determination of prokaryotic RNA (9,30,36). Another potentially important application of RT–TDPCR is for the detection of 3′ cleavage products produced by in vivo ribozyme cleavage. In many cell types, products are quickly degraded and cannot be detected by RNase protection or primer extension analyses (37).
Acknowledgments
ACKNOWLEDGEMENTS
This work was supported by NIH grants GM50575 to A.D.R. and AI29329 to J.J.R.
REFERENCES
- 1.Frohman M.A. (1993) Methods Enzymol., 218, 340–356. [DOI] [PubMed] [Google Scholar]
- 2.Schmidt W.M. and Mueller,M.W. (1996) Nucleic Acids Res., 24, 1789–1791. [DOI] [PMC free article] [PubMed] [Google Scholar]
- 3.Bertrand E., Fromont-Racine,M., Pictet,R. and Grange,T. (1993) Proc. Natl Acad. Sci. USA, 90, 3496–3500. [DOI] [PMC free article] [PubMed] [Google Scholar]
- 4.Komura J. and Riggs,A.D. (1998) Nucleic Acids Res., 26, 1807–1811. [DOI] [PMC free article] [PubMed] [Google Scholar]
- 5.Hershkovitz M. and Riggs,A.D. (1997) Methods, 11, 253–263. [DOI] [PubMed] [Google Scholar]
- 6.Riggs A.D. and Pfeifer,G.P. (1997) In Cartwright,I.L. (ed.), In Vivo Footprinting, Vol. 21. JAI Press, Greenwich, CT, pp. 47–72.
- 7.Bertrand E., Fromont-Racine,M., Pictet,R. and Grange,T. (1997) Methods Mol. Biol., 74, 311–323. [DOI] [PubMed] [Google Scholar]
- 8.Giles R.V., Spiller,D.G. and Tidd,D.M. (195) Antisense Res. Dev., 5, 23–31. [DOI] [PubMed] [Google Scholar]
- 9.Ehresmann C., Baudin,F., Mougel,M., Romby,P., Ebel,J.P. and Ehresmann,B. (1987) Nucleic Acids Res., 15, 9109–9128. [DOI] [PMC free article] [PubMed] [Google Scholar]
- 10.Castanotto D., Chow,W.A., Li,H. and Rossi,J.J. (1998) Antisense Nucleic Acid Drug Dev., 8, 499–506. [DOI] [PubMed] [Google Scholar]
- 11.Castanotto D., Li,H., Chow,W., Rossi,J.J. and Deshler,J.O. (1998) Antisense Nucleic Acid Drug Dev., 8, 1–13. [DOI] [PubMed] [Google Scholar]
- 12.Sherman F., Fink,G.R. and Hicks,J.G. (1986) Methods in Yeast Genetics. Cold Spring Harbor Laboratory Press, Cold Spring Harbor, New York.
- 13.Domdey H., Apostol,B., Lin,R.J., Newman,A., Brody,E. and Abelson,J. (1984) Cell, 39, 611–621. [DOI] [PubMed] [Google Scholar]
- 14.Lin R.-J., Kim,D.-H., Castanotto,D., Westaway,S. and Rossi,J.J. (1996) In Kreig,P.A. (ed.), A Laboratory Guide to RNA: Isolation, Analysis, and Synthesis. Wiley-Liss, New York, NY, pp. 43–50.
- 15.Pfeifer G.P., Chen,H.H., Komura,J. and Riggs,A.D. (1999) Methods Enzymol., 304, 548–571. [DOI] [PubMed] [Google Scholar]
- 16.Denissenko M.F., Koudriakova,T.B., Smith,L., O’Connor,T.R., Riggs,A.D. and Pfeifer,G.P. (1998) Oncogene, 17, 3007–3014. [DOI] [PubMed] [Google Scholar]
- 17.Ruffner D.E., Stormo,G.D. and Uhlenbeck,O.C. (1990) Biochemistry, 29, 10695–10702. [DOI] [PubMed] [Google Scholar]
- 18.Lin J. and Rossi,J.J. (1996) RNA, 2, 835–848. [PMC free article] [PubMed] [Google Scholar]
- 19.Simorre J.P., Legault,P., Hangar,A.B., Michiels,P. and Pardi,A. (1997) Biochemistry, 36, 518–525. [DOI] [PubMed] [Google Scholar]
- 20.Murray J.B., Terwey,D.P., Maloney,L., Karpeisky,A., Usman,N., Beigelman,L. and Scott,W.G. (1998) Cell, 92, 665–673. [DOI] [PubMed] [Google Scholar]
- 21.Deshler J.O. and Rossi,J.J. (1991) Genes Dev., 5, 1252–1263. [DOI] [PubMed] [Google Scholar]
- 22.Koeller D.M., Casey,J.L., Hentze,M.W., Gerhardt,E.M., Chan,L.N., Klausner,R.D. and Harford,J.B. (1989) Proc. Natl Acad. Sci. USA, 86, 3574–3578. [DOI] [PMC free article] [PubMed] [Google Scholar]
- 23.Hentze M.W., Caughman,S.W., Rouault,T.A., Barriocanal,J.G., Dancis,A., Harford,J.B. and Klausner,R.D. (1987) Science, 238, 1570–1573. [DOI] [PubMed] [Google Scholar]
- 24.Henke W., Herdel,K., Jung,K., Schnorr,D. and Loening,S.A. (1997) Nucleic Acids Res., 25, 3957–3958. [DOI] [PMC free article] [PubMed] [Google Scholar]
- 25.Mathews D.H., Sabina,J., Zuker,M. and Turner,D.H. (1999) J. Mol. Biol., 288, 911–940. [DOI] [PubMed] [Google Scholar]
- 26.Zuker M., Mathews,D.H. and Turner,D.H. (1999) In Barciszewski,J. and Clark,B.C.F. (eds), RNA Biochemistry and Biotechnology. Kluwer Academic, Dordrecht, The Netherlands.
- 27.Gdaniec Z., Sierzputowska-Gracz,H. and Theil,E.C. (1998) Biochemistry, 37, 1505–1512. [DOI] [PubMed] [Google Scholar]
- 28.Addess K.J., Basilion,J.P., Klausner,R.D., Rouault,T.A. and Pardi,A. (1997) J. Mol. Biol., 274, 72–83. [DOI] [PubMed] [Google Scholar]
- 29.Pfeifer G.P., Tanguay,R.L., Steigerwald,S.D. and Riggs,A.D. (1990) Genes Dev., 4, 1277–1287. [DOI] [PubMed] [Google Scholar]
- 30.Brimacombe R. (1991) Biochimie, 73, 927–936. [DOI] [PubMed] [Google Scholar]
- 31.Brockdorff N., Ashworth,A., Kay,G.F., McCabe,V.M., Norris,D.P., Cooper,P.J., Swift,S. and Rastan,S. (1992) Cell, 71, 515–526. [DOI] [PubMed] [Google Scholar]
- 32.Yamada M., Izu,H., Nitta,K., Kurihara,K. and Sakurai,T. (1998) Biotechniques, 25, 72–75. [DOI] [PubMed] [Google Scholar]
- 33.Ausubel F.M., Brent,R., Kingston,R.E., Moore,D.D., Seidman,J.G., Smith,J.A. and Struhl,K. (1987) In Chanda,V. (ed.), Current Protocols in Molecular Biology, Vol. 1. John Wiley & Sons, New York, NY.
- 34.Riggs A.D., Singer-Sam,J. and Pfeifer,G.P. (1998) In Gould,H. (ed.), Chromatin: A Practical Approach. Oxford University Press, Oxford, pp. 79–109.
- 35.Buettner V.L., LeBon,J.M., Gao,C., Riggs,A.D. and Singer-Sam,J. (2000) Nucleic Acids Res., 28, e25. [DOI] [PMC free article] [PubMed] [Google Scholar]
- 36.Rhee Y., Valentine,M.R. and Termini,J. (1995) Nucleic Acids Res., 23, 3275–3282. [DOI] [PMC free article] [PubMed] [Google Scholar]
- 37.Steinecke P., Herget,T. and Schreier,P.H. (1992) EMBO J., 11, 1525–1530. [DOI] [PMC free article] [PubMed] [Google Scholar]
- 38.Knowles B.B., Howe,C.C. and Aden,D.P. (1980) Science, 209, 497–499. [DOI] [PubMed] [Google Scholar]