

Abstract
Background
Uterine clear cell carcinoma (CCC) consists of either pure clear cell histology but can also display other histological components (mixed uterine CCCs). In this study, the molecular and immunohistochemical background of pure and mixed uterine CCC was compared. Secondly, it was evaluated whether histological classification and molecular background affected clinical outcome.
Methods
A retrospective multicenter study was performed comparing pure uterine CCCs (n = 22) and mixed uterine CCCs (n = 21). Targeted next‐generation sequencing using a 12‐gene targeted panel classified cases as polymerase‐ε (POLE) mutated, microsatellite instable (MSI), TP53 wildtype or TP53 mutated. Immunohistochemistry was performed for estrogen receptor, progesterone receptor, L1 cell adhesion molecule, MSH6, and PMS2.
Results
The following molecular subgroups were identified for pure and mixed uterine CCCs, respectively: POLE mutated 0% (0/18) and 6% (1/18); MSI in 6% (1/18) and 50% (9/18); TP53 wildtype in 56% (10/18) and 22% (4/18); TP53 mutated in 39% (7/18) and 22% (4/18) (p = 0.013). Patients with mixed CCCs had improved outcome compared to patients with pure CCCs. Frequent TP53 mutations were found in pure CCCs and frequent MSI in mixed CCCs, associated with clinical outcome.
Conclusion
Pure and mixed uterine CCCs are two entities with different clinical outcomes, which could be explained by different molecular backgrounds. These results underline the relevance of both morphological and molecular evaluation, and may assist in tailoring treatment.
Keywords: clear cell carcinoma, endometrial cancer, molecular classification
1. INTRODUCTION
Endometrial carcinoma (EC) is the fourth leading cancer in female patients in Europe, with 121,600 new cases and 29,600 deaths in 2018. 1 The most common histological type of EC is endometrioid endometrial carcinoma (EEC), which accounts for 80% of all cases and generally shows a favorable prognosis. 2 Less than 5% of EC consists of uterine clear cell carcinoma (CCC), an aggressive subtype of non‐EEC. 3 , 4 , 5 Uterine CCC is frequently diagnosed in older, postmenopausal women, with 40%–45% presenting with extra‐uterine disease. 6 , 7 The 5‐year overall survival (OS) is 63%, compared to 83% in the EEC population. 8 The Society of Gynecologic Oncology recommends comprehensive surgical staging and the use of adjuvant radiotherapy and/or chemotherapy for patients with uterine CCC, given the high incidence of recurrence. 9 , 10
In addition to pure clear cell histology, it is not uncommon for uterine CCC to display other histological components. These so‐called mixed uterine CCCs usually show an additional component of endometrioid or serous carcinoma. 11 In serous EC, it is known that carcinomas with mixed histology have a significantly better prognosis than patients with serous histology only. 12 Whether mixed uterine CCCs display a better clinical outcome than pure uterine CCCs remains unclear.
Major advances in characterization of the molecular background of ECs have been made in recent years. 13 The Cancer Genome Atlas (TCGA) has defined four distinct molecular subtypes each with prognostic relevance. These molecular subtypes have been modified for clinical use by, among others, the Proactive Molecular Risk Classifier for Endometrial Cancer (ProMisE) classification. 14 , 15 Molecular profiling has demonstrated to be supportive in high grade EC, yet for CCC, data are limited. Molecular subtypes in EC include an “ultramutated” subgroup with mutations in the exonuclease domain of polymerase‐ε (POLE) and an excellent prognosis; a “hypermutated” subgroup with microsatellite instability (MSI); a “copy‐number high” subgroup characterized by TP53 mutations and generally unfavorable outcome; and the copy number‐low subgroup. 13 Recent studies have shown that pure uterine CCC is a molecularly heterogeneous disease which encompasses different molecular subtypes. 16 , 17 , 18 , 19 , 20 Due to this heterogeneous molecular background, clinical behavior and prognosis of uterine CCC may be more varied than generally thought, which could have consequences for the extent of (adjuvant) therapy.
The primary aim of this study was to identify and compare the molecular and immunohistochemical (IHC) background of pure and mixed uterine CCC. The secondary aim was to evaluate whether histological classification, molecular and IHC features affect clinical outcome.
2. MATERIALS AND METHODS
2.1. Patient cohort
The nationwide Netherlands database of histopathology and cytopathology (PALGA) was used to search for all patients diagnosed with uterine CCC between January 1990 and December 2020 at the Radboud University Medical Center and the Canisius Wilhelmina Hospital Nijmegen, The Netherlands. 21 Patients were excluded when having less than 10% clear cell component, when not receiving a surgical treatment and when no histological tumor tissue could be retrieved for IHC/molecular analysis.
2.2. Data collection
Clinicopathological data were collected regarding age at diagnosis, body mass index, cancer antigen‐125, cervical cytology, preoperative endometrial sampling, extent of primary surgical approach, stage, adjuvant treatment, and follow‐up data. Stage of disease was based on the 2009 International Federation of Gynecology and Obstetrics (FIGO) endometrial cancer criteria. 22
2.3. Histopathological review
Hematoxylin and eosin (H&E) slides of the hysterectomy specimens were systematically reviewed by two pathologists with special interest in gynecology (J.B., H.K.), being blinded to any clinical or histological data. Histological review included classification of tumor histology, an estimation of percentages of the different components if present, depth of myometrial invasion and the presence of cervical stromal invasion (CI). Slides were screened for the presence of lymphovascular space invasion. Diagnosis was made according to the 2020 World Health Organization (WHO) guidelines and a tumor was classified as mixed when it contained at least two different histological components, regardless of component percentage. 11 To support the diagnosis mixed uterine CCC, IHC stains were used in doubtful cases according to the 2020 WHO guidelines. For each case, an H&E slide with representative tumor tissue was selected and marked off for the purpose of DNA extraction in parallel unstained slides. In case of mixed uterine CCC, the different components were marked off separately, if possible.
2.4. IHC staining
IHC staining was performed for estrogen receptor (ER), progesterone receptor (PR), L1 cell adhesion molecule (L1CAM), PMS2, and MSH6 (Appendix A). For ER and PR, the number of stained tumor nuclei was scored. Cases were dichotomized, using 10% as a cutoff value. For L1CAM, the number of tumor cells showing membranous expression was scored and dichotomized, using 10% as a cutoff value. Mismatch repair deficiency (MMRd) was defined as total loss of nuclear staining of either PMS2 or MSH6, in the presence of a positive internal control.
2.5. DNA extraction and library preparation
Representative tumor tissue was selected by means of microdissection from 8 × 10 μm thick formalin‐fixed, paraffin‐embedded (FFPE) sections. In case of mixed histology, both components were microdissected separately. Next, tissue was digested at 56°C for at least 16 h in the presence of TET‐lysis buffer (1 M Tris/HCL pH 8.5, 0.5 M EDTA pH 8.0, 20% Tween‐20) with 5% Chelex‐100 (Bio‐Rad) and 10% proteinase K (Qiagen), followed by inactivation at 95°C for 10 min. Twice, the supernatant was transferred to a clean tube after centrifugation at 14,000 × g for 10 min. DNA concentration was determined using the Qubit 1× dsDNA High Sensitivity Assay Kit (Thermo Fisher Scientific). The isolated DNA was stored at −20°C.
The samples were analyzed with single‐molecule molecular inversion probes (smMIPs, Integrated DNA Technologies). 23 The panel consisted of 12 relevant genes involved in EC oncogenesis as well as a number of genes informative for ProMisE classification (AKT1, ARID1A, CTNNB1, ERBB2, FGFR2, KRAS, MTOR, NRAS, PIK3CA, PTEN, POLE, TP53, Appendix B), in addition to markers for microsatellite instability (MSI). Targeted sequencing with smMIPs was performed as previously described. 23 All smMIPs were designed in a tiling manner for hotspots in oncogenes and all coding as well as splice site consensus sequences of tumor suppressor genes (TSGs), with preferential targeting of both strands by two smMIPs. The smMIP probes were constructed by an extension and ligation probe arm (40 bp long) with a 112 bp gap and a common backbone sequence for PCR‐based library amplification. The ligation probe arm and backbone were connected by means of an 8 bp degenerate sequence (8xN) serving as a Unique Molecular Identifier (“single molecule tag”). The smMIP probes were mixed and phosporylated with 1 μL of T4 polynucleotide kinase (M0201; New England Biolabs) per 25 μL of 100 μmol/L smMIPs and ATP‐containing G4 DNA ligase buffer (B0202, New England Biolabs). The molecular ratio between gDNA and smMIPs was set at 1:3200 for each individual smMIP, and the standard genomic DNA input was 100 ng. Next, a capture mix was made (volume: 25 μL) with the phosporylated smMIP pool, 1 unit of Ampligase DNA ligase (A0110K; EpiBio) and Ampligase Buffer (A1905B, DNA ligase buffer), 3.2 units of Hemo Klentaq (M0332; New England Biolabs), 8 mmol of dNTPs (28‐4065‐20/‐12/‐22/‐32; GE Healthcare), and 100 ng of genomic DNA in a 20 μL volume. This capture mix was denatured at 95°C for 10 min and subsequently incubated for probe hybridization, extension and ligation at 60°C for 18 h. After cooling, to perform exonuclease treatment, Exonuclease I (10 units; M0293; New England Biolabs) and III (50 units; M0206; New England Biolabs) and Ampligase Buffer was added to the capture mix (total of 27 μL). The mix was incubated at 37°C for 45 min, with subsequent inactivation at 95°C for 2 min. Twenty microliters was then used for PCR in a total volume of 50 μL including a common forward primer, bar‐coded reverse primers, and iProof high fidelity master mix (1725310, Bio‐Rad). The resulting PCR products were pooled and purified with 0.8× volume of Agencourt Ampure XP Beads (A63881, Beckman Coulter).
2.6. Sequencing and analysis
The purified libraries were sequenced on a NexSeq500 instrument (Illumina). The Sequence Pilot software (version 4.4.0; JSI Medical Systems) was used to demultiplex the bar‐coded reads and create consensus (“unique”) reads to minimize sequencing errors. Variant calling was performed and variants were annotated as benign, likely benign, unknown, likely pathogenic or pathogenic using publicly available databases such as The Clinical Knowledgebase (https://www.jax.org/clinical‐genomics/ckb), ClinVar (https://www.ncbi.nlm.nih.gov/clinvar/), Cancer Genome Interpreter (https://www.cancergenomeinterpreter.org/home), and the Catalog of Somatic Mutations in Cancer (cancer.sanger.ac.uk/cosmic). 24 The last three categories were considered relevant and consisted of known activating hotspot mutations for the oncogenes, 25 and frameshift, nonsense, missense, and splice‐site mutations for the TSGs. The following molecular subgroups were identified based on these sequencing results: POLE mutated, MSI, TP53 wildtype and TP53 mutated. In case of double classifiers (for example, POLE and TP53 mutation), the tumor was classified as previously described. It was previously shown that there is an excellent correlation between TP53 mutational status and p53 IHC, and we therefore decided not to perform additional IHC in this study. 26
2.7. Statistical analysis
For statistical analyses, Statistical Package for the Social Sciences, version 25.0 (IBM) was used. Clinicopathological differences between subgroups were compared using the Fisher's exact test and chi‐square for discrete variables and the Mann–Whitney U‐test for continuous variables. Survival analyses were performed using the Kaplan–Meier (KM) curves and univariable and multivariable Cox‐regression analysis. A recurrence was defined as first sign of relapse after a 6‐month disease‐free interval after initial surgery. Disease‐free survival was calculated from the date of initial surgery until the date of recurrence, whereas OS was calculated from the date of initial surgery until the date of death or, for surviving patients, to the date of last follow‐up. Disease‐specific survival (DSS) was calculated from the date of primary treatment to the date of death caused by the disease or, for surviving patients, to the date of the last follow‐up.
2.8. Ethics considerations
For this observational study, the Research Ethics Committee of the Radboud University Medical Center declared the study protocol in accordance with the applicable rules concerning the review of research ethics committees and informed consent (approval number 2018‐4023).
3. RESULTS
3.1. Patients
A total of 72 patients were identified of which 29 were excluded (n = 8 after pathology review, n = 13 due to insufficient tissue, n = 2 because of missing follow‐up, and n = 6 due to palliative treatment). A total of 43 patients were included in the analysis, of which 22 (51%) were pure uterine CCC and 21 (49%) mixed uterine CCC. Median age was 70 years (range 48–88) and did not differ between patients with pure or mixed uterine CCC (Table 1). The second histological component in mixed uterine CCC consisted of endometrioid histology in 16 patients (76%), serous histology in 3 patients (14%), and endometrioid + serous histology in 2 patients (10%). In patients with pure uterine CCC, 12 patients (55%) presented with FIGO Stages III and IV disease, compared to 6 patients (29%, p = 0.084) with mixed uterine CCC. As shown in Table 2, ER, PR, and IHC stains were reflective of the mixed components as the clear cell component was mostly negative for ER and PR and the other histological components were mostly positive. The use of adjuvant therapy did not differ significantly between groups. In patients with pure uterine CCC, 11 patients (50%) died in the follow‐up period, compared to 4 patients (19%, p = 0.033) with mixed uterine CCC.
TABLE 1.
Baseline characteristics.
| All (n = 43) | Pure (n = 22) | Mixed (n = 21) | p‐Value | |
|---|---|---|---|---|
| Age (years) | 70 (49–88) | 71 (49–84) | 68 (51–88) | 0.780 |
| BMI (kg/m2) | 27 (19–50) | 26 (19–40) | 28 (20–50) | 0.621 |
| CA‐125 at diagnosis (IU/mL) | 19 (2–508) | 22 (9–508) | 16 (2–175) | 0.259 |
| Follow‐up (months) | 34 (3–194) | 22 (3–168) | 41 (3–194) | 0.174 |
| Second histological component | ||||
| Endometrioid | 16 (76) | |||
| Serous | 3 (14) | |||
| Endometrioid + serous | 2 (10) | |||
| Myometrial invasion | 0.393 | |||
| <50% | 18 (42) | 8 (36) | 10 (48) | |
| >50% | 24 (56) | 14 (64) | 10 (48) | |
| Unknown | 1 (2) | 0 | 1 (5) | |
| Cervical stroma invasion | 0.162 | |||
| Present | 18 (42) | 12 (55) | 6 (29) | |
| Not present | 24 (56) | 10 (46) | 14 (67) | |
| Unknown | 1 (2) | 0 | 1 (5) | |
| Lymph nodes | 0.435 | |||
| Negative | 17 (40) | 8 (36) | 9 (43) | |
| Positive pelvic nodes | 4 (9) | 3 (14) | 1 (5) | |
| Positive para‐aortal nodes | 9 (21) | 6 (27) | 3 (14) | |
| Unknown | 13 (30) | 5 (23) | 8 (38) | |
| International Federation of Gynecology and Obstetrics (FIGO) stage | ||||
| Stages I and II | 25 (58) | 10 (46) | 15 (71) | 0.084 |
| Stages III and IV | 18 (42) | 12 (55) | 6 (29) | |
| Adjuvant therapy | ||||
| Radiotherapy | 21 (51) | 10 (46) | 11 (52) | 0.932 |
| Chemotherapy | 5 (12) | 3 (14) | 2 (10) | |
| Chemoradiotherapy | 2 (5) | 1 (5) | 1 (5) | |
| None | 14 (33) | 8 (36) | 6 (29) | |
| Unknown | 1 (2) | 1 (5) | ||
| Residual disease | ||||
| Yes | 9 (21) | 7 (32) | 2 (10) | 0.072 |
| No | 34 (79) | 15 (68) | 19 (91) | |
| Recurrence a | ||||
| Yes | 6 (18) | 4 (27) | 2 (11) | 0.095 |
| No | 28 (82) | 11 (73) | 17 (90) | |
| Deceased | ||||
| Yes | 15 (35) | 11 (50) | 4 (19) | 0.033 |
| No | 28 (65) | 11 (50) | 17 (81) | |
| Deceased EC‐related | 0.065 | |||
| Yes | 14 (33) | 10 (46) | 4 (19) | |
| No | 29 (67) | 12 (55) | 17 (81) |
Note: p‐Values were obtained using the Mann–Whitney U‐test, Fisher's exact test, and chi‐squared test. Values are presented as median (range) or number (%).
Abbreviations: BMI, body mass index; CA‐125, cancer antigen‐125; EC, endometrial cancer.
Excluding patients with residual disease.
TABLE 2.
Immunohistochemical staining.
| Pure | Mixed | ||
|---|---|---|---|
| Clear cell component | Other component | ||
| Estrogen receptor | |||
| Positive | 5 (24) | 11 (52) | 21 (100) |
| Negative | 16 (76) | 10 (48) | 0 |
| Progesterone receptor | |||
| Positive | 1 (5) | 6 (29) | 16 (84) |
| Negative | 21 (96) | 15 (71) | 3 (16) a |
| L1CAM | |||
| Negative | 5 (23) | 6 (29) | 16 (76) |
| Positive | 17 (77) | 15 (71) | 5 (24) |
| PMS2 | |||
| Positive | 22 (100) | 20 (95) | 20 (95) |
| Negative | 0 | 1 (5) | 1 (5) |
| MSH6 | |||
| Positive | 21 (95) | 14 (67) | 14 (67) |
| Negative | 1 (5) | 7 (33) | 7 (33) |
Abbreviation: L1CAM, L1 cell adhesion molecule.
Not assessable in two cases.
3.2. Molecular patterns
Of 43 patients, 8 were excluded for analyses due to either poor quality DNA and/or failed sequencing, leaving 35 patients for analysis. In one patient with mixed uterine CCC/serous carcinoma, a POLE hotspot mutation (c.857C>G) was found (both components could not be separately extracted, Table 3). Within the pure uterine CCCs, one patient had a tumor with MSI (5%), while nine patients (43%) with mixed uterine CCC (p = 0.004) showed MSI. In seven patients (41%) with pure uterine CCC, a TP53 mutation was found, which was also the case for the mixed uterine CCCs (39%). Within the TP53 mutated cases, MSI was present in two tumors (both mixed uterine CCCs). The single POLE mutated (mixed) uterine CCC in addition harbored a TP53 mutation. Other mutation frequencies did not differ significantly between pure and mixed CCCs (Table 3).
TABLE 3.
Molecular patterns of pure and mixed clear cell carcinomas.
| Pure CC | Mixed | p‐Value | |
|---|---|---|---|
| AKT | 1.000 | ||
| Wildtype | 16 (94) | 17 (94) | |
| Mutated | 1 (6) | 1 (6) | |
| ARID1A | 0.318 | ||
| Wildtype | 10 (59) | 7 (39) | |
| Mutated | 7 (41) | 11 (61) | |
| CTNNB1 | 1.000 | ||
| Wildtype | 16 (94) | 17 (94) | |
| Mutated | 1 (6) | 1 (6) | |
| ERBB2 | 1.000 | ||
| Wildtype | 15 (88) | 16 (89) | |
| Mutated | 2 (12) | 2 (11) | |
| KRAS | |||
| Wildtype | 17 (100) | 16 (89) | 0.486 |
| Mutated | 0 | 2 (11) | |
| MTOR | 0.229 | ||
| Wildtype | 17 (100) | 15 (83) | |
| Mutated | 0 | 3 (17) | |
| NRAS | 1.000 | ||
| Wildtype | 16 (94) | 17 (94) | |
| Mutated | 1 (6) | 1 (6) | |
| PIK3CA | 0.289 | ||
| Wildtype | 13 (77) | 10 (56) | |
| Mutated | 4 (24) | 8 (44) | |
| Polymerase‐ε (POLE) | 1.000 | ||
| Wildtype | 17 (100) | 17 (94) | |
| Mutated | 0 | 1 (6) | |
| PTEN | |||
| Wildtype | 14 (82) | 9 (50) | 0.075 |
| Mutated | 3 (18) | 9 (50) | |
| TP53 | 1.000 | ||
| Wildtype | 10 (59) | 11 (61) | |
| Mutated | 7 (41) | 7 (39) | |
| MSI | 0.004 | ||
| No | 21 (96) | 12 (57) | |
| Yes | 1 (5) | 9 (43) | |
| Molecular subgroup | 0.013 | ||
| POLE mutated | 0 | 1 (6) | |
| MSI | 1 (6) | 9 (50) | |
| TP53 wildtype | 10 (56) | 4 (22) | |
| TP53 mutated | 7 (39) | 4 (22) |
Within the whole study group, the following molecular subgroups were identified: POLE mutated in 1 patient (3%); MSI in 10 patients (28%); TP53 wildtype in 14 patients (39%); and TP53 mutated in 11 patients (31%). Analyzing pure and mixed uterine CCCs separately, the POLE mutated subgroup was found in respectively 0% and 6% of patients; the MSI subgroup in 6% and 50%; the TP53 wildtype subgroup in 56% and 22%; and the TP53 mutated subgroup in 39% and 22%, respectively (p = 0.013, Table 3).
In 10 patients with mixed uterine CCC, both components could be sequenced separately (Figure 1). In eight patients, at least one shared mutation was found (Appendix C). A total of 13 mutations were found in both components (three ARID1A; one ERRB2; three PIK3CA; three PTEN; three TP53). A total of 26 mutations were only found in one of the components and can be seen as unique variants (one AKT1; twelve ARID1A; one MTOR; one NRAS; five PIK3CA; four PTEN; two TP53). Excluding patients with POLE mutated and MSI tumors, six mutations were found in both components, and only four mutations were only found in one of the components.
FIGURE 1.
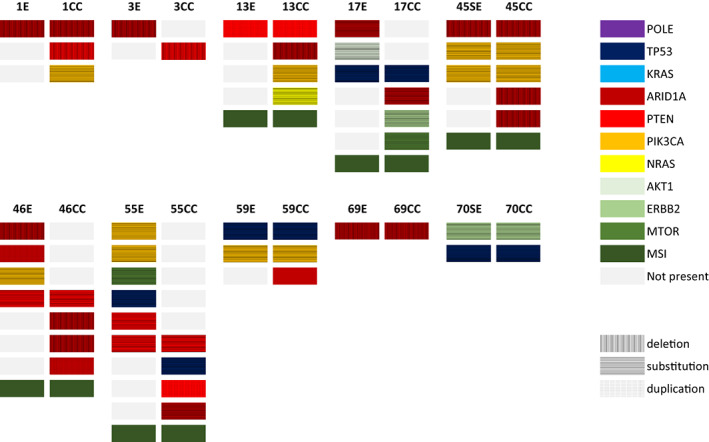
Display of all next‐generation sequencing derived mutated genes in 10 cases with mixed uterine clear cell carcinomas in which both component were sequenced separately. The colors indicate specific genes (see legend). CC, clear cell; E, endometrioid; SE, serous. MSI, microsatellite instable.
3.3. Immunohistochemical staining patterns
In Table 2, IHC staining patterns are shown. The clear cell component in mixed uterine CCC was ER positive in 52% of patients, compared to 24% in pure uterine CCCs (p = 0.111). PR was positive in 29% of mixed uterine CCCs, compared to 5% in pure uterine CCCs (p = 0.046), while L1CAM was positive in 71% compared to 77% in mixed versus pure uterine CCCs, respectively (p = 0.736). Within the endometrioid/serous component, loss of hormone receptors and L1CAM positivity was seen less frequently: ER positivity in 100%; PR positivity in 84%; L1CAM positivity in 24%. PMS2 staining was deficient in one case. Loss of MSH6 was present in 29% of mixed CCC, compared to 5% in pure uterine CCCs (p = 0.046). In case of mixed uterine CCCs, MSH6 and PMS2 expression was concordant in both components. MMR IHC and MSI results were concordant in all cases, except for one patient with a mixed uterine CCC showing MSI but intact IHC expression of both MSH6 and PMS2.
3.4. Outcome
Figure 2A shows that patients with mixed uterine CCC had a superior OS compared to patients with pure uterine CCC (log‐rank test: p = 0.029), which is also the case for DSS and PFS (Appendix D, p = 0.045 and 0.034, respectively). As can be appreciated from Figure 2B, OS was inferior in the TP53 mutated subgroup (log‐rank test: p = 0.003) whereas patients with POLE mutations and MSI showed very favorable outcome. DSS and PFS were inferior in the TP53 mutated subgroup as well (Appendix D, p = 0.001 and 0.022). Remarkably, patients with negative L1CAM had a superior OS (p = 0.035, Figure 2C), as well as a superior DSS and PFS (Appendix D, p = 0.044 and 0.035). In univariable Cox regression analysis, histology and the molecular subgroups were correlated with OS, DSS, and PFS (Table 4). In multivariable Cox regression analysis, however, histology was not correlated with outcome, whereas molecular subgroups were correlated with OS and DSS.
FIGURE 2.
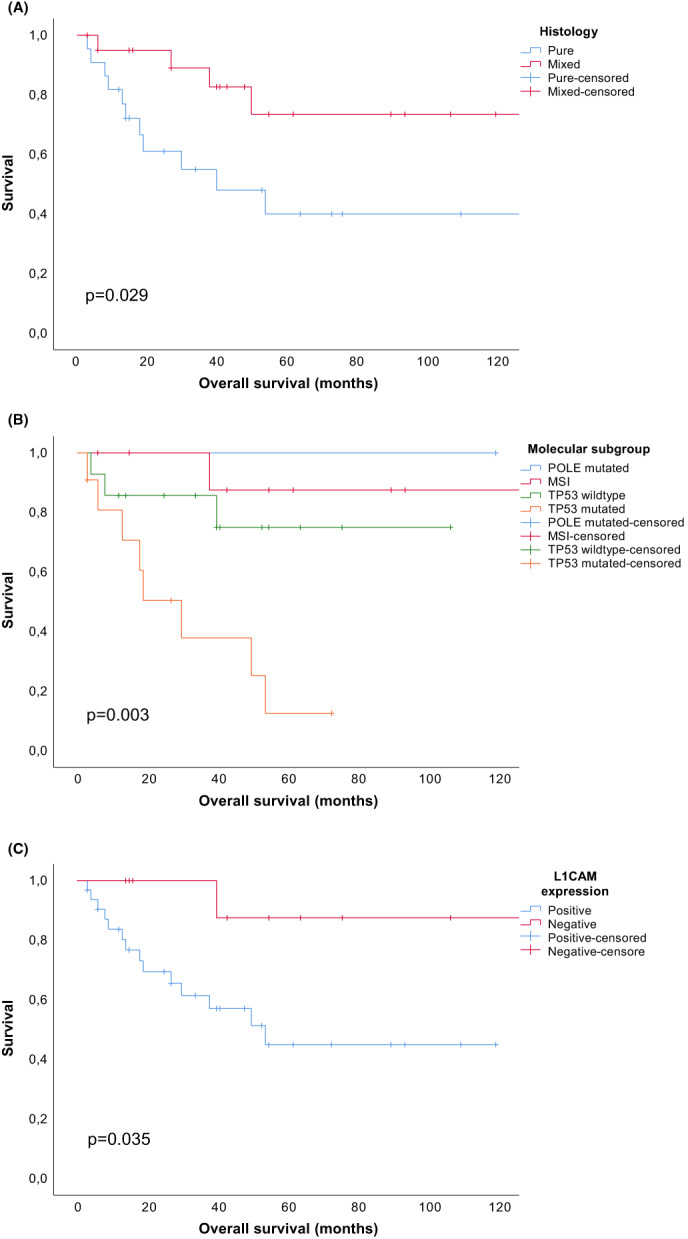
Kaplan–Meier curves displaying overall survival according to histology (A), molecular subgroup (B), and L1 cell adhesion molecule expression (C).
TABLE 4.
Overall survival (OS) by histology in univariable and multivariable Cox regression analysis.
| Univariable | Multivariable | |||
|---|---|---|---|---|
| HR (95% CI) | p‐Value | HR (95% CI) | p‐Value | |
| Overall survival | ||||
| Histology | ||||
| Pure | ||||
| Mixed | 0.30 (0.10–0.94) | 0.04 | 0.69 (0.15–3.18) | 0.64 |
| Age | 1.02 (0.96–1.08) | 0.60 | – | |
| International Federation of Gynecology and Obstetrics (FIGO) | ||||
| I/II | ||||
| III/IV | 5.3 (1.66–16.8) | 0.01 | 2.39 (0.62–9.19) | 0.21 |
| The Cancer Genome Atlas (TCGA) | ||||
| TP53 wildtype | ||||
| Polymerase‐ε (POLE) mutated | No events | – | No events | – |
| MSI | 0.37 (0.04–3.55) | 0.39 | 0.61 (0.05–6.79) | 0.69 |
| TP53 mutated | 4.69 (1.24–17.8) | 0.02 | 3.94 (1.00–15.6) | 0.05 |
| Disease‐specific survival | ||||
| Histology | ||||
| Pure | ||||
| Mixed | 0.32 (0.10–1.04) | 0.06 | 1.05 (0.20–5.60) | 0.95 |
| Age | 1.00 (0.94–1.07) | 0.91 | – | |
| FIGO | ||||
| I/II | ||||
| III/IV | 7.23 (1.99–26.3) | 0.01 | 3.84 (0.83–17.8) | 0.09 |
| TCGA | ||||
| TP53 wildtype | ||||
| POLE mutated | No events | – | No events | |
| MSI | 0.54 (0.05–6.00) | 0.62 | 0.93 (0.07–11.8) | 0.95 |
| TP53 mutated | 7.15 (1.51–33.9) | 0.01 | 6.50 (1.24–34.2) | 0.03 |
| Progression‐free survival | ||||
| Histology | ||||
| Pure | ||||
| Mixed | 0.31 (0.10–0.99) | 0.05 | 0.59 (0.14–2.56) | 0.49 |
| Age | 0.96 (0.91–1.02) | 0.22 | – | |
| FIGO | ||||
| I/II | ||||
| III/IV | 8.58 (2.39–30.8) | 0.01 | 4.92 (1.06–22.9) | 0.04 |
| TCGA | ||||
| TP53 wildtype | ||||
| POLE mutated | No events | – | No events | – |
| MSI | 0.32 (0.04–2.89) | 0.31 | 0.98 (0.08–11.9) | 0.99 |
| TP53 mutated | 3.29 (0.95–11.5) | 0.06 | 2.93 (0.80–10.7) | 0.10 |
Abbreviations: CI, confidence interval; HR, hazard ratio.
4. DISCUSSION
The primary aim of this study was to identify and compare the molecular and IHC background of pure and mixed uterine CCC in association with clinical outcome. Interestingly, all TCGA subgroups were observed within this cohort, in line with previous findings showing that uterine CCCs are molecularly heterogeneous. 19 Only one mixed uterine CCC with a POLE mutation was found with an excellent outcome. In pure uterine CCCs, no POLE mutations were found, in line with a previous study by Hoang et al. 19 DeLair et al. however, comprehensively sequenced a cohort of 32 pure CCCs and did find two patients with pathogenic POLE mutations. 18 Interestingly, in our study, mixed uterine CCCs were found to be MSI frequently, whereas pure uterine CCCs were mainly microsatellite stable. DeLair et al. found MMRd in 19%, whereas Hoang et al. found MSI in none of the evaluated tumors.
The secondary aim was to evaluate whether histological classification, molecular and IHC features affect clinical outcome. In KM analysis, outcome was correlated to histology, molecular subgroups, and L1CAM status. In multivariable Cox regression analysis, molecular status was correlated to OS and DSS, whereas histology was not. These results may suggest that differences in outcome between pure and mixed uterine CCCs may rather be explained by distinct molecular background. TP53 mutations were found more often in pure uterine CCC, which could be contributive to their dismal prognosis. 19 , 27 POLE mutations and MSI, associated with improved outcome, were on the contrary observed in mixed uterine CCCs more frequently.
Previously, it was shown that mixed uterine CCCs harbor a superior prognosis compared to pure uterine CCCs. 20 Also in serous ECs, it is known that mixed serous ECs harbor a superior prognosis compared to pure serous ECs. 12 In this previous study, however, it was not investigated whether differences in prognosis could be explained by molecular signatures.
The oncogenesis of mixed tumors has not been fully elucidated. In 10 patients with mixed uterine CCCs, we sequenced both histological components separately and found that eight tumors harbored at least one shared mutation in both components. Also, in nine tumors “non‐shared” mutations were found, most frequently ARID1A mutations. Most “non‐shared” mutations were found in patients with POLE mutated or MSI tumors. A previous study has shown that both components in mixed CCCs harbored shared mutations, but also showed significant molecular heterogeneity and non‐shared mutations. 28 These data are indicative that both components may evolve from a single clone but diverge along the way by obtaining new and unique mutations. POLE mutated and MSI tumors are considered as ultra/hypermutated tumors due to the acquirement of an extremely high burden of secondary mutations due to deficient DNA repair mechanisms. 13 Even though the number of patients was limited, the observation that POLE mutations and MSI were seen almost exclusively in mixed tumors could indicate that these tumors actually have a high burden of secondary acquired (shared and non‐shared) mutations that lead to morphological divergence, dedifferentiation and the presence of different histological components.
A recent meta‐analysis included 136 uterine CCCs (114 pure and 22 mixed) and found similar rates of molecular subgroups: 4% POLE mutated, 11% MSI, 50% TP53 wildtype, and 35% TP53 mutated in pure CCCs. 29 In mixed CCCs, no POLE mutations were found, whereas 59% was MSI, and only 18% was TP53 mutated. In our study, similar rates of TP53 mutated tumors were found (39% and 22%, respectively), as well as frequent MSI in mixed uterine CCCs (50%). This meta‐analysis also showed a favorable outcome in POLE mutated and MSI tumors, which supports recent recommendations by the European Society of Gynecological Oncology, European Society for Radiotherapy and Oncology and the European Society of Pathology, encouraging molecular classification in all ECs, especially high‐grade tumors. 10 In the present study, we have analyzed IHC patterns within both components. In case of loss of one of the MMR proteins, absence of the protein was always seen in both components. In contrast, loss of ER and/or PR, and L1CAM positivity was discrepant in most cases, and was seen more often in the CCC component. These findings suggest that loss of hormone receptors as well as L1CAM expression is obtained in a more advanced stage within tumor progression. Compared to literature, showing ER expression in 0%–16% of uterine CCC cases, we found a somewhat higher prevalence (24%) in pure uterine CCCs, even though ER was only focally positive in 4/5 cases. 17 , 30 , 31 PR expression was found in only 1 patient (5%), which is in line with literature. In mixed uterine CCCs, frequency of ER and PR expression was surprisingly high in the clear cell components of mixed uterine CCCs (52% and 29%). Previous papers have shown that mixed CCCs can display unexpected IHC staining patterns, including (patchy) ER/PR expression, which may be attributed to the fact that these tumors arise from a single clone and subsequently diverge. 28 , 32
As a potential target for HER2 directed antibody therapy, ERBB2 mutations could be of interested for uterine CCCs. A pathogenic ERBB2 mutation was found in four cases (12%), which is in line with literature showing ERBB2 mutations in 11% of patients. 18
In our study, L1CAM expression was frequent and associated with impaired survival. Two previous studies did not find a correlation between L1CAM expression and impaired survival, possibly due to a limited sample size. 16 , 33 L1CAM is a transmembrane protein that is involved in increasing invasiveness, motility and metastatic potential, and has been found to be a poor prognostic factor in several cancers. 34 , 35 More recently, L1CAM positivity was found to be associated with resistance to platinum‐based chemotherapy in high‐risk EC. 36 The number of CCCs in that study was limited underlining the need for studies investigating the association between L1CAM expression and therapy responsiveness within this particular subgroup.
We have performed a comprehensive molecular, IHC, and clinical analyses in a series of both pure and mixed uterine CCCs. However, there are some limitations. Due to the rare nature of these tumors, the number of patients within this series was limited. Also, because of the retrospective nature of the study and the use of FFPE tumor tissue, quality of the extracted DNA was variable, and DNA sequencing was unsuccessful in some cases. Of the 21 mixed uterine CCCs, it was possible to extract the DNA of both histological components separately in 10 cases. In the other cases, both histological components merged into one another and could not be isolated separately.
Concluding, we observed different molecular background between pure and mixed uterine CCCs. TP53 mutations were found more frequently in patients with pure CCCs, and MSI was found more frequently in mixed uterine CCCs. An improved clinical outcome was found in patients with mixed uterine CCCs, compared to patients with pure uterine CCCs. Inferior outcome in pure CCCs may be explained by frequent TP53 mutations, whereas superior outcome in mixed CCCs may be explained by frequent occurrence of MSI. These results underline the relevance of both morphological and molecular evaluation, and may assist in tailoring treatment.
AUTHOR CONTRIBUTIONS
Casper Reijnen: Conceptualization (equal); data curation (equal); formal analysis (equal); investigation (equal); visualization (equal); writing – original draft (equal); writing – review and editing (equal). Stéphanie W Vrede: Data curation (equal); formal analysis (equal); investigation (equal); methodology (equal); writing – original draft (equal); writing – review and editing (equal). Astrid Eijkelenboom: Formal analysis (equal); investigation (equal); methodology (equal); supervision (equal); validation (equal). Ruud Draak: Conceptualization (equal); data curation (equal); formal analysis (equal); funding acquisition (equal); investigation (equal); writing – original draft (equal). Sanne Sweegers: Data curation (equal); formal analysis (equal); investigation (equal); methodology (equal); validation (equal); writing – original draft (equal); writing – review and editing (equal). Marc PLM Snijders: Conceptualization (equal); funding acquisition (equal); investigation (equal); methodology (equal); writing – original draft (equal); writing – review and editing (equal). Puck van Gestel: Conceptualization (equal); data curation (equal); formal analysis (equal); investigation (equal); methodology (equal); project administration (equal); writing – original draft (equal); writing – review and editing (equal). Johanna MA Pijnenborg: Conceptualization (equal); formal analysis (equal); funding acquisition (equal); investigation (equal); methodology (equal); supervision (equal); visualization (equal); writing – original draft (equal); writing – review and editing (equal). Johan Bulten: Conceptualization (equal); formal analysis (equal); investigation (equal); methodology (equal); resources (equal); supervision (equal); writing – original draft (equal); writing – review and editing (equal). Heidi VN Küsters‐Vandevelde: Conceptualization (equal); data curation (equal); formal analysis (equal); funding acquisition (equal); investigation (equal); supervision (equal); validation (equal); visualization (equal); writing – original draft (equal); writing – review and editing (equal).
FUNDING INFORMATION
Canisius‐Wilhelmina Hospital Scientific Fund 2021.
CONFLICT OF INTEREST STATEMENT
None declared.
ETHICS STATEMENT
This study was performed in accordance with the Declaration of Helsinki. The study was approved by the Medical Ethics Committee of the Radboud University Medical Center (number 2018‐4023) and performed according to the Code for Proper Secondary Use of Human Tissue (Dutch Federation of Biomedical Scientific Societies, http://www.federa.org).
CONSENT FOR PUBLICATION
Not applicable.
Supporting information
Appendix S1
ACKNOWLEDGMENT
None.
Reijnen C, Vrede SW, Eijkelenboom A, et al. Pure and mixed clear cell carcinoma of the endometrium: A molecular and immunohistochemical analysis study. Cancer Med. 2023;12:12365‐12376. doi: 10.1002/cam4.5937
DATA AVAILABILITY STATEMENT
The datasets used and/or analyzed during the current study are available from the corresponding author on reasonable request.
REFERENCES
- 1. Ferlay J, Colombet M, Soerjomataram I, et al. Cancer incidence and mortality patterns in Europe: estimates for 40 countries and 25 major cancers in 2018. Eur J Cancer. 2018;103:356‐387. [DOI] [PubMed] [Google Scholar]
- 2. Amant F, Moerman P, Neven P, Timmerman D, Van Limbergen E, Vergote I. Endometrial cancer. Lancet. 2005;366(9484):491‐505. [DOI] [PubMed] [Google Scholar]
- 3. Hamilton CA, Cheung MK, Osann K, et al. Uterine papillary serous and clear cell carcinomas predict for poorer survival compared to grade 3 endometrioid corpus cancers. Br J Cancer. 2006;94(5):642‐646. [DOI] [PMC free article] [PubMed] [Google Scholar]
- 4. Hasegawa K, Nagao S, Yasuda M, et al. Gynecologic Cancer InterGroup (GCIG) consensus review for clear cell carcinoma of the uterine corpus and cervix. Int J Gynecol Cancer. 2014;24(9 Suppl 3):S90‐S95. [DOI] [PubMed] [Google Scholar]
- 5. Fadare O, Zheng W, Crispens MA, et al. Morphologic and other clinicopathologic features of endometrial clear cell carcinoma: a comprehensive analysis of 50 rigorously classified cases. Am J Cancer Res. 2013;3(1):70‐95. [PMC free article] [PubMed] [Google Scholar]
- 6. Scarfone G, Secomandi R, Parazzini F, et al. Clear cell and papillary serous endometrial carcinomas: survival in a series of 128 cases. Arch Gynecol Obstet. 2013;287(2):351‐356. [DOI] [PubMed] [Google Scholar]
- 7. Abdulfatah E, Sakr S, Thomas S, et al. Clear cell carcinoma of the endometrium: evaluation of prognostic parameters in a multi‐institutional cohort of 165 cases. Int J Gynecol Cancer. 2017;27(8):1714‐1721. [DOI] [PMC free article] [PubMed] [Google Scholar]
- 8. Cetinkaya N, Selcuk I, Ozdal B, Meydanli MM, Gungor T. Prognostic factors in endometrial clear cell carcinoma. Arch Gynecol Obstet. 2017;295(1):189‐195. [DOI] [PubMed] [Google Scholar]
- 9. Olawaiye AB, Boruta DM. Management of women with clear cell endometrial cancer: a Society of Gynecologic Oncology (SGO) review. Gynecol Oncol. 2009;113(2):277‐283. [DOI] [PubMed] [Google Scholar]
- 10. Concin N, Matias‐Guiu X, Vergote I, et al. ESGO/ESTRO/ESP guidelines for the management of patients with endometrial carcinoma. Int J Gynecol Cancer. 2021;31(1):12‐39. [DOI] [PubMed] [Google Scholar]
- 11. Zaino R, Carinelli S, Ellenson L. World Health Organization Classification of Tumours of Female Reproductive Organs. IARC Press; 2020. [Google Scholar]
- 12. Roelofsen T, van Ham MA, Wiersma van Tilburg JM, et al. Pure compared with mixed serous endometrial carcinoma: two different entities? Obstet Gynecol. 2012;120(6):1371‐1381. [DOI] [PubMed] [Google Scholar]
- 13. Cancer Genome Atlas Research N , Kandoth C, Schultz N, et al. Integrated genomic characterization of endometrial carcinoma. Nature. 2013;497(7447):67‐73. [DOI] [PMC free article] [PubMed] [Google Scholar]
- 14. Talhouk A, McConechy MK, Leung S, et al. A clinically applicable molecular‐based classification for endometrial cancers. Br J Cancer. 2015;113(2):299‐310. [DOI] [PMC free article] [PubMed] [Google Scholar]
- 15. Kommoss S, McConechy MK, Kommoss F, et al. Final validation of the ProMisE molecular classifier for endometrial carcinoma in a large population‐based case series. Ann Oncol. 2018;29(5):1180‐1188. [DOI] [PubMed] [Google Scholar]
- 16. Kim SR, Cloutier BT, Leung S, et al. Molecular subtypes of clear cell carcinoma of the endometrium: opportunities for prognostic and predictive stratification. Gynecol Oncol. 2020;158(1):3‐11. [DOI] [PubMed] [Google Scholar]
- 17. Zannoni GF, Santoro A, Angelico G, et al. Clear cell carcinoma of the endometrium: an immunohistochemical and molecular analysis of 45 cases. Hum Pathol. 2019;92:10‐17. [DOI] [PubMed] [Google Scholar]
- 18. DeLair DF, Burke KA, Selenica P, et al. The genetic landscape of endometrial clear cell carcinomas. J Pathol. 2017;243(2):230‐241. [DOI] [PMC free article] [PubMed] [Google Scholar]
- 19. Hoang LN, McConechy MK, Meng B, et al. Targeted mutation analysis of endometrial clear cell carcinoma. Histopathology. 2015;66(5):664‐674. [DOI] [PubMed] [Google Scholar]
- 20. Baniak N, Fadare O, Kobel M, et al. Targeted molecular and immunohistochemical analyses of endometrial clear cell carcinoma show that POLE mutations and DNA mismatch repair protein deficiencies are uncommon. Am J Surg Pathol. 2019;43(4):531‐537. [DOI] [PubMed] [Google Scholar]
- 21. Casparie M, Tiebosch AT, Burger G, et al. Pathology databanking and biobanking in The Netherlands, a central role for PALGA, the nationwide histopathology and cytopathology data network and archive. Cell Oncol. 2007;29(1):19‐24. [DOI] [PMC free article] [PubMed] [Google Scholar]
- 22. Pecorelli S. Revised FIGO staging for carcinoma of the vulva, cervix, and endometrium. Int J Gynaecol Obstet. 2009;105(2):103‐104. [DOI] [PubMed] [Google Scholar]
- 23. Eijkelenboom A, Kamping EJ, Kastner‐van Raaij AW, et al. Reliable next‐generation sequencing of formalin‐fixed, paraffin‐embedded tissue using single molecule tags. J Mol Diagn. 2016;18(6):851‐863. [DOI] [PubMed] [Google Scholar]
- 24. Richards S, Aziz N, Bale S, et al. Standards and guidelines for the interpretation of sequence variants: a joint consensus recommendation of the American College of Medical Genetics and Genomics and the Association for Molecular Pathology. Genet Med. 2015;17(5):405‐424. [DOI] [PMC free article] [PubMed] [Google Scholar]
- 25. Leon‐Castillo A, Britton H, McConechy MK, et al. Interpretation of somatic POLE mutations in endometrial carcinoma. J Pathol. 2020;250(3):323‐335. [DOI] [PMC free article] [PubMed] [Google Scholar]
- 26. Singh N, Piskorz AM, Bosse T, et al. p53 immunohistochemistry is an accurate surrogate for TP53 mutational analysis in endometrial carcinoma biopsies. J Pathol. 2020;250(3):336‐345. [DOI] [PubMed] [Google Scholar]
- 27. Murali R, Davidson B, Fadare O, et al. High‐grade endometrial carcinomas: morphologic and immunohistochemical features, diagnostic challenges and recommendations. Int J Gynecol Pathol. 2019;38(Suppl 1):S40‐S63. [DOI] [PMC free article] [PubMed] [Google Scholar]
- 28. Matrai C, Motanagh S, Mirabelli S, et al. Molecular profiles of mixed endometrial carcinoma. Am J Surg Pathol. 2020;44(8):1104‐1111. [DOI] [PubMed] [Google Scholar]
- 29. Travaglino A, Raffone A, Santoro A, et al. Clear cell endometrial carcinomas with mismatch repair deficiency have a favorable prognosis: a systematic review and meta‐analysis. Gynecol Oncol. 2021;162(3):804‐808. [DOI] [PubMed] [Google Scholar]
- 30. Lim D, Ip PP, Cheung AN, Kiyokawa T, Oliva E. Immunohistochemical comparison of ovarian and uterine endometrioid carcinoma, endometrioid carcinoma with clear cell change, and clear cell carcinoma. Am J Surg Pathol. 2015;39(8):1061‐1069. [DOI] [PubMed] [Google Scholar]
- 31. Lax SF, Pizer ES, Ronnett BM, Kurman RJ. Clear cell carcinoma of the endometrium is characterized by a distinctive profile of p53, Ki‐67, estrogen, and progesterone receptor expression. Hum Pathol. 1998;29(6):551‐558. [DOI] [PubMed] [Google Scholar]
- 32. Matrai CE, Pirog EC, Ellenson LH. Despite diagnostic morphology, many mixed endometrial carcinomas show unexpected immunohistochemical staining patterns. Int J Gynecol Pathol. 2018;37(5):405‐413. [DOI] [PubMed] [Google Scholar]
- 33. Fadare O, Roma AA, Desouki MM, et al. The significance of L1CAM expression in clear cell carcinoma of the endometrium. Histopathology. 2018;72(3):532‐538. [DOI] [PubMed] [Google Scholar]
- 34. Maten MV, Reijnen C, Pijnenborg JMA, Zegers MM. L1 cell adhesion molecule in cancer, a systematic review on domain‐specific functions. Int J Mol Sci. 2019;20(17):4180. [DOI] [PMC free article] [PubMed] [Google Scholar]
- 35. van der Putten LJ, Visser NC, van de Vijver K, et al. L1CAM expression in endometrial carcinomas: an ENITEC collaboration study. Br J Cancer. 2016;115(6):716‐724. [DOI] [PMC free article] [PubMed] [Google Scholar]
- 36. Romani C, Capoferri D, Reijnen C, et al. L1CAM expression as a predictor of platinum response in high‐risk endometrial carcinoma. Int J Cancer. 2022;151:637‐648. [DOI] [PMC free article] [PubMed] [Google Scholar]
Associated Data
This section collects any data citations, data availability statements, or supplementary materials included in this article.
Supplementary Materials
Appendix S1
Data Availability Statement
The datasets used and/or analyzed during the current study are available from the corresponding author on reasonable request.