

Abstract
Significance Statement
In children with kidney failure, little is known about their treatment trajectories or the effects of kidney failure on lifetime survival and years of life lost, which are arguably more relevant measures for children. In this population-based cohort study of 2013 children who developed kidney failure in Australia and New Zealand, most children were either transplanted after initiating dialysis (74%) or had a preemptive kidney transplant (14%). Life expectancy increased with older age at kidney failure, but more life years were spent on dialysis than with a functioning transplant. The expected (compared with the general population) number of life years lost ranged from 16 to 32 years, with female patients and those who developed kidney failure at a younger age experiencing the greatest loss of life years.
Background
Of the consequences of kidney failure in childhood, those rated as most important by children and their caregivers are its effects on long-term survival. From a life course perspective, little is known about the experience of kidney failure treatment or long-term survival.
Methods
To determine expected years of life lost (YLL) and treatment trajectory for kidney failure in childhood, we conducted a population-based cohort study of all children aged 18 years or younger with treated kidney failure in Australia (1980–2019) and New Zealand (1988–2019).We used patient data from the CELESTIAL study, which linked the Australian and New Zealand Dialysis and Transplant registry with national death registers. We estimated standardized mortality ratios and used multistate modeling to understand treatment transitions and life expectancy.
Results
A total of 394 (20%) of 2013 individuals died over 30,082 person-years of follow-up (median follow-up, 13.1 years). Most children (74%) were transplanted after initiating dialysis; 14% (18% of male patients and 10% of female patients) underwent preemptive kidney transplantation. Excess deaths (compared with the general population) decreased dramatically from 1980 to 1999 (from 41 to 22 times expected) and declined more modestly (to 17 times expected) by 2019. Life expectancy increased with older age at kidney failure, but more life years were spent on dialysis than with a functioning transplant. The number of YLL ranged from 16 to 32 years, with the greatest loss among female patients and those who developed kidney failure at a younger age.
Conclusions
Children with kidney failure lose a substantial number of their potential life years. Female patients and those who develop kidney failure at younger ages experience the greatest burden.
Keywords: mortality, pediatric nephrology, pediatric kidney transplantation, kidney disease, survival, cohort studies, life expectancy, probability, sex difference
Introduction
Each year, 8–13 children per million population develop kidney failure in the United States, Australia, New Zealand, and Europe.1–3 They join the 60–100 per million in this age group who already have kidney failure, most of whom (>75%–80%) are being treated with a functioning transplant.1–3 The development of kidney failure in childhood has enormous health, financial, and quality of life implications.4–9 Of all the consequences of childhood kidney failure, survival and long-term health have been rated as the most important outcome by both children and their caregivers.10,11
Children with kidney failure typically have a lifetime treatment course that includes periods of dialysis punctuated by one or more kidney transplants. Although recent work has shown that children who develop kidney failure and receive a kidney transplant have excellent 5- and 10-year survival,12–14 there are little data on the lifetime survival. Quantification of years of life lost (YLL) would aid clinicians in their discussions with parents and caregivers about the future of a child with kidney failure. It would also assist policy makers who use expected length of life in conjunction with quality of life to support funding and policy decisions.
To better inform discussions with patients, their caregivers, and policy makers, our study aimed to explore mortality and YLL in children with kidney failure. Specifically, we aimed to (1) explore mortality rates and compare these with the matched general population, (2) quantify patient transitions between dialysis and transplant over time, and (3) estimate life expectancy to determine expected YLL from kidney failure in childhood.
Methods
Study Design and Setting
We used patient data from the CELESTIAL study. This is a binational population-based cohort study of all people with treated kidney failure in both Australia (1980–2019) and New Zealand (1988–2019) captured in the Australian and New Zealand Dialysis and Transplant Registry (ANZDATA) and subsequently linked to national death registers in 2015. ANZDATA has been described elsewhere.15 In brief, all dialysis and transplant centers in Australia and New Zealand provide prospective patient data as they occur in real time for serious health events and annually. These data include patient demographics (age, sex, and race/ethnicity from electronic health records), comorbidities, and kidney failure treatment data.
Australia and New Zealand are largely comparable in population demographics, universal health care systems, and mandatory reporting of all deaths, and their causes, to the country's Births, Deaths, and Marriages Register. Primary and secondary causes of death are classified using the International Statistical Classification of Diseases (ICD) by a clinician coder on the basis of information provided in the death certificate as given by the medical doctor. The ICD is used as an internationally accepted standard to record mortality data, in order that cross-population comparisons can be made. The Ninth Revision was used before 1997 in Australia and 2000 in New Zealand (ICD-9); thereafter, the Tenth Revision was used in both countries. All ICD-9 codes were forward mapped to ICD-10 codes using standard algorithms for the purposes of this study. In applying ICD to death events, the primary cause of death is defined as the disease or condition which initiated the series of events that lead to the death. Secondary causes of death are defined as all other diseases or conditions which contributed to the death.
Data Linkage
Patients in the CELESTIAL study were linked to national death registers in their respective countries, Australia or New Zealand, to determine the legal date and cause of death until 2013 in Australian patients and 2012 in New Zealand patients. In Australia, patients were matched to the National Death Index using probabilistic linkage by the Australian Institute of Health and Welfare (AIHW), matching on personal identifiers, such as date of birth, sex, and full name. In New Zealand, patients were matched to the Mortality Collection database by the New Zealand Ministry of Health, using deterministic linkage to patients' National Health Index number. National death registers typically have a lag of 2–3 calendar years before complete cause of death data are locked. At the time of linkage in 2015, the most recent death data available in national death Registers were 2013 in Australian patients and 2012 in New Zealand patients. Additional deaths, date of death, and follow-up for all patients until 2019 were provided from ANZDATA, which has been shown to have strong agreement (>96%) for fact of death and date of death with national death registers.16
Pediatric Population and Death Outcomes
In this study, our cohort included all incident kidney failure patients 18 years or younger who initiated RRT in Australia (January 1, 1980, to December 31, 2019) and New Zealand (January 1, 1988, to December 31, 2019). The transplant cohort was a subset of this population that included kidney failure patients who had one or more kidney transplants over their period of follow-up.
We considered deaths that were captured in the national death registers until 2013 in Australian patients and 2012 in New Zealand patients; thereafter, deaths were captured by ANZDATA. Time at risk was measured from the initiation of RRT for the kidney failure population or the earliest transplant date for the kidney transplant population, until the earliest of date of death, December 31, 2019 (Australia), or December 31, 2019 (New Zealand). Probabilistic linkage used for the Australian patients may result in a small proportion of incorrect links, typically 0.5%,17 or patients may have died overseas. As such, Australian patients were censored at the date of death recorded in ANZDATA if they had died, but the national death register had no recorded death.
Statistical Analyses
Patient demographics were summarized using absolute counts and percentages, by death status and overall. Relative socioeconomic disadvantage was based on postcode at the time of incident treated kidney failure and the Australian Bureau of Statistics Socioeconomic Index for Areas (SEIFA) for the most recent census year before incident treated kidney failure. We categorized relative socioeconomic disadvantage as most disadvantaged (deciles 1–3), middle (deciles 4–7), and least disadvantaged (deciles 8–10). Body mass index at the time of kidney failure was categorized into thinness, normal, overweight, and obese.18 Causes of death were categorized based on ICD-10 diagnosis codes for primary cause of death provided by national death registers only.
We calculated mortality rates by age group (<2 years, 2–5 years, 6–10 years, 11–14 years, and 15+ years), sex, time since kidney failure and since transplant (0–3 months, 3–6 months, and 6–12 months or <12 months and 1–2 years, 2–5 years, 5–10 years, and ≥15 years), and donor type for transplant population only (deceased donor versus living donor). We used Poisson regression to compare mortality rates in the transplant population between donor type and time since transplant. We estimated standardized mortality ratios (SMRs) using indirect standardization matching to general population on age, sex, calendar year, and nation, using publicly available data from the Australian Bureau of Statistics and the New Zealand Ministry of Health.
We used multistate modeling to understand the occurrence of deaths by allowing transitions between dialysis, transplant, and death. We used the Aalen-Johansen estimate19 to estimate the probability of being in one of seven states (Figure 1A) at given time t since kidney failure. We also used multistate models20 to estimate the total and marginal expected life years remaining overall and in two living states, dialysis, and transplant. In brief, we fitted a continuous time Markov model21 using age as the time scale and age and sex as covariates to estimate transition probabilities between three states: dialysis, transplant, and death (Figure 1B), derived using maximum likelihood. Follow-up time contributed to the dialysis state where patients were receiving dialysis, either before transplant or after graft failure, and transplant state where patients had a functioning kidney transplant. Life expectancies were thereafter derived using parameters from the transition probabilities and initial state distribution on the basis of a multinomial regression, assuming a maximum possible age of 100 years (a standard approach). These state-specific life expectancies are analogous to deriving mean survival from a standard survival model and have been described in detail elsewhere.20 Confidence intervals (CIs) for life expectancy were calculated by multiplying the standard deviation from 1000 simulations by 1.96. YLL were calculated as the difference between the total estimated life expectancy and the life expectancy given from the general population. To determine the equivalent life expectancy from the general population, the study population were matched to life tables from the general population by their age at kidney failure, calendar year of kidney failure, sex, and country.22,23 CIs for YLL were calculated as 1.96 multiplied by the standard deviation of the difference, given by the square root of the sum of the standard deviation of the total estimated life expectancy and the life expectancy from the general population.
Figure 1.

Transition states included in the multistate model. Schematic of states and their transitions included in the multistate model to (A) estimate probability in state and (B) estimate life years remaining. *Preemptive transplant transition from initial dialysis to first transplant after 1 day. ^Patients may enter the time at risk in either state.
We compared YLL for children diagnosed in 1980–1998 and 1999–2019 to understand any era effect. We first determined YLL for those diagnosed in 1980–1999 using the above described methods and then estimated the YLL in the 1999–2019 by assuming the YLL for the entire cohort was a weighted average of the two eras for the respective age in years and sex. We were unable to restrict the cohort to those diagnosed 1999–2019 as comparatively insufficient follow-up has elapsed to provide life expectancy predictions.
Data were analyzed using Stata version 15 (Stata Corporation, College Station, TX) and R version 3.6.2.
The CELESTIAL study has ethics approval from the University of Sydney (Project No. 2014/917) and the AIHW (Reference No. EO2015/3/181). Only deidentified patient data were made available to researchers.
Results
Pediatric Kidney Failure Cohort
There were 2013 children with incident kidney failure in Australia during 1980–2019 and New Zealand during 1988–2019. In this population, there were 394 deaths over the 30,082 person-years (pys) of follow-up with a median follow-up of 13.1 years (interquartile range [IQR], 5.9–23.0) (Table 1). Overall, 288 (14%) underwent preemptive kidney transplantation. Male patients were almost twice as likely as female patients to receive a preemptive living donor kidney transplant, with 204 (18%) males and 84 (10%) females undergoing preemptive living donor kidney transplant (P < 0.001) (Supplemental Table 1). A total of 1497 (74%) underwent kidney transplantation after a median 1.1 years on dialysis with no significant difference by sex (Supplemental Table 1). In total, 228 (11%) were never transplanted which comprised 109 (13%) female patients and 119 (10%) male patients (P = 0.09) (Supplemental Table 1).
Table 1.
Demographics of pediatric study population by death status and overall
| Characteristics | Alive n (%)a |
Deaths n (%)a |
Total n (%)a |
|---|---|---|---|
| Total, (%) | 1619 (80)b | 394 (20)b | 2013 (100)b |
| Age at RRT initiation (yr) | |||
| 0 to <2 | 151 (9) | 46 (12) | 197 (10) |
| 2–5 | 190 (12) | 30 (8) | 220 (11) |
| 6–10 | 319 (20) | 73 (19) | 392 (19) |
| 11–14 | 374 (23) | 79 (20) | 453 (23) |
| ≥15 | 585 (36) | 166 (42) | 751 (37) |
| Median (IQR) | 12 (7–16) | 13 (7–16) | 13 (7–16) |
| Postcode relative SEIFA disadvantage | |||
| Most disadvantaged | 351 (28) | 84 (41) | 435 (30) |
| Middle | 467 (38) | 76 (37) | 543 (38) |
| Least disadvantaged | 414 (34) | 47 (23) | 461 (32) |
| Postcode not reported | 352 (—) | 183 (—) | 535 (—) |
| Postcode SEIFA not reported | 35 (—) | 4 (—) | 39 (—) |
| Sex | |||
| Female | 667 (41) | 185 (47) | 852 (42) |
| Male | 952 (59) | 209 (53) | 1161 (58) |
| Year of kidney failure diagnosis | |||
| ≤1989 | 211 (13) | 179 (45) | 390 (19) |
| 1990–1999 | 374 (23) | 123 (31) | 497 (25) |
| 2000–2009 | 472 (29) | 65 (17) | 537 (27) |
| 2010–2019 | 562 (35) | 27 (7) | 589 (29) |
| Country | |||
| Australia | 1347 (83) | 333 (85) | 1680 (83) |
| New Zealand | 272 (17) | 61 (15) | 333 (17) |
| Race and ethnicity | |||
| Aboriginal and Torres Strait Islander | 55 (3) | 26 (7) | 81 (4) |
| African and middle east | 73 (5) | 7 (2) | 80 (4) |
| Asian | 139 (9) | 17 (4) | 156 (8) |
| European | 1098 (68) | 305 (77) | 1403 (70) |
| Maori and Pasifika | 132 (8) | 39 (10) | 171 (8) |
| Other | 122 (8) | 0 (0) | 122 (6) |
| BMIc | |||
| Thinness | 254 (17) | 73 (24) | 327 (18) |
| Normal | 919 (61) | 167 (55) | 1086 (60) |
| Overweight | 223 (15) | 46 (15) | 269 (15) |
| Obese | 120 (8) | 15 (5) | 135 (7) |
| Not collected | 103 (—) | 93 (—) | 196 (—) |
| Cause of kidney failure | |||
| CAKUT | 644 (40) | 136 (35) | 780 (39) |
| Glomerulonephritis | 551 (34) | 133 (34) | 684 (34) |
| Cystic kidney diseases | 167 (10) | 41 (10) | 208 (10) |
| Other | 257 (16) | 84 (21) | 341 (17) |
| Preemptive transplantation | 266 (16) | 22 (6) | 288 (14) |
| Transplanted after dialysis initiation | 1241 (77) | 256 (65) | 1497 (74) |
| Never transplanted | 112 (7) | 116 (29) | 228 (11) |
IQR, interquartile range; SEIFA, socioeconomic index for areas; BMI, body mass index; CAKUT, congenital anomalies of the kidney and urinary tract.
aColumn percentages.
bRow percentages.
cBody mass index was categorized into thinness, normal, overweight, and obese based on existing criterion defined by age and sex.18
Most of the study population were older than 10 years at kidney failure diagnosis (61%), male (58%), from Australia (83%), of European racial background (70%), and had similar levels of socioeconomic disadvantage to the general population (Table 1). The most common cause of kidney failure was congenital anomalies of the kidney and urinary tract (CAKUT) (39%), followed by glomerulonephritis (34%), cystic kidney diseases (10%), and other causes (17%) (Table 1). Male patients were more likely to have CAKUT as their cause of kidney failure, while women were more likely to have glomerulonephritis and cystic kidney disease (Supplemental Table 2).
Mortality Rates
Mortality rates were highest and most variable in the younger age groups, with little difference by sex. For our cohort, whole mortality rates were 12.2/1000 pys (95% CI, 10.6 to 14.0/1000 pys) in male patients and 14.3/1000 pys (95% CI, 12.4 to 16.5/1000 pys) in female patients, but this varied by age (Table 2A, Figure 2A).
Table 2.
Mortality rates per 1000 person-years (with 95% confidence interval) by (A) age and sex, (B) time since kidney failure, and (C) time since kidney transplantation
| (A) Age and Sex | ||||
|---|---|---|---|---|
| Age at KRT Initiation (Years) | Female | Male | ||
| Mortality Rate Per 1000 pys | (95% CI) Per 1000 pys | Mortality Rate Per 1000 pys | (95% CI) Per 1000 pys | |
| Total Age at KRT initiation (yr) |
||||
| 0–1 | 14.2 | (12.4 to 16.5) | 12.2 | (10.6 to 14.0) |
| 2–5 | 149.6 | (84.9 to 263.4) | 85.5 | (52.4 to 139.5) |
| 6–10 | 19.5 | (9.3 to 40.8) | 18.6 | (10.8 to 32.0) |
| 11–14 | 3.8 | (1.6 to 9.1) | 6.5 | (3.6 to 11.7) |
| ≥15 | 14.5 | (12.4 to 17.0) | 12.0 | (10.3 to 14.0) |
| (B) Time Since Kidney Failure | ||
|---|---|---|
| Time Since Kidney Failure | Mortality Rate per 1000 pys | (95% CI) Per 1000 pys |
| 3–6 mo | 34.5 | (21.4 to 55.5) |
| 1–2 yr | 20.5 | (14.9 to 28.2) |
| 5–10 yr | 9.2 | (7.2 to 11.8) |
| ≥15 yr | 14.6 | (12.3 to 17.3) |
| (C) Time Since Kidney Transplantation | ||
|---|---|---|
| Time Since Kidney Transplantation | Mortality Rate Per 1000 pys | (95% CI) Per 1000 pys |
| 0–3 mo | 27.1 | (15.4 to 47.7) |
| 1–2 yr | 5.4 | (2.8 to 10.4) |
| ≥15 yr | 14.8 | (12.3 to 17.3) |
CI, confidence interval.
Figure 2.
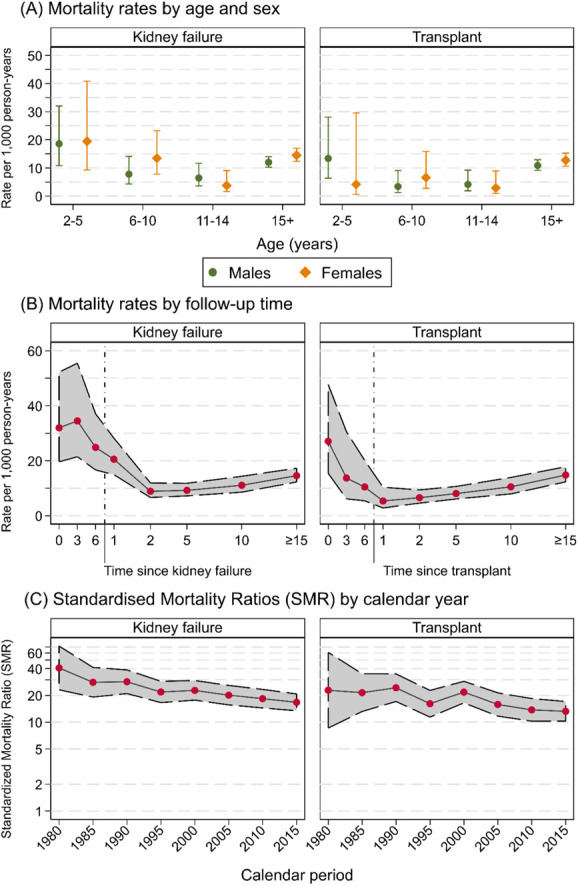
Transition states included in the multistate model. Estimates since kidney failure diagnosis (left panel) and kidney transplant (right panel) of (A) mortality rates per 1000 person-years (with 95% CI) by age and sex, (B) mortality rates per 1000 person-years (with 95% CI) by time since follow-up, and (C) SMR on log scale (with 95% CI) by calendar year. Figure 2 can be viewed in color online at www.jasn.org.
Mortality rates were highest in the first 3–6 months after kidney failure at 34.5/1000 pys (95% CI, 21.4 to 55.5/1000 pys). Mortality rates then declined to a nadir of 9.2/1000 pys (95% CI, 7.2 to 11.8/1000 pys) at 5–10 years, before increasing to 14.6/1000 pys (95% CI, 12.3 to 17.3) at ≥15 years postkidney failure (Table 2B, Figure 2B). For those who were transplanted, the trends in mortality rates were similar to the complete kidney failure cohort. Mortality was highest at 0–3 months post-transplant, with rates of 27.1/1000 pys (95% CI, 15.4 to 47.7/1000 pys). Mortality rates then declined to 5.4/1000 pys (95% CI, 2.8 to 10.4/1000 pys) at 1–2 years post-transplant before slowly increasing to 14.8/1000 pys (95% CI, 12.3 to 17.8/1000 pys) at ≥15 years post-transplant (Table 2C, Figure 2B). Those whose first transplant was from a deceased donor had higher mortality rates at all time points compared with those whose first transplant was from a living donor (P < 0.001, Figure 3).
Figure 3.
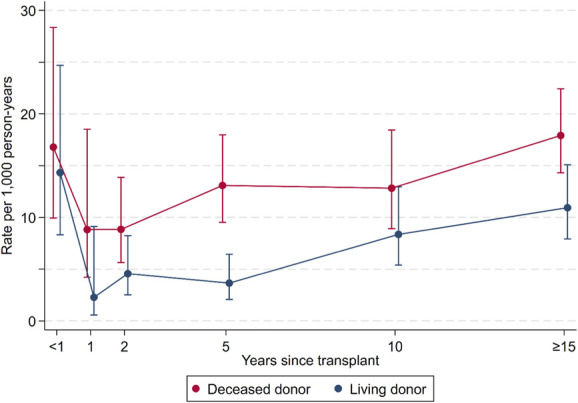
Estimates since first kidney transplant of mortality rates per 1000 person-years by donor type. Figure 3 can be viewed in color online at www.jasn.org.
SMRs
Excess deaths, as determined by the SMR, in the kidney failure population were very high. Excess deaths were 41 times (40.7 SMR, 95% CI, 23.1 to 71.7) expected during 1980–1984 and fell to 22 times (21.9 SMR, 95% CI, 16.6 to 28.8) during 1995–1999 and then to 17 times (16.7 SMR, 95% CI, 13.4 to 20.8) the general population during 2015–2019 (Figure 2C).
The transplant cohort similarly experienced high excess mortality. During 1980–1984, excess deaths were 23 times (22.9 SMR, 95% CI, 8.6 to 60.9) expected. This fell to 16 times (16.1 SMR, 95% CI, 11.4 to 22.8) during 1995–1999 and then to 13 times (13.2 SMR, 95% CI, 10.3 to 17.0) in the most recent period of 2015–2019 (Figure 2C). Excess deaths were higher for females than males regardless of age or cause of kidney failure (Supplemental Figure 4).
Treatment Transitions and Mortality (Multistate Probabilities) Since Kidney Failure
Treatment Transitions
The median number of treatment transitions (moving from dialysis to transplant or vice versa) in our cohort was 2. Overall, most children (71%) spent over half of their follow-up time with a functioning transplant (median of 8.3 years, IQR, 2.5–17.0 years). Transition probabilities and times to transitions are summarized in Supplemental Table 6.
The probability of being treated with dialysis (and no prior transplant) dramatically decreased from 78.2% (95% CI, 76.4% to 80.0%) in the first 3 months of kidney failure to 50.4% (95% CI, 48.2% to 52.6%) at 1 year, to 9.5% (95% CI, 8.2% to 10.9%) at 5 years, and to 1.4% (95% CI, 0.9% to 2.2%) at 15 years (Figure 4).
Figure 4.
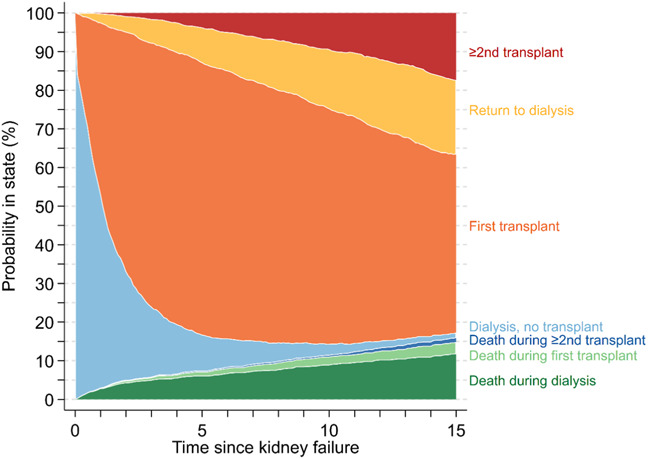
Estimated probability of being in clinical states since kidney failure diagnosis, including transplant (first or ≥2nd), dialysis (never transplanted or return after transplant failure), or death (during dialysis, first or ≥2nd transplant).
Conversely, the probability of being alive with a first transplant increased from 20.0% (95% CI, 18.4% to 21.9%) in the first 3 months of kidney failure to 44.1% (95% CI, 42.0% to 46.3%) at 1 year and to a peak of 70.3% (95% CI, 68.2% to 72.4%) at 5 years. Thereafter, the probability of being alive with a first transplant fell to 46.1% (95% CI, 43.5% to 48.9%) at 15 years as children and adolescents transitioned to other states.
When the cohort was stratified by age, there were marked differences in transitions between dialysis and transplant for those younger than 13 years and those 13 years or older at the time of kidney failure diagnosis (Supplemental Figure 1). At 5 years postkidney failure, just 4.7% (95% CI, 3.5% to 6.3%) of those in the younger group remained on dialysis, compared with 14.0% (95% CI, 12.0% to 16.4%) for the older group. This difference was primarily due to higher rates of transplantation in the younger group. At 5 years postkidney failure, the probability of having a transplant was 76.9% (95% CI, 74.2% to 79.7%) for the younger group, compared with 64.0% (95% CI, 61.0% to 67.1%) for the older group.
Mortality
The greatest probability of death was during treatment with dialysis (Figure 4). From time since kidney failure, the probability of death during dialysis was 2.7% (95% CI, 2.1% to 3.5%) at 1 year, 5.9% (95% CI, 5.0% to 7.1%) at 5 years, and 11.7% (95% CI, 10.2% to 13.4%) at 15 years. The probability of death during the first transplant was 0.2% (95% CI, 0.1 to 0.5) at 1 year, 1.2% (95% CI, 0.8% to 1.9%) at 5 years, and 3.1% (95% CI, 2.3% to 4.1%) at 15 years. The probability of death after the second or subsequent transplant was 0.1% (95% CI, 0.03% to 0.4%) at 5 years and 1.1% (95% CI, 0.7% to 1.8%) at 15 years since kidney failure. When the cohort was stratified at age 13 years at the time of kidney failure diagnosis, we found that the younger group had slightly higher risk of early death during dialysis. These differences largely resolved after transplantation.
Life Years Remaining
Life expectancy was considerably lower than in the general population, and this was true regardless of age at kidney failure (Figure 5). Hence, kidney failure resulted in significant YLL (Figure 5, Supplemental Table 3, Supplemental Table 5). In our cohort, YLL were greatest with younger age at kidney failure and in female patients (Supplemental Table 5). YLL for those aged 5 years at kidney failure were 29.6 years (95% CI, 24.3 to 34.9) in female patients and 21.3 years (95% CI, 15.7 to 26.9) in male patients. When aged 15 years at kidney failure, YLL decreased to 25.0 years (95% CI, 19.5 to 30.5) in female patients and 17.3 years (95% CI, 11.4 to 23.1) in male patients.
Figure 5.
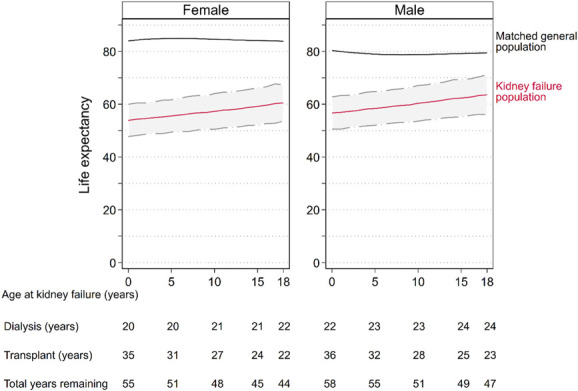
Estimated total life expectancy (red line) with 95% CI (dashed lines with gray area) in the kidney failure population and expected life expectancy in the general population (black line), by age at kidney failure diagnosis and sex. Expected life years remaining while on dialysis and with a functioning transplant, and total life years remaining (dialysis plus transplanted time) are provided at given ages. Total years remaining is equal to the sum of dialysis and transplant (years). Total life expectancy in the kidney failure population is equal to the sum of the age at kidney failure and the total years remaining. For example, a male aged 15 years at kidney failure has 49 life years remaining, including 28 years in dialysis and 21 years in transplant, with a total life expectancy of 64 years. Life expectancy in the general population is determined by matching life tables to the study population according to year of birth, sex, and country. Figure 5 can be viewed in color online at www.jasn.org.
For those diagnosed with kidney failure between 1980 and 1998, YLL were 25.2 years (95% CI, 25.0 to 25.4), compared with 19.4 years (95% CI, 19.3 to 19.6) for those diagnosed between 1999 and 2019 (mean difference 5.8 years, 95% CI, 5.5 to 6.0, P < 0.001) (Supplemental Figure 2). YLL for female patients aged 5 years at kidney failure were 33.1 years (95% CI, 27.7 to 38.4) for those diagnosed 1980–1998, compared with 27.9 years (95% CI, 22.7 to 33.2) for those diagnosed in 1999–2019. Similarly, YLL for male patients aged 5 years at kidney failure were 25.6 years (95% CI, 19.9 to 31.2), compared with 19.7 years (95% CI, 14.1 to 25.3) for those diagnosed in 1999–2019. The same trend to improvement was seen in older age groups. YLL for female patients aged 15 years at kidney failure were 28.0 years (95% CI, 22.5 to 33.5) for those diagnosed in 1980–1998, compared with 22.9 years (95% CI, 17.4 to 28.5) for those diagnosed in 1999–2019. Similarly, YLL for male patients aged 5 years at kidney failure were 20.8 years (95% CI, 14.9 to 26.7), compared with 14.7 (95% CI, 8.9 to 20.6) in male patients for those diagnosed in 1999–2019.
Discussion
This large binational population-based cohort study explored mortality rates and YLL in 2013 children with kidney failure over 30,082 person-years of follow-up. Our study has modeled patients over their lifetime which included periods of dialysis, transplantation, and retransplantation. This is a novel way of modeling kidney failure survival and reflects the lived experience of children with kidney failure. The key findings of our study were (1) kidney failure in childhood was associated with substantial YLL, ranging from 16 to 32 years depending on age at kidney failure and sex; (2) female patients lose ≥7 more life years than male patients irrespective of age at diagnosis; and (3) while the excess mortality rate in children with kidney failure remains extremely high, it has been improving over time.
In this article, our model mirrors the lived experience of children with kidney failure who typically transition between dialysis and transplant and back again before death. Although clinicians have this pattern loosely framed in their mind, our work provides a clear mapping of the expected transitions between, and time spent in, different treatments for pediatric patients with kidney failure. With this life course approach, we found that YLL were substantially higher than many other chronic diseases that develop in childhood. In type 1 diabetes, YLL have been shown to be 10–12 years in studies out of Australia and Sweden24,25: This highlights the burden of a diagnosis of kidney failure for children.
The most comparable data for our study are from the US Renal Data System (USRDS).26 The USRDS has calculated that for American children with kidney failure, the expected YLL are 40–55 years if treated with dialysis and 12–20 years if treated with transplantation.26 As most children with kidney failure have at least one transplant, the true YLL likely lie somewhere in between these estimates.26 The utility of these data is impeded by its remove from clinical practice and patients' lived experiences due to dialysis and transplantation being considered entirely separately and not as part of a treatment continuum.
We found that the greatest YLL lost were in female patients and those who developed kidney failure at a younger age. Female patients lost between 30 and 32 years of life if diagnosed with kidney failure at at age 5 years or younger. This is seven more years of life lost (approximately 30%) than their males counterparts who lost between 21 and 24 years of life. Although the absolute numbers of YLL fell for both female and male patients with older ages at kidney failure diagnosis, the sex disparity of ≥7 years of additional life lost for female patients remained. When split into “historical” (1980–1998) and “contemporary” (1999–2019) eras, we found that YLL had improved over time. Those diagnosed with kidney failure in the contemporary era had an extra 5.8 years of life compared with those in the historical era, although YLL remained very high. Female patients experienced less improvement in their YLL than male patients, widening the preexisting sex disparity.
In our cohort, female patients not only lost the benefit of the sex gap seen in the general population where female patients outlive males by approximately 3 years but also lost an additional ≥4 years of life. Why is this? There is evolving understanding that sex disparities exist in the treatment and outcomes of kidney disease. For instance, it is now well established that a woman with kidney failure is less likely to receive a transplant than a man.27,28 In this study, we found that female pediatric patients had less access to transplantation, particularly preemptive transplantation than their male peers. Similar findings were shown in a large European study by Hogan et al., where female children and adolescents had poorer access to preemptive transplantation than their male counterparts.29 In the United States, Ahearn et al. used USRDS data to show that girls on RRT had higher rates of mortality than boys, partially, although by no means wholly due to lower rates of transplantation, including preemptive transplantation.30 Many factors have been hypothesized as playing a role in sex differences in kidney transplant outcomes, including age-related differences in immune function and differences in donor and recipient size (with consequent difference in metabolic demand of recipients and nephron mass in donors).31 Similarly, during the dialysis periods, female patients may fare worse for reasons not completely understood but may include lower dialysis doses in women than in men when adjusted for body surface area.32 What is clear is that we do not yet fully understand the many hormonal and socioeconomic factors that may play into the development and perpetuation of these sex-based disparities, and this is an area that requires further research.
Our study spanned forty years, during which 394 (20%) participants died. Our cohort of children with kidney failure had a mortality rate 17–41 times their age-matched peers without kidney failure. Although those with a kidney transplant fared somewhat better, mortality rates remained excessive and 13–23 times higher than their age-matched peers. These rates are similar to those that have been reported in the United States.33 In our cohort, excess mortality rates almost halved from 41 to 22 times over the fifteen years between 1980–1984 and 1995–1999 and then declined further, albeit at a slower pace, to 17 times by 2015–2019. Similar excess mortality rates and improvements (up until 2013) have been reported in the United States in those aged 0–14 years and 15–25 years by Foster et al. using USRDS and Centers for Disease Control and Prevention data.34 For our cohort that was transplanted, excess mortality also fell rapidly from 23 to 16 times between 1980–1984 and 1995–1999 and then more temperately to 13 times by 2015–2019. The greater improvement in total deaths compared with transplant deaths suggests that improvements in dialysis care outpaced improvements in transplant care over that time for this population. However, for the past 15–20 years, excess mortality has fallen more slowly for those with kidney failure and with a kidney transplant. It is not yet clear why this is. One hypothesis is that there is a greater willingness to dialyze children with significant nonrenal comorbidities and/or congenital abnormalities who previously would have been offered supportive care. However, it is not possible to establish whether this accounts for any of the diminishing improvements in excess mortality rates given the lack of published literature in this area.
Mortality rates for those younger than 2 years at the time of kidney failure diagnosis were extremely high at 7.5 times the rate of those aged 2–5 years, 39 times the rate of those aged 11–14 years, and 10 times the rate of those 15 years or older (at 15.0/100, 2.0/100, 0.4/100, and 1.5/100 pys, respectively, in female patients). We found little difference in mortality by sex. However, we did report very high mortality rates of 32% for Aboriginal and Torres Strait Islander Australian participants. As there are no general population mortality rates available stratified by ethnicity, we could not quantify the rate of excess deaths in this population. As we found that death was most likely to occur during dialysis (as opposed to transplant) years, the high mortality for first nation Australians may in be in part due to lower transplantation rates for Aboriginal and Torres Strait Islander children which has been previously described.35 Factors, such as low birthweight, reduced nephron mass, and socioeconomic factors, also likely play an important part.36 Similar findings have been reported in the pediatric African American population in the United States and the pediatric first nations pollution in Canada.26, 37–40
Although we have shown a profound loss of potential life years in children and adolescence with kidney failure, it is important to remember that we have similarly shown that this cohort also enjoys many life years ahead of them. With life expectancies between age 54 and 64 years depending on the age of diagnosis, most children with kidney failure live to an age where they able to participate in many important life events, including graduation from high school and university, having and raising a family, and attainment of professional goals. For the children and their parents and caregivers, this is likely to be reassuring.
Our study benefited from long follow-up times, linkage with national death registries, the inclusion of all pediatric patients with kidney failure regardless of treatment type, and novel statistical analyses, including YLL and clinical transitions. Yet, there were also limitations to our work. First, as with all registry-based studies, we were constrained to the demographic and clinical data collected by ANZDATA. As such, important clinical and/or demographic risk factors for mortality, such as physical exercise, medication, medication adherence, or risk factor management and control, could not be included in our analysis. There were also some comorbidities which may be important in this population, such as congenital heart disease and chromosomal abnormalities, which could not be included. Second, the dominant populations of Australia and New Zealand are White, and our study population reflects that. As we did not have access to general population mortality by ethnicity, we could not determine stratified estimates by race or determine whether ethnicity is a risk factor for mortality in kidney failure. Third, we note that although the relative rate of death “excess deaths” is very high, the absolute rate of death in children 11 years or younger is low. Finally, we have modeled the average YLL from kidney failure in childhood, and there may be (substantial) individual variation within this.
In conclusion, we found that children and adolescents with kidney failure have up to 32 YLL, with female patients and those who develop kidney failure at the youngest ages losing the most life years. Importantly, our work provides a clear mapping of transitions between, and time spent in, different clinical treatment states for pediatric patients with kidney failure. This mapping between dialysis to transplant and back presents a more realistic experience and would be useful in communicating with patients and/or their parents to set lifetime expectations around treatments.
Supplementary Material
ACKNOWLEDGMENTS
The data reported here have been supplied by the Australia and New Zealand Dialysis and Transplant Registry (ANZDATA), the Australian Institute of Health and Welfare (AIHW), and the New Zealand Ministry of Health. We would like to acknowledge the assistance provided by the AIHW in the data linkage process and Kidney Health Australia for their financial support. The interpretation and reporting of these data are the responsibility of the authors and in no way should be seen as an official policy of interpretation of ANZDATA, AIHW, or the New Zealand Ministry of Health.
Disclosures
N.L. De La Mata reports Honoraria: Research square. J. Hedley reports Employer: Spouse employed by Carbon Revolution; and Ownership Interest: Carbon Revolution. S. Kim reports Other Interests or Relationships: IPNA Juniors Committee ANZPNA Representative and TSANZ SPEC Committee Member. A.C. Webster reports Advisory or Leadership Role: various editorial roles all unpaid and various data-related roles (clinical quality registry, trial registry) all unpaid. M.L. Wyld reports Advisory or Leadership Role: CMV Advisory Board, Takeda Pharmaceuticals (Declined payment offer). The remaining author has nothing to disclose.
Funding
The data linkage on which this study was based was supported by Kidney Health Australia grant no. PG3815. Kidney Health Australia had no role in study design, analysis, or interpretation of data, writing the report, or the decision to submit the report for publication.
Author Contributions
Conceptualization: Patrick J. Kelly, Siah Kim, Nicole L. De La Mata, Angela C. Webster, Melanie L. Wyld.
Data curation: Nicole L. De La Mata.
Funding acquisition: Patrick J. Kelly, Angela C. Webster.
Formal analysis: James Hedley, Nicole L. De La Mata.
Investigation: Melanie L. Wyld.
Methodology: Angela C. Webster, Melanie L. Wyld.
Project administration: Melanie L. Wyld.
Supervision: Angela C. Webster.
Writing – original draft: Melanie L. Wyld.
Writing – review & editing: James Hedley, Patrick J. Kelly, Siah Kim, Nicole L. De La Mata, Angela C. Webster, Melanie L. Wyld.
Supplemental Material
This article contains the following supplemental material online at http://links.lww.com/JSN/E38.
Supplemental Figure 1. Estimated probability of being in clinical states since kidney failure diagnosis, including transplant (first or ≥2nd), dialysis (never transplanted or return after transplant), or death (during dialysis, first or ≥2nd transplant), stratified by age at kidney failure <13 years versus ≥13 years.
Supplemental Figure 2. Estimated probability of being in clinical states since kidney failure diagnosis, including transplant (first or ≥2nd), dialysis (never transplanted or return after transplant), or death (during dialysis, first or ≥2nd transplant), stratified by calendar year of kidney failure (1980–99 versus 2000–19).
Supplemental Table 1. Transplanted status and median prior dialysis time by sex.
Supplemental Table 2. Cause of kidney failure by sex.
Supplemental Table 3. Summary of top ten leading causes of death among 304 deaths in the pediatric kidney failure population in Australia (1980–2013) and New Zealand (1988–2012).
Supplemental Table 4. Standardized mortality ratios (SMRs) in female and male patients for 394 deaths in the pediatric kidney failure population in Australia (1980–2019) and New Zealand (1988–2019), by age and cause of kidney failure.
Supplemental Table 5. Estimates of the average life years remaining in dialysis, transplant, and overall compared with expected life years remaining and years of life lost (expected minus overall), by sex and age at kidney failure diagnosis.
Supplemental Table 6. Number of patients making each health state transition in the Markov model and the time in years until each transition occurred.
References
- 1.Australia and New Zealand Dialysis and Transplant Registry. 42nd Report, Chapter 12: Paediatric Patients with End Stage Kidney Disease Requiring Renal Replacement Therapy Adelaide, Australia; 2019. http://www.anzdata.org.au. [Google Scholar]
- 2.ERA-EDTA Registry. ERA-EDTA Registry Annual Report 2017. Amsterdam UMC, Location AMC, Department of Medical Informatics; 2017. [Google Scholar]
- 3.US Renal Data System. US Renal Data System 2019 Annual Data Report: Epidemiology of Kidney Disease in the United States; 2019. [Google Scholar]
- 4.Tong A, Lowe A, Sainsbury P, Craig JC. Experiences of parents who have children with chronic kidney disease: a systematic review of qualitative studies. Pediatrics. 2008;121(2):349–360. doi: 10.1542/peds.2006-3470 [DOI] [PubMed] [Google Scholar]
- 5.Lopes M, Ferraro A, Koch VH. Health-related quality of life of children and adolescents with CKD stages 4-5 and their caregivers. Pediatr Nephrol. 2014;29(7):1239–1247. doi: 10.1007/s00467-014-2769-8 [DOI] [PubMed] [Google Scholar]
- 6.Dharnidharka VR, Fiorina P, Harmon WE. Kidney transplantation in children. New Engl J Med. 2014;371(6):549–558. doi: 10.1056/nejmra1314376 [DOI] [PubMed] [Google Scholar]
- 7.Moreira JM, Bouissou Morais Soares CM, Teixeira AL, Simões e Silva AC, Kummer AM, Kummer A. Anxiety, depression, resilience and quality of life in children and adolescents with pre-dialysis chronic kidney disease. Pediatr Nephrol. 2015;30(12):2153–2162. doi: 10.1007/s00467-015-3159-6 [DOI] [PubMed] [Google Scholar]
- 8.Medway M, Tong A, Craig JC, et al. Parental perspectives on the financial impact of caring for a child with CKD. Am J Kidney Dis. 2015;65(3):384–393. doi: 10.1053/j.ajkd.2014.07.019 [DOI] [PubMed] [Google Scholar]
- 9.Wightman A, Bradford MC, Smith J. Health-related quality of life changes following renal transplantation in children. Pediatr Transplant. 2019;23(2):e13333. doi: 10.1111/petr.13333 [DOI] [PMC free article] [PubMed] [Google Scholar]
- 10.Hanson CS, Gutman T, Craig JC, et al. Identifying important outcomes for young people with CKD and their caregivers: a nominal group technique study. Am J Kidney Dis. 2019;74(1).82–94. doi: 10.1053/j.ajkd.2018.12.040 [DOI] [PubMed] [Google Scholar]
- 11.Hanson CS, Craig JC, Logeman C, et al. SONG-Kids consensus workshops investigators. Establishing core outcome domains in pediatric kidney disease: report of the Standardized Outcomes in Nephrology; Children and Adolescents (SONG-KIDS) consensus workshops. Kidney Int. 2020;98(3):553–565. doi: 10.1016/j.kint.2020.05.054 [DOI] [PubMed] [Google Scholar]
- 12.Francis A, Johnson DW, Melk A, et al. Survival after kidney transplantation during childhood and adolescence. Clin J Am Soc Nephrol. 2020;15(3):392–400. doi: 10.2215/CJN.07070619 [DOI] [PMC free article] [PubMed] [Google Scholar]
- 13.Laskin BL, Mitsnefes MM, Dahhou M, Zhang X, Foster BJ. The mortality risk with graft function has decreased among children receiving a first kidney transplant in the United States. Kidney Int. 2015;87(3):575–583. doi: 10.1038/ki.2014.342 [DOI] [PMC free article] [PubMed] [Google Scholar]
- 14.Van Arendonk KJ, Boyarsky BJ, Orandi BJ, et al. National trends over 25 years in pediatric kidney transplant outcomes. Pediatrics. 2014;133(4):594–601. doi: 10.1542/peds.2013-2775 [DOI] [PMC free article] [PubMed] [Google Scholar]
- 15.McDonald SP, Russ GR. Australian registries-ANZDATA and ANZOD. Transpl Rev. 2013;27(2):46–49. doi: 10.1016/j.trre.2013.01.003 [DOI] [PubMed] [Google Scholar]
- 16.Sypek MP, Dansie KB, Clayton PA, Webster AC, McDonald S. Comparison of cause of death between Australian and New Zealand dialysis and transplant registry and the Australian national death index. Nephrology (Carlton). 2019;24(3):322–329. doi: 10.1111/nep.13250 [DOI] [PubMed] [Google Scholar]
- 17.Blakely T, Salmond C. Probabilistic record linkage and a method to calculate the positive predictive value. Int J Epidemiol. 2002;31(6):1246–1252. doi: 10.1093/ije/31.6.1246 [DOI] [PubMed] [Google Scholar]
- 18.Cole TJ, Lobstein T. Extended international (IOTF) body mass index cut-offs for thinness, overweight and obesity. Pediatr Obes. 2012;7(4):284–294. doi: 10.1111/j.2047-6310.2012.00064.x [DOI] [PubMed] [Google Scholar]
- 19.Therneau T, Crowson C, Atkinson E. Multi-State Models and Competing Risks. R Package Version 2.38; 2020. https://cran.r-project.org/web/packages/survival/vignettes/compete.pdf. [Google Scholar]
- 20.van den Hout A, Sum Chan M, Matthews F. Estimation of life expectancies using continuous-time multi-state models. Comput Methods Programs Biomed. 2019;178:11–18. doi: 10.1016/j.cmpb.2019.06.004 [DOI] [PubMed] [Google Scholar]
- 21.Jackson CH. Multi-state models for panel data: the msm package for R. J Stat Softw. 2011;38(8):1-28. doi: 10.18637/jss.v038.i08 [DOI] [Google Scholar]
- 22.Australian Bureau of Statistics. Australian Life Tables, 2008–2010; 2012. https://www.abs.gov.au/AUSSTATS/abs@.nsf/Lookup/3302.0.55.001Main+Features12008-2010?OpenDocument. [Google Scholar]
- 23.StatsNZ. New Zealand Cohort Life Tables; 2020. https://www.stats.govt.nz/information-releases/new-zealand-cohort-life-tables-march-2020-update. [Google Scholar]
- 24.Huo L, Harding JL, Peeters A, Shaw JE, Magliano DJ. Life expectancy of type 1 diabetic patients during 1997-2010: a national Australian registry-based cohort study. Diabetologia. 2016;59(6):1177–1185. doi: 10.1007/s00125-015-3857-4 [DOI] [PubMed] [Google Scholar]
- 25.Petrie D, Lung TWC, Rawshani A, et al. Recent trends in life expectancy for people with type 1 diabetes in Sweden. Diabetologia. 2016;59(6):1167–1176. doi: 10.1007/s00125-016-3914-7 [DOI] [PubMed] [Google Scholar]
- 26.United States Renal Data System. USRDS Annual Data Report: Epidemiology of Kidney Disease in the United States. National Institutes of Health, National Institute of Diabetes and Digestive and Kidney Diseases; 2018. [Google Scholar]
- 27.Schaubel DE, Stewart DE, Morrison HI, et al. Sex inequality in kidney transplantation rates. Arch Intern Med. 2000;160(15):2349–2354. doi: 10.1001/archinte.160.15.2349 [DOI] [PubMed] [Google Scholar]
- 28.Carrero JJ, Hecking M, Chesnaye NC, Jager KJ. Sex and gender disparities in the epidemiology and outcomes of chronic kidney disease. Nat Rev Nephrol. 2018;14(3):151–164. doi: 10.1038/nrneph.2017.181 [DOI] [PubMed] [Google Scholar]
- 29.Hogan J, Couchoud C, Bonthuis M, et al. Gender disparities in access to pediatric renal transplantation in europe: data from the ESPN/ERA-EDTA registry. Am J Transplant. 2016;16(7):2097–2105. doi: 10.1111/ajt.13723 [DOI] [PubMed] [Google Scholar]
- 30.Ahearn P, Johansen KL, McCulloch CE, Grimes BA, Ku E. Sex disparities in risk of mortality among children with ESRD. Am J Kidney Dis. 2019;73(2):156–162. doi: 10.1053/j.ajkd.2018.07.019 [DOI] [PMC free article] [PubMed] [Google Scholar]
- 31.Lepeytre F, Dahhou M, Zhang X, et al. Association of sex with risk of kidney graft failure differs by age. J Am Soc Nephrol. 2017;28(10):3014–3023. doi: 10.1681/ASN.2016121380 [DOI] [PMC free article] [PubMed] [Google Scholar]
- 32.Daugirdas JT, Greene T, Chertow GM, Depner TA. Can rescaling dose of dialysis to body surface area in the HEMO study explain the different responses to dose in women versus men? Clin J Am Soc Nephrol. 2010;5(9):1628–1636. doi: 10.2215/CJN.02350310 [DOI] [PMC free article] [PubMed] [Google Scholar]
- 33.Foster B, Dahhou M, Zhang X, Platt R, Hanley J. Change in mortality risk over time in young kidney transplant recipients. Am J Transplant. 2011;11(11):2432–2442. doi: 10.1111/j.1600-6143.2011.03691.x [DOI] [PubMed] [Google Scholar]
- 34.Foster BJ, Mitsnefes MM, Dahhou M, Zhang X, Laskin BL. Changes in excess mortality from end stage renal disease in the United States from 1995 to 2013. Clin J Am Soc Nephrol. 2018;13(1):91–99. doi: 10.2215/CJN.04330417 [DOI] [PMC free article] [PubMed] [Google Scholar]
- 35.Grace BS, Kennedy SE, Clayton PA, McDonald SP. Racial disparities in paediatric kidney transplantation. Pediatr Nephrol. 2014;29(1):125–132. doi: 10.1007/s00467-013-2572-y [DOI] [PubMed] [Google Scholar]
- 36.White A, Wong W, Sureshkumur P, Singh G. The burden of kidney disease in Indigenous children of Australia and New Zealand, epidemiology, antecedent factors and progression to chronic kidney disease. J Paediatr Child Health. 2010;46(9):504–509. doi: 10.1111/j.1440-1754.2010.01851.x [DOI] [PubMed] [Google Scholar]
- 37.Freeman MA, Myaskovsky L. An overview of disparities and interventions in pediatric kidney transplantation worldwide. Pediatr Nephrol. 2015;30(7):1077–1086. doi: 10.1007/s00467-014-2879-3 [DOI] [PMC free article] [PubMed] [Google Scholar]
- 38.Atkinson MA, Roem JL, Gajjar A, Warady BA, Furth SL, Muñoz A. Mode of initial renal replacement therapy and transplant outcomes in the chronic kidney disease in children (CKiD) study. Pediatr Nephrol. 2020;35(6):1015–1021. doi: 10.1007/s00467-019-04416-2 [DOI] [PMC free article] [PubMed] [Google Scholar]
- 39.Ku E, McCulloch CE, Grimes BA, Johansen KL. Racial and ethnic disparities in survival of children with ESRD. J Am Soc Nephrol. 2017;28(5):1584–1591. doi: 10.1681/ASN.2016060706 [DOI] [PMC free article] [PubMed] [Google Scholar]
- 40.Samuel SM, Foster BJ, Tonelli MA, et al. Dialysis and transplantation among Aboriginal children with kidney failure. CMAJ. 2011;183(10):E665–E672. doi: 10.1503/cmaj.101840 [DOI] [PMC free article] [PubMed] [Google Scholar]
Associated Data
This section collects any data citations, data availability statements, or supplementary materials included in this article.