Keywords: acid/base and electrolyte disorders, diabetes, kidney, magnetic resonance imaging, mouse, sodium
Abstract
Key Points
23Na MRI allows us to noninvasively assess sodium distribution.
We propose the utility of 23Na MRI for evaluating functional changes in diabetic kidney disease and not as a marker reflecting structural damage.
23Na MRI may be an early marker for structures beyond the glomeruli, enabling prompt intervention with novel efficacious tubule-targeting therapies.
Background
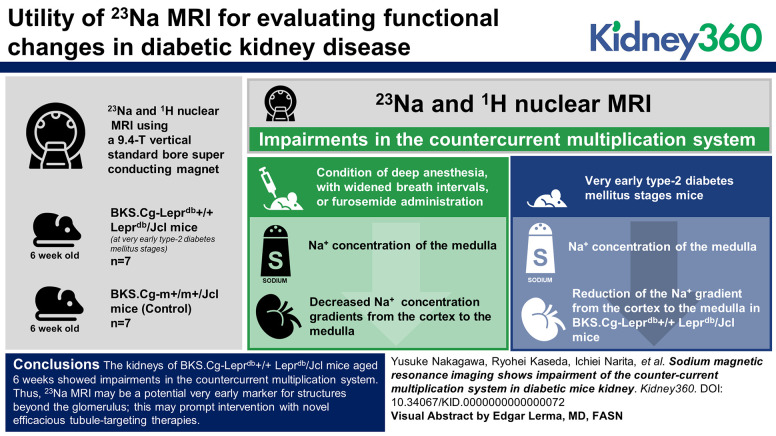
Sodium magnetic resonance imaging can noninvasively assess sodium distribution, specifically sodium concentration in the countercurrent multiplication system in the kidney, which forms a sodium concentration gradient from the cortex to the medulla, enabling efficient water reabsorption. This study aimed to investigate whether sodium magnetic resonance imaging can detect changes in sodium concentrations under normal conditions in mice and in disease models, such as a mouse model with diabetes mellitus.
Methods
We performed sodium and proton nuclear magnetic resonance imaging using a 9.4-T vertical standard-bore superconducting magnet.
Results
A condition of deep anesthesia, with widened breath intervals, or furosemide administration in 6-week-old C57BL/6JJcl mice showed a decrease in both tissue sodium concentrations in the medulla and sodium concentration gradients from the cortex to the medulla. Furthermore, sodium magnetic resonance imaging revealed reductions in the sodium concentration in the medulla and in the gradient from the cortex to the medulla in BKS.Cg-Leprdb+/+ Leprdb/Jcl mice at very early type 2 diabetes mellitus stages compared with corresponding control BKS.Cg-m+/m+/Jcl mice.
Conclusions
The kidneys of BKS.Cg-Leprdb+/+ Leprdb/Jcl mice aged 6 weeks showed impairments in the countercurrent multiplication system. We propose the utility of 23Na MRI for evaluating functional changes in diabetic kidney disease and not as a marker that reflects structural damage. Thus, 23Na MRI may be a potentially very early marker for structures beyond the glomerulus; this may prompt intervention with novel efficacious tubule-targeting therapies.
Introduction
The kidney plays a major role in sodium balance.1 The renal countercurrent multiplication system forms a sodium concentration gradient from the cortex to the medulla, facilitating efficient water reabsorption.2 Approximately 60%–70% of sodium is reabsorbed along the proximal convoluted and proximal straight tubules. The thick limbs of the loop of Henle are major sodium-reabsorbing segments accounting for approximately 25%–30% of renal sodium reabsorption.3 NKCC2, a sodium-potassium-chloride cotransporter, is one of the predominant sodium transport mechanisms in the thick limb, and sodium chloride reabsorption maintains a high interstitial osmolality required for countercurrent multiplication and water reabsorption by the collecting duct system.4 With sodium magnetic resonance imaging (23Na MRI), it is possible to evaluate changes in sodium concentration in the entire kidney.
Bogusky et al. first described 23Na MRI in 1986,5 and since then, several 23Na MRI studies have been performed.6–8 Previous reports on kidney 23Na MR images have studied humans and animals, such as rodents and pigs.9–11 The sodium signal intensity changed in the medulla after diuretic administration in hydronephrosis and in acute tubular necrosis.11–13 After administration of furosemide, an NKCC2 inhibitor, the high-intensity sodium signal in the renal medulla decreased in rats and humans.12,14,15 Thus, the high-intensity signal of the medulla reflects the activity of the countercurrent multiplication system. Moreover, 23Na MRI of the thigh in patients with type 2 diabetes mellitus undergoing hemodialysis and patients with acute kidney injury demonstrated a tendency toward higher sodium content in the muscle and skin tissues when compared with healthy participants.16,17 Thus, 23Na MR imaging may be valuable in assessing parts of the body other than the kidney.
Although knowledge regarding the mechanisms of sodium reabsorption through channels or transporters has been accumulated, the distribution of the sodium concentration in the entire kidney has not been delineated in kidney diseases. The application of 23Na MRI to a murine disease model may expand the scope of prior studies and elucidate the pathogenesis of sodium gradient impairments. 23Na MRI is, therefore, expected to become an important tool to broaden the path to elucidation of renal pathology.
This study aimed to investigate whether 23Na MRI can detect changes in sodium concentrations under normal conditions in mice and in disease models, such as a mouse model of diabetes mellitus.
Methods
Mice
Six-week-old male C57BL/6JJcL (C57BL/6), BKS.Cg-Leprdb+/+ Leprdb/Jcl (db/db), and BKS.Cg-m+/m+/Jcl (m+/m+) mice were purchased from CLEA Japan, Inc. (Tokyo, Japan). Mice were bred under a 12/12-hours light cycle, and food and water were provided ad libitum. All mice were imaged on the same day and were under free feeding until just before imaging. All animal experiments complied with the National Institute of Health Guide for the Care and Use of Laboratory Animals and were approved by the Animal Care and Use Committee and the Animal Experimental Ethics Committee of the University of Tsukuba (approval numbers: 20-354, 21-230).
Sample sizes were selected to provide 80% power for a significant difference of 0.05 and were based on a previous study investigating changes in the tissue sodium concentration (TSC) in rats before and after furosemide administration.10
Blood and Urine Analyses
After measuring the body weight and collecting urine for 24 hours in metabolic cages, the mice were anesthetized with pentobarbital sodium (50 mg/kg intraperitoneal injection) and blood samples were collected from the inferior vena cava. Serum sodium, serum glucose, glycated albumin, urine sodium, urine glucose, urine albumin, and urine creatinine levels were measured using a Hitachi Ion Electrode Reagent (Fuji Film Wako Pure Chemical Industries, Ltd., Tokyo, Japan), Quick Auto Neo GLU-HK (Sinotest Corp., Kanagawa, Japan), LUCICA GA-L Assay Kit (Asahi Kasei Corp., Tokyo, Japan), Hitachi Ion Electrode Reagent, Quick Auto Neo GLU-HK, LBIS Mouse Urinary Albumin Assay Kit (S-type) (Fuji Film Wako Pure Chemical Industries, Ltd.), and L-type Wako CRE M (Fuji Film Wako Pure Chemical Industries, Ltd.), respectively.
Renal Histology
The kidneys were immersed in 10% buffered formalin and embedded in paraffin. Periodic acid-Schiff staining was performed with 4-μm–thick sections. Renal tissues were observed by light microscopy (BZ-8000; Keyence, Osaka, Japan).
23Na MRI and 1H MRI Equipment
MR imaging was performed with a 9.4-T vertical standard-bore superconducting magnet (φ54 mm; JASTEC Company, Tokyo, Japan) equipped with a self-made gradient insert (outer diameter=39 mm; inner diameter=32 mm; maximum gradient strength=400 mT/m), an MRI spectrometer (DTRX6; MRTechnology Inc., Tsukuba, Japan), and a radiofrequency (RF) power amplifier (BT01000-gamma; TOMCO, Stepney, Australia). The proton (1H)/23Na RF probe was modified to fit mice, and the RF coils had individual coaxial ports for 1H and 23Na imaging. The 1H surface coil (400.4 MHz) was placed on the abdomen of the mouse, whereas the 23Na surface coil (106 MHz) was placed on its back (Figure 1). We first performed 1H MRI, followed by 23Na MRI, and the procedure was repeated to confirm the kidney positions for each mouse.
Figure 1.
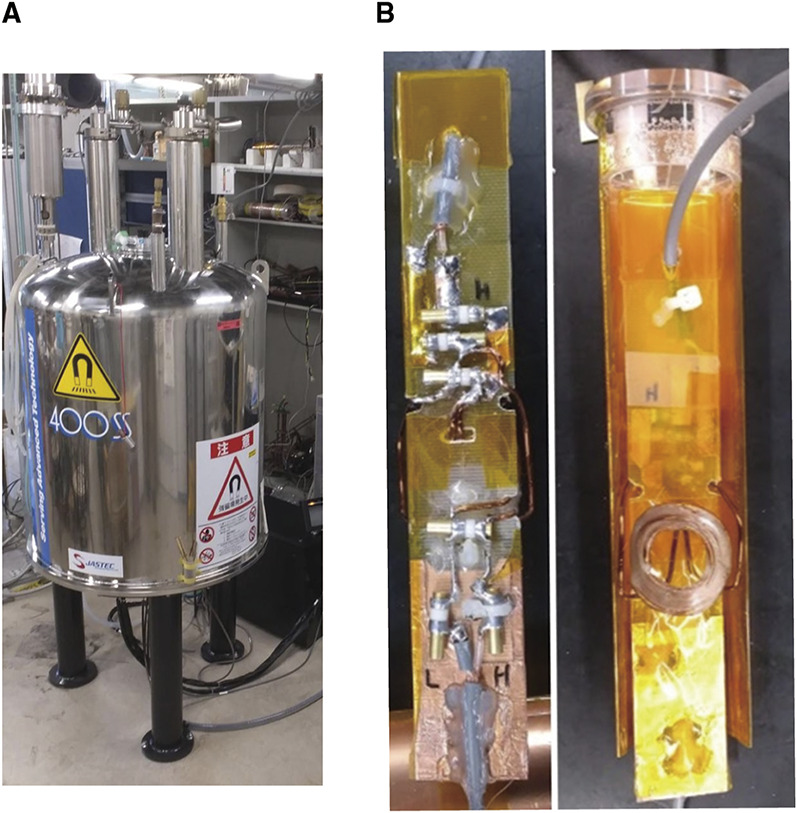
23Na MRI and 1H MRI equipment: (A) The 9.4-T vertical standard-bore superconducting magnet and (B) the 1H and 23Na surface coil.
The 23Na MRI pulse sequence was based on the standard three-dimensional gradient-echo with the following parameters: repetition time/echo time/flip angle, 40 ms/3 ms/60°; image matrix, 32×32×128 pixels; and number of averages, 80. A Gaussian random sampling of 20%–40% in the k-space for compressed sensing reconstruction was used, and the total acquisition time for the 23Na imaging sequence was 20 minutes. The 1H MRI pulse sequence was also based on a standard three-dimensional gradient-echo with the following parameters: repetition time/echo time/flip angle, 40 ms/3 ms/60°; image matrix, 64×128×1024 pixels; and number of averages, 1. The total acquisition time for 1H imaging was 5–10 minutes.
To confirm the accuracy of 23Na MRI, we measured the signal intensities of five different saline solutions with concentrations in the 0–0.3 mmol/L range. The regression line and correlation coefficient were calculated from the sodium concentration and signal intensity.
Procedures of 1H and 23Na MR Image Acquisition
Mice were anesthetized by administering isoflurane (<1.5% isoflurane/air, 3.5% for deep anesthesia) through a nose cup at a flow rate of 0.5 L/min. During imaging, the mouse was placed in a vertical position and equipped with a heart rate and breathing detection device (MR Technology Inc.) with the sensor placed on the chest. Saline (0.9% salinity) in a sealed tube (4 mm in diameter) was placed near the back of the mouse for calibration. 1H and 23Na images can be captured almost simultaneously and continuously without changing the mouse position by using a 1H and 23Na double-tuned coil. As there is a possibility of signal difference caused by the location, the coil and kidney were positioned in close proximity.
Renal 23Na MRI with Furosemide Administration
C57BL/6JJcl mice receiving furosemide were assessed with 23Na MRI. The diuretic effect was induced by injecting 10 mg/kg of furosemide (Tokyo Chemical Industry, Tokyo, Japan) into the murine tail vein. 23Na MRI was performed before and 20 minutes after furosemide administration.
Image Analysis
The 1H and 23Na images in plane resolution were 215×215 and 430×430 μm, respectively. Both slices had a thickness of 1.72 mm. The MRI analysis software, iPlus.exe (MRTechnology Inc.), was used for image analyses. Images of the transverse plane of the abdomen were converted into a digital imaging and communications in medicine format for further analyses. The color map of the 23Na MR images was changed to iPlus.exe, and high signal values were represented by red, intermediate values by yellow, and low values by blue.
The 23Na signal intensities were measured by placing three regions of interest (ROIs) in the cortex and medulla of the right kidney on the basis of the corresponding anatomical 1H image, and the average signal intensity was calculated. The ROI corresponds to 5.8 pixels of images. The 23Na signal gradient was quantified as the ratio between the signal-to-noise ratio of the cortex and that of the medulla in the right kidney.
In addition, the signal intensity of the saline solution placed near the back of the mouse was used to adjust for the signal intensity of the ROI, i.e., to normalize the 23Na MRI signal intensities of the mouse's kidney.
To confirm the formation of the sodium concentration gradient along the axis of the cortex to the medulla, four points at equal intervals were set on the axis and the signal intensity was measured. The sodium gradient was correlated using a linear fit.
The TSC of the ROI over the kidney was calculated by comparing the average signal intensity of the ROI over the kidney with the average signal intensity of the ROI over the saline, corrected by the sodium concentration of the saline18:
Statistical Analyses
All data were presented as mean±SD. We selected nonparametric tests because of the small sample number. The 23Na MRI data with furosemide administration were analyzed using the two-tailed Wilcoxon signed-rank test. Profiles and 23Na MRI data comparing m+/m+ with db/db mice were analyzed using the two-tailed Mann-Whitney U test. Four points were set at equal intervals along the corticomedullary axis, and the average of the TSC values at each point was measured in five C57BL/6JJcl mice. The fit and confidence level of significance were calculated on the basis of these results and set at P < 0.05. All statistical analyses were performed using EZR version 4.0.3 (Saitama Medical Center, Jichi Medical University, Saitama, Japan).19
Results
Relationship between Sodium Concentrations of Saline Solutions and 23Na MRI Signal Intensities
23Na MRI signal intensities were compared with the sodium concentrations of saline solutions, and a linear relationship was observed (R2=0.9902; Figure 2). Thus, 23Na MRI accurately reflected sodium concentrations.
Figure 2.
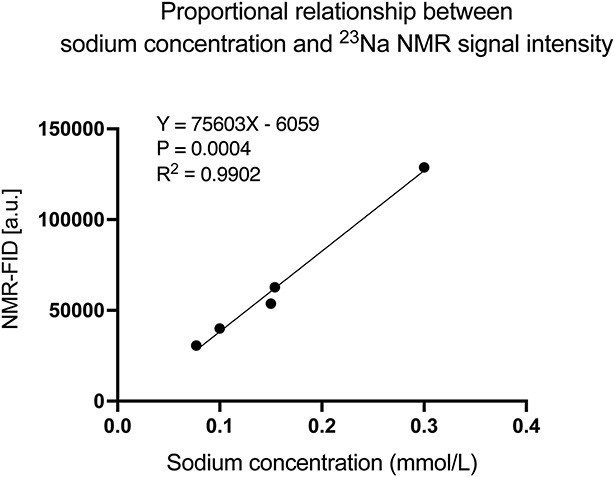
Relationship between sodium concentration and signal intensity. The sodium concentration and signal intensity are proportional, indicating that the signal intensity accurately reflects the sodium concentration. a.u., arbitrary unit; NMR-FID, nuclear magnetic resonance-free induction decay.
Kidney 23Na MR Images Merged with 1H MR Images
The 23Na MR images were successfully merged with the 1H MR images (C57BL/6JJcl mice, N=5). The average sodium signal intensities plotted at four equal intervals along the axis from the cortex to the medulla were 78.2, 123, 206.3, and 279.1 mmol/L, respectively, and showed a linear increase (R2=0.99; Figure 3).
Figure 3.
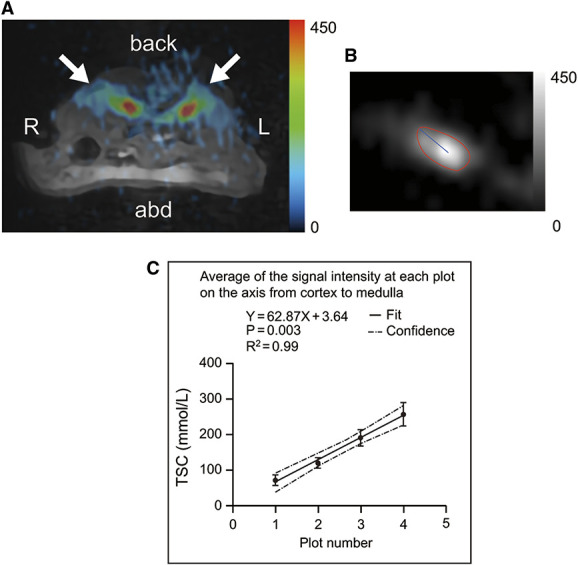
Sodium magnetic resonance imaging of a murine kidney. (A) 23Na MR images merged with 1H MR images (C57BL/6JJcl mice, 6 weeks old, male). This image shows the transverse plane through the abdomen. Arrows indicate the kidneys. (B) 23Na MR image showing the kidney area and the axis from the cortex to the medulla. (C) TSC values at equidistant points along the axis from the cortex to the medulla (C57BL/6JJcl mice, 6 weeks old, male, N=5). 1H, proton; 23Na, sodium; abd, abdomen; L, left; MR, magnetic resonance; R, right; TSC, tissue sodium concentration.
Decreased 23Na Signal Intensity of the Kidney under Deep Anesthesia
Deep anesthesia was induced after administering 3.5% isoflurane, which was increased during the interval between breaths. The respiratory rate was 120 breaths per min at 1.5% isoflurane and decreased to 12 breaths per min at 3.5% isoflurane. The signal intensity of the kidney in 23Na MR images decreased with deep anesthesia (Figure 4).
Figure 4.

Changes in sodium magnetic resonance imaging signals of a murine kidney under deep anesthesia (C57BL/6JJcl mouse, 6 weeks old, male). MR images of the transverse plane through the abdomen. Arrows indicate the kidneys. (A) 23Na MR images at 1.5% isoflurane concentration. (B) 23Na MR images at 3.5% isoflurane concentration. abd, abdomen; L, left; MR, magnetic resonance; 23Na, sodium; R, right.
The Sodium Concentration of the Medulla is Reduced after Furosemide Administration
Administration of furosemide, an NKCC2 inhibitor involved in the formation of the countercurrent multiplication system, reduced the 23Na MRI signal intensity of the medulla (Figure 5). The corticomedullary signal gradients before and 20 minutes after furosemide administration were 2.19±0.3 and 1.53±0.16, respectively (P < 0.05, N=7). The initial TSC values were 129.3±12.5 mmol/L in the cortex and 281.2±28.4 mmol/L in the medulla, and 20 minutes after furosemide administration, these were 93.3±11.7 and 141.1±9.3 mmol/L in the cortex and medulla, respectively. The TSC values in the medulla and the sodium concentration gradients from the medulla to the cortex were significantly decreased after furosemide administration (P < 0.05).
Figure 5.
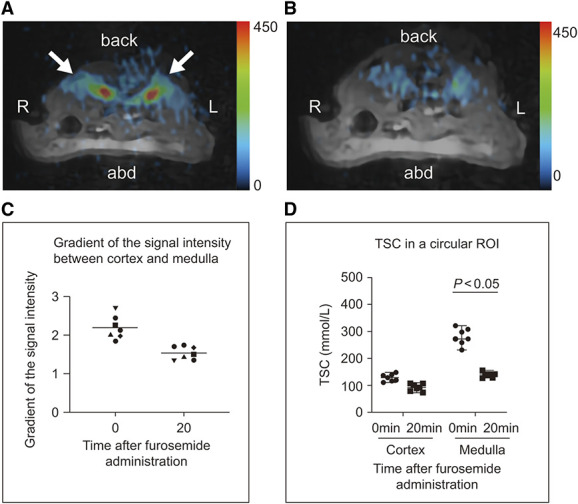
Images of the kidney before and after furosemide administration (C57BL/6JJcl mice, 6 weeks old, male, N=7). (A, B) MR images of the transverse plane through the abdomen. Arrows indicate the kidneys. 23Na MR image merged with the 1H MR image before (A) and 20 minutes after (B) furosemide administration (10 mg/kg body weight). (C) The gradient of the signal intensity between the cortex and the medulla before (0 minute) and after (20 minutes) furosemide administration. (D) TSC values of the cortex and medulla in a circular ROI before (0 minute) and after (20 minutes) furosemide administration. 1H, proton; 23Na, sodium; a.u., arbitrary unit; abd, abdomen; L, left; MR, magnetic resonance; R, right; ROI, region of interest; TSC, tissue sodium concentration.
Profiles of db/db and m+/m+ Mice
The average weight of db/db mice was higher than that of m+/m+ mice (Table 1). In addition, serum glucose concentration, serum osmotic pressure, the albumin-creatinine ratio, and urinary glucose concentration were significantly increased in db/db mice. Renal tissue changes were not observed (Figure 6).
Table 1.
Profiles of BKS.Cg-m+/m+/Jcl mice and BKS.Cg-Leprdb+/+ Leprdb/Jcl mice (N=7 each)
| Parameters | m+/m+ | db/db | P Value | |
|---|---|---|---|---|
| Body weight (g) | 19.4±0.4 | 30.0±0.9 | <0.01 | |
| Serum | Na (mEq/L) | 157±1.2 | 155±1.9 | 0.17 |
| Glucose (mg/dl) | 211±33 | 449±104 | <0.01 | |
| Glycated albumin (%) | 2.81±0.4 | 3.74±0.9 | 0.05 | |
| Creatinine (mg/dl) | 0.11±0.014 | 0.12±0.012 | 0.242 | |
| Osmotic pressure (mOsm/KgH2O) | 333±7 | 348±7 | 0.01 | |
| Urine | Na (mEq/L) | 133±39 | 123±44 | 0.81 |
| Glucose (mg/dl) | 34.1±10 | 3034±2946 | <0.01 | |
| ACR (μg/mg) | 82.3±16 | 404±158 | <0.01 | |
| Osmotic pressure (mOsm/KgH2O) | 1610±382 | 1961±427 | 0.17 |
m+/m+, BKS.Cg-m+/m+/Jcl mice; db/db, BKS.Cg-Leprdb+/+ Leprdb/Jcl mice; ACR, albumin creatinine ratio.
Figure 6.
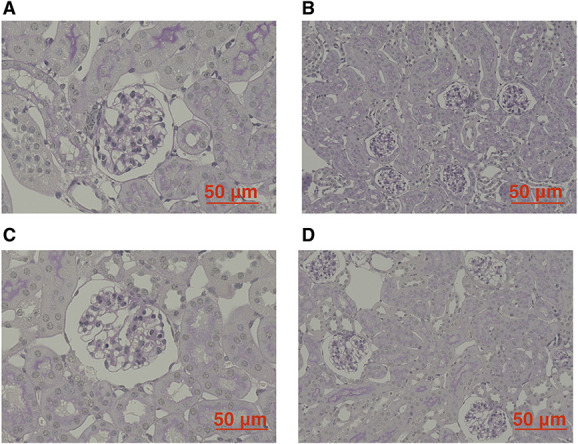
Renal histology of m+/m+ (BKS.Cg-m+/m+/Jcl) and db/db (BKS.Cg-Leprdb+/+ Leprdb/Jcl) mice. Microscopic image of an m+/m+mouse (A, B) and of a db/db mouse (C, D).
Decreased Sodium Concentration in the Medulla of db/db Mice
The signal intensity of the medullary region in the kidney was lower in db/db mice than in m+/m+ mice (N=7 each; Figure 7). The sodium concentration gradients from the medulla to the cortex of m+/m+ and db/db mice were 2.28±0.21 and 1.64±0.36, respectively (P < 0.01). The TSC values of m+/m+ mice were 146.0±50.3 mmol/L in the cortex and 333.5±54.4 mmol/L in the medulla, whereas in db/db mice, these values were 135.8±16.4 and 209.6±42.4 mmol/L, respectively. The TSC values of the medulla were significantly lower in db/db mice compared with m+/m+ mice (P < 0.01). In addition, there was no difference in intrarenal sodium between female and male diabetic mice.
Figure 7.
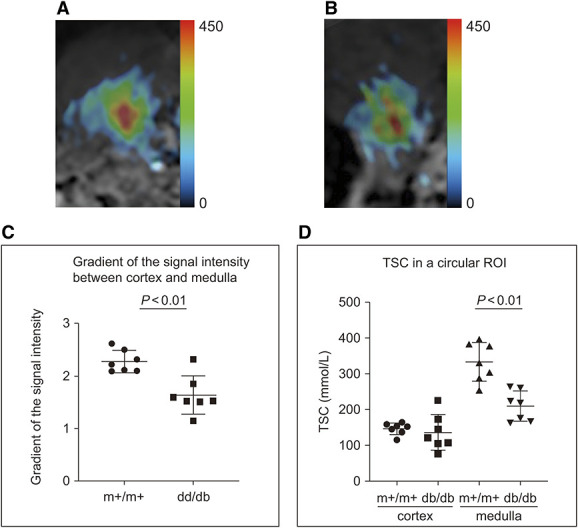
Kidney sodium magnetic resonance images of m+/m+ (BKS.Cg-m+/m+/Jcl) and db/db (BKS.Cg-Leprdb+/+ Leprdb/Jcl) mice (N=7 each). (A, B) 23Na MR image merged with the 1H MR image of the right kidney in an m+/m+mouse (A) and a db/db mouse (B). (C) The signal intensity gradients from the cortex to the medulla in m+/m+ and db/db mice. (D) TSC values of the cortex and medulla in a circular ROI in m+/m+ and db/db mice. 1H, proton; 23Na, sodium; a.u., arbitrary unit; db/db, BKS.Cg-Leprdb+/+ Leprdb/Jcl mice; m+/m+, BKS.Cg-m+/m+/Jcl mice; MR, magnetic resonance; ROI, region of interest; TSC, tissue sodium concentration.
Discussion
We demonstrated in vivo imaging of sodium concentrations in mouse kidneys with merged 23Na MR and 1H MR images. Deep anesthesia—administered to the extent where the interval between breaths widened—decreased the 23Na MRI signal intensity of the kidney. Likewise, furosemide administration decreased the signal intensity of the medulla. In db/db mice, the sodium concentration gradient from the cortex to the medulla significantly decreased compared with that in m+/m+ mice.
Images acquired under deep anesthesia did not show a distinct high-intensity area in the medulla, possibly because of breakdown of the countercurrent multiplication system. This phenomenon proves that the 23Na signal intensity in the medulla is related to the function and not the structure of the kidney. Administration of furosemide also led to decreased intensity in the medulla. Maril et al. reported that administration of furosemide significantly decreased the signal intensity of sodium in the medulla and as a result, decreased the sodium concentration gradient from the cortex to the medulla.12 Our results were similar to their findings. According to Maril et al., the sodium concentrations in the cortex and medulla of rats were 60 and 360 mmol/L, respectively.11 In our study, sodium concentrations in the cortex and medulla of mice were 123 and 310 mmol/L, respectively. This small discrepancy may be attributable to species differences between rats and mice, breeding environment, or MR device sensitivities. However, our study was the first to measure the sodium concentrations in the cortex and medulla of mice.
We also determined the sodium concentrations in the cortex and medulla of db/db mice, a mouse model with diabetes mellitus, and were the first to report decreased sodium concentrations in the medulla of 6-week-old db/db mice. According to a previous report, the glomeruli of db/db mice were not distinguishable when compared with those of non-diabetic mice and tubular atrophy was largely absent in the db/db mouse kidney before 16 weeks of age.20 db/db Mice develop renal glomerular lesions with mesangial matrix accumulation by the age of 16 weeks and demonstrate a decrease in creatinine clearance at 15 weeks.21 In our study, there was no difference in the creatinine levels and no changes were observed in renal tissue. It is possible that the countercurrent multiplication system in db/db mice is functionally impaired before pathological changes occur or serum creatinine clearance declines. Although the exact mechanism has not been determined, prior studies provide possible explanations for the change in countercurrent multiplication in diabetes mellitus. First, sodium reabsorption in the proximal tubule is increased in diabetes mellitus22–24 in part because of increased renal sodium-glucose cotransporter 2 expression and sodium-glucose cotransporter activity,25 and as a result, less sodium is provided to the loop of Henle. Second, water reabsorption is blunted by osmotic diuresis in diabetic mellitus. Finally, on the basis of single-cell RNA sequencing of human diabetic nephropathy samples, Wilson et al. demonstrated that the WNK1 gene and its downstream effector, STK39, which regulate NKCC2, have reduced expression levels, and this is expected to reduce the activity of NKCC2 and impair transcellular sodium reabsorption.26
Early diagnosis of diabetic kidney disease (DKD) can prevent the progression of renal damage and normalize urine disturbances. The gold-standard test for predicting the development of DKD is albuminuria. However, detecting albuminuria alone lacks sensitivity and specificity in end stage renal failure with a decreased estimated glomerular filtration rate.27 Approximately 20% of patients with type 2 diabetes develop at least stage 3 chronic kidney disease after remaining normoalbuminuric,28 and 51% of patients with type 2 diabetes who developed renal impairments (Cockcroft-Gault estimated creatinine clearance <60 ml/min or doubling of plasma creatinine) did not have preceding albuminuria.29 In type 1 diabetes, approximately only one-third of patients with microalbuminuria developed renal function decline.30 Because 23Na MRI can detect functional changes in the diabetic kidney, it may be useful as a complementary test for detecting albuminuria.
Different blood and urine markers have been proposed to reflect kidney function. Our findings suggest that the diagnostic value of 23Na MRI is similar to that of these proposed markers. The MR image visualizing renal sodium control has the advantage of solely reflecting the functionality of post-glomerular structures, such as the tubules and collecting ducts, completely distinct from the functionality of the glomerulus.
In addition, because natriuresis by diuretics is influenced by forming of the countercurrent multiplication, 23Na MRI may be useful in revealing the status of diuretic resistance. Moreover, because the impairment of the countercurrent multiplication system is primarily caused by retarded sodium reabsorption, 23Na MRI may alert the clinician to the risk of hyponatremia in diabetic mellitus in advance. Thus, beyond the marker that detects DKD, there is more value in 23Na MRI that can evaluate functions that are not a mere marker, such as albuminuria. Moreover, 23Na-MRI has the potential to diagnose or elucidate the mechanisms of diseases, including primary aldosteronism, nephrotic syndrome, and drug-induced kidney impairment.
Grist et al. reported an application of 23Na MRI in humans.13 They quantified the corticomedullary sodium gradient in the human kidney with 23Na MRI and proposed protocols and methodologies for expanding the practical use of 23Na MRI.31–33 Moreover, we have already proved that the methodology of 23Na MRI is applicable in clinical situations.34
Our study has some limitations. First, this study was performed with a small number of mice (N=7 per group). However, the sample sizes were calculated on the basis of the findings of a previous study.12 Second, only the right side of the kidney of m+/m+ and db/db mice were imaged because the bodies of db/db mice were much larger than those of the control mice. Third, it is possible that the difference in distance between the reference saline solution and the place of sodium measurement within the kidneys may influence the value of signal intensity. The ratio of the signal value of the medulla and cortex is meaningful in ruling out this effect. Fourth, because our MRI device was self-made, the imaging method differed from that of other MRI devices. However, our results demonstrated accurate measurement of sodium concentrations with the self-made device. Furthermore, our device enabled fine-tuning, such as fitting the 23Na surface coil to the size of the mouse. Fifth, although we determined the cortex and medulla on the basis of the positional relationship in the 1H images, as described in a previous study,8 strict differentiation requires high-definition imaging conditions that depict the arcuate artery. Sixth, our findings can be explained by changes in the countercurrent multiplication system, but the possibility of other factors, such as interstitial Na+ that has charge interactions with the glycocalyx, cannot be ruled out. High-definition imaging conditions are also required. Finally, this study was limited to db/db mice as a disease model. Other diabetic mouse models need to be evaluated. It is also uncertain whether patients with diabetes mellitus present findings similar to those observed in db/db mice. Further studies in humans are needed.
In conclusion, 23Na MRI revealed reductions in the sodium concentration in the medulla and in the sodium gradient from the cortex to the medulla in db/db mice at very early diabetes mellitus stages. The kidneys of 6-week-old db/db mice demonstrated impairment in the countercurrent multiplication system. We propose the utility of 23Na MRI for the evaluation of functional changes in DKD and not as a marker that reflects structural damage. Thus, 23Na MRI may be possible to be a very early marker beyond the glomerulus, enabling prompt intervention with novel efficacious therapy that targets the tubules.
Acknowledgments
The funding agencies had no role in study design; in collection, analysis, and interpretation of data; in writing of the report; and in the decision to submit the article for publication. Portions of this article were presented as an abstract at ASN Kidney Week 2022.
Footnotes
See related editorial, “Beyond the Protons—Sodium MR Imaging Provides New Kidney Insights,” on pages 569–571.
Disclosures
T. Haishi reports the following: Employer: MRTechnology Inc., Japan; Consultancy: MRTechnology Inc., Japan; Ownership Interest: MRTechnology Inc., Japan; Honoraria: MRTechnology Inc., Japan; Patents or Royalties: MRTechnology Inc., Japan; Advisory or Leadership Role: MRTechnology Inc., Japan; and Other Interests or Relationships: Japan Agency for Medical Research and Development. Y. Kaneko reports the following: Research Funding: Ono Pharmaceutical Co., Ltd.; and Patents or Royalties: Momenta Pharmaceuticals, Inc. I. Narita reports the following: Research Funding: Chugai Pharmaceutical, Daiichi-Sankyo, Kyowa-Kirin, Otsuka Pharmaceutical, Sanwa Kagaku Kenkyusho, Sumitomo Pharma, and Terumo; and Honoraria: AstraZeneca, Bayer, Kyowa-Kirin, Otsuka, and Sanofi. S. Yamamoto reports the following: Employer: Niigata University Medical and Dental Hospital; Research Funding: Toray Medical Co., Ltd, and Kaneka Medix Co., Ltd; Honoraria: Kyowa Kirin Co.; and Other Interests or Relationships: A study was conducted through a collaboration between Niigata University and Kaneka Medix Co., Ltd. All remaining authors have nothing to disclose.
Funding
T. Haishi is employed by and has an advisory role in MR Technology Inc. S. Sasaki, I. Narita, and T. Haishi received funding from the Japan Agency for Medical Research and Development (AMED) (grant number JP20hm0102062). R. Kaseda received funding in the form of Grant-in-Aid for Scientific Research for Scientific Research C from the Ministry of Education, Culture, Sports, Science and Technology of Japan (grant number JP20K08586).
Author Contributions
Conceptualization: Ryohei Kaseda, Yusuke Nakagawa, Ichiei Narita.
Data analysis: Ryohei Kaseda, Yusuke Nakagawa.
Data acquisition: Tomoyuki Haishi, Yasuhiko Terada.
Interpretation: Shin Goto, Tomoyuki Haishi, Yoshikatsu Kaneko, Ryohei Kaseda, Yusuke Nakagawa, Tadashi Otsuka, Yuya Suzuki, Hirofumi Watanabe, Yasuhiko Terada, Suguru Yamamoto.
Supervision: Ichiei Narita, Susumu Sasaki.
Writing – original draft: Ryohei Kaseda, Yusuke Nakagawa.
Writing – review & editing: Shin Goto, Tomoyuki Haishi, Yoshikatsu Kaneko, Ryohei Kaseda, Yusuke Nakagawa, Ichiei Narita, Tadashi Otsuka, Susumu Sasaki, Yuya Suzuki, Yasuhiko Terada, Hirofumi Watanabe, Suguru Yamamoto.
Data Sharing Statement
The data that support the findings of this study are available from the corresponding author, R. Kaseda, on reasonable request.
References
- 1.Jamison RL, Maffly RH. The urinary concentrating mechanism. N Engl J Med. 1976;295(19):1059–1067. doi: 10.1056/nejm197611042951908 [DOI] [PubMed] [Google Scholar]
- 2.Greger R. Physiology of renal sodium transport. Am J Med Sci. 2000;319(1):51–62. doi: 10.1016/s0002-9629(15)40679-2 [DOI] [PubMed] [Google Scholar]
- 3.Palmer LG, Schnermann J. Integrated control of Na transport along the nephron. Clin J Am Soc Nephrol. 2015;10(4):676–687. doi: 10.2215/CJN.12391213 [DOI] [PMC free article] [PubMed] [Google Scholar]
- 4.Ares GR, Caceres PS, Ortiz PA. Molecular regulation of NKCC2 in the thick ascending limb. Am J Physiol Ren Physiol. 2011;301(6):F1143–F1159. doi: 10.1152/ajprenal.00396.2011 [DOI] [PMC free article] [PubMed] [Google Scholar]
- 5.Bogusky RT, Garwood M, Matson GB, Acosta G, Cowgill LD, Schleich T. Localization of phosphorus metabolites and sodium ions in the rat kidney. Magn Reson Med. 1986;3(2):251–261. doi: 10.1002/mrm.1910030208 [DOI] [PubMed] [Google Scholar]
- 6.Hammon M, Grossmann S, Linz P, Seuss H, Hammon R, Rosenhauer D. 3 tesla 23Na magnetic resonance imaging during acute kidney injury. Acad Radiol. 2017;24(9):1086–1093. doi: 10.1016/j.acra.2017.03.012 [DOI] [PubMed] [Google Scholar]
- 7.Zöllner FG, Konstandin S, Lommen J, Budjan J, Schoenberg SO, Schad LR. Quantitative sodium MRI of kidney. NMR Biomed. 2016;29(2):197–205. doi: 10.1002/nbm.3274 [DOI] [PubMed] [Google Scholar]
- 8.Maril N, Rosen Y, Reynolds GH, Ivanishev A, Ngo L, Lenkinski RE. Sodium MRI of the human kidney at 3 tesla. Magn Reson Med. 2006;56(6):1229–1234. doi: 10.1002/mrm.21031 [DOI] [PubMed] [Google Scholar]
- 9.Neuberger T, Greiser A, Nahrendorf M, Jakob PM, Faber C, Webb AG. 23Na microscopy of the mouse heart in vivo using density-weighted chemical shift imaging. Magma. 2004;17(3-6):196–200. doi: 10.1007/s10334-004-0048-6 [DOI] [PubMed] [Google Scholar]
- 10.Lim S-I, Woo C-W, Kim S-T, Choe B-Y, Woo D-C. Radiofrequency coil design for in vivo sodium magnetic resonance imaging of mouse kidney at 9.4T. Investig Magn Reson Imaging. 2018;22(1):65–70. doi: 10.13104/imri.2018.22.1.65 [DOI] [Google Scholar]
- 11.Maril N, Margalit R, Mispelter J, Degani H. Functional sodium magnetic resonance imaging of the intact rat kidney. Kidney Int. 2004;65(3):927–935. doi: 10.1111/j.1523-1755.2004.00475.x [DOI] [PubMed] [Google Scholar]
- 12.Maril N, Margalit R, Mispelter J, Degani H. Sodium magnetic resonance imaging of diuresis: spatial and kinetic response. Magn Reson Med. 2005;53(3):545–552. doi: 10.1002/mrm.20359 [DOI] [PubMed] [Google Scholar]
- 13.Maril N, Margalit R, Rosen S, Heyman SN, Degani H. Detection of evolving acute tubular necrosis with renal 23Na MRI: studies in rats. Kidney Int. 2006;69(4):765–768. doi: 10.1038/sj.ki.5000152 [DOI] [PubMed] [Google Scholar]
- 14.Liu H, Zhou D, Garcia ML, Kohler MG, Shen X, Williams DS. Characteristic time courses of cortical and medullary sodium signals measured by noninvasive 23Na-MRI in rat kidney induced by furosemide. J Magn Reson Imaging. 2015;41(6):1622–1628. doi: 10.1002/jmri.24732 [DOI] [PubMed] [Google Scholar]
- 15.Grist JT, Riemer F, Hansen ESS, Tougaard RS, McLean MA, Kaggie J. Visualization of sodium dynamics in the kidney by magnetic resonance imaging in a multi-site study. Kidney Int. 2020;98(5):1174–1178. doi: 10.1016/j.kint.2020.04.056 [DOI] [PMC free article] [PubMed] [Google Scholar]
- 16.Kopp C, Linz P, Wachsmuth L, Dahlmann A, Horbach T, Schöfl C. 23Na magnetic resonance imaging of tissue sodium. Hypertension. 2012;59(1):167–172. doi: 10.1161/hypertensionaha.111.183517 [DOI] [PubMed] [Google Scholar]
- 17.Kopp C, Linz P, Maier C, Wabel P, Hammon M, Nagel AM. Elevated tissue sodium deposition in patients with type 2 diabetes on hemodialysis detected by 23Na magnetic resonance imaging. Kidney Int. 2018;93(5):1191–1197. doi: 10.1016/j.kint.2017.11.021 [DOI] [PubMed] [Google Scholar]
- 18.Constantinides CD, Kraitchman DL, O’Brien KO, Boada FE, Gillen J, Bottomley PA. Noninvasive quantification of total sodium concentrations in acute reperfused myocardial infarction using 23Na MRI. Magn Reson Med. 2001;46(6):1144–1151. doi: 10.1002/mrm.1311 [DOI] [PubMed] [Google Scholar]
- 19.Kanda Y. Investigation of the freely available easy-to-use software “EZR” for medical statistics. Bone Marrow Transplant. 2013;48(3):452–458. doi: 10.1038/bmt.2012.244 [DOI] [PMC free article] [PubMed] [Google Scholar]
- 20.Sharma K, McCue P, Dunn SR. Diabetic kidney disease in the db/db mouse. Am J Physiol Ren Physiol. 2003;284(6):F1138–F1144. doi: 10.1152/ajprenal.00315.2002 [DOI] [PubMed] [Google Scholar]
- 21.Cohen MP, Clements RS, Hud E, Cohen JA, Ziyadeh FN. Evolution of renal function abnormalities in the db/db mouse that parallels the development of human diabetic nephropathy. Exp Nephrol. 1996;4(3):166–171. [PubMed] [Google Scholar]
- 22.Vallon V, Blantz RC, Thomson S. Homeostatic efficiency of tubuloglomerular feedback is reduced in established diabetes mellitus in rats. Am J Physiol. 1995;269(6):F876–F883. doi: 10.1152/ajprenal.1995.269.6.f876 [DOI] [PubMed] [Google Scholar]
- 23.Vallon V, Richter K, Blantz RC, Thomson S, Osswald H. Glomerular hyperfiltration in experimental diabetes mellitus: potential role of tubular reabsorption. J Am Soc Nephrol. 1999;10(12):2569–2576. doi: 10.1681/ASN.v10122569 [DOI] [PubMed] [Google Scholar]
- 24.Vallon V, Komers R. Pathophysiology of the diabetic kidney. Compr Physiol. 2011;1(3):1175–1232. doi: 10.1002/cphy.c100049 [DOI] [PMC free article] [PubMed] [Google Scholar]
- 25.Chichger H, Cleasby ME, Srai SK, Unwin RJ, Debnam ES, Marks J. Experimental type II diabetes and related models of impaired glucose metabolism differentially regulate glucose transporters at the proximal tubule brush border membrane. Exp Physiol. 2016;101(6):731–742. doi: 10.1113/ep085670 [DOI] [PubMed] [Google Scholar]
- 26.Wilson PC, Wu H, Kirita Y, Uchimura K, Ledru N, Rennke HG. The single-cell transcriptomic landscape of early human diabetic nephropathy. Proc Natl Acad Sci U S A. 2019;116(39):19619–19625. doi: 10.1073/pnas.1908706116 [DOI] [PMC free article] [PubMed] [Google Scholar]
- 27.Colhoun HM, Marcovecchio ML. Biomarkers of diabetic kidney disease. Diabetologia. 2018;61(5):996–1011. doi: 10.1007/s00125-018-4567-5 [DOI] [PMC free article] [PubMed] [Google Scholar]
- 28.MacIsaac RJ, Jerums G. Diabetic kidney disease with and without albuminuria. Curr Opin Nephrol Hypertens. 2011;20(3):246–257. doi: 10.1097/mnh.0b013e3283456546 [DOI] [PubMed] [Google Scholar]
- 29.Retnakaran R, Cull CA, Thorne KI, Adler AI, Holman RR; UKPDS Study Group. Risk factors for renal dysfunction in type 2 diabetes: U.K. Prospective Diabetes Study 74. Diabetes. 2006;55(6):1832–1839. doi: 10.2337/db05-1620 [DOI] [PubMed] [Google Scholar]
- 30.Krolewski AS. Progressive renal decline: the new paradigm of diabetic nephropathy in type 1 diabetes. Diabetes Care. 2015;38(6):954–962. doi: 10.2337/dc15-0184 [DOI] [PMC free article] [PubMed] [Google Scholar]
- 31.Grist JT, Hansen ES, Zöllner FG, Laustsen C. Sodium (23Na) MRI of the kidney: experimental protocol. Methods Mol Biol. 2021;2216:473–480. doi: 10.1007/978-1-0716-0978-1_28 [DOI] [PMC free article] [PubMed] [Google Scholar]
- 32.Grist JT, Hansen ES, Zöllner FG, Laustsen C. Sodium (23Na) MRI of the kidney: basic concept. Methods Mol Biol. 2021;2216:257–266. doi: 10.1007/978-1-0716-0978-1_15 [DOI] [PMC free article] [PubMed] [Google Scholar]
- 33.Grist JT, Hansen ESS, Zöllner FG, Laustsen C. Analysis protocol for renal sodium (23Na) MR imaging. Methods Mol Biol. 2021;2216:689–696. doi: 10.1007/978-1-0716-0978-1_41 [DOI] [PMC free article] [PubMed] [Google Scholar]
- 34.Kajiwara M, Haishi T, Prananto D, Sasaki S, Kaseda R, Narita I. Development of an add-on (23)Na-MRI radiofrequency platform for a (1)H-MRI system using a crossband repeater: proof-of-concept. Magn Reson Med Sci. 2023;22(1):103–115. doi: 10.2463/mrms.tn.2021-0094 [DOI] [PMC free article] [PubMed] [Google Scholar]
Associated Data
This section collects any data citations, data availability statements, or supplementary materials included in this article.
Data Availability Statement
The data that support the findings of this study are available from the corresponding author, R. Kaseda, on reasonable request.


